Introduction
Breast cancer has overtaken lung cancer as the most
common type of cancer in women, with an estimated 2.3 million new
cases in 2020, according to the latest cancer statistics report
(1). Triple-negative breast cancer
(TNBC) is a breast cancer subtype. Patients with TNBC exhibit a
shorter median time to relapse and death, due to the lack of
effective treatment targets. This lack of specific therapies is the
leading cause of recurrence and mortality in patients with TNBC,
alongside treatment resistance (2).
In addition to surgical treatment, chemotherapy remains the main
systematic treatment for breast cancer (3). Although several large randomized
controlled trials have been conducted to explore novel treatment
options for TNBC, such as programmed death ligand 1, a biomarker
that has been included in the National Comprehensive Cancer Network
(NCCN) guidelines (4), the results
have been unsatisfactory. To date, taxanes remain the primary
chemotherapy option for patients with TNBC in the clinic, as
current international guidelines support the use of a single taxane
and/or anthracyclines as first-line treatment (5,6).
Chemotherapy resistance and the lack of TNBC-targeted therapies
lead to poor patient prognosis (7).
Multiple studies have demonstrated that the
pathologic complete response (pCR) rate of TNBC to neoadjuvant
chemotherapy (NAC) is superior to that of non-TNBC subtypes
(8,9)
by up to 37.8% (10). NAC can not
only lead to a reduction in the stage and shrinking of the breast
tumor but also detect the sensitivity of the tumor to chemotherapy
regimens. In early-stage breast cancer, the association between pCR
rate and long-term survival is most obvious in patients with TNBC
(4). The search for
chemotherapy-sensitive markers and ways to overcome tumor
resistance in TNBC are current research foci.
Cancer testis antigens (CTAs) are genes named after
their expression patterns, since they are usually expressed only in
the testes, where they play important roles in homologous
chromosome recombination during meiosis, but also exhibit an
abnormally high expression in a variety of malignant tumors
(11). HORMA domain-containing
protein 1 (HORMAD1; also referred to as CT46) is a CTA normally
expressed in the testes, which has also been revealed to be
expressed in female gametes and to have important physiological
functions (12), with abnormally high
levels in TNBC (13,14). It has been indicated that HORMAD1
plays an important carcinogenic role in basal-like breast cancer
(BLBC) (14) and it may induce a
spontaneous antibody response in patients with cancer, due to its
immunogenic properties (13).
Meanwhile, several basic research studies have indicated that
HORMAD1 can reduce or enhance the susceptibility of different
tumors to docetaxel (Doc) and poly-ADP-ribose polymerase I
inhibitor (PARPi) in different types of cancer (15–17).
Therefore, in the present study, the association between the
aberrant expression of HORMAD1 in tumors and the
clinicopathological characteristics of patients was explored, and
certain abnormal biological behaviors caused by the aberrantly high
expression of HORMAD1 in tumor cells and its influence on the
tolerance to common chemotherapy drugs were studied through a
series of functional experiments, with the aim of providing
evidence to support drug treatment choice for patients with TNBC
and explore a new therapeutic target for TNBC.
Materials and methods
Bioinformatic methods and data
analysis
Data derived from 1,208 breast cancer samples were
downloaded from The Cancer Genome Atlas (TCGA) database (https://cancergenome.nih.gov). A detailed analysis of
HORMAD1 expression was conducted as previously described (18). Gene expression data in breast cancer
cell lines were obtained from the Broad Institute Cell Cancer Line
Encyclopedia (CCLE; http://portals.broadinstitute.org/ccle).
TNBC samples
This study was a retrospective analysis. A total of
640 TNBC samples were obtained at the time of diagnosis at The
First Affiliated Hospital of Chongqing Medical University between
November 2013 and August 2018. Data from patients (20–76 years old)
with TNBC with complete treatment records, who had undergone NAC
combined with surgical treatment and subsequent chemotherapy, were
selected. The exclusion criteria for all participants were as
follows: i) Patients who achieved pCR after NAC; and ii) patients
with previous cancer, concomitant cancer or bilateral breast
cancer. Written informed consent was obtained from all patients and
the study was approved (approval no. 2020-279) by the Ethics
Committee of the First Affiliated Hospital of Chongqing Medical
University (Chongqing, China). Tumor size was measured by B-mode
ultrasound image or X-ray mammography. Response to chemotherapy was
assessed according to RECIST 1.1 (19), to determine whether the patient had
achieved pCR. All postoperative chemotherapy cycles were completed,
and imaging re-examination was conducted regularly.
Immunohistochemical quantification of
TNBC tissue samples
HORMAD1 expression levels and tumor infiltrating
lymphocyte (TIL) numbers in TNBC samples were investigated using
4-µm thick tissue sections cut from paraffin wax-embedded specimens
preserved by the Department of Pathology (First Affiliated Hospital
of Chongqing Medical University). According to standard
immunohistochemical operating procedures, sections were boiled at
100°C for 3 min for antigen retrieval in 0.01 M citric acid buffer
(pH 6.0) and quenched for endogenous peroxidase activity with 0.3%
H2O2 solution for 15 min. The samples were
then blocked for non-specific binding with 10% normal goat serum at
room temperature for 15 min and incubated with specific rabbit
primary antibody against HORMAD1 (1:500; cat. no. HPA037850; Merck
KGaA) overnight at 4°C. Subsequently, sections were treated with
goat anti-rabbit secondary antibody (1:200, cat. no. PV-9000;
Beijing Zhongshan Golden Bridge Biotechnology Co., Ltd.; OriGene
Technologies, Inc.) for 30 min at room temperature. Following
staining with diaminobenzidine (cat. no. ZLI-9018; Beijing
Zhongshan Golden Bridge Biotechnology Co., Ltd.; OriGene
Technologies, Inc.) at room temperature for 10–60 sec,
representative images were captured using a Nikon Eclipse 80i light
microscope (×200 magnification; Nikon Corporation). Each section
was semi-quantified by a professional pathologist using a relative
scale (13).
Cell lines
The MCF7, T47D, ZR75-1, SK-BR-3, MDA-MB-231,
MDA-MB-436, BT549 and MDA-MB-468 human breast cancer cell lines
were purchased from the American Type Culture Collection and
cultured in DMEM (Thermo Fisher Scientific, Inc.) containing 10%
fetal calf serum (Thermo Fisher Scientific, Inc.), 4.5 g/l
D-glucose, L-glutamine and 110 mg/l sodium pyruvate in a humidified
incubator with 5% CO2 at 37°C. The medium was refreshed
every 2–3 days. Subsequently, transfection experiments were
performed.
HORMAD1 knockdown and
overexpression
Cells were plated in six-well plates and transfected
with specific small interfering RNAs (siRNAs) using LipoFiter™
Liposomal Transfection reagent (Hanbio Biotechnology Co., Ltd.),
according to the manufacturer's instructions. Specific siRNA
sequences were screened out from multiple candidate siRNA molecules
and the sequences of the siRNAs (100 pM) used were as follows:
siRNA-negative control (NC) sense, 5′-UUCUCCGAACGUGUCACGUTT-3′ and
antisense, 5′-ACGUGACACGUUCGGAGAATT-3′; HORMAD1-siRNA1
(si-HORMAD1#1 sense, 5′-CCAUGAGUGCACUGGUAUUTT-3′ and antisense,
5′-AAUACCAGUGCACUCAUGGTT-3′) equal to si-HORMAD1 (si-HORMAD1#2
sense, 5′-GCAUUCUCCUCAUUCGCAATT-3′ and antisense,
5′-UUGCGAAUGAGGAGAGUGCTT-3′). All siRNA oligomers were purchased
from Shanghai GenePharma Co., Ltd. A lentiviral vector
(hU6-MCS-Ubiquitin-EGFP-IRES-puromycin; 1×10⁸ TU/ml;
MOI=10) including the same siRNA sequence was purchased from
GeneChem, Inc., as certain experiments required that the knockout
efficiency be maintained over a long period of time. Experiments
were performed following transfection at 37°C for 72–96 h.
HORMAD1-overexpressing plasmid (1 µg/ml) was constructed at
Chongqing City Key Lab of Translational Medical Research in
Cognitive Development and Disorders (Children's Hospital of
Chongqing Medical University, Chongqing, China) using the following
primers: Forward,
5′TAAGCTTGGTACCGAGCTCGGATCCGCCACCATGGCCACTGCCCAGTTG-3′ and reverse,
5′ACGGGCCCTCTAGACTCGAGTTATATATGTTCCTTTGGTTCACTAAACTTTCTCCTTTTTGG-3′.
The pcDNA3.1 plasmid (1 µg/ml) was kindly provided by Dr Shipeng
Guo and used as the vector to clone HORMAD1. Experiments were
performed following transfection at 37°C for 24–48 h, as
indicated.
RNA isolation and reverse
transcription-quantitative (RT-q)PCR
Total RNA was extracted from cancer cells using a
Simply P Total RNA Extraction kit (cat. no. BSC52S1; Hangzhou Bioer
Technology Co., Ltd.) and reverse-transcribed using the PrimeScript
RT reagent kit according to the manufacturer's instructions.
Fluorescence RT-qPCR was performed using SYBR Premix Ex Taq™ II
(Takara Bio, Inc.) in a 10-µl PCR mixture on a Bio-Rad CFX96
Real-Time PCR system (Bio-Rad Laboratories, Inc.), according to the
manufacturer's instructions. HORMAD1 gene-specific primers
(forward, 5′-GCCCAGTTGCAGAGGACTC-3′ and reverse,
5′-TCTTGTTCCATAAGCGCATTCT-3′) were designed (17) and purchased from Thermo Fisher
Scientific, Inc. GAPDH (forward, 5′-CTCTGCTCCTCCTGTTCGAC-3′ and
reverse, 5′-GCGCCCAATACGACCAAATC-3′) was used as an endogenous
control for each reaction. The cycling conditions were 94°C for 2
min, 39 cycles of 95°C for 30 sec, 58°C for 30 sec and 72°C for 20
sec, and 72°C for 7 min. Each reaction was repeated three times.
HORMAD1 expression was reported as a mean Cq (20) value (average fold-change relative to
GAPDH) using CFX Manager™ software (version 3.0; Bio-Rad
Laboratories, Inc.).
Cell proliferation, colony formation
and drug susceptibility assays
Cell proliferation and drug-mediated inhibition were
detected using the Cell Counting Kit-8 (CCK-8; MedChemExpress)
assay, according to the manufacturer's instructions. Cells were
plated at a density of 2–8×10⁴ cells/well in 96-well
plates, with or without different concentrations of Doc (cat. no.
HY-B0011; MedChemExpress), and cell viability was assessed after 24
h. The absorbance of each well at a wavelength 450 nm was measured
using a Synergy H1 microplate reader (BioTek Instruments, Inc.).
Empty wells containing the same volume of medium served as the
blank controls. Cells were treated with different concentrations of
Doc for various periods of time (0.1–40 nm; 0–96 h). The
IC50 of Doc was calculated according to a standard curve
and the most appropriate drug concentration was selected for
subsequent experiments.
For the colony formation assay, 5×10²
cells were plated in each of the six wells of the culture plate and
incubated at 37°C for 1–2 weeks. Cells were then fixed with 4%
paraformaldehyde at room temperature for 20 min and stained with
0.1% crystal violet (Merck KGaA) at room temperature for 10 min,
and the cell colonies (>50 cells/colony) were counted and
analyzed by ImageJ v1.8.0 (National Institutes of Health).
Treatment with 3-methyladenine
(3MA)
The autophagy inhibitor 3MA was purchased from
MedChemExpress (cat. no. HY-19312). Following 6 h after
transfection with si-HORMAD1 or negative control siRNA (si-NC),
cells were incubated with 10 µM 3-MA with or without 40 nM Doc at
37°C for 24 h. Cell proliferation was evaluated as
aforementioned.
Treatment with Earle's balanced salt
solution (EBSS)
EBSS (cat. no. H2040; Beijing Solarbio Science &
Technology Co., Ltd.) was used to simulate the autophagy phenotype
induced by cell starvation. The two TNBC cell lines (MDA-MB-468 and
BT549) were placed in a six-well plate according to their growth
conditions, and the growth density was 80–90% on the second day.
The complete medium was replaced with calcium- and phosphorus-free
EBSS, and the cells were collected for protein extraction after
being treated for different time-points (0, 2 and 4 h) (21).
Flow cytometry
The cell cycle was analyzed by flow cytometry.
Briefly, following transfection with si-NC or si-HORMAD1 for 48 h,
cells were exposed to Doc (40 nM) at 37°C for 24 h. Cells were then
digested with trypsin and washed twice with ice-cold PBS, and 75%
alcohol was added to the cell suspension, followed by vortex
mixing. Fixed cells were suspended in PI (100 mg/ml; excitation
wavelength, 488 nm; emission wavelength, 630 nm) and RNase (10
mg/ml) and incubated at 37°C for 30 min in the dark. All samples
were assessed using a FACSCanto system (BD Biosciences). Data were
analyzed using Cell Quest software 5.1 (BD Biosciences).
Detection of apoptosis
Apoptosis was measured using an Annexin V-FITC/7-AAD
kit (cat. nos. FXP014 and FXP145; 4A Biotech., Co., Ltd.). Cells
were treated with 40 nM Doc following transfection with si-NC or
si-HORMAD1 for 48 h or lentiviral transfection for 96 h. The cells
were then collected and resuspended in medium, washed twice with
cold PBS, and suspended in binding buffer at a cell density of
1×10⁶ cells/ml. Cells were stained with 5 µl Annexin
V-FITC at room temperature for 5 min and 10 µl PI (20 µg/ml) at
room temperature for 5 min, according to the manufacturer's
instructions. Samples were analyzed by flow cytometry (FACSCanto)
following incubation in the dark at room temperature for 10 min.
The proportion of apoptotic cells was determined using FlowJo_V10
(FlowJo LLC), with 30,000 cells analyzed per well.
Detection of reactive oxygen species
(ROS)
Intracellular ROS levels in the form of cellular
peroxides were assessed using a ROS Assay kit according to the
manufacturer's instructions (cat. no. D6883; Merck KGaA), following
treatment with or without Doc. MDA-MB-436 cells were treated with
40 nM Doc for 24 h, at 48 h after the siRNA transfection. Cells
were collected, exposed to 10 µM 2′,7′-dichlorofluorescein
diacetate, and incubated at 37°C for 20 min. They were then washed
three times with cold PBS, and fluorescence intensity was analyzed
by flow cytometry (FACSanto657338). ROS levels are expressed as the
mean fluorescence intensity of 30,000 cells.
Evaluation of caspase activity
Cell caspase activity was measured using a
Caspase-3/8/9 Activity Assay kit (cat. nos. C1115/C1152/C1157,
respectively; Beyotime Institute of Biotechnology). Cells were
treated with Doc (40 nM) 24 h after transfection with si-NC or
si-HORMAD1, and total cells were collected according to the
manufacturer's instructions. Next, 100 µl cell lysate and test
reagent per well was incubated in 96-well plates at 37°C for 2 h.
Caspase activity was determined using an enzyme standard instrument
at 405 nm and transformed using a standard conversion curve.
Western blot analysis
Cells were washed once with cold PBS before
harvesting. Protein lysates were prepared from MDA-MB-436,
MDA-MB-468, BT549 and MDA-MB-231 cells using a total protein
extraction kit (cat. no. KGP2100; Nanjing KeyGen Biotech, Co.,
Ltd.) according to the manufacturer's instructions, and protein
concentration was assessed using a Pierce™ BCA Protein Assay kit
(Thermo Fisher Scientific, Inc.), followed by standard western blot
analysis, as outlined below. Protein samples (30 µg/lane) were
separated by 10–12% SDS-PAGE and transferred to 0.2-µm PVDF
membranes (EMD Millipore). Following blocking with 5% skim milk for
1 h at room temperature, the membranes were incubated with specific
primary antibodies at 4°C overnight. Next, following washing 3
times with Tris-buffered saline containing 0.1% Tween-20, the
membranes were incubated with horseradish peroxidase-conjugated
secondary antibodies for 1 h at room temperature. Proteins were
visualized by chemiluminescence, using enhanced chemiluminescent
substrate (cat. no. P10300; New Cell & Molecular Biotech Co.,
Ltd.). Immunoreactive bands were examined using the ChemiDoc
Imaging System (Bio-Rad Laboratories, Inc.). The primary antibodies
used included HORMAD1 (1:1,000; cat. no. HPA037850; Merck KGaA),
Bax (1:2,000; cat. no. 50599-2-Ig; ProteinTech Group, Inc.), Bcl-2
(1:500; cat. no. 60178-1-lg; ProteinTech Group, Inc.); P62
(1:1,000; cat. no. 66184-1-lg; ProteinTech Group, Inc.), Beclin 1
(1:1,000; cat. no. 11306-1-AP; ProteinTech Group, Inc.), light
chain 3 (LC3; 1:1,000; cat. no. 12741S; Cell Signaling Technology,
Inc.), RAD51 (1:1,000; cat. no. 14961-1-AP; ProteinTech Group,
Inc.), phospho-histone H2AX-S139 also named γH2AX (1:1,000; cat.
no. AP0099; ABclonal Biotech Co., Ltd.), cleaved caspase-3
(1:1,000; cat. no. 25546-1-AP; ProteinTech Group, Inc.), GAPDH
(1:5,000; cat. no. 10494-1-AP; ProteinTech Group, Inc.) and β-actin
(1:5,000; cat. no. 20536-1-AP; ProteinTech Group, Inc.). The
secondary antibodies used were horseradish peroxidase-conjugated
goat anti-rabbit antibodies (1:3,000; cat. no. 7074S; Cell
Signaling Technology, Inc.). GAPDH or β-actin was used as an
internal control for each blot. ImageJ software v1.8.0 was used to
quantify western blot analysis, and GraphPad Prism 7 software
(GraphPad Software, Inc.) was used for plotting and statistical
analysis.
Hoechst staining
Hoechst stain was measured using TUNEL Apoptosis
Assay Kit (cat. no. T2190; Beijing Solarbio Science &
Technology Co., Ltd.). Cells were transfected with si-NC or
si-HORMAD1 for 24–48 h and then plated at a density of
2–3×10⁵ cells/well in 24-well plates with a sterile
glass slipper at the bottom for 12–24 h. They were then treated
with or without Doc at 37°C for 24 h. Subsequently, the Hoechst
staining was carried out according to the manufacturer's
instructions. Briefly, TNBC cells were fixed with a 4%
paraformaldehyde fixation solution at room temperature for 20 min,
and then rinsed three times with 0.01 mol/l PBS for 5 min. Cells
were then stained with 1X Hoechst working solution at room
temperature for 15 min in the dark, followed by washing three times
with PBS, for 5 min each time. Next, anti-fluorescence quenching
agents were used to fix the cell slide onto the cover glass and
observed under a fluorescence microscope (magnification, ×200). The
dye was a DNA-specific fluorescent probe, and the nucleus exhibited
bright blue fluorescence. The number of nuclear fragmentations in
three random fields were observed and counted, and the results were
statistically analyzed.
Statistical analysis
Survival analysis was carried out using R2
(http://r2.amc.nl), a genomics analysis and
visualization platform. All experiments were performed
independently at least three times. Statistical analyses were
performed using GraphPad Prism 7.0 (GraphPad Software Inc.).
Metrological data are presented as the mean ± SD. An unpaired
Student's t-test was used for two individual comparisons and the
mean of multiple groups was compared by one-way analysis of
variance (ANOVA). Multiple comparisons were performed using
Bonferroni correction following ANOVA. The categorical variables
are presented as numbers and percentages and were compared using
χ2 and Fisher's tests. P<0.05 was considered to
indicate a statistically significant difference.
Results
Expression level of HORMAD1 in
TNBC
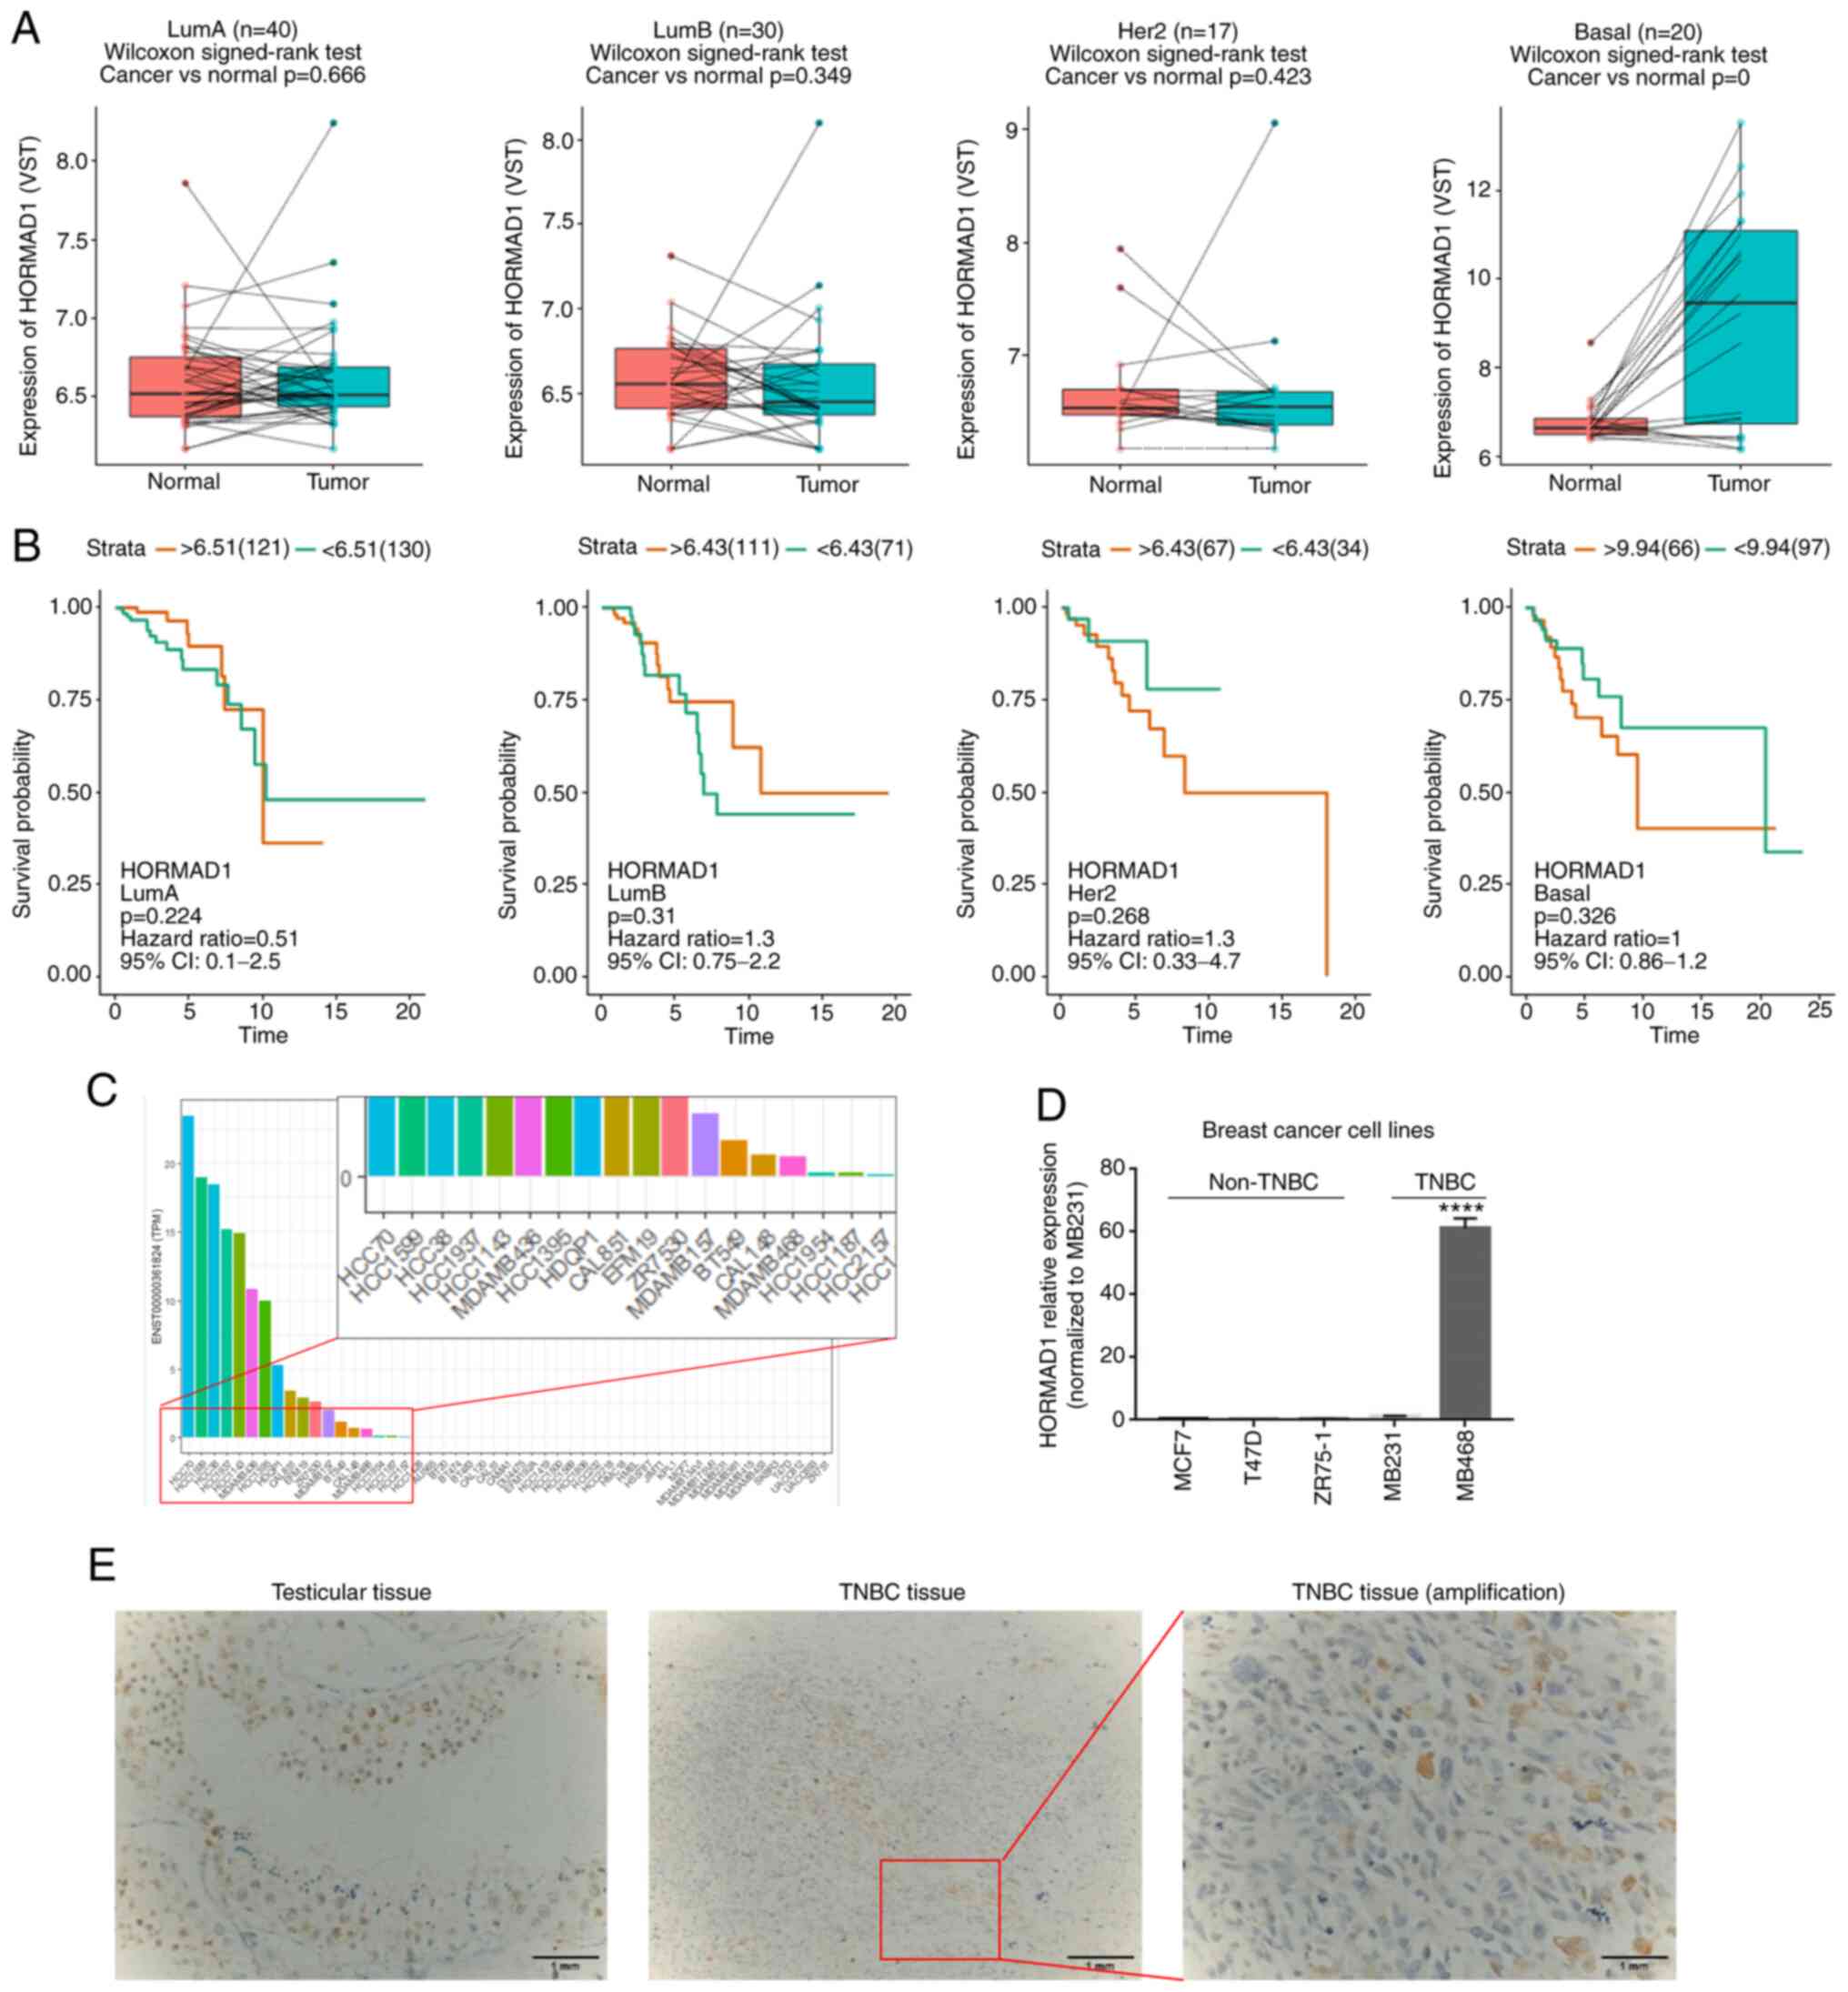
To evaluate HORMAD1 expression in breast cancer,
bioinformatics analysis was first conducted. As shown in Fig. 1, compared with paired peritumoral
controls, there was no significant difference in HORMAD1 expression
among the Luminal A (n=40, P>0.05), Luminal B (n=30, P>0.05)
or human epidermal growth factor receptor 2 overexpression (n=17,
P>0.05) breast cancer subtypes, while HORMAD1 expression was
significantly higher in TNBC tumors compared with adjacent normal
tissue (n=20, P<0.001; Fig. 1A).
These data demonstrated that HORMAD1 was abnormally, and almost
exclusively, expressed at higher levels in TNBC tumors; however, no
association was detected between HORMAD1 levels and the prognosis
of patients with breast cancer (Fig.
1B).
Next, bioinformatics analysis was performed to
evaluate HORMAD1 expression in breast cancer cell lines from the
CCLE. The results demonstrated similar trends to that of tumor
tissue analyses, in that HORMAD1 was almost exclusively highly
expressed in TNBC or BLBC cell lines, including BT549 and
MDA-MB-436 (Fig. 1C).
Next, HORMAD1 mRNA and protein expression were
tested in various breast cancer cell lines commonly used in the
laboratory. A high HORMAD1 expression was only detected in
MDA-MB-468 cells, with no HORMAD1 expression revealed in non-TNBC
cell lines (P<0.001; Figs. 1D and
S1A), which was consistent with a
previous study (14).
Current chemotherapy regimens for TNBC include both
Doc and anthracyclines (14,15). Therefore, TNBC cases treated with NAC
were selected for comparative expression analysis, according to
specific inclusion and exclusion criteria as aforementioned.
Finally, 154 TNBC cases were enrolled, among which the pCR rate was
24.0% (37/154). To further explore the expression of HORMAD1 in
patients with TNBC with residual disease, paraffin-embedded tumor
biopsy specimens were sectioned from 109 cases (8 cases were
excluded due to the lack of tissue availability) without pCR for
hematoxylin and eosin (preserved at the Department of Pathology,
First Affiliated Hospital of Chongqing Medical University), and
immunohistochemical staining; TIL scores were determined
concurrently. High levels of HORMAD1 expression were specifically
detected in the spermatogenic positive control (Fig. 1E, left), and HORMAD1 protein
expression was also detected in some TNBC tissue samples (Fig. 1E, right). Furthermore, statistical
analysis demonstrated that HORMAD1 was expressed in 23.9% (26/109)
of patients with TNBC who had residual disease (Table I), similar to the 29.7% expression
rate reported in samples from patients with untreated TNBC
(22). No associations were found
between HORMAD1 expression and patient clinicopathological
characteristics (Table I).
 | Table I.Associations between HORMAD1
expression and clinicopathologic features of 109 TNBC cases. |
Table I.
Associations between HORMAD1
expression and clinicopathologic features of 109 TNBC cases.
|
| HORMAD1
expression |
|
|---|
|
|
|
|
|---|
|
Characteristics | Negative
n=83(%) | Positive n=26
(%) | P-value |
|---|
| Age at diagnosis
(years) |
|
| 0.216 |
|
≤50 | 53 (63.9) | 20 (76.9) |
|
|
>50 | 30 (36.1) | 6 (23.1) |
|
| Menopausal
status |
|
| 0.197 |
|
Pre/peri | 49 (59.0) | 19 (73.1) |
|
|
Post | 34 (41.0) | 7 (26.9) |
|
| Histologic
subtype |
|
| 0.491 |
|
IDC | 74 (87.1) | 25 (96.2) |
|
| No
IDC | 9 (10.8) | 1 (3.8) |
|
| Post-NAC tumor size
(cm) |
|
| 0.856 |
|
≤2.0 | 40 (48.2) | 12 (46.2) |
|
|
>2.0 | 43 (51.8) | 14 (53.8) |
|
| Post-NAC lymph node
involvement |
|
| 0.251 |
|
Yes | 31 (37.3) | 13 (51.9) |
|
| No | 52 (62.7) | 13 (48.1) |
|
| Post-Ki67
expression |
|
| 0.500 |
|
≤14% | 26 (31.3) | 10 (38.5) |
|
|
>14% | 57 (68.7) | 16 (61.5) |
|
| Ki67 status |
|
| 0.844 |
|
Decrease | 59 (71.1) | 19 (73.1) |
|
| No
decrease | 24 (28.9) | 7 (26.9) |
|
| Curative effect of
NAC |
|
| 0.903 |
| No | 34 (41.0) | 11 (42.3) |
|
|
Yes | 49 (59.0) | 15 (57.7) |
|
| RD TILs level |
|
| 0.341 |
|
<30% | 44
(53.0) | 11 (42.3) |
|
|
≥30 | 39
(47.0) | 15 (57.7) |
|
TILs are a manifestation of host immune system
recognition and defense against malignant cells (23). Several studies have reported that
HORMAD1 was a potential neoantigen (24,25);
however, Pearson correlation coefficient testing demonstrated no
correlation between HORMAD1 and the number of TILs (R=0.09,
P=0.345) (data not shown). In addition, survival analysis
indicated that HORMAD1 expression does not represent a prognostic
factor for patients with TNBC (data not shown). Notably, it was
revealed that the TIL number was an independent prognostic factor
for both progression-free survival and overall survival in patients
with primary TNBC, particularly those without a decreased Ki67
index following NAC (data not shown); however, to the best of our
knowledge, the role of HORMAD1 in TNBC biology remains unknown.
High HORMAD1 expression cell lines were selected for use in
follow-up studies, due to their high HORMAD1 expression levels
(Fig. 1C).
Biological effect of HORMAD1 on the
Doc sensitivity of TNBC cells
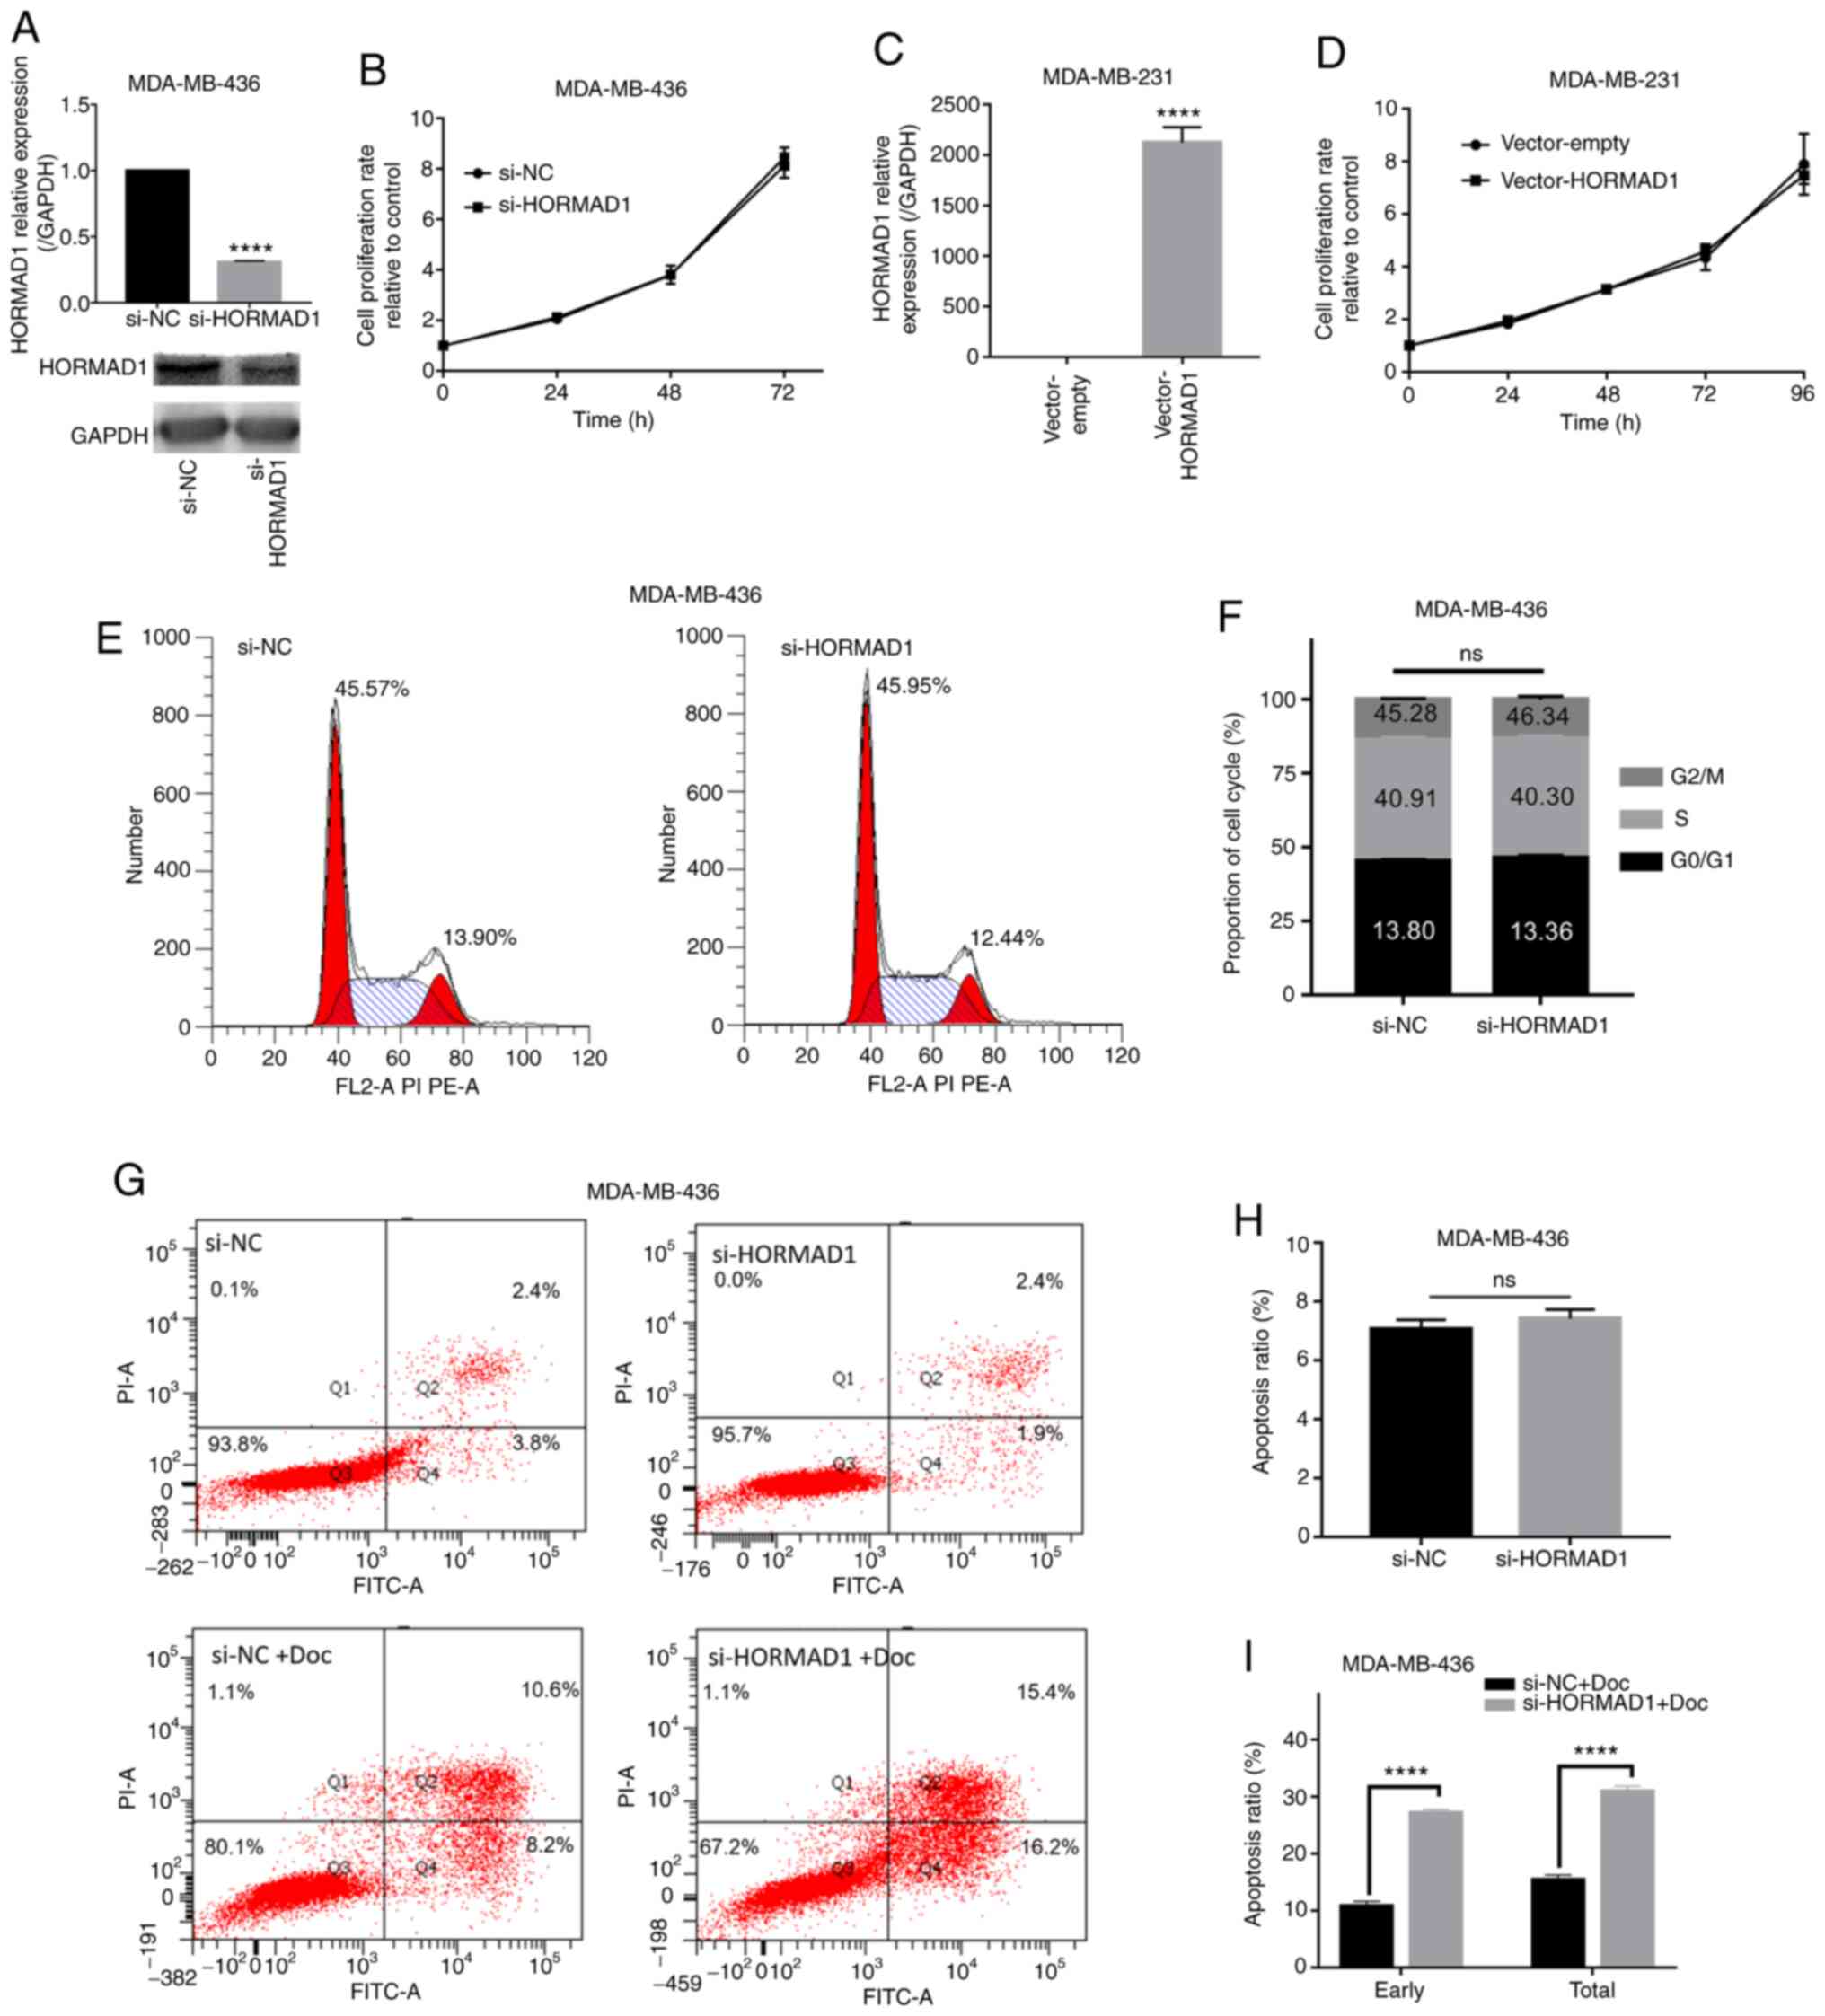
Due to the potential oncogenic role of HORMAD1 in
breast carcinoma (13,16), a series of experiments was conducted
to understand the biological effects of HORMAD1 depletion. Specific
siRNA targeting HORMAD1 (si-HORMAD1, equal to si-HORMAD1#1) was
used to reduce the expression of endogenous HORMAD1 (P<0.001;
Fig. 2A). To determine whether
targeting HORMAD1 can decrease TNBC cell viability and potentially
complement and improve the efficacy of Doc treatment, a series of
experiments was carried out. MDA-MB-436 and MDA-MB-468 cell
proliferation were not affected by HORMAD1 knockdown alone,
compared with si-NC (P>0.05; Figs.
2B and S1B). Consistent results
were obtained using a colony formation assay (Fig. S1D). Flow cytometry indicated that a
relatively high proportion of MDA-MB-436 cells was in the
G0/G1 and S phases compared with the
G2/M phase, and that HORMAD1 knockdown did not affect
the proportion of MDA-MB-436 cells in each phase (S-phase,
40.91±0.909 vs. 40.30±1.15%; P>0.05; Fig. 2E and F). Consistent results were
obtained using another breast cancer cell line expressing high
HORMAD1 levels, MDA-MB-468 (S-phase, 10.67±0.142 vs. 10.34±0.166%;
P>0.05; Fig. S1C).
Similarly, HORMAD1 overexpression in MDA-MB-231
cells, using the pcDNA3.1 plasmid vector (P<0.001; Fig. 2C), did not affect MDA-MB-231 cell
proliferation (Fig. 2D), which was
consistent with the findings of a previous study that used SUM159
cells (16). Furthermore, there was
no significant difference in total apoptosis between MDA-MB-436
cells with and without HORMAD1 knockdown (7.06±0.185% vs.
7.42±0.181%, P>0.05; Fig. 2G and
H). Collectively, compared with the siRNA-NC, siRNA-HORMAD1 had
no effect on cell survival; however, similar to the findings of a
study in epithelial ovarian cancer cells (15), exposure to Doc for 48 h resulted in a
noticeable increase in MDA-MB-436 cell apoptosis, compared with
negative controls (early, 11.07±0.35 vs. 21.19±0.39%, P<0.001;
total, 15.67±0.35 vs. 27.4±0.21%, P<0.001; Fig. 2G and I). Finally, additional HORMAD1
silencing resulted in an apoptotic rate that was almost double
compared with that caused by Doc treatment alone (Fig. 2I). These results indicated that
HORMAD1 may exert biological effects on the sensitivity of
MDA-MB-436 cells to chemotherapy drugs.
Effect of HORMAD1 on Doc-induced
changes in TNBC cell apoptosis
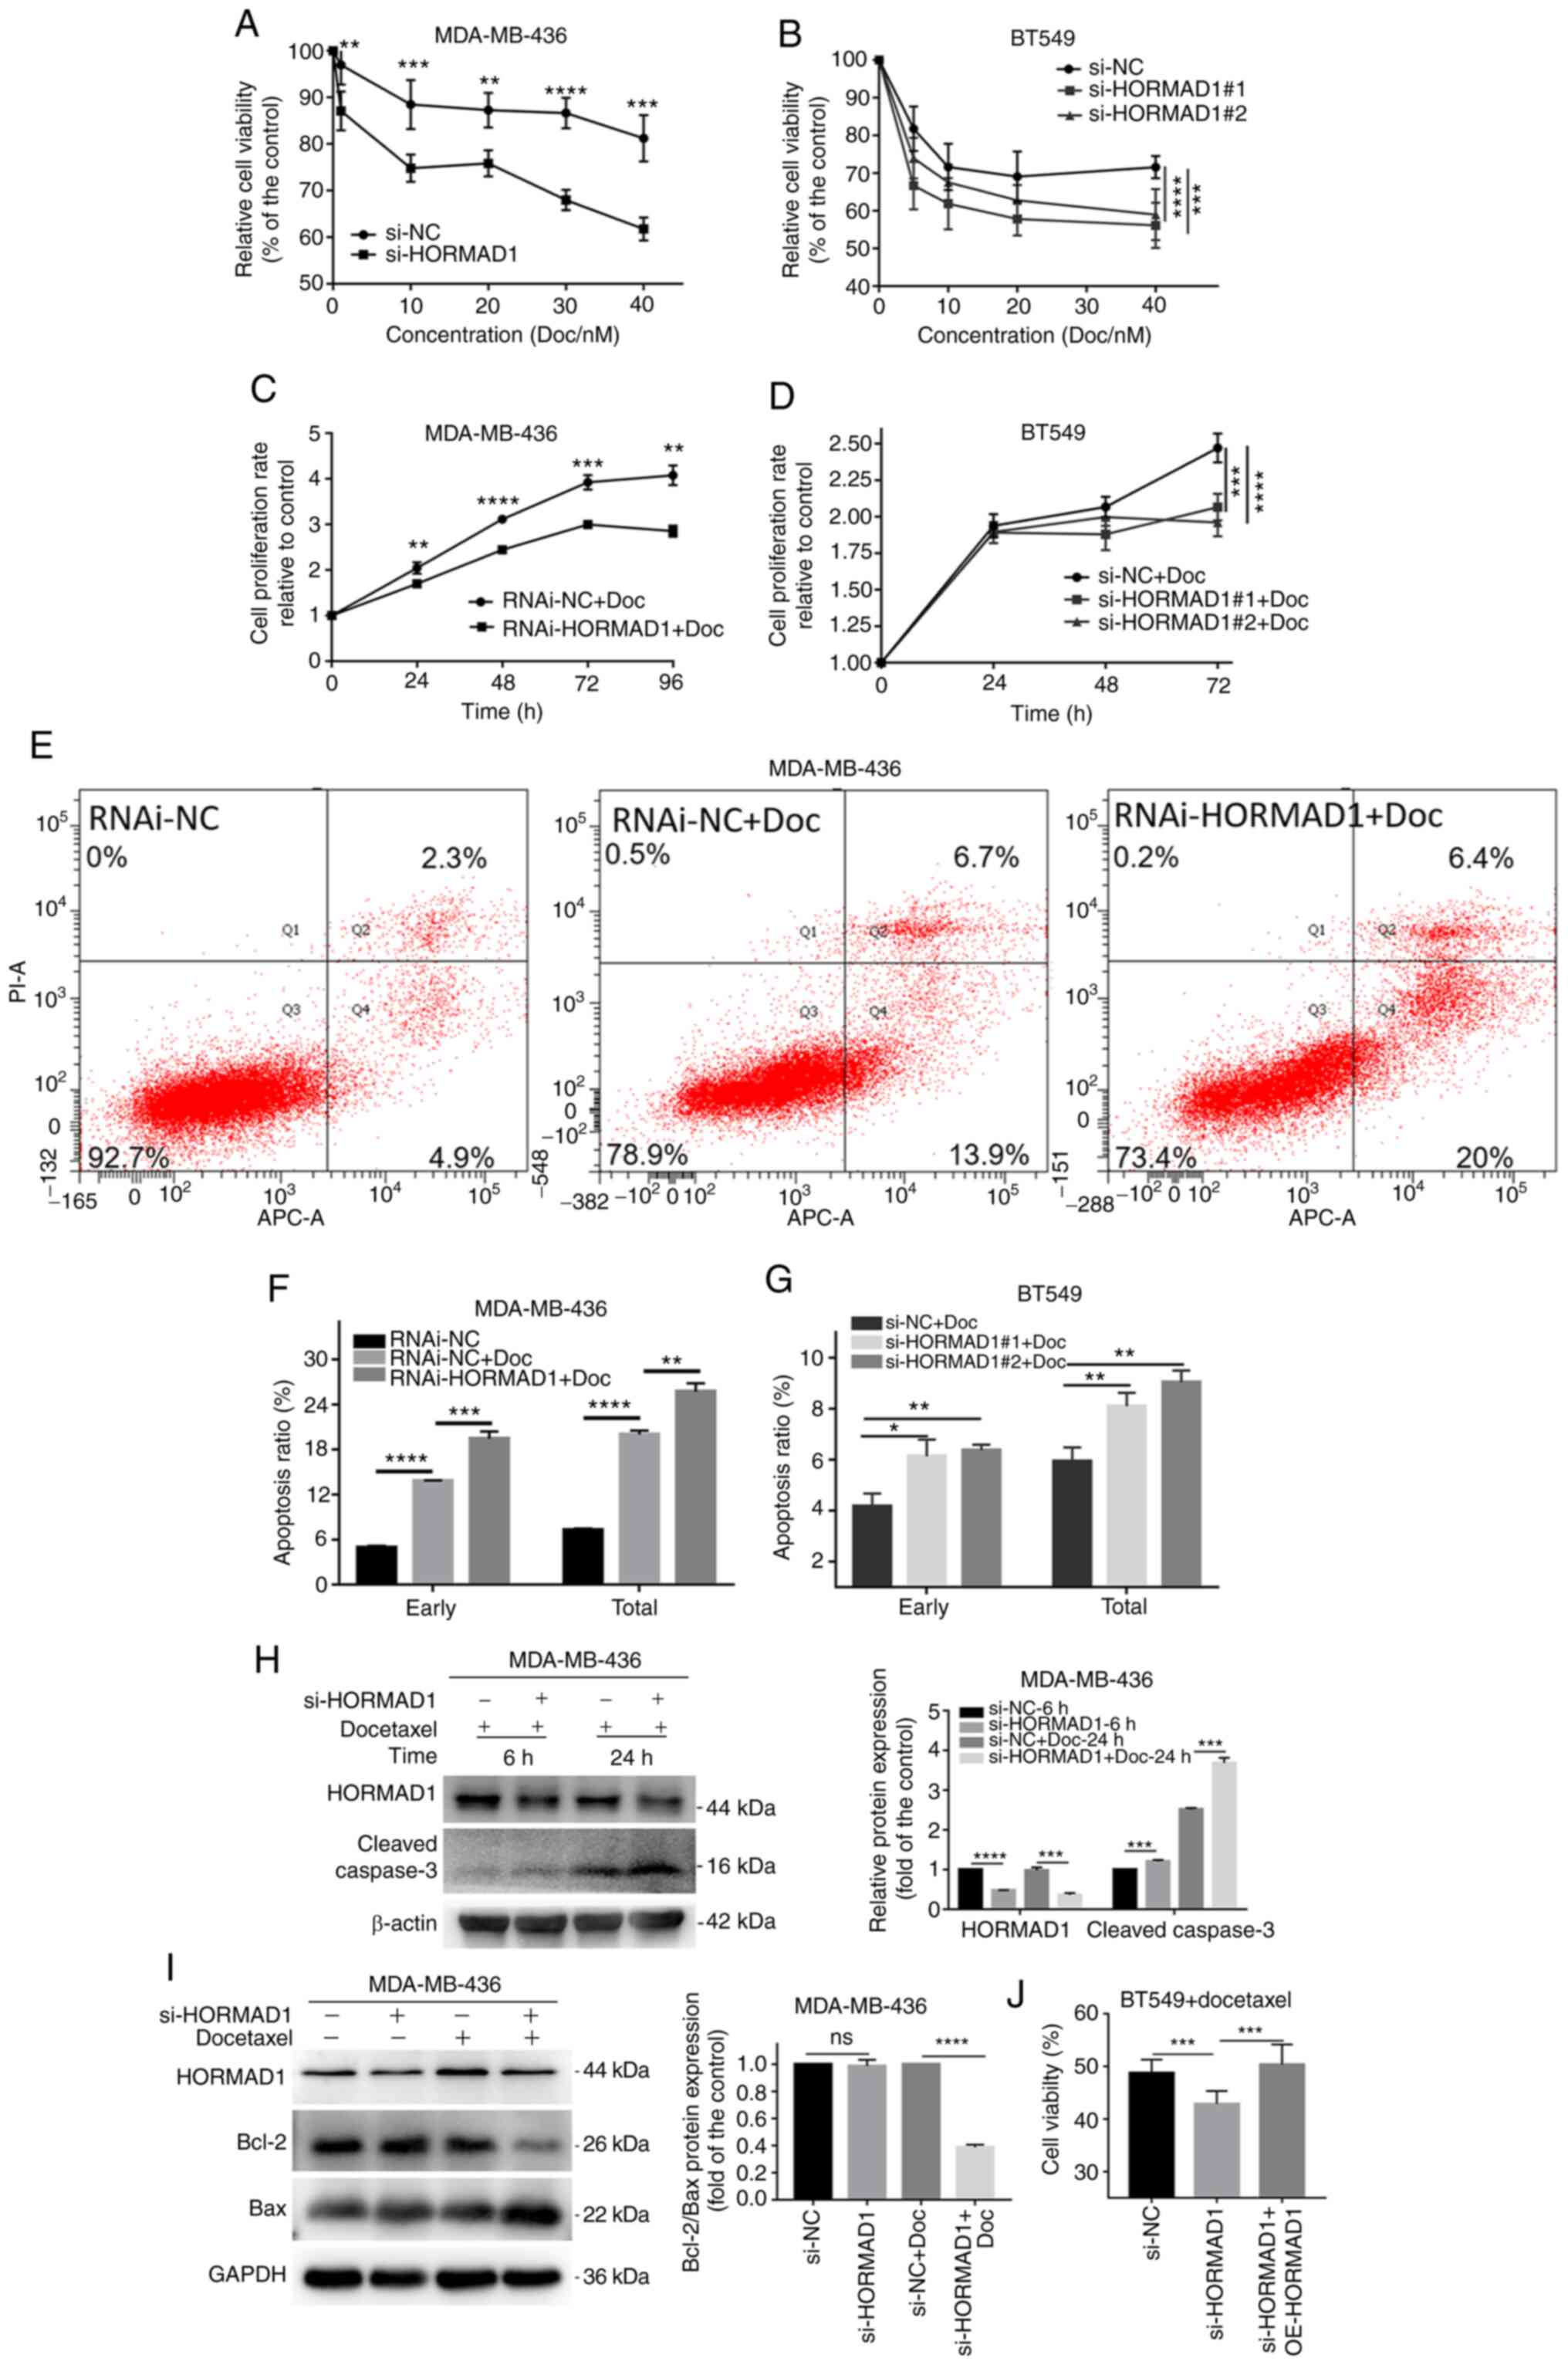
To determine whether HORMAD1 expression influences
Doc sensitivity, specific siRNAs were used to knock down HORMAD1 in
MDA-MB-436 and BT549 cells, which were then treated with 40 nM Doc
(based on the IC50 value of MDA-MB-436; Fig. S2A). CCK-8 assays were used to
investigate whether there was a difference in Doc sensitivity of
cells with or without HORMAD1 knockdown, based on MDA-MB-436 cell
proliferation rates. Compared with the si-NC group, the si-HORMAD1
group demonstrated lower proliferation rates following treatment
with various concentrations of Doc for 24 h, in both MDA-MB-436 (40
nM, 81.23±2.488 vs. 61.78±1.095%, P<0.005; Fig. 3A) and MDA-MB-468 (40 nM, 67.32±1.422
vs 36.89±2.46, P<0.001; Fig. S2B)
cells. Similar results were confirmed by growth curve analysis of
MDA-MB-436 cells treated with or without lentiviral-HORMAD1
(RNAi-HORMAD1) at the same concentration as that of Doc (96 h,
4.08±0.125 vs. 2.85±0.070, P<0.01; Fig. 3C). The same result trends were
observed in BT549 cells using two different specific siRNAs
(Fig. 3B and D). These results
demonstrated that the reduction of HORMAD1 expression could
increase the drug sensitivity of TNBC cells positively expressing
HORMAD1 to Doc.
Flow cytometry confirmed that there was a
significant difference in the apoptotic rate between MDA-MB-436
cells with or without RNAi-HORMAD1 treatment exposed to Doc for 24
h (early apoptosis, 13.8±0.058 vs. 19.43±0.567%, P<0.005; total
apoptosis, 20±0.306 vs. 25.7±0.651%, P<0.01; Fig. 3E and F). The same result trends were
also observed in BT549 cells using specific siRNA (Fig. 3G).
Compared with Doc for 6 h, Doc for 24 h produced
obvious apoptotic signals. Moreover, cleaved caspase-3 levels were
significantly increased in the si-HORMAD1 group compared with the
NC group in MDA-MB-436 cells (Fig.
3H). Meanwhile, a similar phenomenon was observed in MDA-MB-468
cells (Fig. S2C). Analysis of common
markers of apoptosis revealed that Bcl-2/Bax was significantly
decreased in the si-HORMAD1+Doc group (Fig. 3I). These results indicated that
HORMAD1 knockdown could promote the sensitivity of TNBC cells to
Doc.
HORMAD1 depletion is associated with
autophagy in certain TNBC cells
Autophagy is closely associated with drug resistance
(26). To explore whether HORMAD1 can
affect TNBC drug sensitivity through autophagy, changes in
autophagy markers in TNBC cells treated with si-NC or si-HORMAD1
were examined. Significant changes were observed in several typical
autophagy markers in MDA-MB-436 and MDA-MB-468 cells with on
HORMAD1 knockdown (Fig. 4A and B).
The expression level of P62 was significantly decreased
(P<0.05), while that of Beclin 1 was significantly increased
(P<0.05), compared with the control group. Conversely, HORMAD1
overexpression in MDA-MB-231 cells, led to a significant increase
in P62 compared with control cells (P<0.05; Fig. 4C and D), while the addition of Doc was
also accompanied by autophagy. It was hypothesized that HORMAD1 can
inhibit autophagy in TNBC. Flow cytometry revealed that HORMAD1
overexpression in MDA-MB-231 cells had the same effect as the
addition of the autophagy inhibitor 3MA in MDA-MB-436 cells
(Fig. 4F and G), both of which
increased Doc-induced apoptosis to a similar degree (MDA-MB-231, 1
vs. 1.27±0.007, P<0.001; MDA-MB-436, 1 vs. 1.22±0.05, P<0.05;
Fig. 4E and H), indicating the
inhibition of autophagy could increase drug sensitivity.
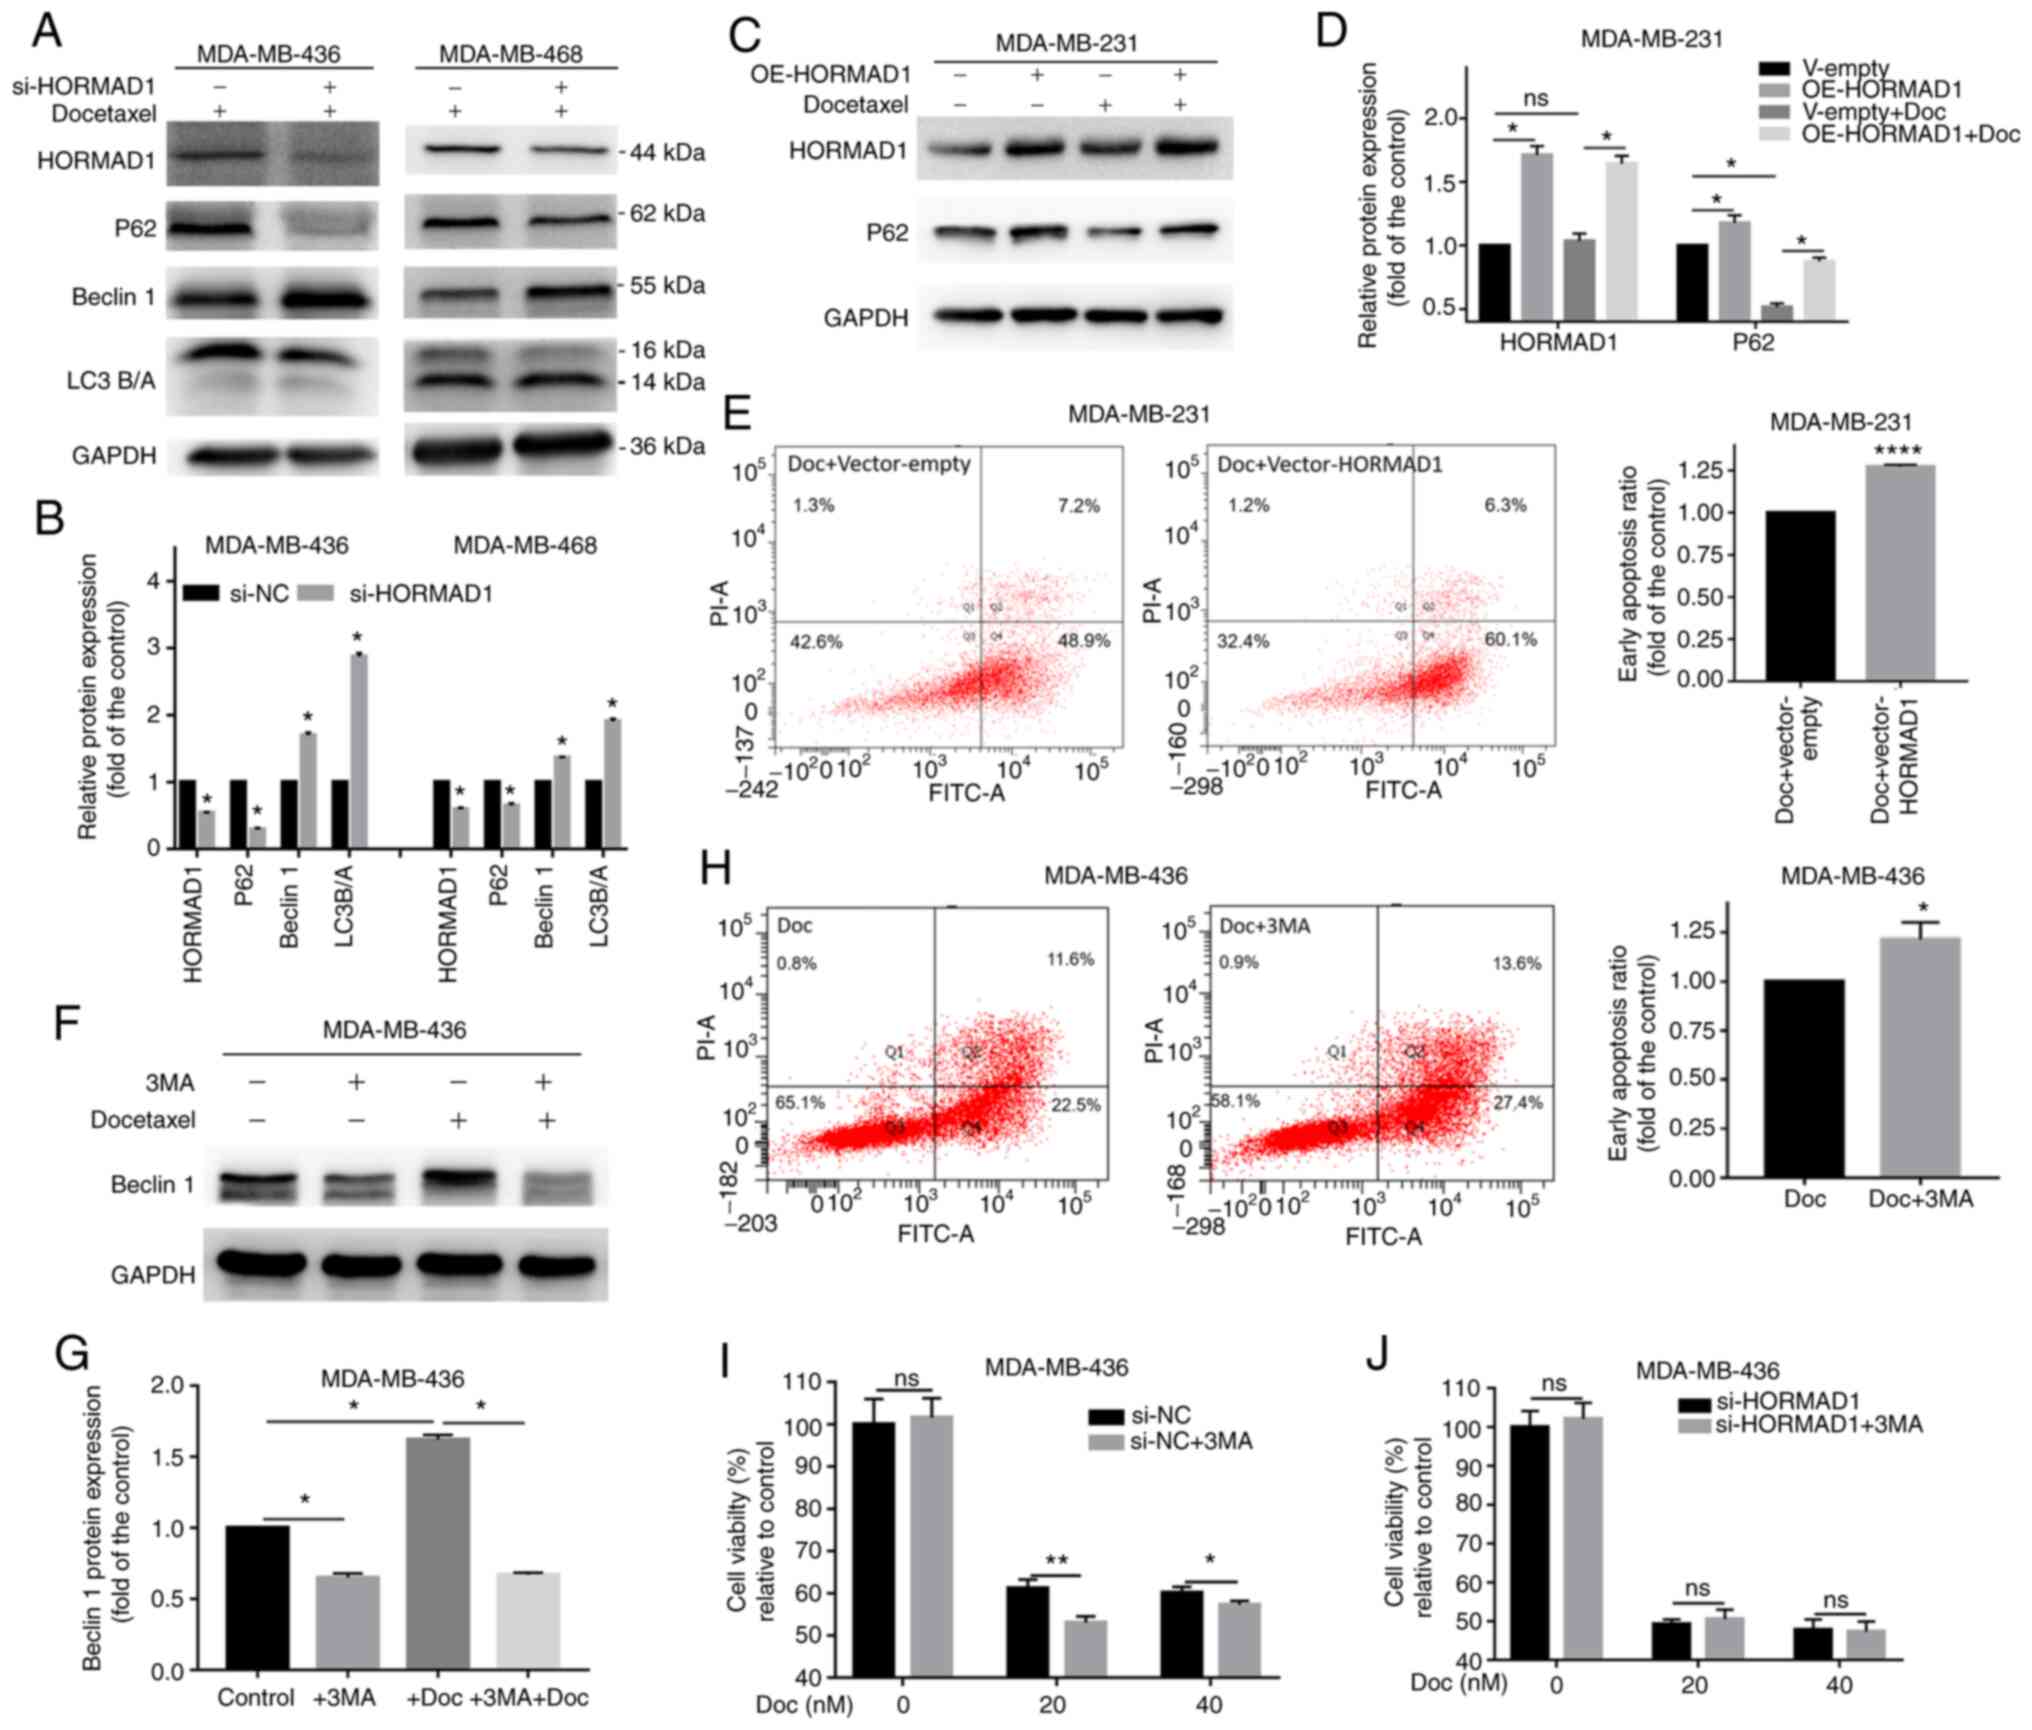 | Figure 4.HORMAD1 promotes Doc resistance by
not enhancing autophagy. (A and B) Western blot analysis of
autophagy markers in MDA-MB-436 and MDA-MB-468 cells. P62 and LC3A
were decreased and Beclin 1 was increased in the HORMAD1-knockdown
group. (C and D) P62 expression was significantly increased in
response to HORMAD1 overexpression in MDA-MB-231 cells. (E)
Doc-induced apoptosis for 24 h in MDA-MB-231 cells overexpressing
HORMAD1 was higher than that in the control group. (F and G) The
addition of 3MA significantly inhibited the expression of Beclin 1,
while the addition of Doc significantly increased the expression of
Beclin 1. (H) Apoptotic rates induced by Doc for 24 h in MDA-MB-436
cells treated with 3MA were higher than those in the control group.
(I) The viability of MDA-MB-436 cells treated with 3MA was lower
than that of cells in the control group following exposure to Doc
for 24 h. (J) Cell viability of MDA-MB-436 treated with si-HORMAD1
was not altered by treatment with Doc for 24 h, with or without
3MA. GAPDH was used as an internal reference protein. *P<0.05,
**P<0.01 and ****P<0.001. HORMAD1, HORMA domain-containing
protein 1; Doc, docetaxel; 3MA, 3-methyladenine; si-NC, small
interfering RNA-negative control; si-HORMAD1, siRNA-HORMAD1; ns, no
significance; oe, overexpression. |
Cell viability assessment also indicated that
Doc-induced cell damage was increased by 3MA, while this effect was
attenuated with increasing concentrations of Doc (20 nM,
61.17±1.1.193 vs. 53.05±0.833%, P<0.01; 40 nM, 60.1±0.819 vs.
57.24±0.54%, P<0.05; Fig. 4I).
Drug sensitivity was further detected following HORMAD1 knockdown.
However, in the HORMAD1-knockdown group, Doc-induced cell damage
was not affected by the addition of 3MA (40 nM, 47.78±1.556 vs.
47.35±1.496%, P>0.05; Fig. 4J).
These results indicated that the enhancement of autophagy induced
by HORMAD1 knockdown was not responsible for its effects in
sensitizing cells to Doc. Therefore, the present study aimed at
exploring the reason why HORMAD1 plays a role in Doc resistance in
tumors through its basic physiological functions.
However, not all TNBC cell lines with a high HORMAD1
expression exhibited this phenomenon, as for instance BT549 cells
(Fig. S1E). In addition, compared
with autophagy induced by EBSS-induced starvation (Fig. S1F), the autophagy associated with
HORMAD1 knockdown may be more complex.
HORMAD1 depletion promotes Doc-induced
DNA damage in TNBC cells
Next, the mechanism through which HORMAD1 influences
TNBC cell resistance to Doc was explored. Since lung cancer cells
expressing high levels of HORMAD1 can achieve resistance to
piericidin A by reducing ROS-processing mechanisms (24), a ROS assay kit was used to detect
differences in ROS levels in MDA-MB-436 cells treated with si-NC or
si-HORMAD1 exposed to Doc. The intracellular ROS production induced
by Doc was higher in cells with HORMAD1 knockdown (1 vs.
1.17±0.007; P<0.001; Fig. 5A),
indicating that, under Doc-induced oxidative stress conditions,
HORMAD1 may participate in the upregulation of antioxidant enzyme
systems in TNBC cells to enhance anti-apoptosis, which may be a
major contributor to the induction of chemotherapy resistance.
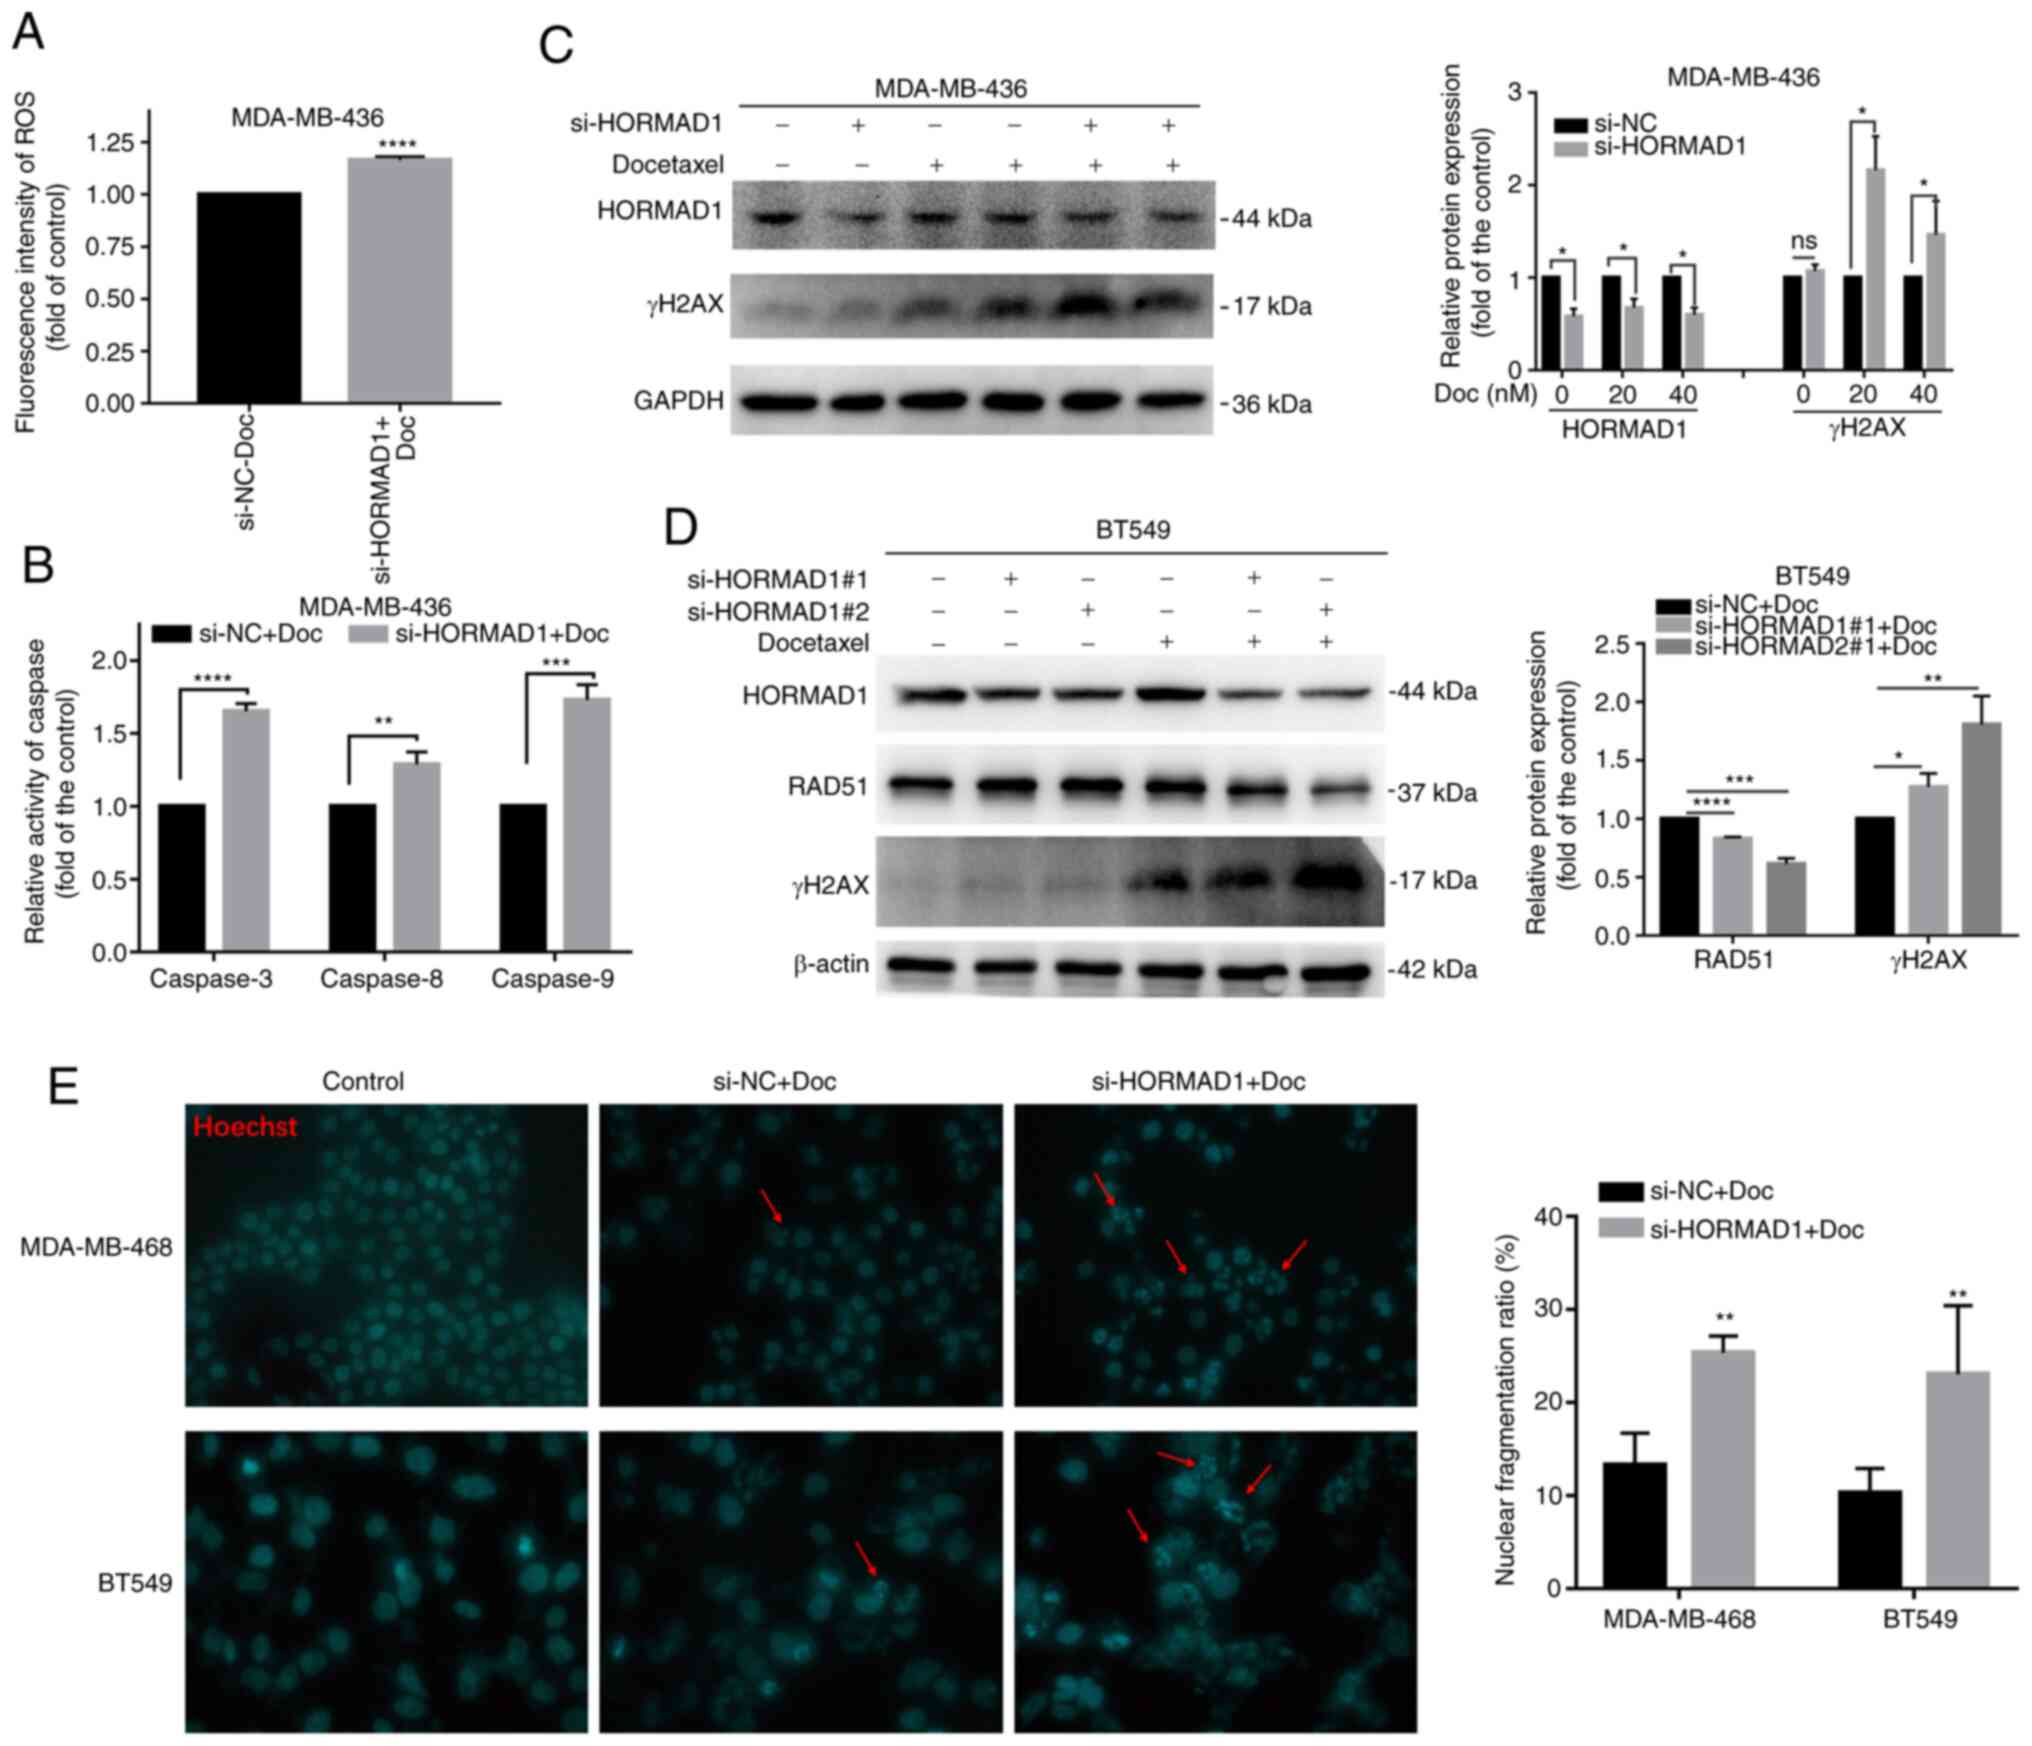 | Figure 5.HORMAD1 promotes Doc resistance by
enhancing DNA damage tolerance. (A) The induction of intracellular
ROS generation was increased by Doc in MDA-MB-436 cells treated
with si-HORMAD1 compared with the control group. (B) Caspase enzyme
activity in MDA-MB-436 cells treated with si-NC/HORMAD1 following
exposure to 40 nM Doc for 24 h. The activity of caspases-3, −8 and
−9 was higher than that in the control group. (C) Western blot
analysis of DNA damage and repair markers in MDA-MB-436 cells. The
γH2AX expression in the HORMAD1-knockdown group was significantly
higher not only in the 20 nM group (lane 3 vs. lane 5) but also in
the 40 nM group (lane 4 vs. lane 6) than that induced by Doc (40
nM) in the control group. (D) Western blot analysis of DNA damage
and repair protein markers in BT549 cells. The result trend was
consistent with that in MDA-MB-436 cells. GAPDH was used as an
internal reference protein. (E) Hoechst staining revealed that,
compared with the si-NC group, the HORMAD1 knockdown group
exhibited a higher proportion of nuclear fragmentation
(magnification, ×200; red arrow). *P<0.05, **P<0.01,
***P<0.005 and ****P<0.001. HORMAD1, HORMA domain-containing
protein 1; ROS, reactive oxygen species; Doc, docetaxel;
si-HORMAD1, small interfering RNA-HORMAD1; si-NC, siRNA-negative
control; ns, no significance. |
Caspase activity analysis demonstrated that,
compared with controls, HORMAD1 knockdown could significantly
increase the levels of active caspase-3 (1 vs. 1.63±0.03;
P<0.001), caspase-8 (1 vs. 1.29±0.05; P<0.01) and caspase-9
(1 vs. 1.73±0.061; P<0.005), following exposure to Doc (Fig. 5B). These findings could also explain
the increased apoptosis observed in the knockdown group and suggest
that the knockdown of HORMAD1 can promote both extrinsic and
intrinsic pathways induced by Doc to increase apoptosis.
The detection of DNA damage markers revealed that
γH2AX expression was significantly higher in the HORMAD1 knockdown
group (P<0.05), while that of the DNA repair protein RAD51 was
lower (P<0.05) than that in the control in MDA-MB-436 cells
(Figs. 5C and S2D), MDA-MB-468 (Fig. S2E) and BT549 (Fig. 5D) cells, indicating that there was a
significant increase in double-strand breaks in the knockdown group
and that the Doc-induced damage tolerance was reduced. The
potential role of HORMAD1 in improving DNA damage tolerance has
previously been studied in lung cancer (24); in the present study, it was indicated
that HORMAD1 plays a similar role in TNBC.
The main changes of apoptosis are the progressive
degradation of DNA and the formation of apoptotic bodies. Hoechst
staining revealed that cells in different treatment groups
demonstrated different proportions of chromatin clumps and nucleate
fragmentation. Compared with the control group, cells with Doc
treatment exhibited significant nuclear fragmentation. Compared
with the si-NC group, the HORMAD1 knockdown group showed a higher
proportion of nuclear fragmentation (P<0.01; Fig. 5E).
Apoptosis is closely associated with autophagy
(27), and there have been several
studies evaluating the correlation between autophagy and drug
resistance. These results indicated that HORMAD1 depletion promotes
Doc susceptibility caused by a DNA repair defect, which is
attributable to a lack of contribution from HORMAD1 to homologous
recombination (HR) during TNBC cell mitosis (16).
Discussion
This study innovatively examined the histological
expression of HORMAD1 in TNBC samples with residual lesions after
NAC. Concurrently, the present study demonstrated that HORMAD1 and
autophagy substrate P62 may be closely related. The role of HORMAD1
in DNA damage tolerance of tumor cells may be the cause of Doc
resistance. In the present study, it was demonstrated that HORMAD1
was preferentially overexpressed in the BLBC breast cancer subtype,
based on the analysis of TCGA datasets, and that the aberrant
expression of HORMAD1 was likely to have a specific biological
significance in TNBC. In previous studies, the detection of high
HORMAD1 expression levels has generally been conducted at the gene
level, with protein levels rarely reported. The proportion of
clinical and database samples with high HORMAD1 mRNA expression
levels was 52.2–83.6% (17), while
the protein levels of HORMAD1 only detected in TNBC samples were
only 29.7% (22). This difference
between gene and protein levels may be due to post-transcriptional
translation and modification (28),
or the rapid degradation of the protein. In the present study, the
analysis of clinical samples also revealed that HORMAD1 protein
expression was 23.9% in TNBC tumors from patients treated with NAC.
Given the differences in detection reagents and sample processing,
this result could reflect the expression of HORMAD1 in TNBC
samples; however, HORMAD1 was not found to be a prognostic
indicator for TNBC. Based on the results of the bioinformatics
analysis of paired tumor and peritumoral samples, and the findings
of the laboratory experiments, the present study concluded that
HORMAD1 is unlikely to be an independent predictor of prognosis in
patients with TNBC, which was inconsistent with the results
reported by Chen et al (22),
who reported that HORMAD1 is a key differential gene associated
with poor outcome in TNBC. This difference may also be due to the
fact that the present study followed different types of TNBC
patients with or without NAC treatment. Further studies with larger
sample sizes and a longer follow-up periods are required to confirm
the conclusion of the present study.
HORMAD1 is a specific germ cell protein known to be
reactivated in certain cancer types (11). HORMAD1 belongs to a family of proteins
[meiosis-specific protein HOP1, mitotic arrest deficient 2 like 2,
mitotic arrest deficient 2 like 1 (Mad2)] characterized by a HORMA
domain that is present in several DNA repair pathways (29). The best characterized HORMA domain
protein, Mad2, is an essential spindle assembly checkpoint
mediator. A previous study of HORMAD1 in mice has revealed that it
plays an important role in the early detection of meiosis by
ensuring the successful search for homologous DNA double-strand
breaks and the rapid dissociation and degradation following the
formation of normal synaptic complexes (30). HORMAD1 has been proposed to play roles
in genomic instability and drug resistance (31) and encodes a HORMAD that binds to DNA
double-strand breaks during meiosis, promotes synapsis formation
and activates HR (32). In the
present experiments, it was demonstrated that cells with HORMAD1
knockdown had a higher apoptotic rate when exposed to Doc
treatment; however, the proliferation, cycle and apoptosis of TNBC
was not affected by HORMAD1 knockdown with siRNA alone. It was
indicated that the role of HORMAD1 in DNA fragmentation and
recombination may be the main reason for its role in
chemotherapeutic drug resistance.
Autophagy is an evolutionarily conserved, lysosomal
dependent, self-degradation pathway that not only plays an
important role in maintaining genomic integrity and homeostasis but
is also closely associated with tumor development and drug
resistance (26). Protective
autophagy can promote the survival of drug-resistant cells;
however, as a mechanism of programmed cell death, autophagy can
directly promote the death of drug-resistant tumor cells. Autophagy
can be induced by several factors, such as starvation, growth
factor deficiency, microbial infection, organelle damage, protein
misfolding or aggregation, DNA damage, radiation and chemotherapy
(26). It was confirmed that the
transient knockdown of HORMAD1 expression in MDA-MB-436 and
MDA-MB-468 cells resulted in changes in autophagy markers, but not
in BT 549 cells. In addition, compared with autophagy induced by
EBSS-induced, the autophagy associated with HORMAD1 knockdown may
be more complex. A previous study reported that autophagy-related
protein (Atg) 101, which is a HORMAD, could interact with and
stabilize the N-terminal HORMA domain of Atg13; meanwhile, Atg101
is capable of interacting with the C-terminal domain of Atg1,
suggesting that this unique subunit might have functions beyond
that of stabilizing Atg13 (33).
Future studies should focus on whether HORMAD1, which also contains
the HORMA domain, is linked to autophagy.
Treatment with Doc was also accompanied by the
activation of autophagy. P62 has been established to contribute to
both autophagy and apoptosis in tumor cells. The
ubiquitin-associated (UBA) domain of P62 can recruit ubiquitinated
proteins, particularly those exposed to oxidants and proteasome
inhibitors (34). Therefore, it was
hypothesized that autophagy may play a role in Doc resistance. The
results revealed that 3MA increased apoptosis in Doc-induced
MDA-MB-231 cells with a markedly low HORMAD1 expression, indicating
that the inhibition of autophagy could increase drug sensitivity.
Concurrently, in MDA-MB-436 cells with a high HORMAD1 expression,
3MA increased the Doc-induced cell viability decrease at low
concentrations of Doc (20 nM), indicating that the inhibition of
autophagy could increase drug sensitivity. However, with the
increase of Doc (40 nM) concentration, this sensitization effect
decreased, and the high expression of HORMAD1 was considered to
have played an unknown role in it. Drug sensitivity was further
detected following HORMAD1 knockdown. The results indicated that
HORMAD1 knockdown and the inhibition of autophagy by 3MA in
MDA-MB-436 cells did not further increase sensitivity to Doc.
Cells in the HORMAD1-knockout group produced more
ROS following the addition of Doc, which may have been the cause of
the increased autophagy in that group. In the present study, the
expression of P62 was both increased by the autophagy inhibitor 3MA
and induced by HORMAD1 overexpression. Furthermore, both 3MA and
HORMAD1 overexpression enhanced the Doc-induced reduction of cell
proliferation. In a previous study of glioma (27), it was revealed that caspase-8 could be
activated by wild-type P62 overexpression and then promote
HAMLET-induced apoptosis, whereas P62 knockdown had the opposite
effect. Furthermore, it was demonstrated that P62 function
following HAMLET treatment requires its C-terminus UBA domain. The
aforementioned study indicated that, in addition to being a marker
of autophagy activation in HAMLET-treated glioma cells, P62 could
also function as an important mediator of the activation of
caspase-8-dependent cell death (27).
In the present study, HORMAD1 knockdown alone could reduce P62
levels and activate autophagy, while HORMAD1 overexpression
increased P62 expression; however, the present results also
demonstrated that HORMAD1 functioned as an antioxidant and was
involved in DNA damage tolerance in TNBC, which potentially plays
critical roles in Doc resistance, rather than in its association
with autophagy. Whether P62 is important in this process will be
addressed in future research.
These results suggested that autophagy may not be
the main factor affecting the sensitivity to Doc, but an
accompanying effect of the transient knockdown of HORMAD1, which
indicates the need for further investigations into the underlying
mechanisms. Therefore, the reason why HORMAD1 plays a role in Doc
resistance in tumors through its basic physiological functions was
explored (32,35).
Chemotherapy is an important TNBC treatment
approach, and taxane chemotherapy is considered one of the most
effective strategies (4). Doc is a
semi-synthetic derivative of paclitaxel, a widely used
chemotherapeutic agent in a variety of cancers. Nevertheless, drug
resistance is an urgent problem in the current treatment of tumors,
particularly for patients with TNBC. Several studies have
investigated the signaling pathways involved in sensitized Doc.
Baicalin induced apoptosis, inhibited metastasis and enhanced Doc
sensitivity through the NF-κB signaling pathway in breast cancer
cells (36). Another study
investigating the effects of HORMAD1 silencing on the gene
expression profile of ovarian cancer cells also indicated that the
NF-κB pathway was inhibited (15).
The PI3K/AKT (37,38) and JNK pathways (39) have also been revealed to be involved.
The study of these involved pathways may contribute to the
treatment of cancer.
There are several reasons for Doc resistance, one of
which is the abnormal expression of apoptosis-related genes. BRCA1
DNA repair associated (BRCA1) and BRCA2 play an important role in
cell proliferation, apoptosis and DNA damage repair. The BRCA1
mutation rate in TNBC is as high as 71%, and the efficacy of Doc
combined with doxorubicin for NAC is poor in patients with breast
cancer with germline BRCA1 mutations (40). MDA-MB-436 is a BRCA1 mutant TNBC cell
line (41). Cancer cells are highly
heterogeneous and cancer cell subtypes can result from the same
mutations, while further mutations lead to different
subpopulations, which may be partly due to individual decisions
made by cells about which survival mechanisms to employ, including
HR repair, fork protection or both (42). In BRCA1 mutant tumors, the recovery of
HR repair may promote tumor cell survival (43). In a study of TNBC, HORMAD1 was
revealed to drive 53BP-1-dependence of non-homologous end-joining
(NHEJ) DNA repair (16), while an
investigation of non-small cell lung cancer demonstrated that the
high HORMAD1 expression led to the expression of a set of
HR-related genes, contributing to the formation of RAD51 filaments
(24), which also explains the
reduced RAD51 expression on HORMAD1 knockdown with Doc treatment,
indicating impaired DNA repair ability. A recent study reported
that HORMAD1 compromises DNA mismatch repair in cancer cells. It
was demonstrated by mass spectrometry that HORMAD1 interacted with
MCM8-MCM9 complex and prevented its efficient nuclear localization.
As a consequence, HORMAD1-expressing cancer cells exhibited reduced
mutL homolog 1 chromatin binding and DNA mismatch repair defects.
Therefore, HORMAD1 expression was associated with an increased
mutation load and genomic instability in several types of cancer
(11). However, whether this is
related to the increased Doc sensitivity caused by HORMAD1
knockdown still requires further study. Therefore, it was indicated
that, in certain types of TNBC tumors, overexpressing HORMAD1 can
repair damaged DNA reduced by Doc, not only through NHEJ but also
through HR.
The various mechanisms of cancer resistance that
have been identified suggested that tumor cells respond uniquely to
individual defects in molecular function rather than to overall
genetic defects, to rebalance the intracellular environment and
ensure tumor cell survival (43).
HORMAD1 reactivation may be one of the manifestations of this
mechanism. Several studies have examined the association between
HORMAD1 expression and PARPi resistance (16,17,44). It
was hypothesized that conventional chemotherapy combined with PARPi
or sequential PARPi could be selected for tumors expressing high
levels of HORMAD1 (45). The
inhibition of PARP expression in cancer tissues may result in
minimal side effects from tumor-specific treatment. Given the rapid
development of siRNA technology (43), determining the role of HORMAD1 in
TNBC, and particularly its mechanism of action in tumor resistance,
could enable the relatively specific targeting of HORMAD1
transcripts in TNBC, providing reliable sensitization to treatment.
Therefore, the limitation of the present study was that no animal
experiments were conducted to verify the results of the cell
experiments.
In conclusion, the level of HORMAD1 was revealed to
be increased in TNBC tissues and cells. HORMAD1 silencing did not
affect TNBC cell proliferation and apoptosis; however, it increased
the sensitivity of TNBC cells to Doc. Human TNBC cells were treated
with Doc, which led to a significantly decreased cell viability,
with an accompanying activation of autophagy; however, the
regulatory association between HORMAD1 and autophagy is not the
cause of drug resistance; rather the role of HORMAD1 in HR and DNA
repair may be the main factor leading to its effects on Doc
sensitivity. The present results provided the basis for future
studies on the biological functions of HORMAD1 in tumors,
particularly TNBC, and for the development of additional
therapeutic clinic approaches. Although further biochemical studies
are required to characterize the physiological properties of
HORMAD1 as an important player in Doc-resistant TNBC cells, the
current findings suggested that HORMAD1 may be an attractive target
for chemotherapy-mediated TNBC therapy.
Supplementary Material
Supporting Data
Acknowledgements
We would like to thank the pathologists Dr Hua Liu
and Dr Xiao Yang at the Department of Pathology (First Affiliated
Hospital of Chongqing Medical University, Chongqing, China) for
their help in finding and sectioning tissues of TNBC samples. We
would also like to thank the technicians at the laboratory of
Chongqing City Key Lab of Translational Medical Research in
Cognitive Development and Disorders (Chongqing, China) for the
experimental guidance and help.
Funding
The present study was supported by the National
Natural Science Foundation of China (grant no. 81772979).
Availability of data and materials
All datasets generated during the present study are
available from the corresponding author upon reasonable
request.
Authors' contributions
BZ and SL designed the research study. BZ, YP, YW,
YZ and YY performed the experiments. BZ, JL, LS, SG and KL analyzed
the data. BZ and SL wrote the paper. All authors read and approved
the final manuscript.
Ethics approval and consent to
participate
The present study was approved by the Ethics
Committee of the First Affiliated Hospital of Chongqing Medical
University (Chongqing, China). The approval number is 2020-279.
Patient consent for publication
Not applicable.
Competing interests
The authors declare that they have no competing
interests.
References
|
1
|
Erratum: Global cancer statistics 2018:
GLOBOCAN estimates of incidence and mortality worldwide for 36
cancers in 185 countries. CA Cancer J Clin. 70:3132020. View Article : Google Scholar
|
|
2
|
den Brok WD, Speers CH, Gondara L, Baxter
E, Tyldesley SK and Lohrisch CA: Survival with metastatic breast
cancer based on initial presentation, de novo versus relapsed.
Breast Cancer Res Treat. 161:549–556. 2017. View Article : Google Scholar : PubMed/NCBI
|
|
3
|
Ruddy KJ and Ganz PA: Treatment of
nonmetastatic breast cancer. JAMA. 321:1716–1717. 2019. View Article : Google Scholar : PubMed/NCBI
|
|
4
|
Gradishar WJ, Anderson BO, Abraham J, Aft
R, Agnese D, Allison KH, Blair SL, Burstein HJ, Dang C, Elias AD,
et al: Breast cancer, version 3.2020, NCCN clinical practice
guidelines in oncology. J Natl Compr Canc Netw. 18:452–478. 2020.
View Article : Google Scholar : PubMed/NCBI
|
|
5
|
Cardoso F, Senkus E, Costa A, Papadopoulos
E, Aapro M, André F, Harbeck N, Aguilar Lopez B, Barrios CH, Bergh
J, et al: 4th ESO-ESMO international consensus guidelines for
advanced breast cancer (ABC 4)†. Ann Oncol. 29:1634–1657. 2018.
View Article : Google Scholar : PubMed/NCBI
|
|
6
|
National Comprehensive Cancer Network, .
NCCN Clinical Practice Guidelines in Oncology-Breast Cancer
(Version 1, 2018). [DB/OL]. http://www.nccn.org
|
|
7
|
Liu P, Kumar IS, Brown S, Kannappan V,
Tawari PE, Tang JZ, Jiang W, Armesilla AL, Darling JL and Wang W:
Disulfiram targets cancer stem-like cells and reverses resistance
and cross-resistance in acquired paclitaxel-resistant
triple-negative breast cancer cells. Br J Cancer. 109:1876–1885.
2013. View Article : Google Scholar : PubMed/NCBI
|
|
8
|
Byrski T, Gronwald J, Huzarski T,
Grzybowska E, Budryk M, Stawicka M, Mierzwa T, Szwiec M, Wisniowski
R, Siolek M, et al: Pathologic complete response rates in young
women with BRCA1-positive breast cancers after neoadjuvant
chemotherapy. J Clin Oncol. 28:375–379. 2010. View Article : Google Scholar : PubMed/NCBI
|
|
9
|
Silver DP, Richardson AL, Eklund AC, Wang
ZC, Szallasi Z, Li Q, Juul N, Leong CO, Calogrias D, Buraimoh A, et
al: Efficacy of neoadjuvant cisplatin in triple-negative breast
cancer. J Clin Oncol. 28:1145–1153. 2010. View Article : Google Scholar : PubMed/NCBI
|
|
10
|
Asano Y, Kashiwagi S, Goto W, Takada K,
Takahashi K, Morisaki T, Fujita H, Takashima T, Tomita S, Ohsawa M,
et al: Prediction of treatment responses to neoadjuvant
chemotherapy in triple-negative breast cancer by analysis of immune
checkpoint protein expression. J Transl Med. 16:872018. View Article : Google Scholar : PubMed/NCBI
|
|
11
|
Liu K, Wang Y, Zhu Q, Li P, Chen J, Tang
Z, Shen Y, Cheng X, Lu LY and Liu Y: Aberrantly expressed HORMAD1
disrupts nuclear localization of MCM8-MCM9 complex and compromises
DNA mismatch repair in cancer cells. Cell Death Dis. 11:5192020.
View Article : Google Scholar : PubMed/NCBI
|
|
12
|
Qiao H, Rao HBDP, Yun Y, Sandhu S, Fong
JH, Sapre M, Nguyen M, Tham A, Van BW, Chng TYH, et al: Impeding
DNA break repair enables oocyte quality control. Mol Cell.
72:211–221.e3. 2018. View Article : Google Scholar : PubMed/NCBI
|
|
13
|
Chen YT, Venditti CA, Theiler G, Stevenson
BJ, Iseli C, Gure AO, Jongeneel CV, Old LJ and Simpson AJ:
Identification of CT46/HORMAD1, an immunogenic cancer/testis
antigen encoding a putative meiosis-related protein. Cancer Immun.
5:92005.PubMed/NCBI
|
|
14
|
Adélaïde J, Finetti P, Bekhouche I,
Repellini L, Geneix J, Sircoulomb F, Charafe-Jauffret E, Cervera N,
Desplans J, Parzy D, et al: Integrated profiling of basal and
luminal breast cancers. Cancer Res. 67:11565–11575. 2007.
View Article : Google Scholar
|
|
15
|
Shahzad MM, Shin YH, Matsuo K, Lu C,
Nishimura M, Shen DY, Kang Y, Hu W, Mora EM, Rodriguez-Aguayo C, et
al: Biological significance of HORMA domain containing protein 1
(HORMAD1) in epithelial ovarian carcinoma. Cancer Lett.
330:123–129. 2013. View Article : Google Scholar : PubMed/NCBI
|
|
16
|
Watkins J, Weekes D, Shah V, Gazinska P,
Joshi S, Sidhu B, Gillett C, Pinder S, Vanoli F, Jasin M, et al:
Genomic complexity profiling reveals that HORMAD1 overexpression
contributes to homologous recombination deficiency in
triple-negative breast cancers. Cancer Discov. 5:488–505. 2015.
View Article : Google Scholar : PubMed/NCBI
|
|
17
|
Wang X, Tan Y, Cao X, Kim JA, Chen T, Hu
Y, Wexler M and Wang X: Epigenetic activation of HORMAD1 in
basal-like breast cancer: Role in Rucaparib sensitivity.
Oncotarget. 9:30115–30127. 2018. View Article : Google Scholar : PubMed/NCBI
|
|
18
|
Guo SP, Jian L, Tao K, Chen C, Yu H and
Liu S: Novel breast-specific long non-coding RNA LINC00993 acts as
a tumor suppressor in triple-negative breast cancer. Front Oncol.
9:13252019. View Article : Google Scholar : PubMed/NCBI
|
|
19
|
Gebhart G, Lamberts L, Wimana Z, Garcia C,
Emonts P, Ameye L, Stroobants S, Huizing M, Aftimos P, Tol J, et
al: Molecular imaging as a tool to investigate heterogeneity of
advanced HER2-positive breast cancer and to predict patient outcome
under trastuzumab emtansine (T-DM1): The ZEPHIR trial. Ann Oncol.
27:619–624. 2016. View Article : Google Scholar : PubMed/NCBI
|
|
20
|
Livak KJ and Schmittgen TD: Analysis of
relative gene expression data using real-time quantitative PCR and
the 2(-Delta Delta C(T)) method. Methods. 25:402–408. 2001.
View Article : Google Scholar : PubMed/NCBI
|
|
21
|
Basu A: Regulation of autophagy by protein
kinase C-ε in breast cancer cells. Int J Mol Sci. 21:42472020.
View Article : Google Scholar : PubMed/NCBI
|
|
22
|
Chen B, Tang H, Chen X, Zhang G, Wang Y,
Xie X and Liao N: Transcriptomic analyses identify key
differentially expressed genes and clinical outcomes between
triple-negative and non-triple-negative breast cancer. Cancer Manag
Res. 11:179–190. 2018. View Article : Google Scholar : PubMed/NCBI
|
|
23
|
Tomioka N, Azuma M, Ikarashi M, Yamamoto
M, Sato M, Watanabe KI, Yamashiro K and Takahashi M: The
therapeutic candidate for immune checkpoint inhibitors elucidated
by the status of tumor-infiltrating lymphocytes (TILs) and
programmed death ligand 1 (PD-L1) expression in triple negative
breast cancer (TNBC). Breast Cancer. 25:34–42. 2018. View Article : Google Scholar : PubMed/NCBI
|
|
24
|
Nichols BA, Oswald NW, McMillan EA,
McGlynn K, Yan J, Kim MS, Saha J, Mallipeddi PL, LaDuke SA,
Villalobos PA, et al: HORMAD1 is a negative prognostic indicator in
lung adenocarcinoma and specifies resistance to oxidative and
genotoxic stress. Cancer Res. 78:6196–6208. 2018. View Article : Google Scholar : PubMed/NCBI
|
|
25
|
Yao J, Caballero OL, Yung WK, Weinstein
JN, Riggins GJ, Strausberg RL and Zhao Q: Tumor subtype-specific
cancer-testis antigens as potential biomarkers and
immunotherapeutic targets for cancers. Cancer Immunol Res.
2:371–379. 2014. View Article : Google Scholar : PubMed/NCBI
|
|
26
|
Levine B and Kroemer G: Biological
functions of autophagy genes: A disease perspective. Cell.
176:11–42. 2019. View Article : Google Scholar : PubMed/NCBI
|
|
27
|
Zhang YB, Gong JL, Xing TY, Zheng SP and
Ding W: Autophagy protein p62/SQSTM1 is involved in HAMLET-induced
cell death by modulating apotosis in U87MG cells. Cell Death Dis.
4:e5502013. View Article : Google Scholar : PubMed/NCBI
|
|
28
|
Chick JM, Munger SC, Simecek P, Huttlin
EL, Choi K, Gatti DM, Raghupathy N, Svenson KL, Churchill GA and
Gygi SP: Defining the consequences of genetic variation on a
proteome-wide scale. Nature. 534:500–505. 2016. View Article : Google Scholar : PubMed/NCBI
|
|
29
|
Aravind L and Koonin E: The HORMA domain:
A common structural denominator in mitotic checkpoints, chromosome
synapsis and DNA repair. Trends Biochem Sci. 23:284–286. 1998.
View Article : Google Scholar : PubMed/NCBI
|
|
30
|
Daniel K, Lange J, Hached K, Fu J,
Anastassiadis K, Roig I, Cooke HJ, Stewart AF, Wassmann K, Jasin M,
et al: Meiotic homologue alignment and its quality surveillance are
controlled by mouse HORMAD1. Nat Cell Biol. 13:599–610. 2011.
View Article : Google Scholar : PubMed/NCBI
|
|
31
|
Nielsen AY and Gjerstorff MF: Ectopic
expression of testis germ cell proteins in cancer and its potential
role in genomic instability. Int J Mol Sci. 17:8902016. View Article : Google Scholar : PubMed/NCBI
|
|
32
|
Shin YH, Choi Y, Erdin SU, Yatsenko SA,
Kloc M, Yang F, Wang PJ, Meistrich ML and Rajkovic A: Hormad1
mutation disrupts synaptonemal complex formation, recombination,
and chromosome segregation in mammalian meiosis. PLoS Genet.
6:e10011902010. View Article : Google Scholar : PubMed/NCBI
|
|
33
|
Nanji T, Liu X, Chew LH, Li FK, Biswas M,
Yu ZQ, Lu S, Dong MQ, Du LL, Klionsky DJ and Yip CK: Conserved and
unique features of the fission yeast core Atg1 complex. Autophagy.
13:2018–2027. 2017. View Article : Google Scholar : PubMed/NCBI
|
|
34
|
Galluzzi L, Baehrecke EH, Ballabio A, Boya
P, Bravo-San Pedro JM, Cecconi F, Choi AM, Chu CT, Codogno P,
Colombo MI, et al: Molecular definitions of autophagy and related
processes. EMBO J. 36:1811–1836. 2017. View Article : Google Scholar : PubMed/NCBI
|
|
35
|
Acquaviva L, Boekhout M, Karasu ME, Brick
K, Pratto F, Li T, van Overbeek M, Kauppi L, Camerini-Otero RD,
Jasin M and Keeney S: Ensuring meiotic DNA break formation in the
mouse pseudoautosomal region. Nature. 582:426–431. 2020. View Article : Google Scholar : PubMed/NCBI
|
|
36
|
Zeng A, Liang X, Zhu S, Liu C, Luo X,
Zhang Q and Song L: Baicalin, a potent inhibitor of NF-κB signaling
pathway, enhances chemosensitivity of breast cancer cells to
docetaxel and inhibits tumor growth and metastasis both in vitro
and in vivo. Front Pharmacol. 11:8792020. View Article : Google Scholar : PubMed/NCBI
|
|
37
|
Singh SK, Apata T, Gordetsky JB and Singh
R: Docetaxel combined with thymoquinone induces apoptosis in
prostate cancer cells via inhibition of the PI3K/AKT signaling
pathway. Cancers (Basel). 11:11392019. View Article : Google Scholar
|
|
38
|
Zhang X, Shao J, Li X, Cui L and Tan Z:
Docetaxel promotes cell apoptosis and decreases SOX2 expression in
CD133-expressing hepatocellular carcinoma stem cells by suppressing
the PI3K/AKT signaling pathway. Oncol Rep. 41:1067–1074.
2019.PubMed/NCBI
|
|
39
|
Dávila-González D, Choi DS, Rosato RR,
Granados-Principal SM, Kuhn JG, Li WF, Qian W, Chen W, Kozielski
AJ, Wong H, et al: Pharmacological inhibition of NOS activates
ASK1/JNK pathway augmenting docetaxel-mediated apoptosis in
triple-negative breast cancer. Clin Cancer Res. 24:1152–1162. 2018.
View Article : Google Scholar
|
|
40
|
Byrski T, Gronwald J, Huzarski T,
Grzybowska E, Budryk M, Stawicka M, Mierzwa T, Szwiec M, Wiśniowski
R, Siolek M, et al: Response to neo-adjuvant chemotherapy in women
with BRCA1-positive breast cancers. Breast Cancer Res Treat.
108:289–296. 2008. View Article : Google Scholar : PubMed/NCBI
|
|
41
|
Du Y, Yamaguchi H, Wei Y, Hsu JL, Wang HL,
Hsu YH, Lin WC, Yu WH, Leonard PG, Lee GR IV, et al: Blocking
c-Met-mediated PARP1 phosphorylation enhances anti-tumor effects of
PARP inhibitors. Nat Med. 22:194–201. 2016. View Article : Google Scholar : PubMed/NCBI
|
|
42
|
Schlacher K: A new road to cancer-drug
resistance. Nature. 563:478–480. 2018. View Article : Google Scholar : PubMed/NCBI
|
|
43
|
Shahzad MM, Lu C, Lee JW, Stone RL, Mitra
R, Mangala LS, Lu Y, Baggerly KA, Danes CG, Nick AM, et al: Dual
targeting of EphA2 and FAK in ovarian carcinoma. Cancer Biol Ther.
8:1027–1034. 2009. View Article : Google Scholar : PubMed/NCBI
|
|
44
|
Gao Y, Kardos J, Yang Y, Tamir TY,
Mutter-Rottmayer E, Weissman B, Major MB, Kim WY and Vaziri C: The
cancer/testes (CT) antigen HORMAD1 promotes homologous
recombinational DNA repair and radioresistance in lung
adenocarcinoma cells. Sci Rep. 8:153042018. View Article : Google Scholar : PubMed/NCBI
|
|
45
|
Dubois C, Martin F, Hassel C, Magnier F,
Daumar P, Aubel C, Guerder S, Mounetou E, Penault-Lorca F and
Bamdad M: Low-dose and long-term Olaparib treatment sensitizes
MDA-MB-231 and SUM1315 triple-negative breast cancers spheroids to
fractioned radiotherapy. J Clin Med. 9:642019. View Article : Google Scholar : PubMed/NCBI
|