Introduction
Rearrangements of lysine methyltransferase 2A
(KMT2A, also known as MLL) gene at chromosome 11q23
account for ~10% of all acute leukemia (AL) cases, but are also
present in most infant ALs and therapy-associated acute myeloid
leukemia (AML), which were previously treated with topoisomerase II
inhibitors for other cancers (1).
Although >94 fusion partner genes have been found
to fuse with MLL, AF4 (AFF1), AF9
(MLLT3), ENL (MLLT1), AF10
(MLLT10), ELL and AF6 (MLLT4) are the
most frequent fusion partners found in Als (2). MLL translocations (MLL-t)
confer a poor prognosis in AL, especially MLL/AF6 and
MLL/AF10 in AML (3,4). MLL-t alters MLL methyltransferase
activity and leads to dysregulation of MLL downstream genes,
such as HOXA7-A10, which subsequently impairs hematopoietic
lineage commitment and induces leukemia development (5,6). In
addition to Hoxa7-Hoxa10 genes, sustained Hoxa11
expression has been detected in the MLL/ENL immortalized
myeloid cell line (7). Chromosomal
translocation t(7;11)(p15;p15) encoding NUP98/HOXA11 fusion
has been recurrently detected in chronic myeloid leukemia and
juvenile myelomonocytic leukemia (8,9).
HOXA11, HOXA10, HOXA7 and HOXA4 are downregulated
during monocyte-macrophage differentiation in a human leukemic
THP-1 cell line (10). In contrast to
HOXA7-HOXA10, the leukemogenic potential of HOXA11 is
not well characterized. In addition to participating in
leukemogenesis, the HOX family of genes are involved in
organ development. In a homeobox swap experiment, it was discovered
that Hoxa10 could partially replace the role of
Hoxa11 in regulating skeletal phenotypes and reproductive
tract development (11). However,
whether these different Hoxa genes are functionally
interchangeable or complementary in leukemogenesis is not
clear.
Cases of AL with MLL-t are frequently found
to harbor RAS pathway mutations, including N-/K-RAS
and tyrosine-protein phosphatase non-receptor type 11
(PTPN11) activating mutations. The mutation rate of
KRAS ranges from 7.2~42.4%, whereas that for NRAS is
5.3~24.7% and that for PTPN11 is 1~4.8% (12–15). The
impact of RAS pathway mutations on MLL-t AL is
controversial. This is likely due to varied mutant allele
frequencies of RAS pathway mutations in patients (16,17). We
and others have established mouse models with results supporting
that cooperation of MLL-t with activating
N-/K-RAS or PTPN11 mutations accelerate
leukemia progression (18–22). Activating N-/K-RAS mutations
constitutively activate the downstream signaling cascades
controlling cell proliferation, apoptosis, differentiation and cell
cycle progression (23). Activating
PTPN11 mutations can induce myeloid cell hypersensitivity to
growth factors, including granulocyte monocyte-colony stimulating
factor and interleukin (IL)-3, and enhance cell cycle progression
(22,24,25). We
also previously demonstrated that cooperation of MLL-t with
activating PTPN11 mutations increased cytarabine (Ara-C)
sensitivity in leukemia cells (22).
The underlying mechanism and key downstream players
that accelerate leukemia development and Ara-C sensitivity by
cooperating mutations have not been clearly illustrated. Thus, in
the present study, transcriptomic profiles were compared between
mouse MLL/AF10(OM-LZ) leukemia cells carrying wild-type and
activating KRAS or PTPN11 to identify differentially
expressed genes (DEGs) involved in survival and drug sensitivity.
One such upregulated DEG, Hoxa11, was further investigated
to characterize its roles in leukemia cell differentiation,
proliferation, survival and Ara-C sensitivity.
Materials and methods
Cell culture
The mouse MLL/AF10(OM-LZ) leukemia cell line
(12G) and MLL/AF10(OM-LZ) cells harboring wild-type or
activating KRAS (KRASG12C) and wild-type
or activating PTPN11 (PTPN11G503A) were
generated by the retroviral transduction of genes to 5-fluorouracil
(5-FU)-enriched C57BL/6J (B6) mouse bone marrow (BM) cells. The
mice were purchased from the National Laboratory Animal Center.
These different cell types were either generated in the current
study (AKw1G) or in previous studies (AK2G, AK3G, APw1 and APm1)
(21,22,26)
(Fig. 1A). All of these cell lines
expressed the myelomonocytic markers. Mouse leukemia cells were
cultured in the RPMI-1640 medium (Gibco; Thermo Fisher Scientific,
Inc.) with 20% fetal bovine serum (Hyclone; Cytiva), 2 mM
L-glutamine, 100 µM 2-mercaptoethanol and 10 ng/ml IL-3 (R&D
Systems, Inc.) for maintenance and proliferation analysis.
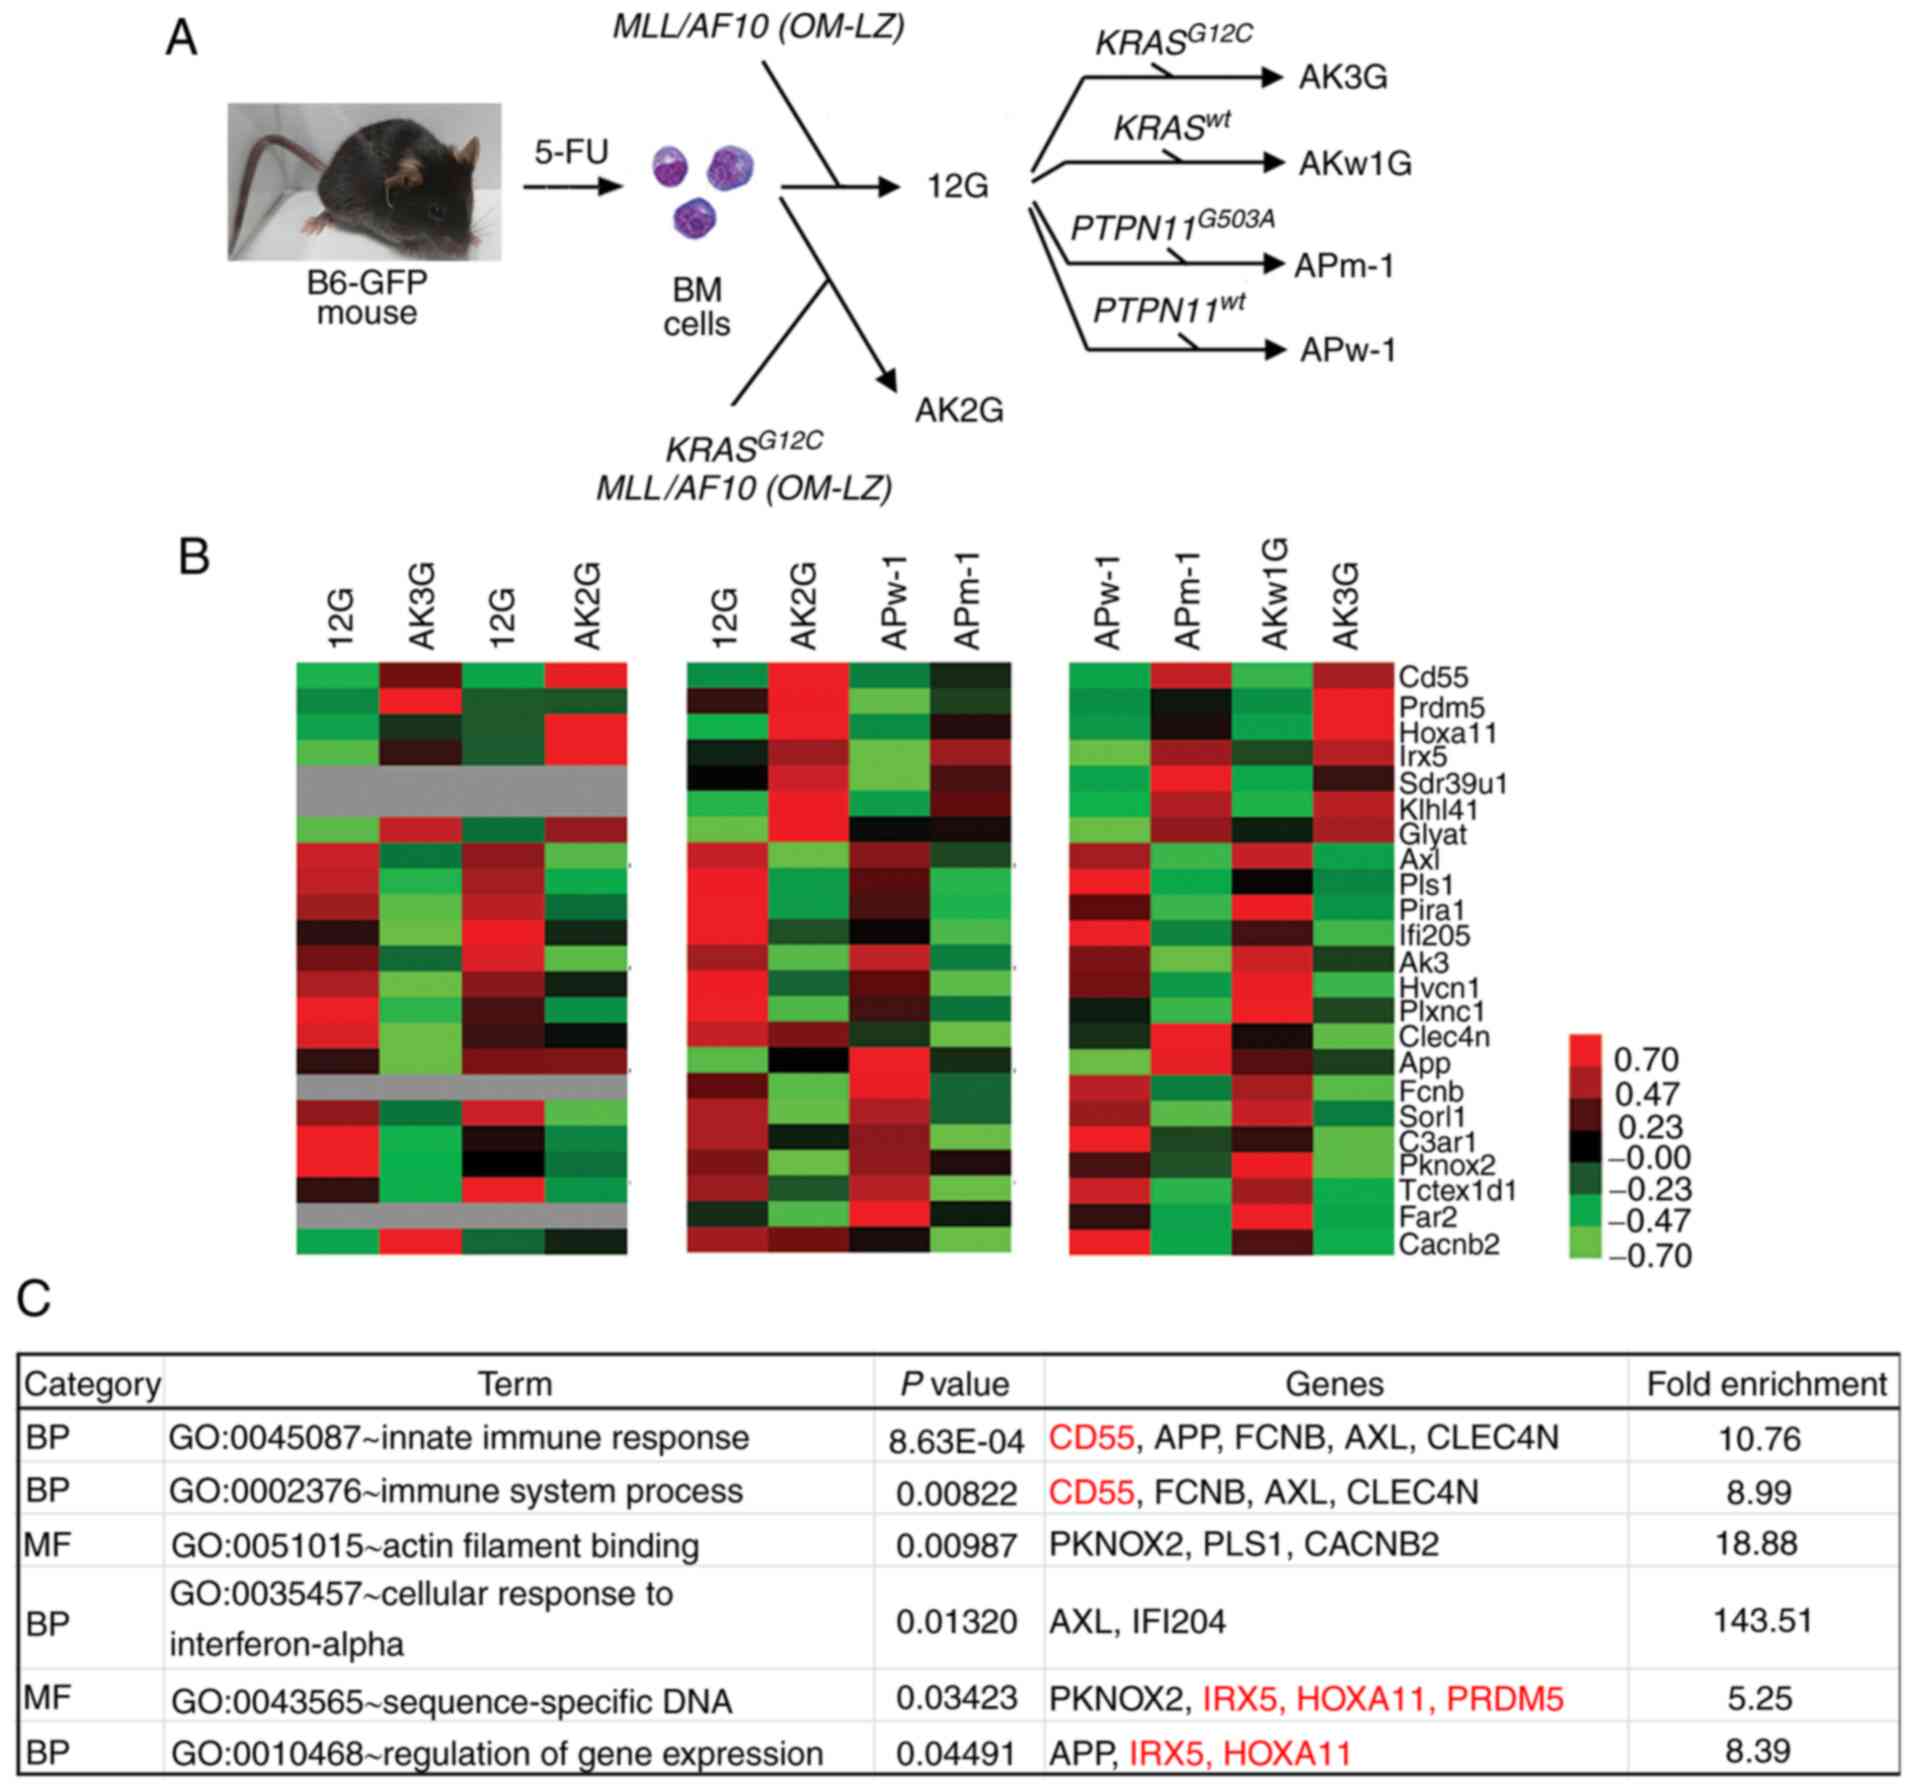 | Figure 1.Identification of DEGs between paired
MLL/AF10(OM-LZ) leukemia cells harboring wild-type and
RAS pathway mutations. (A) Establishment of immortalized
cell lines by retroviral transduction of 5-FU-enriched bone marrow
cells with MLL/AF10(OM-LZ) alone (12G) or in combination
with wild-type KRAS (AKw1G) or oncogenic KRASG12C
(AK2G, AK3G), and wild-type PTPN11 (APw-1) or oncogenic
PTPN11G503A (APm-1). (B) Heat map representing relative gene
expression levels of 23 DEGs between paired cell lines based on
cDNA microarray data. Different Affymetrix chips were used for the
following paired cell lines: 12G vs. AK3G and 12G vs. AK2G (430A);
12G vs. AK2G and APw-1 vs. APm-1 (430_2), APw-1 vs. APm-1 and AKw1G
vs. AK3G (Clariom D). Raw values were log2-transformed and centered
relative to the median. A heat map was obtained using Cluster
version 3.0 and Java TreeView version 1.1.6r4. The color bar
depicts the color contrast level of the heat map, in which red and
green indicates high and low expression, respectively. Grey
indicates genes absent in the Affymetrix 430A chip. (C) Enriched GO
terms of ‘BP’ and ‘MF’ for the 23 identified DEGs. All GO terms
listed in the table show significant enrichment (all P<0.05).
Red and black indicate genes that are upregulated or downregulated,
respectively, in MLL/AF10 cell lines harboring RAS
pathway mutations. DEGs, differentially expressed genes; MLL,
lysine methyltransferase 2A; GO, Gene Ontology; BP, biological
process; MF, molecular function; PTPN11, tyrosine-protein
phosphatase non-receptor type 11; BM, bone marrow; 12G, cells with
MLL/AF10(OM-LZ) alone; AK3G, cells with
MLL/AF10(OM-LZ) and oncogenic KRASG12C; AKw1G, cells
with MLL/AF10(OM-LZ) and wild-type KRAS; APw-1, cells
with MLL/AF10(OM-LZ) and wild-type PTPN11; APm-1,
cells with MLL/AF10(OM-LZ) and oncogenic PTPN11G503A;
PTPN11, tyrosine-protein phosphatase non-receptor type
11. |
Microarray analysis and Gene Ontology
(GO) enrichment analysis
The total RNA of leukemia cells was prepared using
TRIzol® reagent (Gibco; Thermo Fisher Scientific, Inc.).
The RNA was amplified, labeled and hybridized to the mouse genome
430A Array chip (12G vs. AK3G and 12G vs. AK2G), 430 2.0 Array chip
(12G vs. AK2G and APw-1 vs. APm-1), or Clariom D Array chip (APw-1
vs. APm-1 and AKw1G vs. AK3G) (Affymetrix; Thermo Fisher
Scientific, Inc.) according to the manufacturer's instructions
(this procedure was performed by staff of the Genomic Medicine
Research Core Laboratory at Chang Gung Memorial Hospital, Linkou,
Taiwan). Microarray data are available at the NCBI Gene Expression
Omnibus (GEO) website (https://www.ncbi.nlm.nih.gov/geo/; accession nos.
GSE82156 and GSE134586) or can be downloaded from Chang Gung
University website (21).
Differential Expression Analysis was performed using Transcriptome
Analysis Console software version 4.0 (Affymetrix; Thermo
Fisher). A heat map was obtained using Cluster version 3.0
(http://bonsai.hgc.jp/~mdehoon/software/cluster/)
and Java TreeView version 1.1.6r4 (http://jtreeview.sourceforge.net). DEGs with
>1.5-fold-change in paired MLL/AF10 leukemia cells
harboring wild-type and oncogenic KRAS or PTPN11 were
then functionally annotated with GO enrichment analysis using
online Database for Annotation, Visualization and Integrated
Discovery (DAVID) version 6.8 annotation tools (https://david.ncifcrf.gov/). Statistical significance
was evaluated using Fisher's exact test and corrected by Bonferroni
correction for multiple testing. The GO ‘Molecular Function’ (MF)
or ‘Biological Process’ (BP) categories with P<0.05 were
considered statistically significant.
Validation of HOXA11 expression in
patients with AML
To validate the differential expression and drug
responsiveness of HOXA11 in MLL-t AML, a
meta-analysis was performed using the Oncomine™ database
(https://www.oncomine.org/), including
Valk leukemia, Wouters leukemia, Balgobind leukemia, and Haferlach
leukemia (27–30).
Reverse transcription-quantitative
polymerase chain reaction (RT-qPCR)
To evaluate the expression levels of target genes,
the total RNA of mouse leukemia cells or AML patient BM cells was
extracted using TRIzol® reagent (Invitrogen; Thermo
Fisher). The total RNA was reverse transcribed into complementary
DNA (cDNA) using random hexamers and SuperScript™ II reverse
transcriptase (Thermo Fisher) according to the manufacturer's
protocol. qPCR was performed using SYBR-Green PCR master mix
(Applied Biosystems; Thermo Fisher Scientific, Inc.) and analyzed
by ABI Prism 7900 system (Applied Biosystems; Thermo Fisher
Scientific, Inc.). Primer sets were as follows: Mouse
Hoxa11, 5′-GAAAACCTCGCTTCCTCCGA-3′ and
5′-ATAAGGGCAGCGCTTTTTGC-3′; mouse NF-κB inhibitor α
(Nfkbia), 5′-GAGACCTGGCCTTCCTCAAC-3′ and
5′-TCTCGGAGCTCAGGATCACA-3′; mouse transcription factor p65
(Rela), 5′-TGGCTACTATGAGGCTGACCT-3′ and
5′-TGGTCTGGATTCGCTGGCTA-3′; mouse transformation-related protein
p53 (Trp53), 5′-CCTCTCCCCCGCAAAAGAAA-3′ and
5′-GGCCCTTCTTGGTCTTCAGG-3′; mouse Gapdh,
5′-TTCACCACCATGGAGAAGGC-3′ and 5′-GGCATGGACTGTGGTCATGA-3′; human
HOXA11, 5′-CGTCTTCCGGCCACACTGA-3′ and
5′-AGACGCTGAAGAAGAACTCCC-3′; and human ABL,
5′-TGGAGATAACACTCTAAGCATAACTAAAGG-3′ and
5′-GATGTAGTTGCTTGGGACCCA-3′. The thermocycling conditions were as
follows: 95°C for 2 min; then 40 cycles of 95°C for 15 sec and 65°C
for 30 sec. The gene expression levels of mouse genes and human
HOXA11 were normalized against the housekeeping genes
Gapdh and ABL, respectively. Fold-change was
calculated using the 2−∆∆Cq method (31). In the present study, leftover BM
samples of clinical examination for initial diagnostic work-up of
AML were used for gene expression analysis. Samples were obtained
from patients admitted to Chang Gung Memorial Hospital (Taipei,
Taiwan) between January 2002 and December 2010. The inclusion
criteria were as follows: Adults and children with AML with
MLL-t. The exclusion criteria were as follows:
Non-MLL-t AML specimens. Among the 114 cases with
MLL-t AML (56 men and 58 women, age range 0–84 years, median
27 years), it was determined that eight cases with MLL/AF10
or MLL/AF9 had sufficient remaining specimens available for
HOXA11 expression level analysis. Of these eight cases, five
had KRAS mutations and one had a PTPN11 mutation.
Western blot analysis
Total cell lysate from 5×10⁶ leukemia
cells was prepared by direct lysis of cells with RIPA buffer [20 mM
Tris-Cl (pH 7.5) 150 mM NaCl, 1% Triton X-100, 1% Nonidet P-40,
0.5% sodium deoxycholate, 0.1% sodium dodecyl sulfate, 0.5 mM
PMSF]. The amount of total protein was assayed using a
Pierce® BCA Protein Assay (Pierce; Thermo Fisher
Scientific, Inc.). The lysates (20 µg/lane) were electrophoresed on
10% polyacrylamide gel, and subsequently transferred to an
Immobilon membrane (EMD Millipore). The membrane was blocked in 5%
bovine serum albumin at 4°C (Sigma-Aldrich; Merck KGaA) for 1 h,
and then incubated with primary antibodies at 4°C overnight against
mouse Hoxa11 (1:5,000; cat. no. NBP1-80228; Novus Biologicals,
Ltd.), β-actin or Gapdh (1:10,000; cat. nos. sc-47778 or sc-32233;
Santa Cruz Biotechnology, Inc.), followed by incubation for 2 h at
room temperature with horseradish peroxidase-conjugated anti-mouse
or anti-rabbit IgG secondary antibodies (1:5,000; cat. nos. C04001
or C04003; Croyez Bioscience Co., Ltd.). Western blots were
developed with a Western Lightning Plus ECL kit (PerkinElmer, Inc.)
and the images were visualized by Analytik Jena™ UVP ChemStudio
PLUS and VisionWorks™ software (version 9.0; Analytik Jena
US LLC).
In vivo leukemogenesis
The in vivo leukemogenic potential of the
leukemia cell lines was determined by BM transplantation assay
using male B6 mice (n=45, age, 6–8 weeks; weight, 20–24 g). Mice
were maintained in pathogen-free devices under a controlled animal
housing conditions (temperature 20±3°C, humidity 60–70% with a 12-h
light /dark cycle and access to food and water ad libitum).
Briefly, leukemia cells (APm1-shV, APm1-shH11-2, 12G-V, and
12G-H11) were intraperitoneally (i.p.) injected into mice
(1×10⁶ cells/100 µl 1X PBS/mouse; n=10 mice for each
leukemia cell line) that had received a sublethal dose of
γ-irradiation (5.25 Gy) unless otherwise stated. Mice i.p. injected
with normal saline (n=5) served as controls. To monitor leukemia
development, peripheral blood (100 µl) was collected weekly for
cytologic analysis and complete blood count measurement using
Hemavet 950 (Drew Scientific; Erba Diagnostics, Inc.) or BC-5000
(Mindray Medical International Limited) hemocytometers. Mice were
sacrificed when moribund (7–15 weeks post-injection). The moribund
state was defined as mice displaying leukocytosis, with hunched
posture, weakness, shortness of breath and 20% weight loss. Mice
were euthanized by an i.p. injection of Zoletil (50 mg/kg) and
Rompun (xylazine, 10 mg/kg) or by inhalation of isoflurane (3–5%),
followed by cervical dislocation (32). BM, peripheral blood, ascites, organs
and tumor masses were collected and weighed.
Gene knockdown by short hairpin RNA
(shRNA)
To generate stable gene knockdown cell lines, AK3G
or APm-1 cells were infected with lentivirus expressing shRNA
against Hoxa11 [The RNAi Consortium (cat. nos.
TRCN0000413738 and TRCN0000417739)] at a multiplicity of infection
of 1 and selected in RPMI-1640 medium containing puromycin (2.5
µg/ml) for a total of 2 weeks. A third generation system was used.
Cells stably transfected with blank lentiviral vector pLKO_025 were
used as negative controls. All lentiviruses were obtained from the
National RNAi Core Facility at the Institute of Molecular
Biology/Genomic Research Center, Academia Sinica (Taiwan).
Ectopic expression of Hoxa11
The full-length Hoxa11 gene (~1 Kb) was
amplified from cDNA of AK3G cells by PCR using the following
primers: 5′-GAAGATCTCCCAAGGTAGCCCAATGATG-3′ and
5′-CCGCTCGAGCCAGTAGGCTGGAGCCTTAG-3′. The PCR product was digested
with restriction enzymes BglII and XhoI, and was
subsequently cloned into the BglII and XhoI sites of
the retroviral vector pMSCVpuro (Clontech Laboratories, Inc.). The
fidelity of nucleotide sequences of the Hoxa11 gene was
confirmed by Sanger sequencing. Plasmid DNAs of pMSCV-Hoxa11
and pMSCVpuro were transfected into EcoPack2-293 cells (Invitrogen;
Thermo Fisher Scientific, Inc.) to package retroviruses. Viral
titer was determined by infection of NIH/3T3 (American Type Culture
Collection; ATCC® CRL-1658™), a murine fibroblast cell
line, with serial diluted supernatant to generate
puromycin-resistant colonies. To generate 12G cell lines with
ectopic expression of Hoxa11 (12G-H11-1 and 12G-H11-2), 12G
cells were mixed with retroviruses at a 1:1 ratio and selected in
RPMI complete medium containing puromycin (2.5 µg/ml) for a total
of 2 weeks. The cells transduced with MSCVpuro retroviruses were
used as negative controls (12G-V1 and 12G-V3). The presence of
Hoxa11 gene was confirmed by PCR amplification of the 1-Kb
product from the genomic DNA of 12G-H11 cell lines using cloning
primers. The fidelity of nucleotide sequences of Hoxa11 was
confirmed by Sanger sequencing.
Phenotypic and Ara-C resistance
analyses
For cytologic analysis, cells were cytospinned at
700 × g for 3 min or smeared, air-dried, and stained with Liu
reagents (Tonyar Biotech, Inc.) at room temperature. For
immunophenotypic analysis, cells were stained at 4°C for 15 min
with phycoerythrin-macrophage-1 antigen (Mac-1),
phycoerythrin-CD115 and allophycocyanine-Ki-67 antibodies (cat.
nos. RM2804-3, 12-1152-82 and 17-5698-82; eBioscience; Thermo
Fisher) followed by flow cytometric analysis using FACSCanto II
Cell Analyzer and FACSDiva software version 5.0 (BD
Biosciences). For cell proliferation analysis, cells were assessed
at indicated time points using Cell Counting Kit-8 (CCK-8/WST-8;
Dojindo Molecular Technologies, Inc.) according to the
manufacturer's instructions. To determine Ara-C resistance, cells
were cultured in RPMI-1640 complete medium and a gradient
concentration of Ara-C (0, 128, 320, 640, 1,600, 3,200, 16,000 or
40,000 ng/ml) for 24 h. Cell viability was measured using CCK-8
(incubation time 2 h). To determine apoptotic cell rate, cells were
treated with Ara-C (0 or 160 ng/ml) for 24 h, followed by
Annexin-V/propidium iodide (Sigma-Aldrich; Merck KGaA) staining in
the dark and flow cytometric analysis using a FACSCanto II Cell
Analyzer and FACSDiva software version 5.0 (BD
Biosciences).
Competitive engraftment and clonal
expansion assay
The competitive engraftment and clonal expansion
assay was described previously (22,33).
Briefly, paired cells (AK3G-shV vs. AK3G-shH11 and 12G-V vs.
12G-H11) were mixed at a ratio of 1:1 and then i.p. injected into
B6 mice (1×10⁶ cells/mouse). The mice were sacrificed at
days 43 and 57. Mice BMs and spleens were collected and used to
extract genomic DNA. To amplify 300-bp DNA fragments of the
pMSCVpuro vector (from 12G-V) or the region spanning the
pMSCVpuro-Hoxa11 junction (from 12G-H11) from genomic DNA,
PCR was performed using the following primers: MSCV 5′ primer
5′-CCCTTGAACCTCCTCGTTCAGCC-3′ in combination with MSCV 3′ primer
5′-GAGACGTGCTACTTCCATTTGTC-3′ or Hoxa11 primer
5′-GAGTAGCAGTGGGCCAGATTGC-3′. The PCR products were sequenced using
MSCV 5′ primer, and the peak height of the 62th nucleotide (C for
12G-H11 and T for 12G-V) was measured. The (C/C+T) peak height
ratio was converted to the cell ratio (12G-H11/12G-H11+12G-V) by
aligning to the standard curve. The standard curve was generated by
assessing the relationship between nucleotide peak height ratios
and cell ratios from cell mixtures with mixed paired cells in
ratios of 10:0, 9:1, 8:2, 7:3, 6:4, 5:5, 4:6, 3:7, 2:8, 1:9 and
0:10.
Ethics statement
All animal experiments were performed in accordance
with the Guide for the Care and Use of Laboratory Animals published
by National Institutes of Health (publication no. 85–23, revised
1996) and were carried out according to the protocol approved by
the Animal Research Committee of Chang Gung Memorial Hospital
(IACUC No. 2014092403; Taoyuan, Taiwan). Human sample collection
was conducted in accordance with the Declaration of Helsinki and
was approved by the Chang Gung Memorial Hospital Research Ethics
Committee (IRB No. 96-1748B). Written informed consent was obtained
from all patients. For patients under the age of 18,
consent/permission was obtained from the parents/guardians.
Statistical analysis
Statistical analyses were performed using SPSS
software version 20.0 (SPSS, Inc). The statistical
significance of differences in gene expression levels of the two
groups was compared using a Mann-Whitney test. Survival analysis
was conducted according to the Kaplan-Meier method, and differences
in survival were assessed using the log-rank test. Drug sensitivity
was compared using an unpaired two-sample Student's t-test.
P<0.05 was considered to indicate a statistically significant
difference.
Results
Identification of DEGs and GO
enrichment analysis
Our previous studies demonstrated that mice
transplanted with AK2G, AK3G or APm-1 had shorter survival than
those transplanted with the 12G and APw-1, respectively (21,22,26).
Moreover, APm-1 cells have been reported to be more resistant to
daunorubicin, but more sensitive to Ara-C than APw-1 cells
(22). To identify genes involved in
the acceleration of leukemia development and drug resistance by
cooperation of MLL/AF10 with RAS signaling mutations,
transcriptomic profiling were compared between 6 paired
MLL/AF10(OM-LZ) leukemia cells harboring wild-type and
oncogenic KRAS (12G vs. AK3G, 12G vs. AK2G and AKw1G vs.
AK3G) or PTPN11 (APw-1 vs. APm-1) using cDNA microarray
data. A total of 23 DEGs (seven upregulated and 16 downregulated)
with >1.5-fold-change were identified in AK3G and APm-1 cell
lines compared with 12G/AKw1G and APw-1 cells, respectively
(Fig. 1B). The GO terms ‘BP’ and ‘MF’
enriched in the 23 DEGs included ‘innate immune response’, ‘immune
system process’, ‘actin filament binding’, ‘cellular response to
interferon-alpha’, ‘sequence-specific DNA’ and ‘regulation of gene
expression’ (Fig. 1C). Among these
enriched GO terms, three terms (‘innate immune response’, ‘immune
system process’ and ‘cellular response to interferon-alpha’) are
related to the immune response; ‘actin filament binding’ is related
to cell protrusion and migration, while the last two terms
(‘sequence-specific DNA’ and ‘regulation of gene expression’) are
related to the regulation of gene expression by transcription
factors.
Expression of transcription factors in
patients with AML with MLL-t and/or RAS signaling mutations
A total of four genes, Hoxa11, PR domain zinc
finger protein 5 (Prdm5), Iroquois-class homeodomain protein
IRX-5 (Irx5) and homeobox protein PKNOX2 (Pknox2),
were mapped to the GO ‘BP’ term ‘sequence-specific DNA’; other than
Pknox2, these genes were upregulated in the AK3G and APm-1
cell lines according to cDNA microarray data (Fig. 1B). To investigate whether these genes
were upregulated in the patients with AML with MLL-t,
KRAS or PTPN11 mutations, meta-analysis was performed
using datasets deposited by Valk (285 AML cases), Wouters (503 AML
cases), Haferlach (542 AML cases), and Balgobind (237 childhood AML
cases) in the Oncomine™ clinical research data repository for gene
expression change. The results revealed that two (Balgobind and
Haferlach) of the four AML series showed significant differences
(P<0.01) in HOXA11 expression for patients with AML with
or without MLL-t (11q23-r) using reporter ID 208493
(Fig. 2A). One (Valk) of the two AML
series showed significant differences (P<0.05) in HOXA11
expression for patients with AML with or without KRAS
activating mutations (KRASm) (Fig.
2B). In the Balgobind series, there was a trend of higher
HOXA11 expression in patients with AML with PTPN11
mutations than those without PTPN11 mutations, but the
difference was not statistically significant (Fig. 2C). This is probably due to the low
case numbers (n=5). On the other hand, there were no significant
differences in IRX5 and PRDM5 expression in leukemia
cells of patients with AML with or without MLL-t,
KRAS or PTPN11 mutations (Fig. S1A-F).
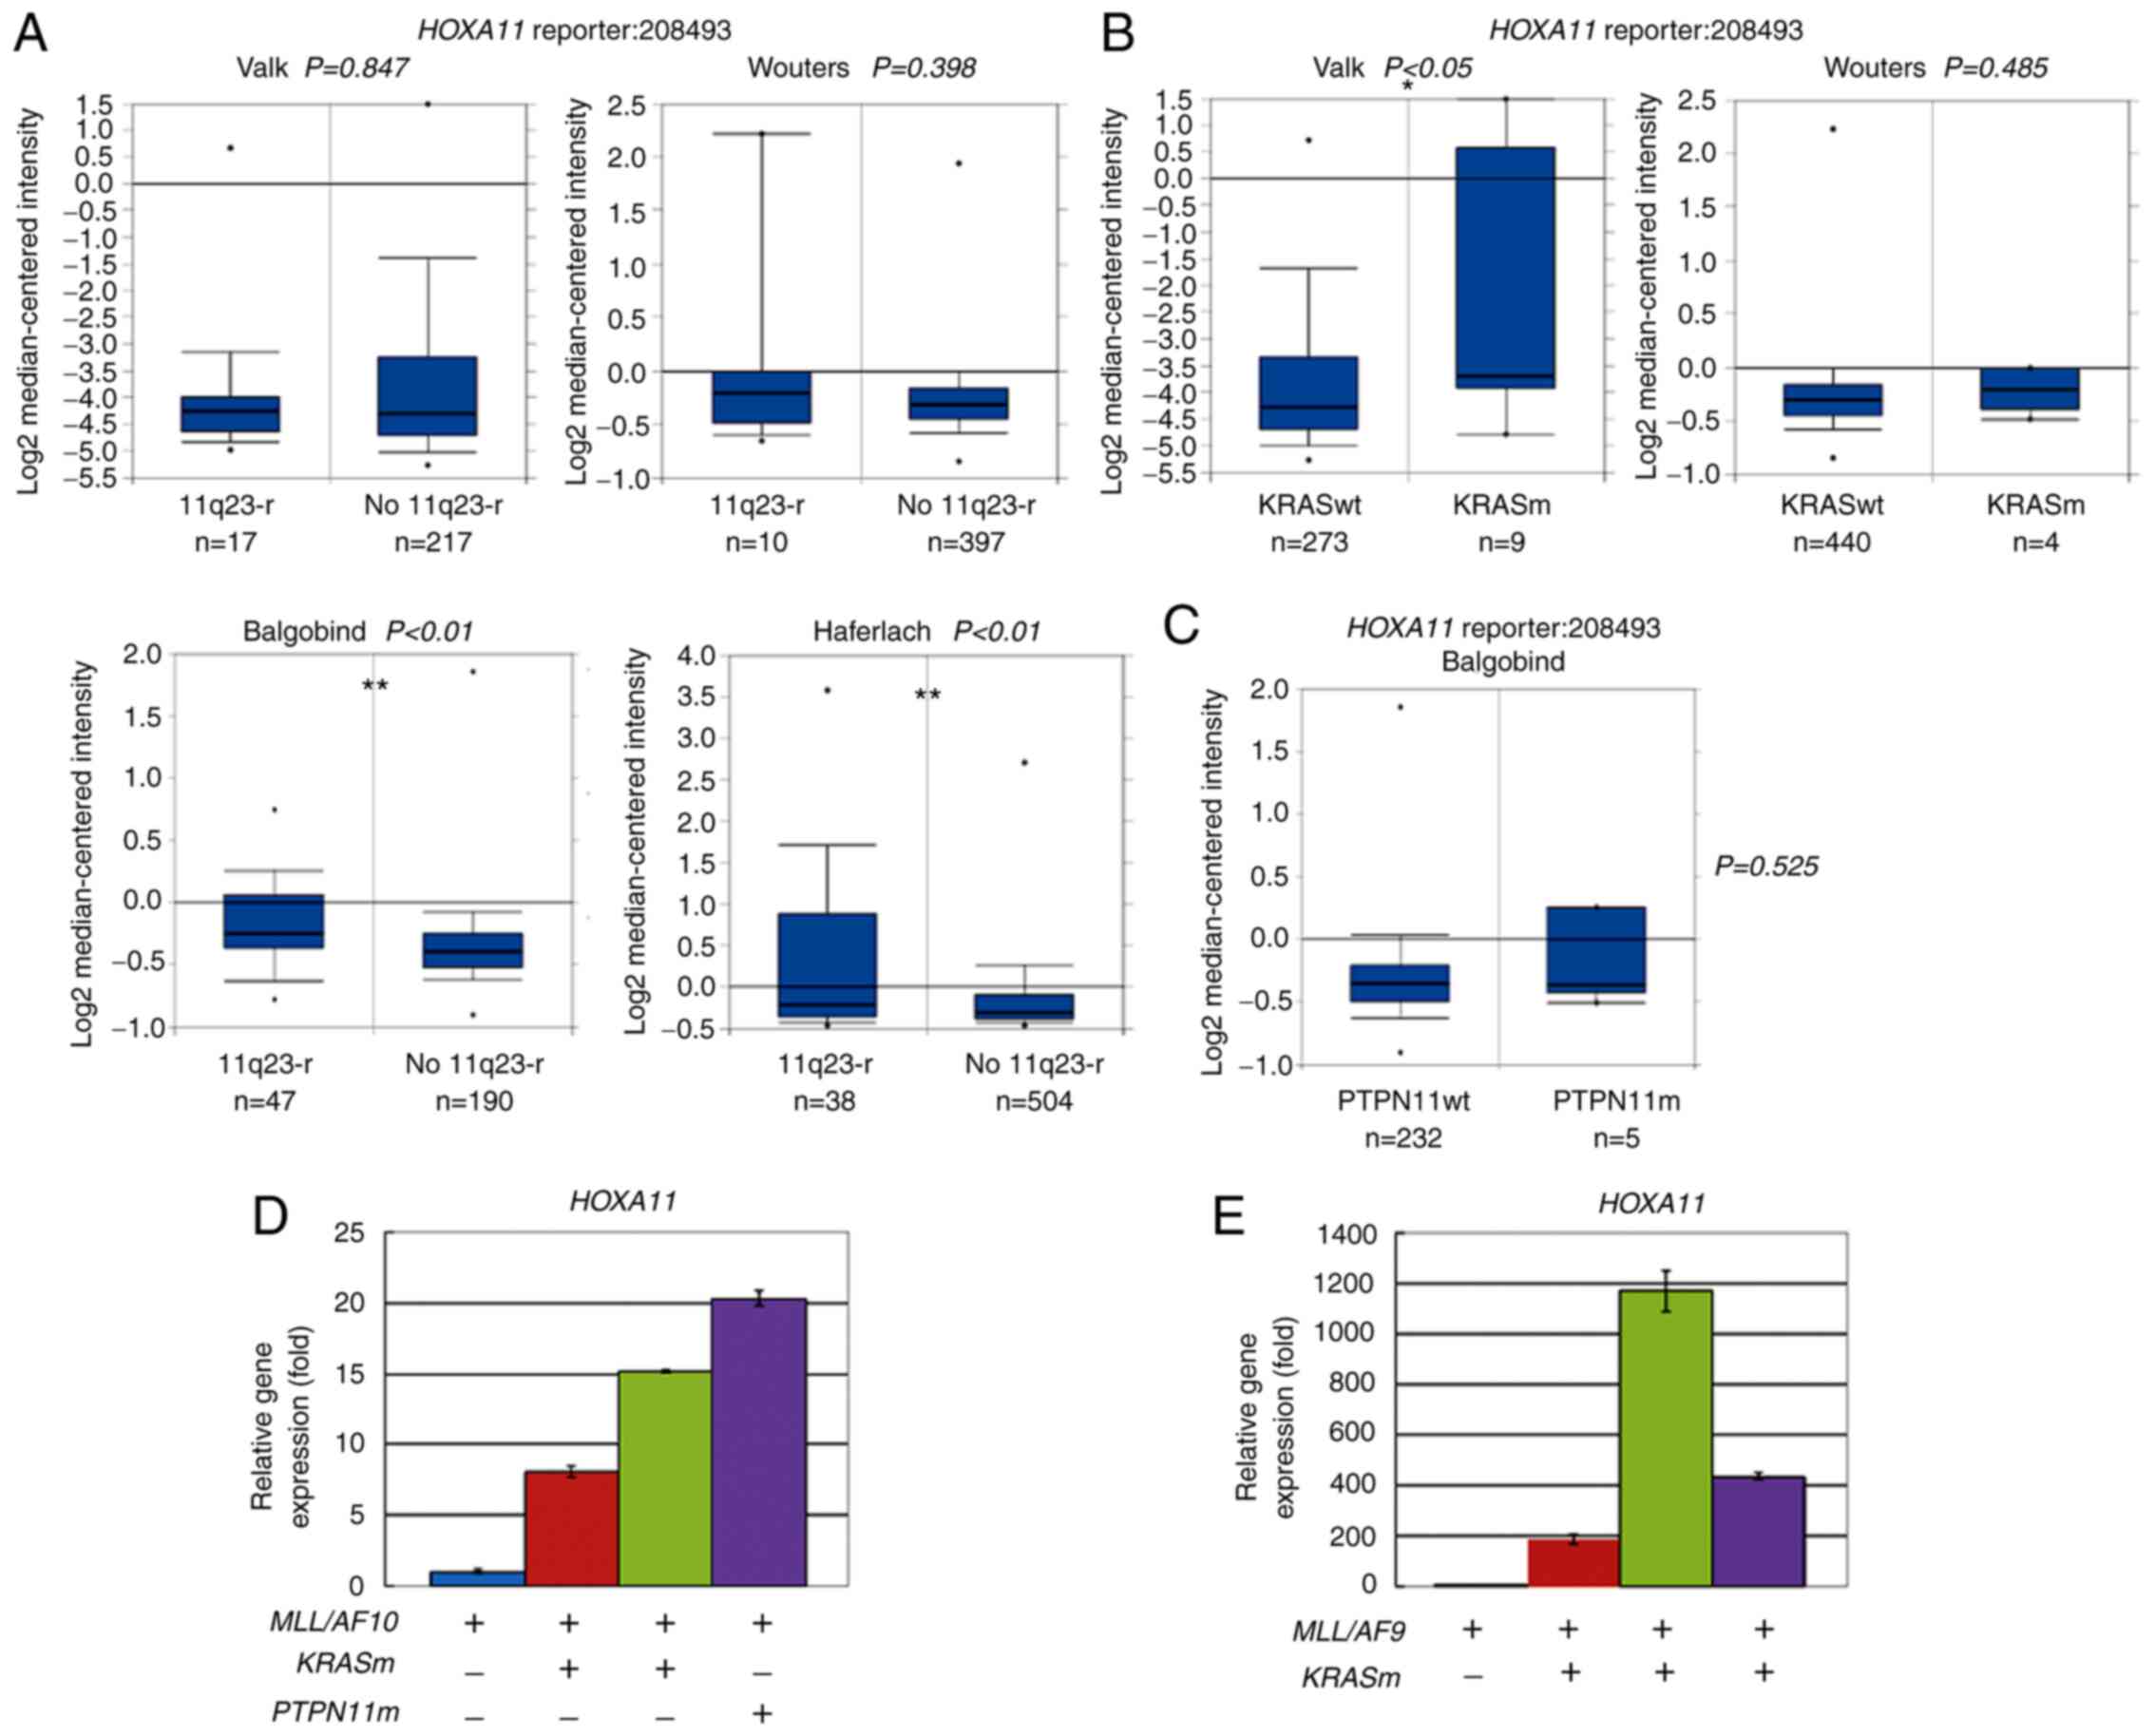 | Figure 2.Overexpression of HOXA11 in
AML carrying MLL-t, oncogenic KRAS or PTPN11
mutations. (A-C) Meta-analysis of HOXA11 expression in AML
using leukemia database deposited by Valk (n=285), Wouters (n=503),
Haferlach (n=542) and Balgobind (n=237, childhood AML) in
Oncomine™. Box plots are data of HOXA11 (reporter ID.
208493) based on cDNA microarray data in patients with AML (A) with
11q23-r or No 11q23-r, (B) patients with KRASm or KRASwt, and (C)
patients with PTPN11m or PTPN11wt. Numbers listed at the bottom are
case numbers. Center line in box plot represents median value, box
limits are 10 and 90th percentiles, and dots represent minimum and
maximum values. P-values were determined using an unpaired
two-sample Student's t-test. *P<0.05 and **P<0.01. (D and E)
Reverse transcription-quantitative PCR analyses were performed to
determine relative HOXA11 expression level in patients with
AML carrying (D) MLL/AF10 or (E) MLL/AF9 with or
without oncogenic KRASm or PTPN11m mutations. Assays were performed
in triplicate and data are representative of three independent
experiments. Error bars indicate SD of mean. AML, acute myeloid
leukemia; MLL, lysine methyltransferase 2A; MLL-t,
MLL translocations; PTPN11, tyrosine-protein
phosphatase non-receptor type 11; 11q23-r, MLL
rearrangements; No 11q23-r, wild-type MLL; KRASm, oncogenic
KRAS mutations; KRASwt, wild-type KRAS; PTPN11m,
oncogenic PTPN11 mutations; PTPN11wt, wild-type
PTPN11. |
HOXA11 expression was also determined
in the patients with MLL-t AML included in the present study
The results showed that MLL/AF10+
patients with AML with KRAS or PTPN11 mutations had
higher levels of HOXA11 expression than patients with
wild-type KRAS and PTPN11 genes (Fig. 2D). Similarly,
MLL/AF9+ patients with AML with KRAS
mutations expressed higher levels of HOXA11 compared with
the patient with wild-type KRAS (Fig. 2E). These results supported that
cooperation of MLL-t with oncogenic KRAS or
PTPN11 mutation induces HOXA11 expression in patients
with AML.
Differential expression of Hoxa genes
in mouse MLL/AF10 leukemia cells with different RAS signaling
mutations
Based on the cDNA microarray data, Hoxa10 and
Hoxa11 were upregulated (>1.5-fold) in AK3G compared with
12G cells (Fig. 3A). Compared with
AKw1G, AK3G cells had higher expression levels (>1.5-fold) of
Hoxa5, Hoxa6, Hoxa10 and Hoxa11 (Fig. 3B). Compared with APw-1, only
Hoxa11 was upregulated in APm-1 cells (Fig. 3C). These data suggested that
KRAS and PTPN11 mutations had overlapping, but not
exactly the same effects on Hoxa gene expression in
MLL/AF10 leukemia cells. Conversely, no significant
differences in the expression levels of Hoxb, Hoxc, Hoxd and
Meis1 genes were observed in these three pairs of mouse
leukemia cell lines (Fig. 3A-C).
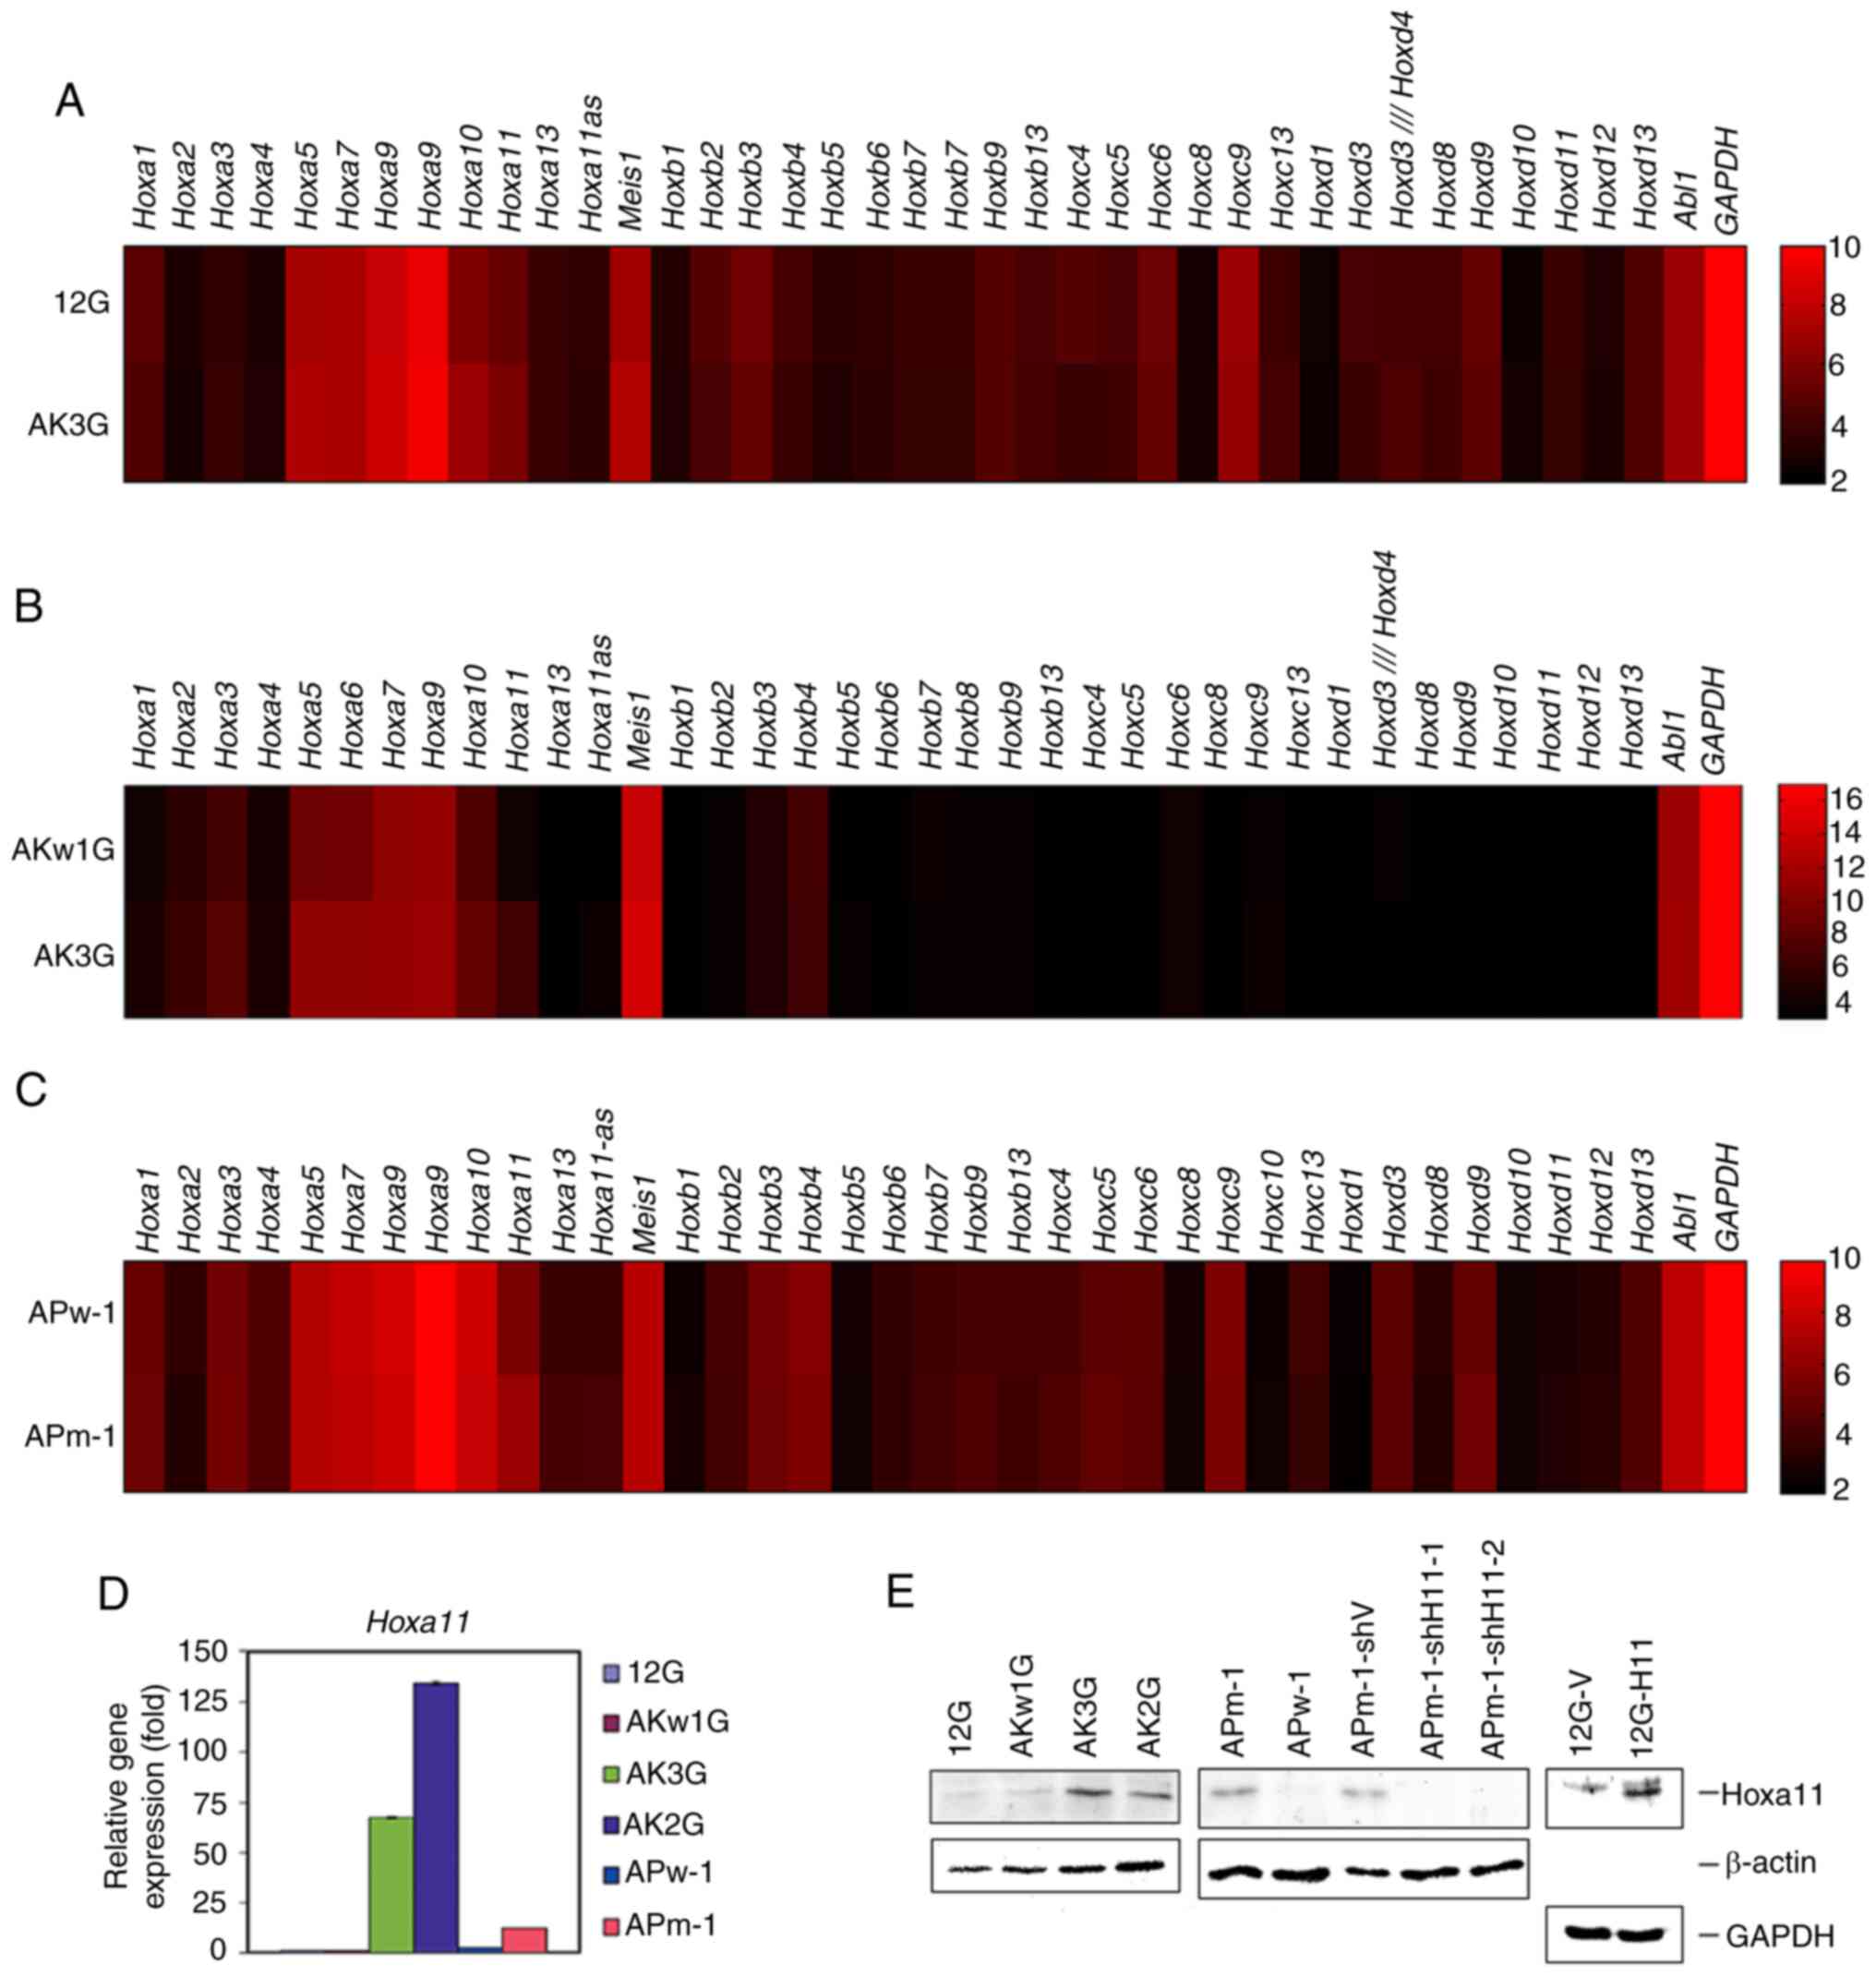 | Figure 3.Expression levels of Hox
clusters A, B, C, D and Meis1 genes in paired
MLL/AF10 leukemia cells harboring wild-type or oncogenic
RAS pathway mutations. (A-C) Heat maps of genes based on
cDNA microarray data between paired cell lines: (A) 12G and AK3G,
(B) AKw1G and AK3G, and (C) APw-1 and APm-1. Raw values are
log2-transformed. Red and black indicate high and low levels of
gene expression, respectively. Color bar depicts log2-transformed
value of genes. (D) Reverse transcription-quantitative PCR analysis
was performed to determine the level of Hoxa11 expression in
12G, AKw1G, AK3G, AK2G, APw-1 and APm-1 cells. Assays were
performed in triplicate and data are representative of three
independent experiments. Error bars indicate SD. (E) Western
blotting was performed to determine the protein level of Hoxa11 in
cells of the different cell lines. The detection of β-actin and
Gapdh served as a loading control for immunoblot analysis. MLL,
lysine methyltransferase 2A; 12G, cells with MLL/AF10(OM-LZ)
alone; AK3G, cells with MLL/AF10(OM-LZ) and oncogenic
KRASG12C; AKw1G, cells with MLL/AF10(OM-LZ) and
wild-type KRAS; APw-1, cells with MLL/AF10(OM-LZ) and
wild-type PTPN11; APm-1, cells with MLL/AF10(OM-LZ)
and oncogenic PTPN11G503A; PTPN11, tyrosine-protein
phosphatase non-receptor type 11. |
RT-qPCR and western blotting confirmed that the
transcriptional and translational levels of Hoxa11 were
increased in MLL/AF10(OM-LZ) mouse leukemia cell lines
harboring KRAS mutation (AK2G, AK3G) and PTPN11
mutation (APm-1) compared with cells harboring wild-type
KRAS (12G, AKw1G) or wild-type PTPN11 (APw-1)
(Fig. 3D and E).
Role of Hoxa11 in survival
To determine the role of Hoxa11 in the
leukemogenesis of MLL/AF10 leukemia cells harboring
RAS pathway mutations, two lentivirus-based shRNAs that
targeted mouse Hoxa11 gene (shH11-1 and shH11-2) were stably
transduced into APm-1 cells. RT-qPCR analysis of the Hoxa11
knockdown APm-1 (APm-1-shH11-1 and APm-1-shH11-2) cell lines showed
that the expression levels of Hoxa11 were reduced to 86 and
46%, respectively, compared with the control cell line (APm-1-shV)
(Fig. 4A). By combining the fold
changes in Hoxa11 between APw-1 and APm-1 and between
APm-1-shV and APm-1-shH11-1, the expression level of Hoxa11
in APm-1-shH11-2 cells was estimated to be 2.4-fold higher than in
APw-1 cells (Figs. 3D and 4A). Western blot analysis further confirmed
that the protein levels of Hoxa11 were decreased in
APm-1-shH11 cell lines compared with the APm-1-shV control cell
line (Fig. 3E). Mice i.p. injected
with APm-1-shH11-2 cells, which had lower Hoxa11 expression,
had significantly longer survival than those injected with
APm-1-shV cells (median 64 days vs. 50 days; P<0.01; Fig. 4B and Table
I). To further support the role of Hoxa11 in the
survival of leukemic mice, Hoxa11 overexpressed 12G cells
(12G-H11-1 and 12G-H11-2) were generated by transduction of
retrovirus-based full-length Hoxa11 gene into 12G cells. The
12G cells transduced with empty retroviruses (12G-V1 and 12G-V3)
served as controls. Overexpression of Hoxa11 in the
12G-H11-1 and 12G-H11-2 cell lines compared with the control 12G-V1
and 12G-V3 cell lines was confirmed by western blotting and RT-qPCR
(Figs. 3E and 4C). BM transplantation assay data showed
that 12G-H11-1 mice had significantly shorter survival than control
12G-V1 mice (median 76 days vs. 91 days; P<0.001; Fig. 4D and Table
I). These results indicated that Hoxa11 plays a critical
role in the survival of leukemic mice induced by MLL/AF10
leukemia cells and MLL/AF10 cells harboring activating
PTPN11 mutation.
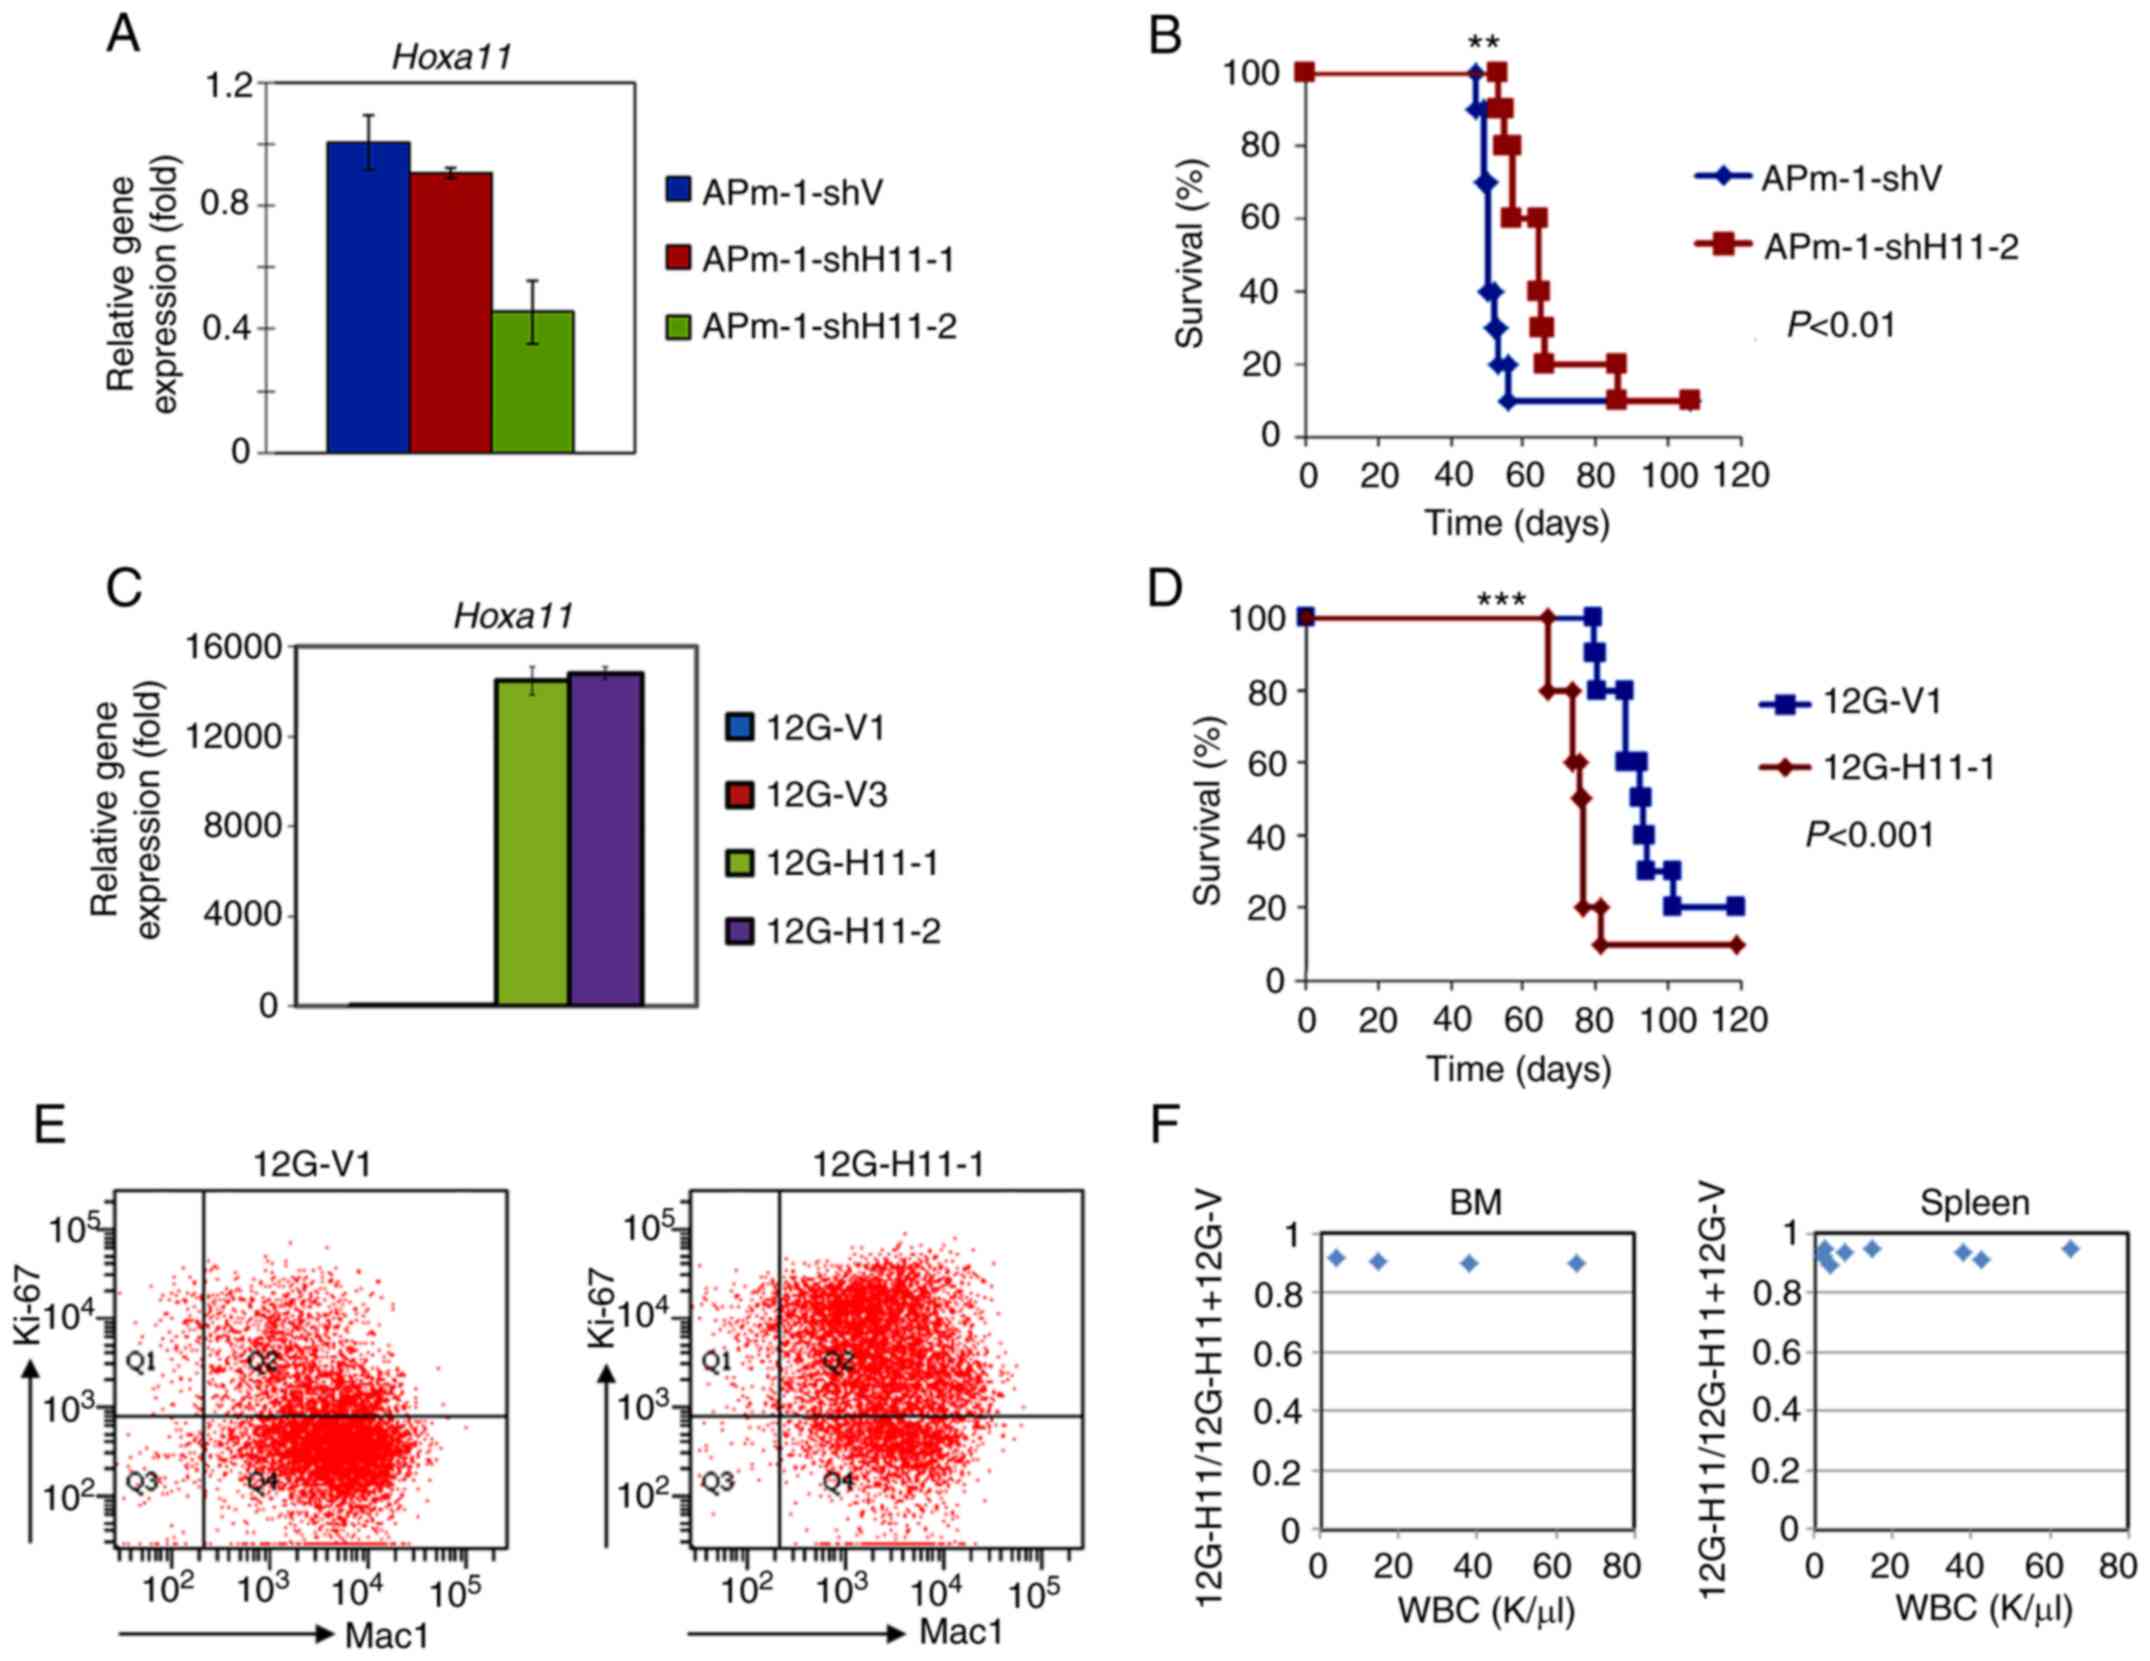 | Figure 4.Expression of Hoxa11 affects
survival of MLL/AF10 leukemia mice. (A and C) Reverse
transcription-quantitative PCR analyses were performed to determine
Hoxa11 expression in (A) Hoxa11-knockdown APm-1
(APm-1-shH11-1, APm-1-shH11-2) and control (APm-1-shV) cell lines,
or in (C) Hoxa11-overexpression 12G (12G-H11-1, 12G-H11-2)
and control (12G-V1 and 12G-V3) cell lines. Assays were performed
in triplicate and data shown are representative of three
independent experiments. Error bars indicate SD. (B and D) Survival
curves of mice i.p. injected with (B) APm-1-shV or APm-1-shH11-2,
and (D) 12G-V1 or 12G-H11-1 cells. Survival analysis was conducted
according to the Kaplan-Meier method. **P<0.01 and ***P<0.001
vs. APm-1-shV or 12G-V1 cells. (E) Flow cytometry analyses was
performed to determine Ki-67 and Mac-1 expression in the BM cells
obtained from 12G-V1 and 12G-H11-1 leukemia mice at moribund stage.
Data shown are representative of three mice with similar results.
(F) Competitive engraftment and clonal expansion ability between
12G-V1 and 12G-H11-1 cells in vivo. 12G-V1 and 12G-H11-1
cells were mixed in a 1:1 ratio and i.p. injected into recipient
mice (n=9). The mice were sacrificed at 43 and 57 days
post-transplantation (n=2 and n=7, respectively). Allele burden of
the 12G-H11-1 clone in BM (left column) or spleen (right column)
was determined by PCR-DNA sequencing. MLL, lysine methyltransferase
2A; APm-1, cells with MLL/AF10(OM-LZ) and oncogenic
PTPN11G503A; sh, short hairpin RNA; 12G, cells with
MLL/AF10(OM-LZ) alone; i.p. intraperitoneally; Mac-1,
macrophage-1 antigen; BM, bone marrow; PTPN11,
tyrosine-protein phosphatase non-receptor type 11. |
 | Table I.Phenotypic characteristics of the
mice transplanted with the Hoxa11-knockdown APm-1 and
Hoxa11-overexpression 12G leukemia cells. |
Table I.
Phenotypic characteristics of the
mice transplanted with the Hoxa11-knockdown APm-1 and
Hoxa11-overexpression 12G leukemia cells.
| A,
Hoxa11-knockdown APm-1 cells |
|---|
|
|---|
| Features | APm-1-shV | APm1-shH11 | P-value |
|---|
| Number of mice,
n | 10.0 | 10.0 |
| Survival median,
days, n (range)a | 50.0
(47.0–56.0) | 64.0
(53.0–86.0) | 0.00543 |
| WBC,
1×10⁹/ml, median (range)a | 64.2
(58.0–97.6) | 85.5
(41.2–207.2) | 0.25160 |
| Anemia, n/n
(%)b | 4/4 (100.0) | 6/6 (100.0) | 1.00000 |
| Thrombocytopenia,
n/n (%)b | 1/4 (25.0) | 3/6 (50.0) | 0.57100 |
| Ascites, n/n
(%)b | 3/8 (37.5) | 0/8 (0.0) | 0.20000 |
| Hepatosplenomegaly,
n/n (%) | 8/8 (100.0) | 9/9 (100.0) | 1.00000 |
| Myeloid sarcoma,
n/n (%) | 1/8 (12.5) | 1/8 (12.5) | 1.00000 |
|
| B,
Hoxa11-overexpression 12G cells |
|
|
Features | 12G-V | 12G-H11 | P-value |
|
| Number of mice,
n | 10.0 | 10.0 |
|
| Survival median,
days, n (range)a | 91.0
(80.0–102.0) | 76.0
(67.0–82.0) | 0.00023 |
| WBC,
1×10⁹/ml, median (range)a | 151.6
(61.1–354.6) | 58.8
(23.3–149.1) | 0.07290 |
| Anemia, n/n
(%)b | 1/8 (12.5) | 2/5 (40.0) | 0.51049 |
| Thrombocytopenia,
n/n (%)b | 2/8 (25.0) | 4/7 (57.1) | 0.31469 |
| Ascites, n/n
(%)b | 2/9 (22.2) | 0/8 (0.0) | 0.47059 |
| Hepatosplenomegaly,
n/n (%) | 8/8 (100.0) | 9/9 (100.0) | 1.00000 |
| Myeloid sarcoma,
n/n (%) | 1/9 (22.2) | 0/8 (0.0) | 1.00000 |
Compared with the control cell lines,
Hoxa11-knockdown APm-1 cells and
Hoxa11-overexpression 12G cells had similar blast-like
morphology (Fig. S2A and C, left
column), similar percentages of CD115+ cells (Fig. S2A and C, right column), and similar
cell proliferation rates in vitro (Fig. S2B and D). These results suggested
that the role of Hoxa11 in the acceleration of disease
progression in the leukemia mice was not caused by changes in
differentiation potential or proliferation rate of the
MLL/AF10 leukemia cells. Flow cytometry analysis of Ki-67,
which detects proliferating cells, was performed on the leukemia
cells (Mac1+) obtained from BM of 12G-V1 and 12G-H11-1
mice. The results showed that 12G-H11-1 cells were more actively
proliferating in vivo (Fig.
4E). To investigate whether Hoxa11 enhanced growth
advantage of MLL/AF10 leukemia cells in vivo,
competitive engraftment and clonal expansion assays were performed.
Compared with the control 12G-V1, 12G-H11-1 cells were more
competitive to engraft to and expand in BM and spleen (Figs. 4F and S3A-C). These results suggested that
Hoxa11 promotes disease progression, at least partly, by
promoting leukemia cell recruitment and proliferation in their
niche.
On the other hand, AK3G cells were also stably
transduced with the two lentivirus-based shRNAs. Although the
knockdown efficiencies of the shRNAs were significant (Fig. S4), the Hoxa11 expression
levels in AK3G-shH11-2 cells were estimated to be 16.9-fold and
21.7-fold higher than that of 12G and AKw1G cells, respectively,
based on the combined RT-qPCR results (Figs. 3D and S4). Moreover, AK3G cells had higher
expression levels of Hoxa5, Hoxa6 and Hoxa10 compared
with AKw1G (Fig. 3B). Due to the high
Hoxa11 expression levels and the possible complementary
effect of the Hoxa5-a10 genes (11), no further assays were performed to
assess survival and drug sensitivity of AK3G-shV and AK3G-shH11
cells in this study.
Role of Hoxa11 in Ara-C
resistance
To determine whether Hoxa11 affects Ara-C
resistance of MLL/AF10 leukemia cells harboring
PTPN11G503A, APm-1-shV and APm-1-shH11-2 cells
were treated with a gradient concentration of Ara-C for 24 h.
Compared with APm-1-shV cells, APm-1-shH11-2 cells exhibited
significantly higher viability at Ara-C concentrations between
128–1,600 ng/ml (P<0.01; Fig. 5A).
The median lethal dose (LD50) of Ara-C for APm-1-shV and
APm-1-shH11-2 cells was 235 and 315 ng/ml, respectively. By
contrast, Hoxa11-overexpressing 12G-H11-1 cells showed
significantly lower cell viabilities at all tested concentrations
of Ara-C (P<0.005; Fig. 5B). The
LD50 of Ara-C for 12G-V and 12G-H11 cells was 459 and 224 ng/ml,
respectively. Further studies revealed that the apoptosis rate of
APm-1-shH11-2 cells was lower than that of APm-1-shV cells before
(17.6 vs. 25.4%, respectively) and after (41.3 vs. 45.2%,
respectively) Ara-C treatment (160 ng/ml) for 24 h (Fig. 5C). The apoptosis rate of 12G-H11-1
cells was higher than that of 12G-V1 cells before (30.5 vs. 14.9%,
respectively) and after Ara-C treatment (57.8 vs. 37.2%,
respectively) (Fig. 5D). These
results indicated that cooperation of MLL/AF10 with
PTPN11G503A upregulated Hoxa11, which in
turn increased cell apoptosis and rendered cells more sensitive to
Ara-C.
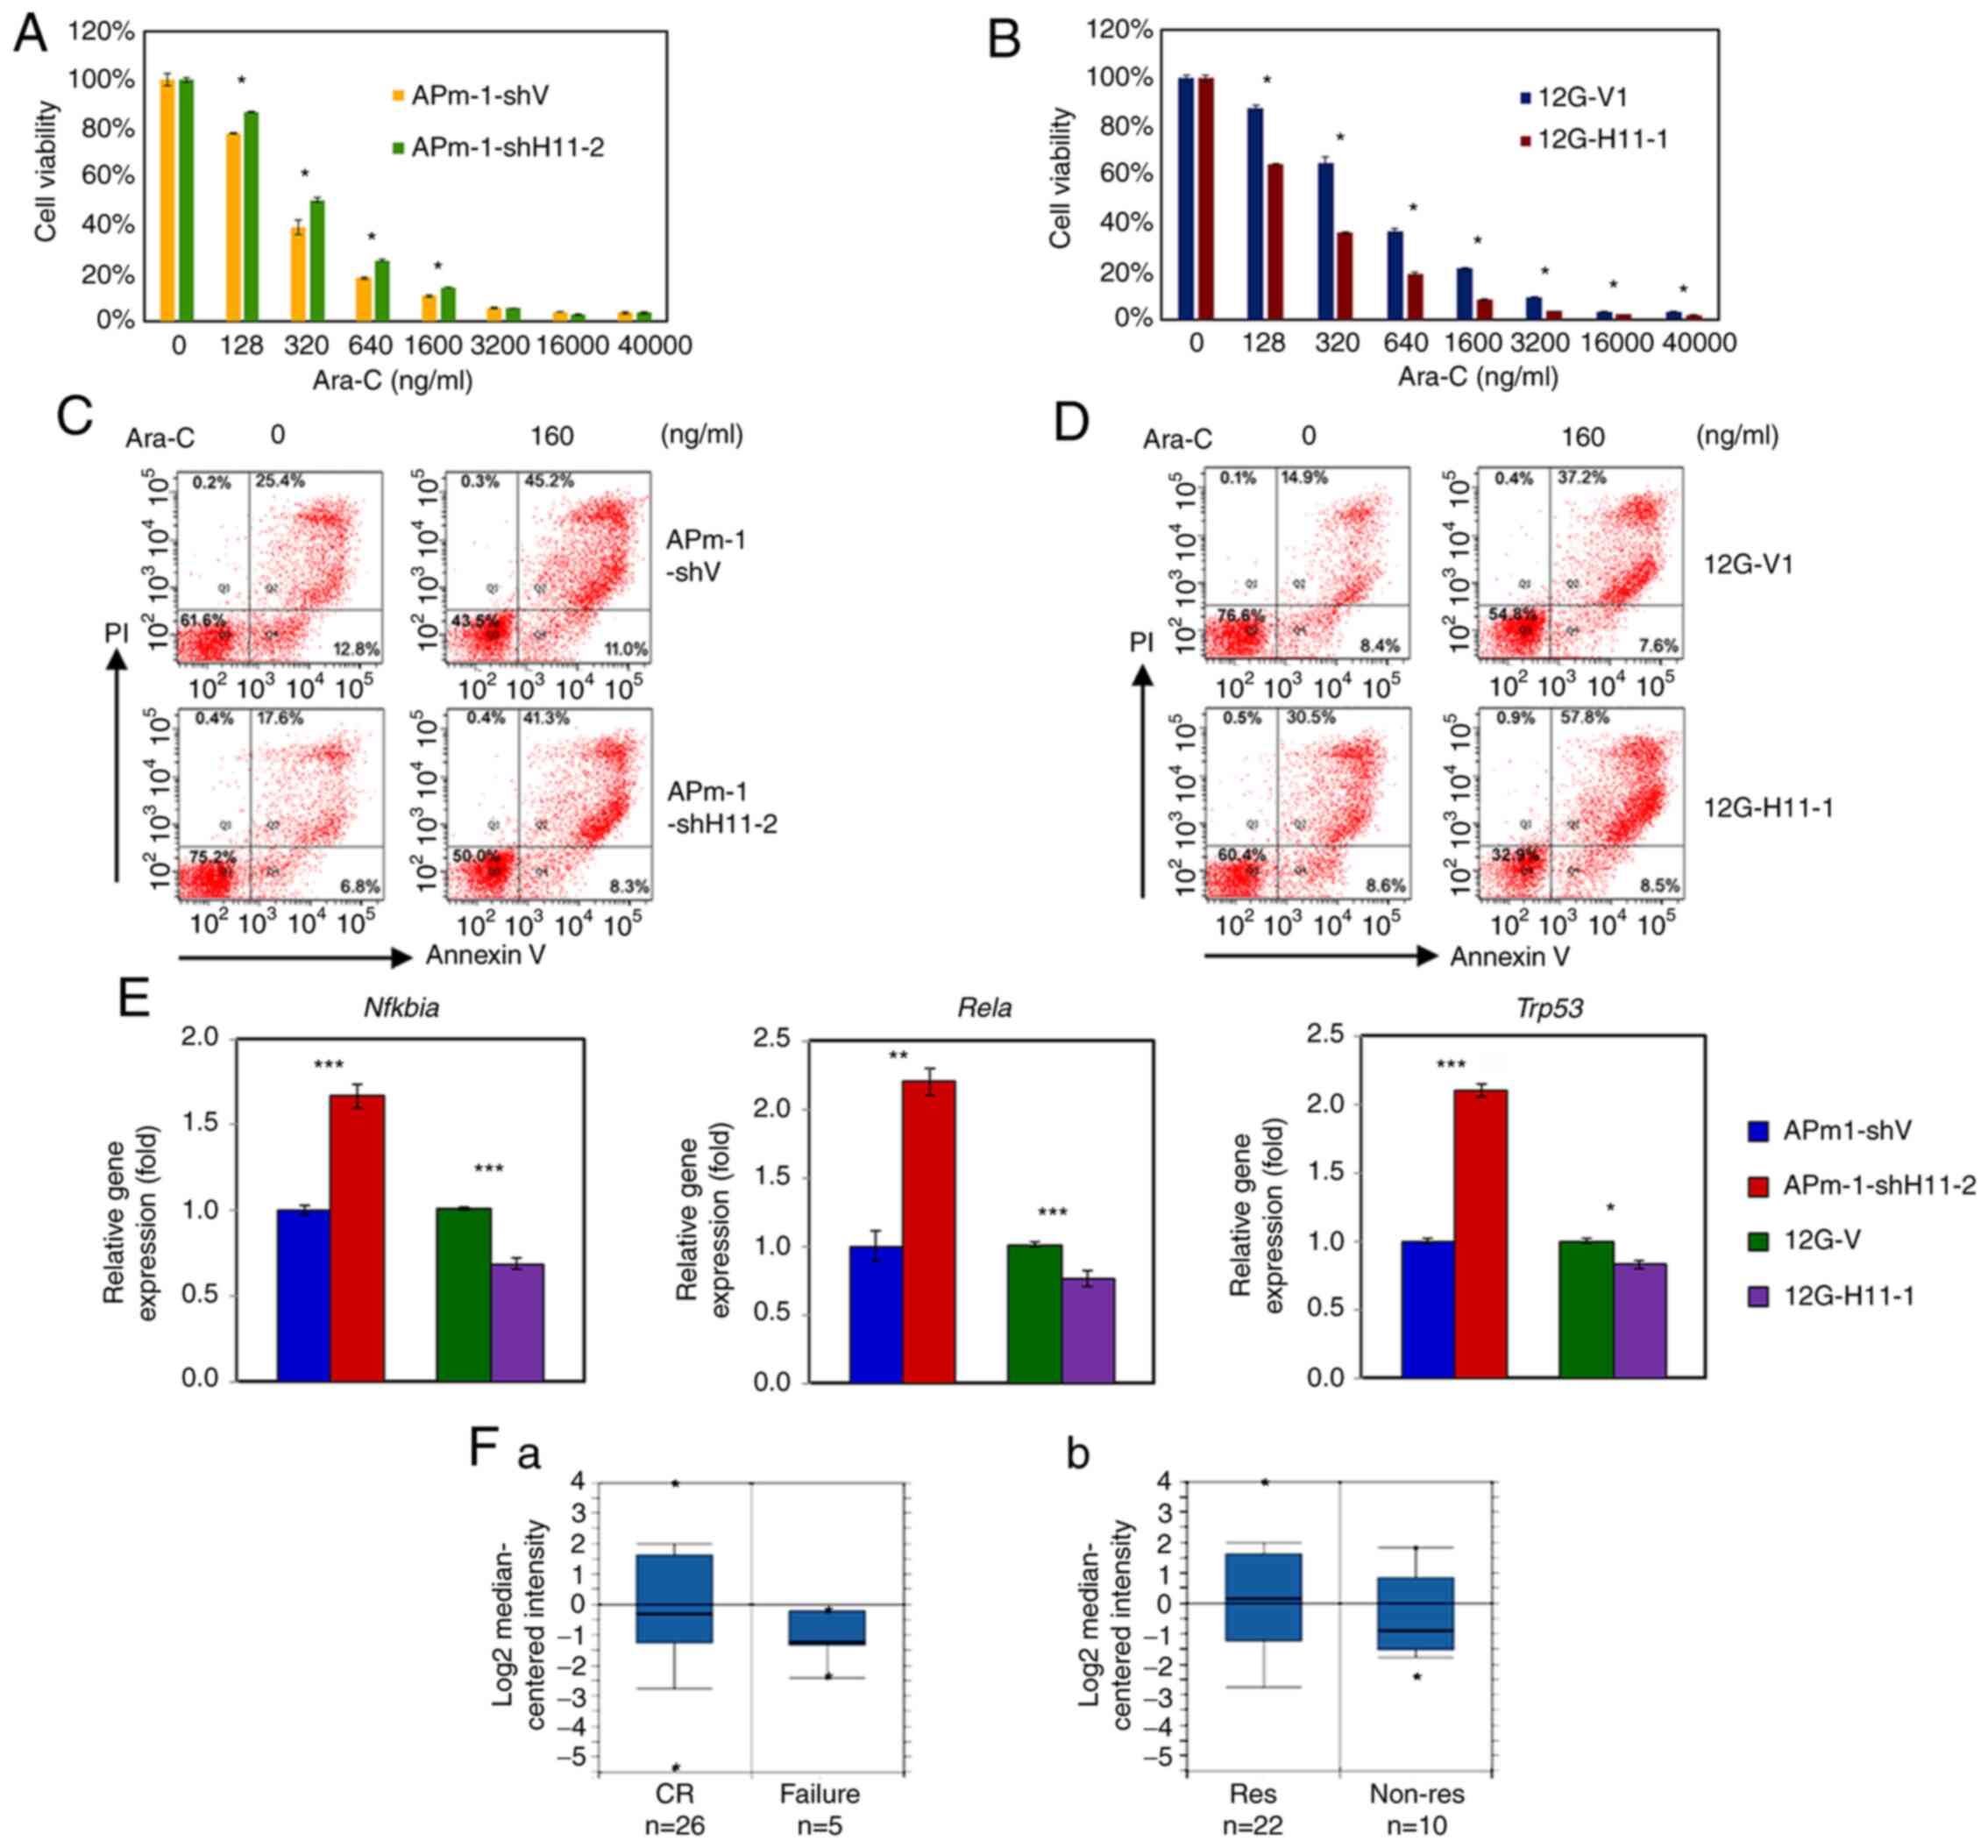 | Figure 5.Hoxa11 expression affects
chemotherapy drug resistance. (A-D) Viability assays of (A and C)
Hoxa11-knockdown APm-1 (APm-1-shH11-2) and control
(APm-1-shV) cell lines or (B and D) Hoxa11-overexpression
12G (12G-H11-1) and control (12G-V1) cell lines treated with Ara-C
at indicated concentrations for 24 h. The viability of leukemia
cells was determined by a Cell Counting Kit-8 assay. Assays were
performed in triplicate and data are representative of three
independent experiments. The error bars indicate SD, and P-values
were determined with an unpaired two-sample Student's t-test. (E)
The expression levels of the apoptosis-related genes, Nfkbia,
Rela and Trp53 in Hoxa11-knockdown or
Hoxa11-overexpression MLL/AF10 leukemia cells were
evaluated via reverse transcription-quantitative PCR. *P<0.05,
**P<0.01, ***P<0.001 vs. APm-1-shV or 12G-V1 cells. (F)
Meta-analysis of HOXA11 expression in AML using a leukemia
database deposited by Heuser (n=33) in Oncomine™. Box plots are the
HOXA11 (reporter ID. AA598674) expression levels based on
cDNA microarray data in patients with AML grouped by (F-a)
chemotherapy responsiveness and (F-b) AML induction/consolidation
response status. Numbers listed at the bottom are the number of
cases. The center line in the box plot represents the median, the
box limits indicate the 10 and 90th percentiles, and dots represent
minimum and maximum values. MLL, lysine methyltransferase 2A;
APm-1, cells with MLL/AF10(OM-LZ) and oncogenic
PTPN11G503A; sh, short hairpin RNA; 12G, cells with
MLL/AF10(OM-LZ) alone; PTPN11, tyrosine-protein
phosphatase non-receptor type 11; Ara-C, cytarabine; Nfkbia,
NF-κB inhibitor α; Rela, transcription factor p65;
Trp53, transformation-related protein p53; AML, acute
myeloid leukemia; CR, complete remission; Res, responder; Non-Res,
non-responder. |
As Hoxa11 encodes a DNA-binding
transcription factor and affects apoptosis of leukemia cells, the
present study next determined the expression levels of three
apoptosis-related genes in Hoxa11-knockdown APm-1 and
Hoxa11-overexpression 12G cells using RT-qPCR analysis. It
was found that the silencing of Hoxa11 significantly
increased the expression levels of Nfkbia, Rela and
Trp53, whereas the overexpression of Hoxa11
significantly reduced the expression level of these genes (Fig. 5E). These results suggested that
Hoxa11 induces cell apoptosis, at least partly, via
regulation of apoptosis-related gene expression.
To determine whether the expression of
HOXA11 in leukemia cells of patients with AML was associated
with chemotherapy drug sensitivity, a meta-analysis was performed
using a data set deposited by Heuser consisting of 33 AML cases
enrolled in the AML-SHG 01/99 trial, in the Oncomine™ clinical
research data repository for gene expression change (34). The results of this analysis showed
that responders of chemotherapy or AML induction/consolidation had
higher HOXA11 expression levels than non-responders using
reporter AA598674 (Fig. 5F-a and
F-b). Collectively, these findings indicated that patients with
AML with higher HOXA11 expression are associated with an
improved response to chemotherapy with Ara-C.
Discussion
The present study compared transcriptomic profiling
between mouse MLL/AF10 leukemia cells harboring wild-type
and activating KRAS or PTPN11, and found that
Hoxa7-Hoxa10 were expressed in all MLL/AF10 leukemia
cell lines, whereas Hoxa11 was only expressed in
MLL/AF10 leukemia cells with activating KRAS or
PTPN11 mutations (Fig. 3A-C).
Furthermore, a meta-analysis using microarray datasets deposited in
Oncomine™ and an analysis of our clinical samples indicated that
HOXA11 is upregulated in MLL-t AML with RAS
signaling mutations. As 29.4~45.8% of cases with MLL-t AML
harbor N-/K-RAS or PTPN11 mutations, this
finding may partly explain why HOXA11 expression is less
frequently reported in MLL-t AML (12,13).
Data obtained from BM transplantation assay using
Hoxa11-knockdown or Hoxa11-overexpression
MLL/AF10 leukemia cells revealed that the expression levels
of Hoxa11 in leukemia cells was associated with the survival
of recipient mice. It was also demonstrated that Hoxa11
overexpression promoted MLL/AF10(OM-LZ) leukemia cells to
engraft and proliferate in BM and spleen (Fig. 4E and F). A similar observation was
reported by Sun et al (35),
which showed that HOXA11 overexpression promoted cell
proliferation and migration, and reduced cell apoptosis in breast
cancer.
Based on the present study analyses of in
vitro cytotoxicity and apoptosis rate of
Hoxa11-knockdown and Hoxa11-overexpression
MLL/AF10(OM-LZ) leukemia cells showed that Hoxa11
expression was associated with Ara-C sensitivity and apoptotic cell
rate (Fig. 5A-D). In addition, gene
expression analysis revealed that Hoxa11 induced apoptosis,
at least partly, by regulating the expression of apoptosis-related
genes, including Nfkbia, Rela and Trp53 (Fig. 5E), which is in line with previous
findings by Guo et al (36),
which established Ara-C-resistant human AML OCI-AML2 cell lines.
Based on a comparative transcriptomic analysis, they identified
HOXA11 as a DEG between resistant and parent cell lines, and
further determined that HOXA11 promoted Ara-C sensitivity
and apoptosis in the cell line (36).
Moreover, a meta-analysis of HOXA11 expression using
microarray data deposited by Heuser in the present study supported
the findings of an association between HOXA11 expression and
responsiveness of patients with AML treated with chemotherapy or on
an AML induction/consolidation regimen (Fig. 5F). These data provided further support
that HOXA11 expression in AML is predictive of an improved
response to chemotherapy with Ara-C. The molecular mechanism of
Hoxa11 in the regulation of apoptosis-related genes needs
further characterization.
The role of HOXA11 varies according to
cancer type. Epigenetic inactivation of HOXA11 is a poor
prognostic marker and contributes to disease progression in ovarian
cancer, non-small cell lung cancer, gastric cancer, urothelial
bladder cancer, glioblastoma, renal cell carcinoma and breast
cancer (37–43). In these solid tumors, HOXA11
acts as a functional tumor suppressor; however, the present results
showed that upregulation of Hoxa11 accelerated leukemia
development in MLL/AF10 cooperating RAS pathway
mutations, suggesting an oncogenic role of Hoxa11 rather
than one of tumor suppression. Further investigation of downstream
Hoxa11 targets and biological pathways will provide an
improved understanding of the mechanism underlying the different
roles of Hoxa11 in AML and solid tumors.
Supplementary Material
Supporting Data
Acknowledgements
We would like to thank Mr. Jun-Wei Huang (Chang
Gung Memorial Hospital, Taoyuan, Taiwan) and Mr. Chih-Shien Chuang
(Chang Gung Memorial Hospital, Taoyuan, Taiwan) for their technical
assistance in all the experiments.
Funding
This work was supported by grants from the Ministry
of Science and Technology, Taiwan (grant no. 107-2320-B-182A-013)
and Chang Gung Memorial Hospital, Taiwan (grant nos. CMRPG3E0301-3,
CMRPG3E1391-3, CMRPG3G1821 and CMRPG3J1331).
Availability of data and materials
The datasets used and/or analyzed during the
current study are available from the corresponding author on
reasonable request.
Authors' contributions
JFF was responsible for the conception and design
of the present study, data analysis, funding acquisition and
writing the original draft. LYS was responsible for providing the
resources, analysis and interpretation of data, and wrote, reviewed
and edited the manuscript. THY was responsible for data analysis,
interpretation and discussion. JFF and LYS confirm the authenticity
of all the raw data. All authors read and approved the final
manuscript.
Ethics approval and consent to
participate
All animal experiments were performed in accordance
with the National Institutes of Health Guide for the Care and Use
of Laboratory Animals and were carried out according to the
protocol approved by the Animal Research Committee of Chang Gung
Memorial Hospital (IACUC No. 2014092403; Taoyuan, Taiwan). Human
sample collection was conducted in accordance with the Declaration
of Helsinki and was approved by the Chang Gung Memorial Hospital
Research Ethics Committee (IRB No. 96-1748B). Informed consent was
obtained from all patients. For patients under the age of 18,
consent/permission was obtained from the parents/guardians.
Patient consent for publication
Not applicable.
Competing interests
The authors declare that they have no competing
interests.
Glossary
Abbreviations
Abbreviations:
|
MLL-t
|
MLL translocations
|
|
AML
|
acute myeloid leukemia
|
|
Ara-C
|
cytarabine
|
|
DEGs
|
differentially expressed genes
|
|
GO
|
Gene Ontology
|
|
AL
|
acute leukemia
|
|
IL
|
interleukin
|
|
MF
|
molecular function
|
|
BP
|
biological process
|
|
RT-qPCR
|
reverse transcription-quantitative
polymerase chain reaction
|
|
cDNA
|
complementary DNA
|
|
i.p.
|
intraperitoneally
|
|
BM
|
bone marrow
|
|
CCK-8
|
Cell Counting Kit-8
|
|
shRNA
|
short hairpin RNA
|
References
|
1
|
Meyer C, Hofmann J, Burmeister T, Gröger
D, Park TS, Emerenciano M, Pombo de Oliveira M, Renneville A,
Villarese P, Macintyre E, et al: The MLL recombinome of acute
leukemias in 2013. Leukemia. 27:2165–2176. 2013. View Article : Google Scholar : PubMed/NCBI
|
|
2
|
Meyer C, Burmeister T, Gröger D, Tsaur G,
Fechina L, Renneville A, Sutton R, Venn NC, Emerenciano M,
Pombo-de-Oliveira MS, et al: The MLL recombinome of acute leukemias
in 2017. Leukemia. 32:273–284. 2018. View Article : Google Scholar : PubMed/NCBI
|
|
3
|
Balgobind BV, Raimondi SC, Harbott J,
Zimmermann M, Alonzo TA, Auvrignon A, Beverloo HB, Chang M,
Creutzig U, Dworzak MN, et al: Novel prognostic subgroups in
childhood 11q23/MLL-rearranged acute myeloid leukemia: Results of
an international retrospective study. Blood. 114:2489–2496. 2009.
View Article : Google Scholar : PubMed/NCBI
|
|
4
|
Grimwade D, Hills RK, Moorman AV, Walker
H, Chatters S, Goldstone AH, Wheatley K, Harrison CJ and Burnett
AK; National Cancer Research Institute Adult Leukaemia Working
Group, : Refinement of cytogenetic classification in acute myeloid
leukemia: Determination of prognostic significance of rare
recurring chromosomal abnormalities among 5876 younger adult
patients treated in the United Kingdom Medical Research Council
trials. Blood. 116:354–365. 2010. View Article : Google Scholar : PubMed/NCBI
|
|
5
|
Yu BD, Hess JL, Horning SE, Brown GA and
Korsmeyer SJ: Altered Hox expression and segmental identity in
Mll-mutant mice. Nature. 378:505–508. 1995. View Article : Google Scholar : PubMed/NCBI
|
|
6
|
Mohi MG, Williams IR, Dearolf CR, Chan G,
Kutok JL, Cohen S, Morgan K, Boulton C, Shigematsu H, Keilhack H,
et al: Prognostic, therapeutic, and mechanistic implications of a
mouse model of leukemia evoked by Shp2 (PTPN11) mutations.
Cancer Cell. 7:179–191. 2005. View Article : Google Scholar : PubMed/NCBI
|
|
7
|
Horton SJ, Grier DG, McGonigle GJ,
Thompson A, Morrow M, De Silva I, Moulding DA, Kioussis D, Lappin
TR, Brady HJ and Williams O: Continuous MLL-ENL expression is
necessary to establish a ‘Hox Code’ and maintain immortalization of
hematopoietic progenitor cells. Cancer Res. 65:9245–9252. 2005.
View Article : Google Scholar : PubMed/NCBI
|
|
8
|
Suzuki A, Ito Y, Sashida G, Honda S,
Katagiri T, Fujino T, Nakamura T and Ohyashiki K: t(7;11)(p15;p15)
Chronic myeloid leukaemia developed into blastic transformation
showing a novel NUP98/HOXA11 fusion. British J Haematol.
116:170–172. 2002. View Article : Google Scholar : PubMed/NCBI
|
|
9
|
Mizoguchi Y, Fujita N, Taki T, Hayashi Y
and Hamamoto K: Juvenile myelomonocytic leukemia with
t(7;11)(p15;p15) and NUP98-HOXA11 fusion. Am J Hematol. 84:295–297.
2009. View Article : Google Scholar : PubMed/NCBI
|
|
10
|
Martino V, Bianchera A, Reia L, Bussolati
O, Fazzina R, Marino F, Montemurro L, Tonelli R, Pession A, Gazzola
GC and Sala R: Down-regulation of HOXA4, HOXA7, HOXA10, HOXA11 and
MEIS1 during monocyte-macrophage differentiation in THP-1 cells.
Mol Med Rep. 2:241–244. 2009.PubMed/NCBI
|
|
11
|
Zhao Y and Potter SS: Functional
comparison of the Hoxa 4, Hoxa 10, and Hoxa 11 homeoboxes. Dev
Biol. 244:21–36. 2002. View Article : Google Scholar : PubMed/NCBI
|
|
12
|
Liang DC, Shih LY, Fu JF, Li HY, Wang HI,
Hung IJ, Yang CP, Jaing TH, Chen SH and Liu HC: K-Ras mutations and
N-Ras mutations in childhood acute leukemias with or without
mixed-lineage leukemia gene rearrangements. Cancer. 106:950–956.
2006. View Article : Google Scholar : PubMed/NCBI
|
|
13
|
Grossmann V, Schnittger S, Poetzinger F,
Kohlmann A, Stiel A, Eder C, Fasan A, Kern W, Haferlach T and
Haferlach C: High incidence of RAS signalling pathway mutations in
MLL-rearranged acute myeloid leukemia. Leukemia. 27:1933–1936.
2013. View Article : Google Scholar : PubMed/NCBI
|
|
14
|
Driessen EM, van Roon EH,
Spijkers-Hagelstein JA, Schneider P, de Lorenzo P, Valsecchi MG,
Pieters R and Stam RW: Frequencies and prognostic impact of RAS
mutations in MLL-rearranged acute lymphoblastic leukemia in
infants. Haematologica. 98:937–944. 2013. View Article : Google Scholar : PubMed/NCBI
|
|
15
|
Andersson AK, Ma J, Wang J, Chen X, Gedman
AL, Dang J, Nakitandwe J, Holmfeldt L, Parker M, Easton J, et al:
The landscape of somatic mutations in infant MLL-rearranged acute
lymphoblastic leukemias. Nat Genet. 47:330–337. 2015. View Article : Google Scholar : PubMed/NCBI
|
|
16
|
Balgobind BV, Zwaan CM, Pieters R and Van
den Heuvel-Eibrink MM: The heterogeneity of pediatric
MLL-rearranged acute myeloid leukemia. Leukemia.
25:1239–1248. 2011. View Article : Google Scholar : PubMed/NCBI
|
|
17
|
Barbosa TC, Andrade FG, Lopes BA, de
Andrade CF, Mansur MB, Emerenciano M and Pombo-de-Oliveira MS:
Impact of mutations in FLT3, PTPN11 and RAS genes on the overall
survival of pediatric B cell precursor acute lymphoblastic leukemia
in Brazil. Leuk Lymphoma. 55:1501–1509. 2014. View Article : Google Scholar : PubMed/NCBI
|
|
18
|
Tamai H, Miyake K, Takatori M, Miyake N,
Yamaguchi H, Dan K, Shimada T and Inokuchi K: Activated K-Ras
protein accelerates human MLL/AF4-induced leukemo-lymphomogenicity
in a transgenic mouse model. Leukemia. 25:888–891. 2011. View Article : Google Scholar : PubMed/NCBI
|
|
19
|
Kim WI, Matise I, Diers MD and Largaespada
DA: RAS oncogene suppression induces apoptosis followed by more
differentiated and less myelosuppressive disease upon relapse of
acute myeloid leukemia. Blood. 113:1086–1096. 2009. View Article : Google Scholar : PubMed/NCBI
|
|
20
|
Ono R, Kumagai H, Nakajima H, Hishiya A,
Taki T, Horikawa K, Takatsu K, Satoh T, Hayashi Y, Kitamura T and
Nosaka T: Mixed-lineage-leukemia (MLL) fusion protein collaborates
with Ras to induce acute leukemia through aberrant Hox expression
and Raf activation. Leukemia. 23:2197–2209. 2009. View Article : Google Scholar : PubMed/NCBI
|
|
21
|
Fu JF, Yen TH, Chen Y, Huang YJ, Hsu CL,
Liang DC and Shih LY: Involvement of Gpr125 in the myeloid sarcoma
formation induced by cooperating MLL/AF10(OM-LZ) and oncogenic KRAS
in a mouse bone marrow transplantation model. Int J Cancer.
133:1792–1802. 2013. View Article : Google Scholar : PubMed/NCBI
|
|
22
|
Fu JF, Liang ST, Huang YJ, Liang KH, Yen
TH, Liang DC and Shih LY: Cooperation of MLL/AF10(OM-LZ) with
PTPN11 activating mutation induced monocytic leukemia with a
shorter latency in a mouse bone marrow transplantation model. Int J
Cancer. 140:1159–1172. 2017. View Article : Google Scholar : PubMed/NCBI
|
|
23
|
Rojas JM and Santos E: Ras genes and human
cancer: Different implications and different roles. Curr Genomics.
3:2002. View Article : Google Scholar
|
|
24
|
Schubbert S, Lieuw K, Rowe SL, Lee CM, Li
X, Loh ML, Clapp DW and Shannon KM: Functional analysis of
leukemia-associated PTPN11 mutations in primary
hematopoietic cells. Blood. 106:311–317. 2005. View Article : Google Scholar : PubMed/NCBI
|
|
25
|
Yang Z, Li Y, Yin F and Chan RJ:
Activating PTPN11 mutants promote hematopoietic progenitor
cell-cycle progression and survival. Exp Hematol. 36:1285–1296.
2008. View Article : Google Scholar : PubMed/NCBI
|
|
26
|
Fu JF, Hsu CL and Shih LY:
MLL/AF10(OM-LZ)-immortalized cells expressed cytokines and induced
host cell proliferation in a mouse bone marrow transplantation
model. Int J Cancer. 126:1621–1629. 2010.PubMed/NCBI
|
|
27
|
Valk PJ, Verhaak RG, Beijen MA, Erpelinck
CA, Barjesteh van Waalwijk van Doorn-Khosrovani S, Boer JM,
Beverloo HB, Moorhouse MJ, van der Spek PJ, Löwenberg B and Delwel
R: Prognostically useful gene-expression profiles in acute myeloid
leukemia. N Engl J Medicine. 350:1617–1628. 2004. View Article : Google Scholar : PubMed/NCBI
|
|
28
|
Wouters BJ, Löwenberg B,
Erpelinck-Verschueren CA, van Putten WL, Valk PJ and Delwel R:
Double CEBPA mutations, but not single CEBPA mutations, define a
subgroup of acute myeloid leukemia with a distinctive gene
expression profile that is uniquely associated with a favorable
outcome. Blood. 113:3088–3091. 2009. View Article : Google Scholar : PubMed/NCBI
|
|
29
|
Haferlach T, Kohlmann A, Wieczorek L,
Basso G, Kronnie GT, Béné MC, De Vos J, Hernández JM, Hofmann WK,
Mills KI, et al: Clinical utility of microarray-based gene
expression profiling in the diagnosis and subclassification of
leukemia: Report from the international microarray innovations in
leukemia study group. J Clin Oncol. 28:2529–2537. 2010. View Article : Google Scholar : PubMed/NCBI
|
|
30
|
Balgobind BV, Hollink IH, Arentsen-Peters
ST, Zimmermann M, Harbott J, Beverloo HB, von Bergh AR, Cloos J,
Kaspers GJ, de Haas V, et al: Integrative analysis of type-I and
type-II aberrations underscores the genetic heterogeneity of
pediatric acute myeloid leukemia. Haematologica. 96:1478–1487.
2011. View Article : Google Scholar : PubMed/NCBI
|
|
31
|
Livak KJ and Schmittgen TD: Analysis of
relative gene expression data using real-time quantitative PCR and
the 2(-Delta Delta C(T)) method. Methods. 25:402–408. 2001.
View Article : Google Scholar : PubMed/NCBI
|
|
32
|
Leonetti A, Baroli G, Fratini E,
Pietropaoli S, Marcoli M, Mariottini P and Cervelli M: Epileptic
seizures and oxidative stress in a mouse model over-expressing
spermine oxidase. Amino Acids. 52:129–139. 2020. View Article : Google Scholar : PubMed/NCBI
|
|
33
|
Fu JF, Yen TH, Huang YJ and Shih LY: Ets1
plays a critical role in MLL/EB1-mediated leukemic transformation
in a mouse bone marrow transplantation model. Neoplasia.
21:469–481. 2019. View Article : Google Scholar : PubMed/NCBI
|
|
34
|
Heuser M, Wingen LU, Steinemann D, Cario
G, von Neuhoff N, Tauscher M, Bullinger L, Krauter J, Heil G,
Döhner H, et al: Gene-expression profiles and their association
with drug resistance in adult acute myeloid leukemia.
Haematologica. 90:1484–1492. 2005.PubMed/NCBI
|
|
35
|
Sun Y, Zeng C, Gan S, Li H, Cheng Y, Chen
D, Li R and Zhu W: LncRNA HOTTIP-Mediated HOXA11 expression
promotes cell growth, migration and inhibits cell apoptosis in
breast cancer. Int J Mol Sci. 19:4722018. View Article : Google Scholar : PubMed/NCBI
|
|
36
|
Guo X, Yan B and Qiu Y: HOXA11 regulates
chemoresistance by modulating p53 gene expression in acute myeloid
leukemia. Blood. 134:5182. 2019. View Article : Google Scholar
|
|
37
|
Fiegl H, Windbichler G, Mueller-Holzner E,
Goebel G, Lechner M, Jacobs IJ and Widschwendter M: HOXA11 DNA
methylation--a novel prognostic biomarker in ovarian cancer. Int J
Cancer. 123:725–729. 2008. View Article : Google Scholar : PubMed/NCBI
|
|
38
|
Hwang JA, Lee BB, Kim Y, Park SE, Heo K,
Hong SH, Kim YH, Han J, Shim YM, Lee YS and Kim DH: HOXA11
hypermethylation is associated with progression of non-small cell
lung cancer. Oncotarget. 4:2317–2325. 2013. View Article : Google Scholar : PubMed/NCBI
|
|
39
|
Cui Y, Gao D, Linghu E, Zhan Q, Chen R,
Brock MV, Herman JG and Guo M: Epigenetic changes and functional
study of HOXA11 in human gastric cancer. Epigenomics. 7:201–213.
2015. View Article : Google Scholar : PubMed/NCBI
|
|
40
|
Li Q, Chen C, Ren X and Sun W: DNA
methylation profiling identifies the HOXA11 gene as an early
diagnostic and prognostic molecular marker in human lung
adenocarcinoma. Oncotarget. 8:33100–33109. 2017. View Article : Google Scholar : PubMed/NCBI
|
|
41
|
Se YB, Kim SH, Kim JY, Kim JE, Dho YS, Kim
JW, Kim YH, Woo HG, Kim SH, Kang SH, et al: Underexpression of
HOXA11 is associated with treatment resistance and poor prognosis
in glioblastoma. Cancer Res Treat. 49:387–398. 2017. View Article : Google Scholar : PubMed/NCBI
|
|
42
|
Wang L, Cui Y, Sheng J, Yang Y, Kuang G,
Fan Y, Jin J and Zhang Q: Epigenetic inactivation of HOXA11, a
novel functional tumor suppressor for renal cell carcinoma, is
associated with RCC TNM classification. Oncotarget. 8:21861–21870.
2017. View Article : Google Scholar : PubMed/NCBI
|
|
43
|
Xia B, Shan M, Wang J, Zhong Z, Geng J, He
X, Vu T, Zhang D and Pang D: Homeobox A11 hypermethylation
indicates unfavorable prognosis in breast cancer. Oncotarget.
8:9794–9805. 2017. View Article : Google Scholar : PubMed/NCBI
|


