Introduction
Diabetes is a chronic disease with increasing
prevalence worldwide (1), and exerts
significant socioeconomic burden on society (2). Diabetes is classified into type 1 and 2,
and type 2 diabetes accounts for the majority of clinical cases
(1). According to the latest dataset
from the World Health Organization, the number of diabetes cases
increased from 108 million in 1980 to 422 million in 2014 (3). In 2016, ~1.6 million mortalities were
reportedly directly caused by diabetes (4). In the United States alone, the economic
burden of diabetes, undiagnosed diabetes and prediabetic
complications, was estimated to be 404 billion dollars in 2017
(5). Patients with type 2 diabetes
have increased levels of blood glucose and free fatty acids such as
palmitic acid. Moreover, hyperinsulinemia occurs, at least at
certain stages in disease development, due to insulin resistance
(6). In addition to classical
vascular complications such as nephropathy and retinopathy,
accumulating evidence suggests that cancer is a complication of
type 2 diabetes, which led to a joint meeting of oncologists and
diabetologists in 2010. These experts reviewed the evidence and
released a consensus report stating that type 2 diabetes increases
the risk of cancer at various sites, including the colon (7). Moreover, type 2 diabetes has been
associated with a poor cancer prognosis (8), as well as metastasis (9). At present, cancer accounts for a large
proportion of the mortality of patients with type 2 diabetes
(10). However, why and how type 2
diabetes promotes cancer development remains unknown.
The centrosome is the smallest organelle in the
eukaryotic cell, which serves as a microtubule-organization center,
and is a key regulator of cell division. Centrosome amplification
is defined as >2 centrosomes in a single cell. It has been
reported to occur in various cancer types, and is recognized as a
typical feature of cancer cells (11). Experimental data have indicated that
centrosome amplification is associated with tumorigenesis and tumor
metastasis. For example, genetically modified cells with centrosome
amplification can form tumors in recipient animals, with the
potential for metastasis (12,13), while
genetically modified mice with centrosome amplification can
spontaneously develop tumors (14,15).
Furthermore, in Barrett's esophagus tumorigenesis, a multistep
progression model of human cancer, centrosome amplification occurs
in a stepwise manner before neoplasia (16). It has also been shown that genetically
modified cells with centrosome amplification exhibit increased
invasive potential (17). However,
the obvious limitation is that genetically modified models do not
accurately reflect reality, as human cancers are not considered to
commonly be caused by transgenesis.
Since type 2 diabetes is associated with DNA damage
(18), which can cause centrosome
amplification (19), it was
hypothesized that type 2 diabetes may favor centrosome
amplification. Indeed, when compared between non-diabetic subjects
and diabetic patients, a 2.6-fold increase in centrosome
amplification was observed in the peripheral blood mononuclear
cells of diabetic patients (6). In
vitro experiments have identified that the pathophysiological
factors in type 2 diabetes, including high glucose, insulin and
free fatty acids (such as palmitic acid), are potent inducers, and
that the centrosomal translocation of Rho-associated protein kinase
1 (ROCK1) is a signal for diabetes-associated centrosome
amplification (6). Moreover,
inhibition of ROCK1 partially attenuated centrosome amplification
(6,20). These results suggest that centrosome
amplification may be a candidate mechanism for the association
between type 2 diabetes and cancer development, and that type 2
diabetes may present a natural model to investigate the roles of
centrosome amplification in cancer. However, to confirm this
conclusion with substantial evidence, the following observations
should be considered: i) Non-cancerous cells with centrosome
amplification induced by high glucose, insulin and palmitic acid,
can form tumors in immunodeficient mice; ii) treated non-cancerous
cells are unable to form tumors in vivo when centrosome
amplification is inhibited, such as by interfering with the
associated signaling pathways; iii) treatment with high glucose,
insulin and palmitic acid promotes cancer cell metastasis; and iv)
the metastatic potential of treated cancer cells is suppressed when
centrosome amplification is inhibited. Therefore, the
identification of key signaling pathway(s) that effectively inhibit
centrosome amplification is required.
Protein kinase ROCK1 is a key regulator of the actin
cytoskeleton and cellular polarity, which serves various functional
roles via the phosphorylation of its substrates, including
death-associated protein kinase 3, glial fibrillary acidic protein
and LIM domain kinase 1 (21). ROCK1
is the target of the small GTPases, the Ras homolog family member A
(RhoA), RhoB and RhoC. More specifically, ROCK1 promotes cellular
proliferation (22), regulates
apoptosis (23) and enhances
migration and invasiveness (24). In
humans, the ROCK1 genotype was found to be associated with colon
cancer in men (25), and is a
candidate prognostic marker for vulvar cancer (26). Our previous studies revealed that
ROCK1 signaling promotes diabetes-associated centrosome
amplification (6,20). However, inhibiting ROCK1 only
partially suppresses centrosome amplification, indicating that
other factors are involved. Therefore, the aim of the present study
was to investigate ROCK1 binding proteins in order to identify key
signaling molecules involved in centrosome amplification.
Materials and methods
Reagents and cell lines
All chemical reagents were purchased from
Sigma-Aldrich (Merck KGaA). Cell culture media and supplements were
obtained from Gibco (Thermo Fisher Scientific, Inc.). HCT116 human
colon cancer cells were kindly gifted by Dr B. Vogelstein of the
Johns Hopkins University School of Medicine (Baltimore, USA).
IEC-6, which is a non-cancerous immortalized rat colon epithelial
cell line, was purchased from the Chinese Academy of Sciences
Beijing Cell Bank. The cells were maintained in the lab in
low-glucose medium.
Cell culture and treatments
Cells were cultured in DMEM (low glucose, 5 mM)
supplemented with 50 U/ml penicillin, 50 µg/ml streptomycin and 10%
(v/v) fetal calf serum, and maintained at 37°C (5% CO2)
in a humidified incubator. Cells in the experimental group were
treated with high glucose (15 mM), insulin (5 nM) and palmitic acid
(150 µM). Cells treated for 48 h were used for the assessment of
the centrosome amplification level; cells treated for 30 h were
used for immunoprecipitation and western blot analyses. Palmitic
acid, the most common saturated free fatty acid, is frequently used
to investigate the biological activities of free fatty acids,
particularly their adverse effects (27). Palmitic acid was conjugated to BSA;
both reagents were mixed (molar ratio, 3:1) and incubated for 1 h
before use.
Immunofluorescent staining and
confocal microscopy
Cells were seeded on a cover slip into a 6-well
plate, at a density of 5×10⁴ cells per well. Following
treatment with high glucose, insulin and palmitic acid, the cells
were fixed in equal volumes of 100% cold methanol and 100% acetone
(6 min; −20°C), washed three times with PBS (10 min each time),
incubated with 0.1% Triton X-100 (15 min) and then with 3% BSA (60
min) at room temperature. The cells were subsequently incubated
with antibodies against the following: γ-tubulin (cat. no. ab27074;
mouse; Abcam; 1:500), ROCK1 (cat. no. 4035; rabbit; Cell Signaling
Technology, Inc.; 1:500) and dynactin subunit 2 (DCTN2; cat. no.
D122213; rabbit; Sangon Biotech Co., Ltd.; 1:1,000). Cells were
washed twice with PBS, and incubated with anti-mouse fluorescent
secondary antibody (cat. no. ab150116; Abcam; 1:500) and
anti-rabbit fluorescent secondary antibody (cat. no. 4412; Goat;
Cell Signaling Technology, Inc.; 1:1,000) in 3% BSA for 60 min at
room temperature. Finally, the cells were mounted with mounting
medium containing DAPI. Confocal microscopy was performed using a
Zeiss LSM880 microscope (Carl Zeiss AG), and image processing was
performed using Zen software (3.2; Carl Zeiss AG). The number of
centrosome signals in each cell was determined by manually counting
300 cells in each specimen using a fluorescence microscope
(magnification, ×1,000). Centrosome amplification was defined as
cases with >5% of cells having ≥3 centrosomes per cell.
Co-immunoprecipitation (CoIP)
CoIP was performed under cold conditions (4°C or on
ice) and ice-cold solutions were used, except in the sample heating
step. A total of 5×10⁶ cells per sample were harvested
and lysed in 500 µl precooled CoIP buffer (50 mM Tris/HCl pH 8.0,
150 mM NaCl, 5 mM EDTA, 0.5% NP-40, 1 mM phenylmethylsulphonyl
fluoride, 2 µg/ml leupeptin and 2 µg/ml pepstatin A) under
non-denaturing conditions. After 24 h, cells seeded into 10-cm
dishes were washed three times with ice cold PBS (5 min each time)
and then lysed in 0.5 ml lysis buffer (Sangon Biotech Co., Ltd.)
and collected in a 1.5-ml centrifuge tube, which was followed by a
30-min incubation on ice and 14,000 × g centrifugation step for 10
min. The supernatant was harvested and a volume equivalent to 200
µg total cellular protein was incubated with 20 µl Protein G
Plus/Protein A agarose suspension (cat. no. IP05; EMD Millipore)
for 2 h with gentle shaking. The agarose beads were removed by
centrifugation, and the supernatant was collected and incubated
overnight with primary antibodies against DCTN2 (cat. no. D122213;
Sangon Biotech Co., Ltd.) or ROCK1 (cat. no. 4035; Cell Signaling
Technology, Inc.), also with gentle shaking. Subsequently, 30 µl
agarose beads were added to each sample, and incubated for 4 h with
gentle shaking. Finally, the beads were collected by
centrifugation, re-suspended in 2X loading buffer, heated to 100°C
and then centrifuged once more (14,000 × g, 1 min). The heated
sample was used for western blot analysis for the detection of the
target proteins. Up to 40 µl sample was subjected to western blot
analysis, as aforementioned. Whole cell lysate (40 µg) was used as
the positive control for detection of the target proteins, and IgG
was used as the negative control.
Proteomics analysis
Samples from three different CoIP experiments were
used for the proteomic identification of binding partners.
Experiments were performed on a Q Exactive mass spectrometer linked
to an Easy n-liquid chromatography (LC) system (Thermo Fisher
Scientific, Inc.). In total, 6 µl per fraction was injected for
nano-LC-mass spectrometry (MS)/MS analysis. The peptide mixture (5
µg) was loaded onto the C18-reversed phase column (Thermo
Scientific Easy Column, 10 cm long, 75 µm inner diameter, 3 µm
resin; Thermo Fisher Scientific, Inc.) in buffer A (0.1% formic
acid), and was separated with a linear gradient of buffer B (80%
acetonitrile and 0.1% formic acid) at a flow rate of 250 nl/min,
which was controlled by an IntelliFlow device over 140 min. MS data
were acquired using a data-dependent top 10 method, dynamically
selecting the most abundant precursor ions from the survey scan
(300–1800 m/z) for high-energy collision-induced dissociation
fragmentation. Determination of the target value was based on
predictive automatic gain control. The dynamic exclusion duration
was 60 sec. Survey scans were acquired at a resolution of 70,000 at
200 m/z, and the resolution for the higher-energy collisional
dissociation spectra was set to 17,500 at 200 m/z. The normalized
collision energy was 30 eV and the underfill ratio, which specifies
the minimum percentage of the target value likely to be reached at
maximum fill time, was defined as 0.1%. The instrument was run with
the peptide recognition mode enabled.
Bioinformatics annotation of
proteomics analysis results
To determine the biological and functional
properties of the identified proteins, Gene Ontology (GO) analysis
was conducted by searching the GO database (http://www.geneontology.org). Functional category
analysis was performed with protein2go and go2protein for
annotation. Visualization and Integrated Discovery v6.7 (28) was used for functional enrichment
analysis of GO terms. A false discovery rate <0.01 was selected
as the cut-off criterion.
Western blotting
Cells were lysed in RIPA buffer (Sigma-Aldrich;
Merck KGaA). The protein concentration in the samples was
determined using a Bradford protein assay (Bio-Rad Laboratories,
Inc.). Equal amounts of cell lysate (30 µg/lane) were separated via
10% polyacrylamide gel electrophoresis, and transferred onto PVDF
membranes, which were blocked using 5% w/v non-fat milk containing
TBS-Tween 20 (TBST; 0.05% v/v) for 1 h at room temperature. The
membranes were incubated with antibodies against DCTN2 (cat. no.
D122213; Sangon Biotech Co., Ltd., Shanghai, China) and ROCK1 (cat.
no. 4035; Cell Signaling Technology, Inc.) overnight at 4°C, washed
with TBST, and then incubated with anti-rabbit secondary antibody
(cat. no. 7074; Cell Signaling Technology, Inc.) at room
temperature for 1 h. β-actin (cat. no. D191047; Sangon Biotech Co.,
Ltd.; 1:1,000) was detected as a reference protein for equal sample
loading. ECL reagents (cat. no. 32106; Thermo Fisher Scientific,
Inc.) were used to visualize the protein bands, which were captured
on X-ray films. Image Lab 5.0 software (Bio-Rad Laboratories, Inc.)
was used for quantitative analysis.
Knockdown of protein expression
Small interfering (si)RNA technology was used to
knockdown protein expression. The pre-designed siRNA
oligonucleotides were obtained from Sangon Biotech Co., Ltd.: ROCK1
forward, 5′-UGAUCUUGUAGCUCCCGCAUGUGUC-3′ and reverse,
5′-GACACAUGCGGGAGCUACAAGAUCA-3′; DCTN2 forward,
5′-GCACAAGUGUGGAACACAU-3′ and reverse, 5′-AUGUGUUCCACACUUGUGC-3′
and non-coding siRNA control, forward, 5′-UUCUCCGAACGUGUCACGUTT-3′
and reverse 5′-ACGUGACACGUUCGGAGAATT-3′. Cells (5×10⁴
per well) were seeded into a 6-well plate and cultured at 37°C for
24 h, and then were transfected with 200 nM siRNA oligonucleotides
using Lipofectamine® 2000 transfection reagent (Thermo
Fisher Scientific, Inc.) at 37°C for 6 h, according to the
manufacturer's instructions. Transfection efficiency was evaluated
by western blot analysis 24 h after transfection.
Bioinformatics analysis for RNA
expression of DCTN2 and ROCK1 in colon cancer
RNA expression data of DCTN2 and ROCK1 in normal and
colon cancer tissues were acquired in CPTAC from UALCAN (http://ualcan.path.uab.edu). Prognosis correlation
data was acquired from the HUMAN PROTEIN ATLAS (https://www.proteinatlas.org). Best value was selected
for prognosis analysis. Based on the FPKM value of each gene,
patients were classified into two groups and association between
prognosis (survival) and gene expression (FPKM) was examined. The
best expression cut-off refers the FPKM value that yields maximal
difference with regard to survival between the two groups at the
lowest log-rank P-value.
Statistical analysis
Statistical analyses were performed using SPSS
version 21 (IBM Corp.), and the data are expressed as the mean ±
SD. Differences between two groups were assessed by Student's
t-test, and multiple group comparisons were performed using ANOVA
followed by Tukey's post hoc test. P<0.05 was considered to
indicate a statistically significant difference.
Results
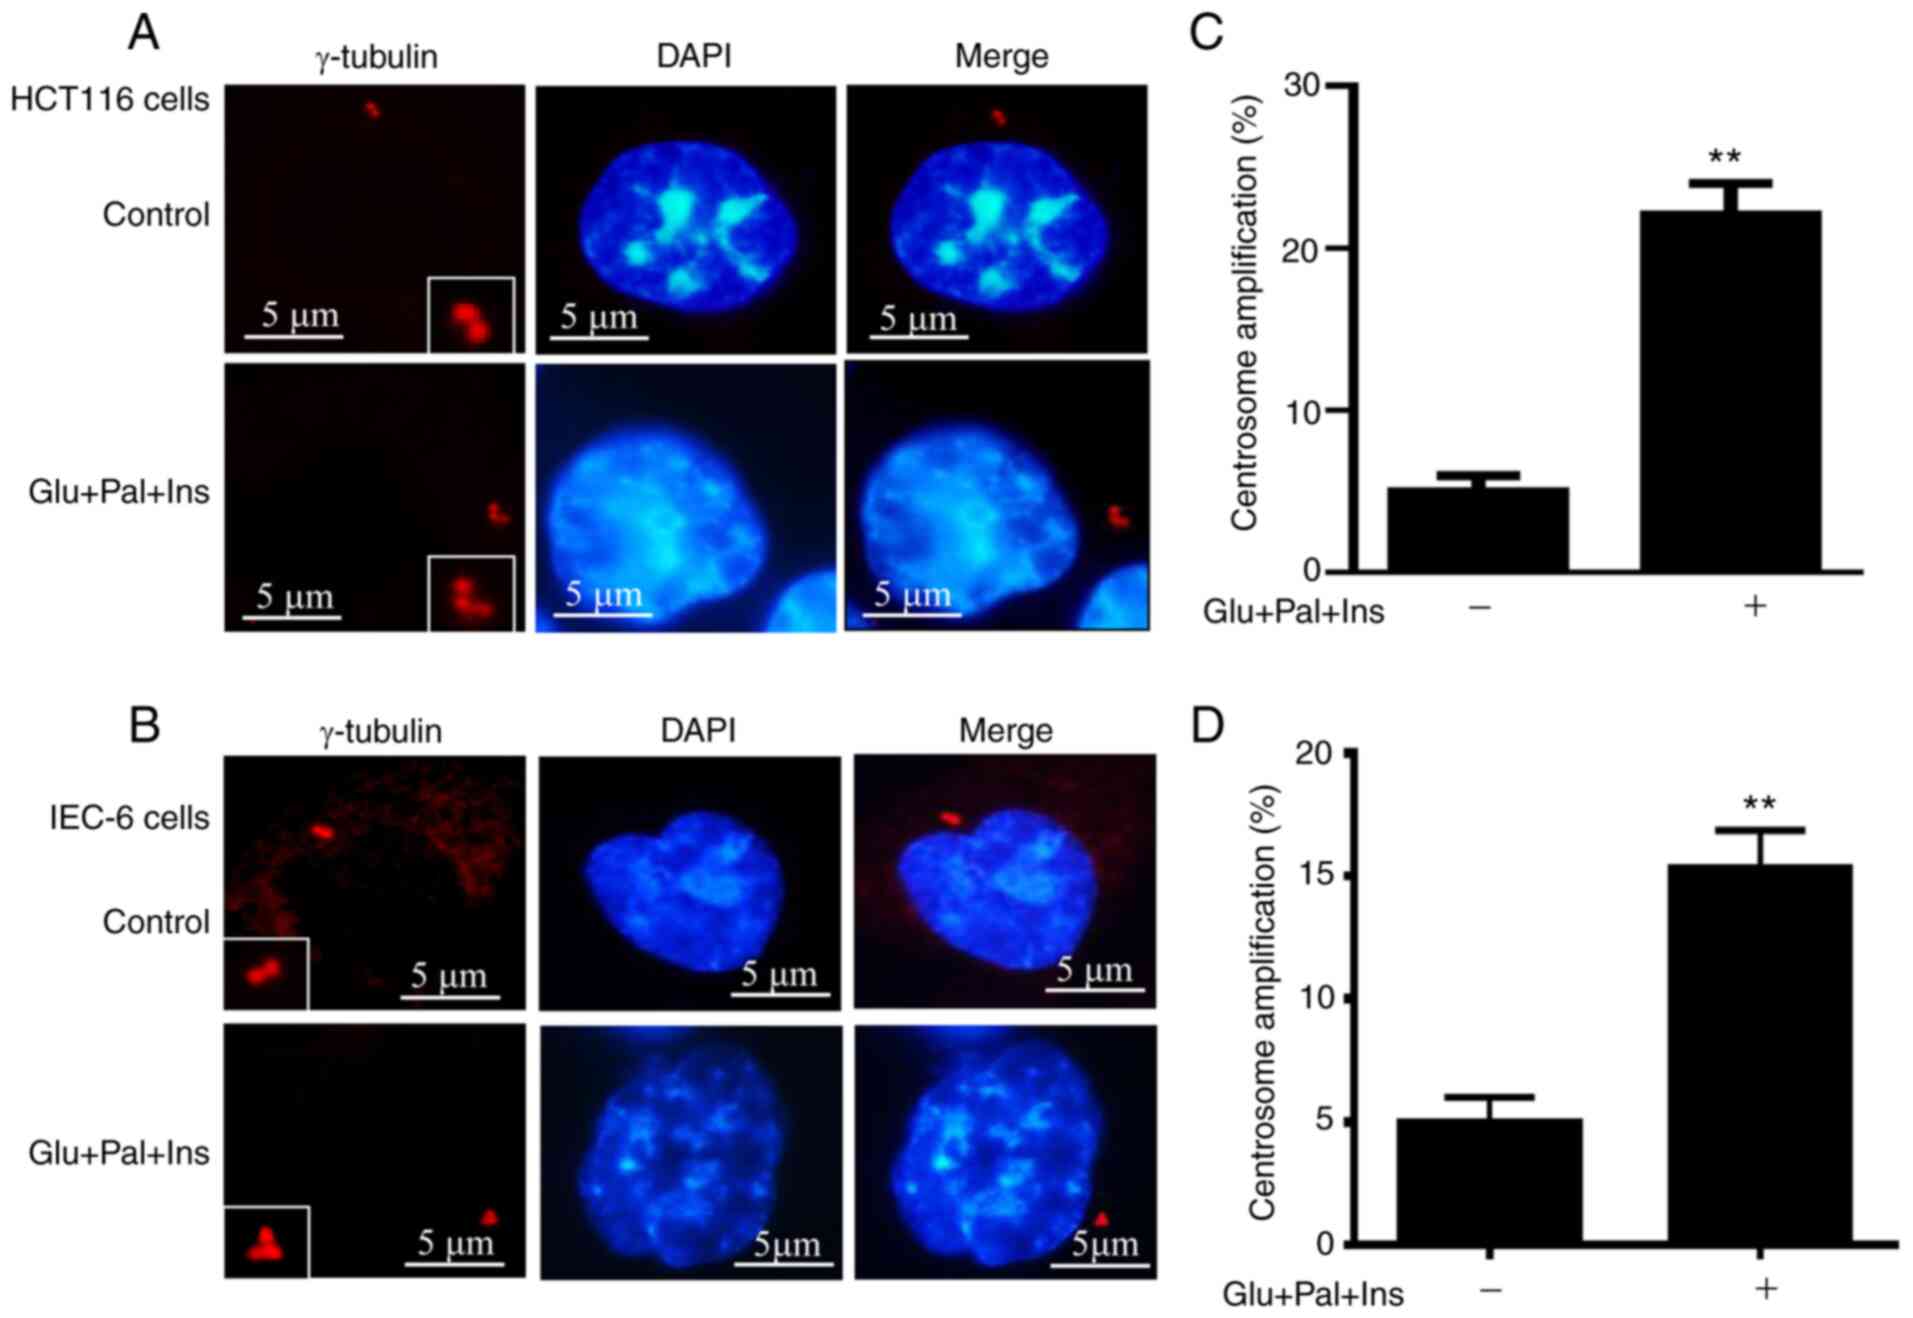
High glucose, insulin and palmitic
acid trigger centrosome amplification
HCT116 and IEC-6 cells were treated with high
glucose, insulin and palmitic acid, which was found to increase
centrosome amplification. Representative images of centrosomes and
centrosome amplification in HCT116 and IEC-cells are displayed in
Fig. 1A and B, respectively. Compared
with the control samples, an increased percentage of centrosome
amplification (~4.6- and 3.2-fold) was observed in treated HCT116
(5 vs. ~23%; P<0.01; Fig. 1C) and
IEC-6 cells (5 vs. ~16%; P<0.01; Fig.
1D), respectively. The results confirmed that the
pathophysiological factors of type 2 diabetes cause centrosome
amplification.
Identification of ROCK1 binding
proteins using CoIP and high MS-based proteomics analysis
Our previous study revealed that treatment with high
glucose, insulin and palmitic acid increased the expression level
and centrosomal translocation of ROCK1, which promotes centrosome
amplification (15). To characterize
ROCK1 binding partners, CoIP was performed using a ROCK1 antibody,
and binding proteins were identified using MS. In total, 106
proteins were identified exclusively from the treated samples, 193
proteins exclusively from the control samples and 849 proteins from
both the control and treated samples (Table SI).
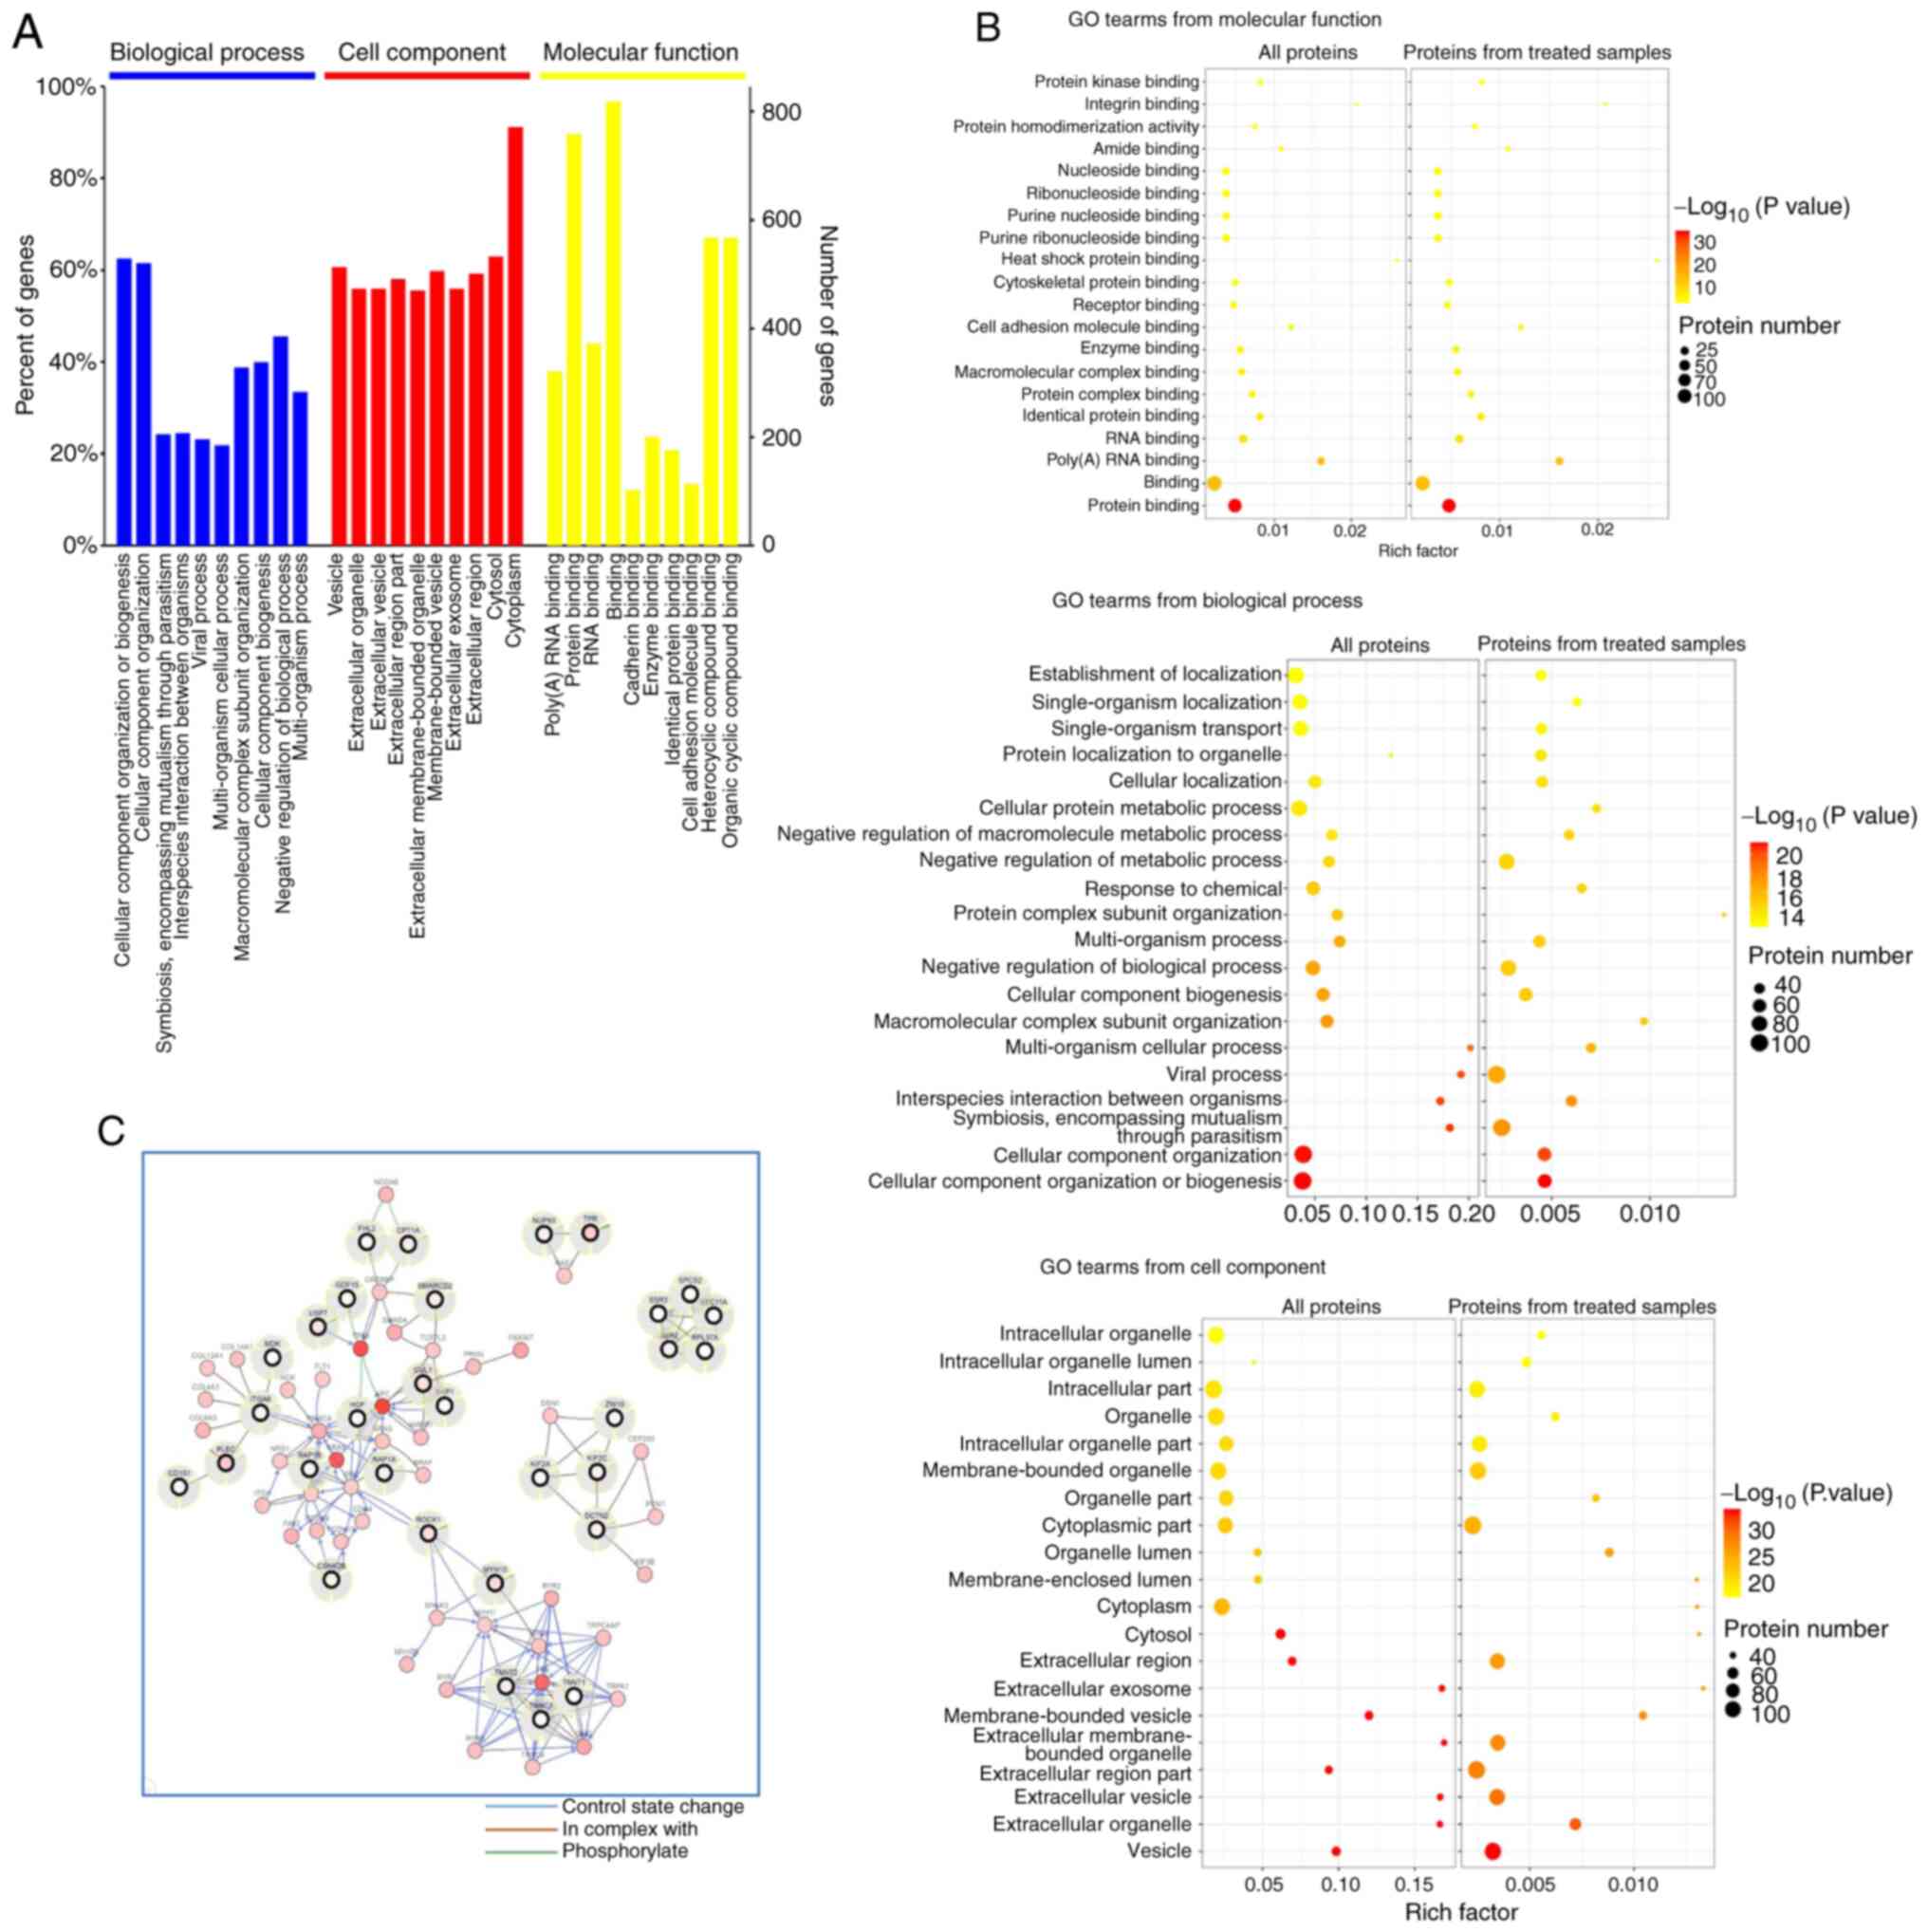
GO clustering analysis identified the enrichment of
these proteins in biological processes, molecular functions and
cellular components. Within the biological process category, the
majority of the proteins were involved in ‘cellular component
organization’ or ‘biogenesis and cellular component organization’.
For molecular function, the data indicated that most of the
proteins were associated with ‘protein binding’, ‘heterocyclic
compound binding’ and ‘organic cyclic compound binding’ (Fig. 2A). Moreover, most proteins were
located in the ‘cytoplasm’ and ‘cytosol’ (Fig. 2A). The GO term analysis was also used
to reveal specific meaningful terms, especially in the treatment
condition. Notably, it was found that ‘protein binding’ in
molecular function was significantly enriched in all of the
identified proteins, and in those found only in the treated samples
(Fig. 2B). The differentially
expressed proteins that had not been shown to interact with ROCK1
were clustered into three complexes (Fig.
2C). Considering the centrosomal localization of ROCK1,
proteins associated with centrosomal localization were investigated
(Table I), from which DCTN2 was
selected for further investigation. This protein was selected for
analysis as it can interact with microtubules, which are associated
with the centrosome. These analyses identified various candidate
binding partners of ROCK1, which provided the background
information for the study that confirmed the binding between ROCK1
and specific partners, signaling for the centrosome
amplification.
 | Table I.Centrosomal proteins identified by
nano-LC-MS&MS. |
Table I.
Centrosomal proteins identified by
nano-LC-MS&MS.
| Protein name | Protein
description | Protein ID | Sample present
in |
|---|
| BCCIP | BRCA2 and
CDKN1A-interacting protein | Q9P287 | T |
| DCTN2 | Dynactin subunit
2 | Q13561 | T |
| KIF2A | Kinesin-like
protein KIF2A | O00139 | T |
| KIF2C | Kinesin-like
protein KIF2C | Q99661 |
| PLEKHG6 | Pleckstrin homology
domain-containing family G member 6 | Q3KR16 | T |
| TPR | Nucleoprotein
TPR | P12270 | T |
| ZW10 |
Centromere&kinetochore protein zw10
homolog | O43264 | T |
| ACTR1A |
Alpha-centractin | P61163 | C |
| AURKB | Aurora kinase
B | Q96GD4 | C |
| MEAF6 | Chromatin
modification-related protein MEAF6 | Q9HAF1 | C |
| NUDT21 | Cleavage and
polyadenylation specificity factor subunit 5 | O43809 | C |
| NUMA1 | Nuclear mitotic
apparatus protein 1 | Q14980 | C |
| RANBP1 | Ran-specific
GTPase-activating protein | P43487 | C |
| TOP2A | DNA topoisomerase
2-alpha | P11388 | C |
| CALM3 | Calmodulin-3 | P0DP25 | C&T |
| HSPA1B | Heat shock 70 kDa
protein 1B | P0DMV9 | C&T |
| CCT8 | T-complex protein 1
subunit theta | P50990 | C&T |
| NPM1 | Nucleophosmin | P06748 | C&T |
| HSPA6 | Heat shock 70 kDa
protein 6 | P17066 | C&T |
| CCT4 | T-complex protein 1
subunit delta | P50991 | C&T |
| TCP1 | T-complex protein 1
subunit alpha | P17987 | C&T |
| CCT5 | T-complex protein 1
subunit epsilon | P48643 | C&T |
| MDH1 | Malate
dehydrogenase, cytoplasmic | P40925 | C&T |
| DHX9 | ATP-dependent RNA
helicase A | Q08211 | C&T |
| RUVBL2 | RuvB-like 2 | Q9Y230 | C&T |
| C14orf166 | UPF0568 protein
C14orf166 | Q9Y224 | C&T |
| CROCC | Rootletin | Q5TZA2 | C&T |
| MAPRE1 |
Microtubule-associated protein RP&EB
family member 1 | Q15691 | C&T |
| PAFAH1B1 | Platelet-activating
factor acetyl hydrolase IB subunit alpha | P43034 | C&T |
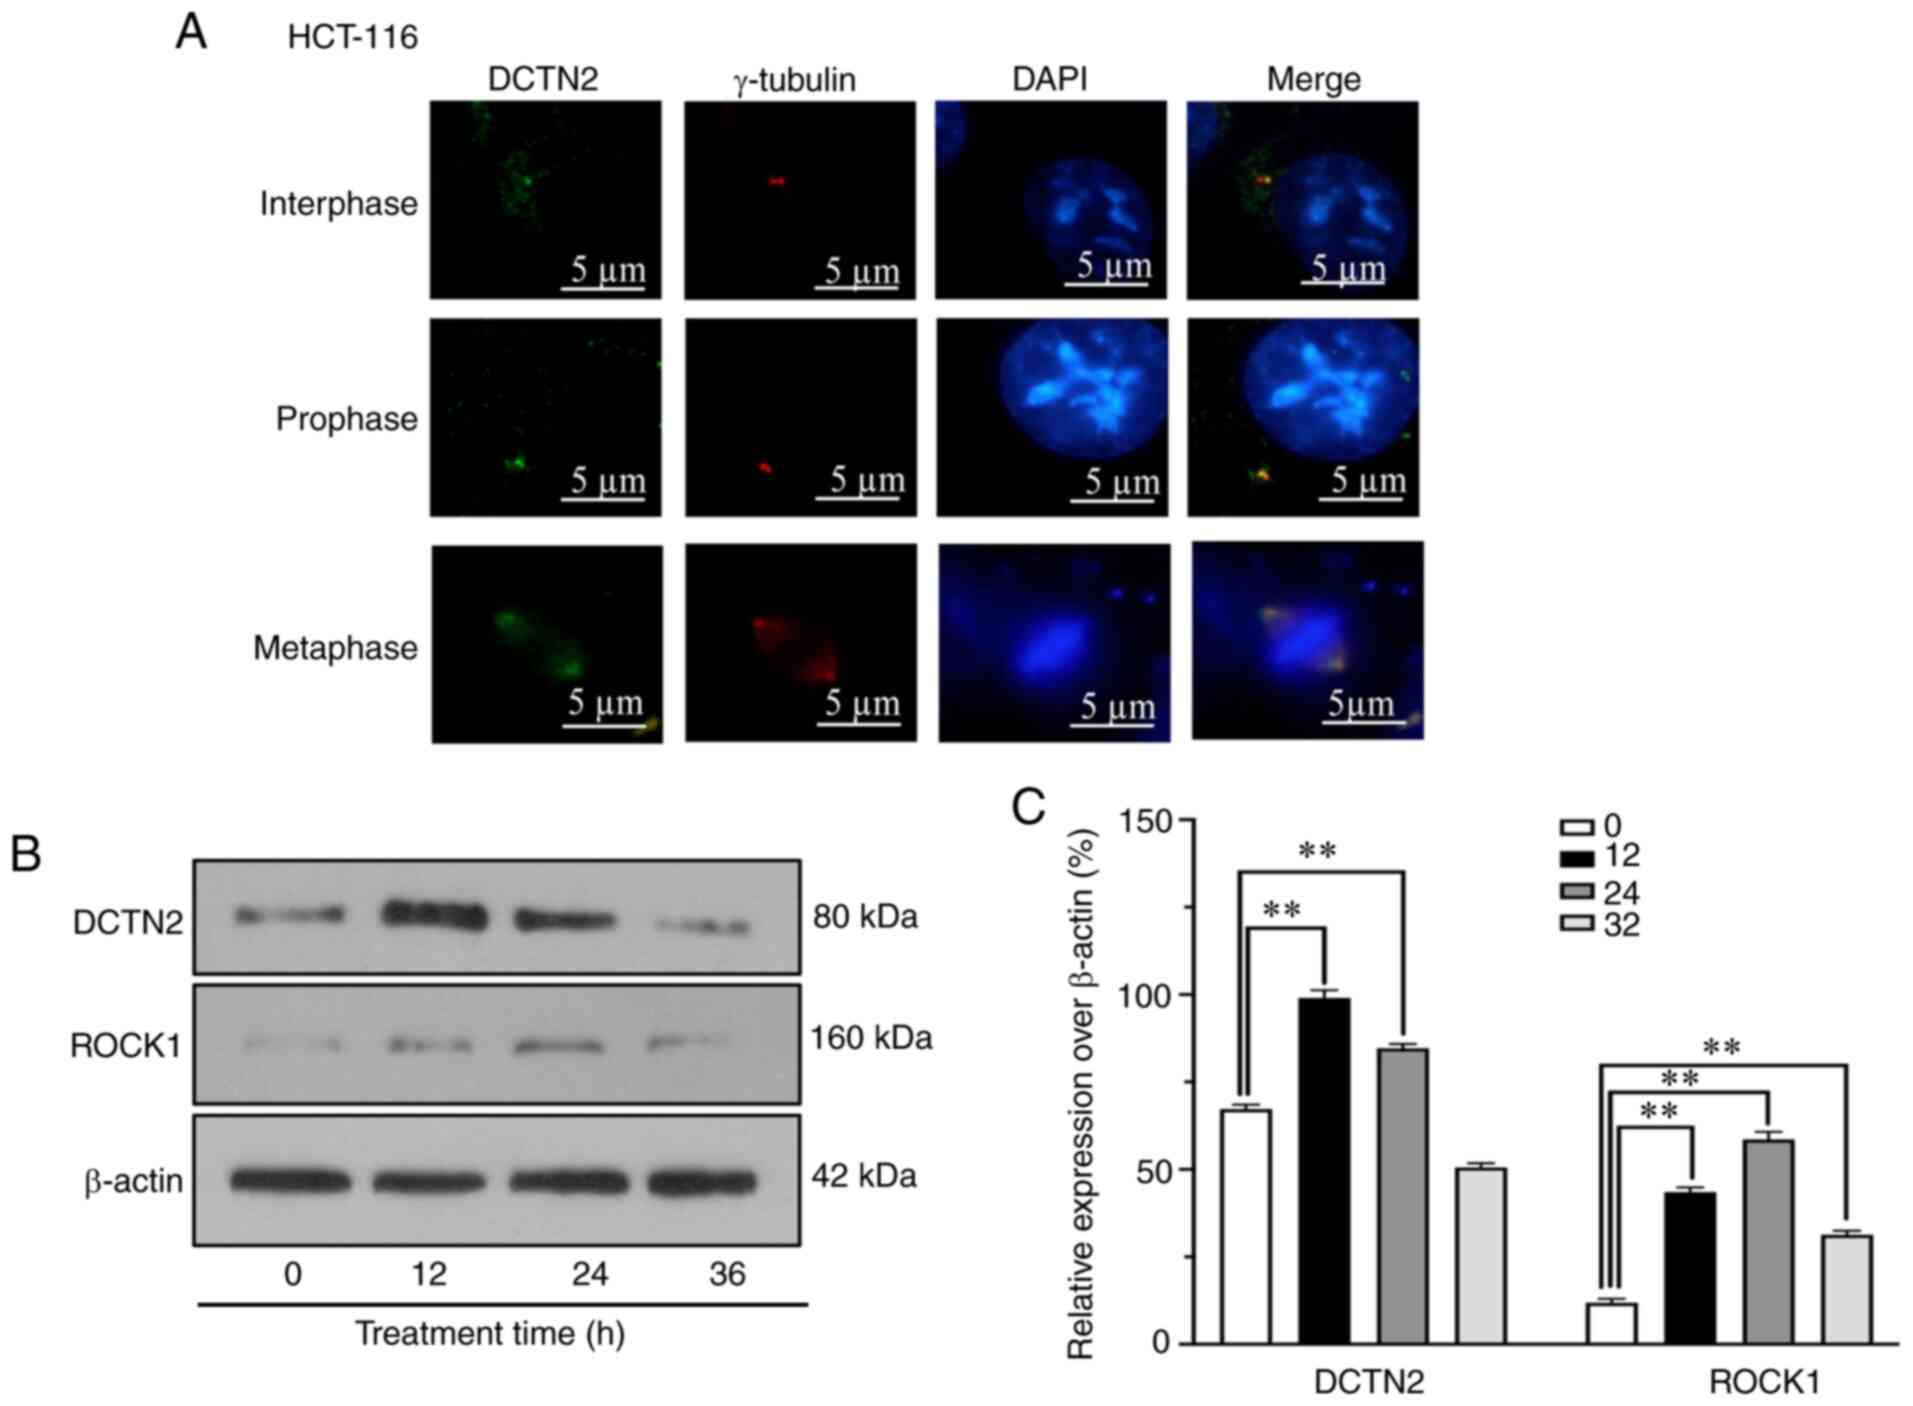
DCTN2 is localized to the
centrosome
Immunofluorescent staining was conducted to evaluate
the centrosomal localization of DCTN2, as ROCK1 was already shown
to be transported to the centrosome following treatment with high
glucose, insulin and palmitic acid (15). As presented in Fig. 3A, DCTN2 was localized to only one
centrosome in HCT116 cells at the early stage of cell division, and
was then distributed between both centrosomes thereafter. DCTN2
also appeared in the spindles, particularly the spindle area
closest to the centrosomes. When multipolar division occurred due
to centrosome amplification, DCTN2 was present in multipolar
spindles. It was also demonstrated that upon treatment, the protein
levels of ROCK1 and DCTN2 were upregulated, which peaked at 12 h,
and then declined at 24 h (Fig. 3B and
C). The results confirm that DCTN2 is indeed a centrosomal
protein.
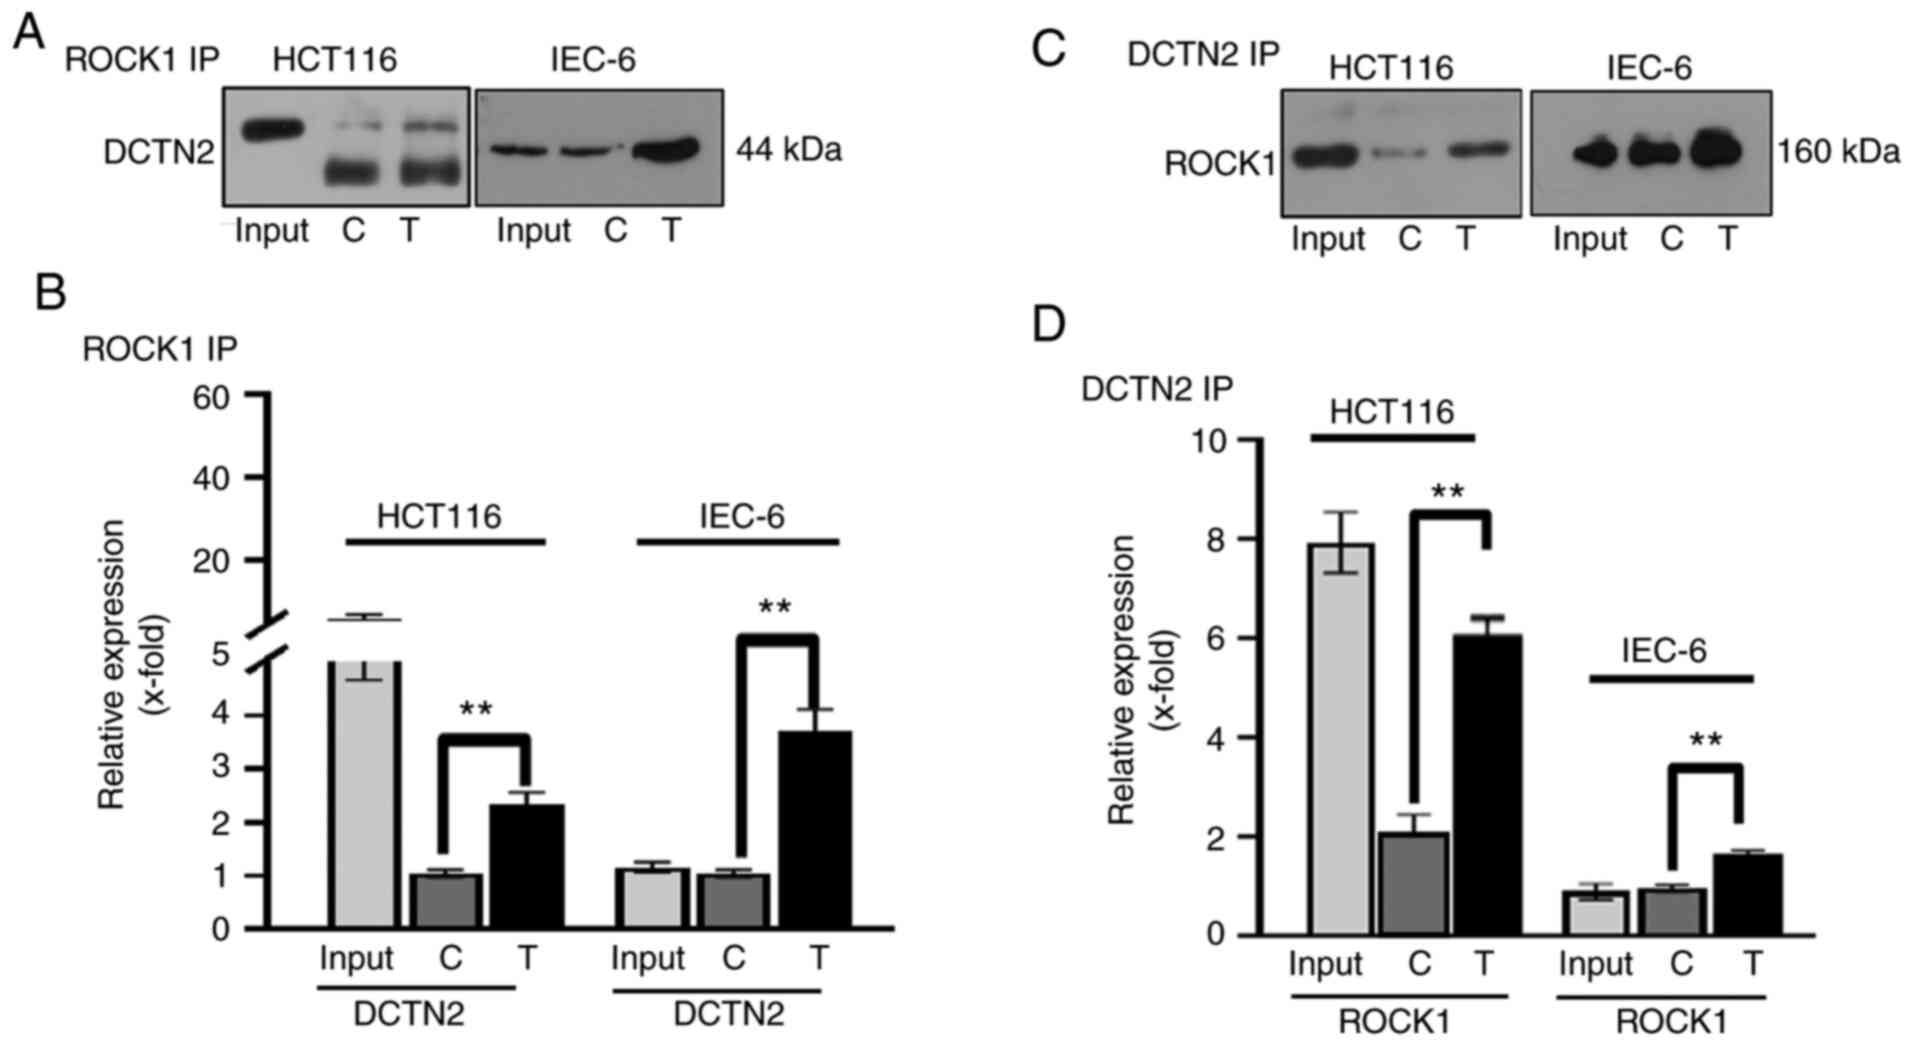
High glucose, insulin and palmitic
acid increase the binding between DCTN2 and ROCK1
CoIP was performed in combination with western blot
analysis to evaluate binding between ROCK1 and DCTN2 in HCT116 and
IEC-6 cells, and to investigate whether the experimental treatment
enhanced this protein binding. Similar protein binding profiles
were obtained from both the HCT116 and IEC-6 cell lines. An
anti-ROCK1 antibody was able to pull down DCTN2, and the protein
expression level of DCTN2 pulled down by the ROCK1 antibody was
increased upon treatment with high glucose, insulin and palmitic
acid (Fig. 4A and B). Similarly, the
antibody against DCTN2 was able to pull down ROCK1, which was
enhanced by the experimental treatment (Fig. 4C and D). The results indicated that
high glucose, insulin and palmitic acid enhanced the binding
between ROCK1 and DCTN2 in non-cancerous (IEC-6) and cancerous
(HCT116) colon cells.
Disruption of the ROCK1-DCTN2 protein
complex inhibits centrosome amplification
Next, the ROCK1-DCTN2 protein complex was disrupted
by knocking down the expression of ROCK1 and DCTN2, and the effect
on centrosome amplification in HCT116 cells was investigated.
Knockdown of ROCK1 (Fig. 5A and B) or
DCTN2 (Fig. 5C and D) partially
inhibited the centrosome amplification triggered by the
experimental treatment (Fig. 5E and
F). Notably, simultaneous knockdown of these two proteins
inhibited of centrosome amplification to a large degree (Fig. 5G and H). The results suggested that
the binding of these proteins mediated diabetes-associated
centrosome amplification.
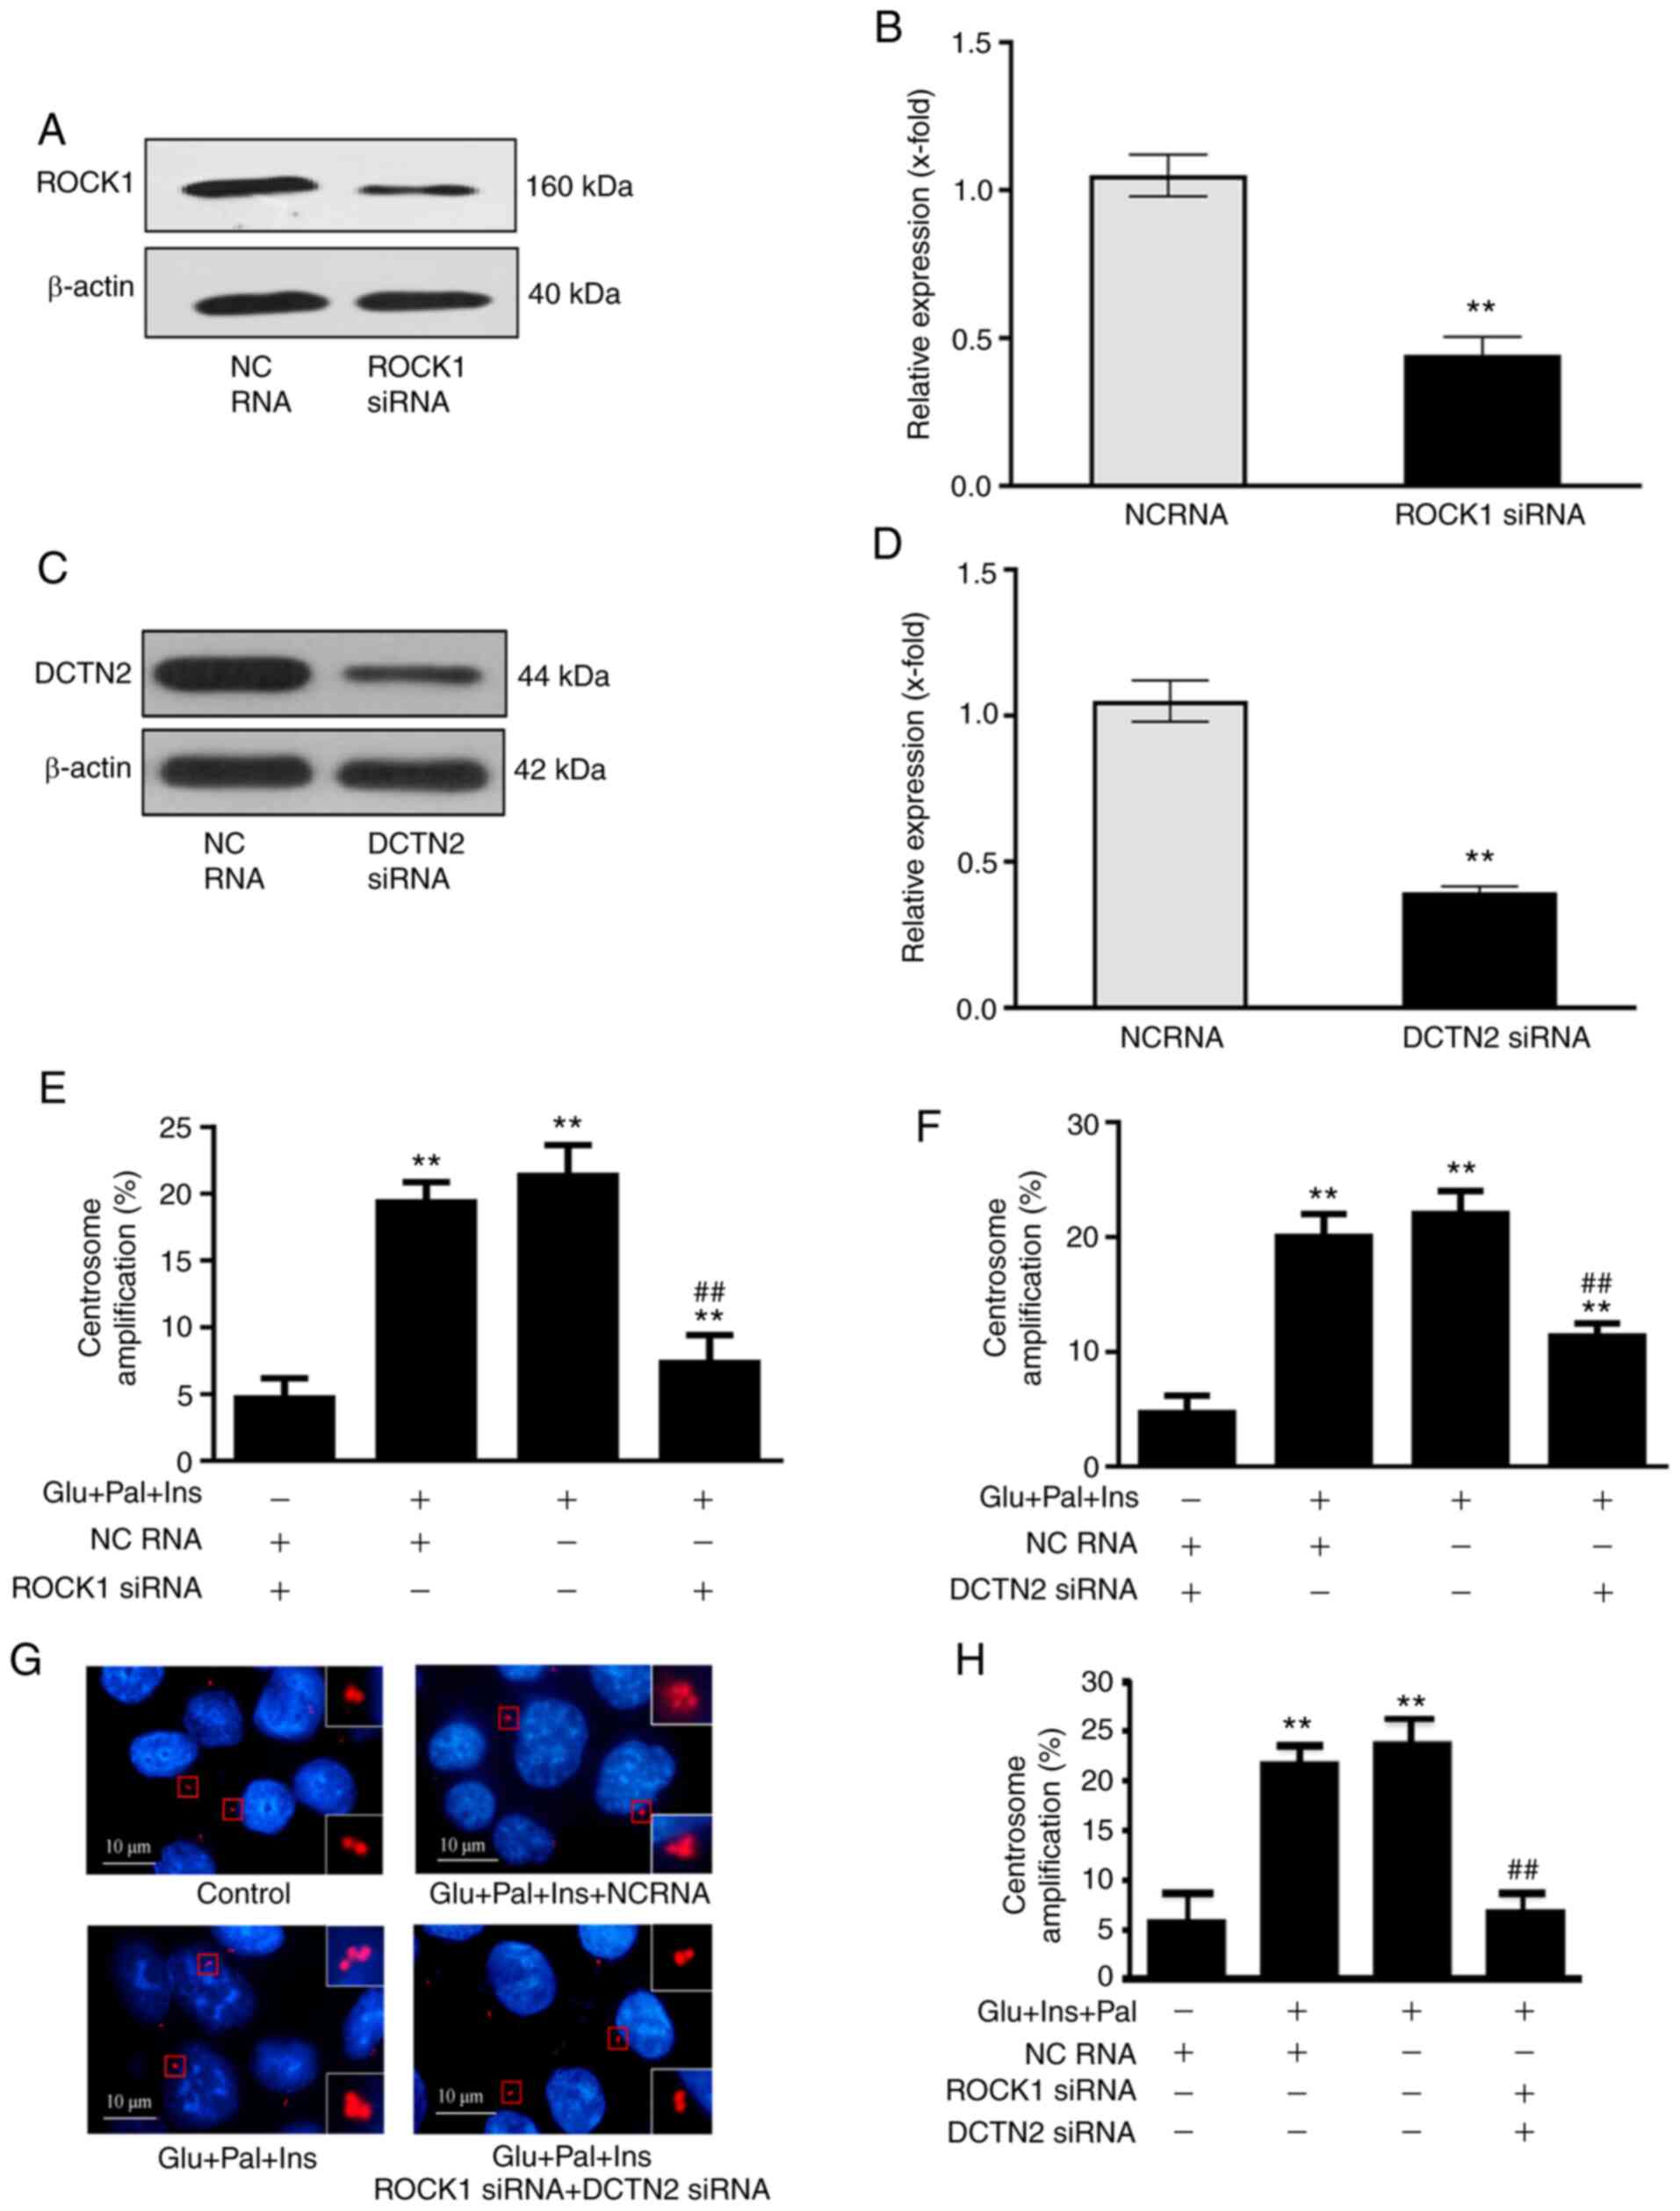 | Figure 5.Disruption of the ROCK1-DCTN2 protein
complex inhibits centrosome amplification in HCT116 cells.
siRNA-knockdown decreased the expression levels of (A and B) ROCK1
and (C and D) DCTN2. (E and F) Individually, knockdown of ROCK1 and
DCTN2 partially attenuated centrosome amplification. (G and H)
Co-transfection with ROCK1 and DCTN2 siRNAs inhibited centrosome
amplification to a considerable degree. In total, 200 cells used
for centrosome quantification. Percentage of centrosome
amplification=(the number of cells with centrosome
amplification/200) ×100. **P<0.01 vs. control;
##P<0.01 vs. samples treated high glucose, insulin
and palmitic acid. Glu, high glucose; Pal, palmitic acid; Ins,
insulin; NC, non-coding RNA; ROCK1, Rho-associated protein kinase
1; DCTN2, dynactin subunit 2; siRNA, small interfering RNA. |
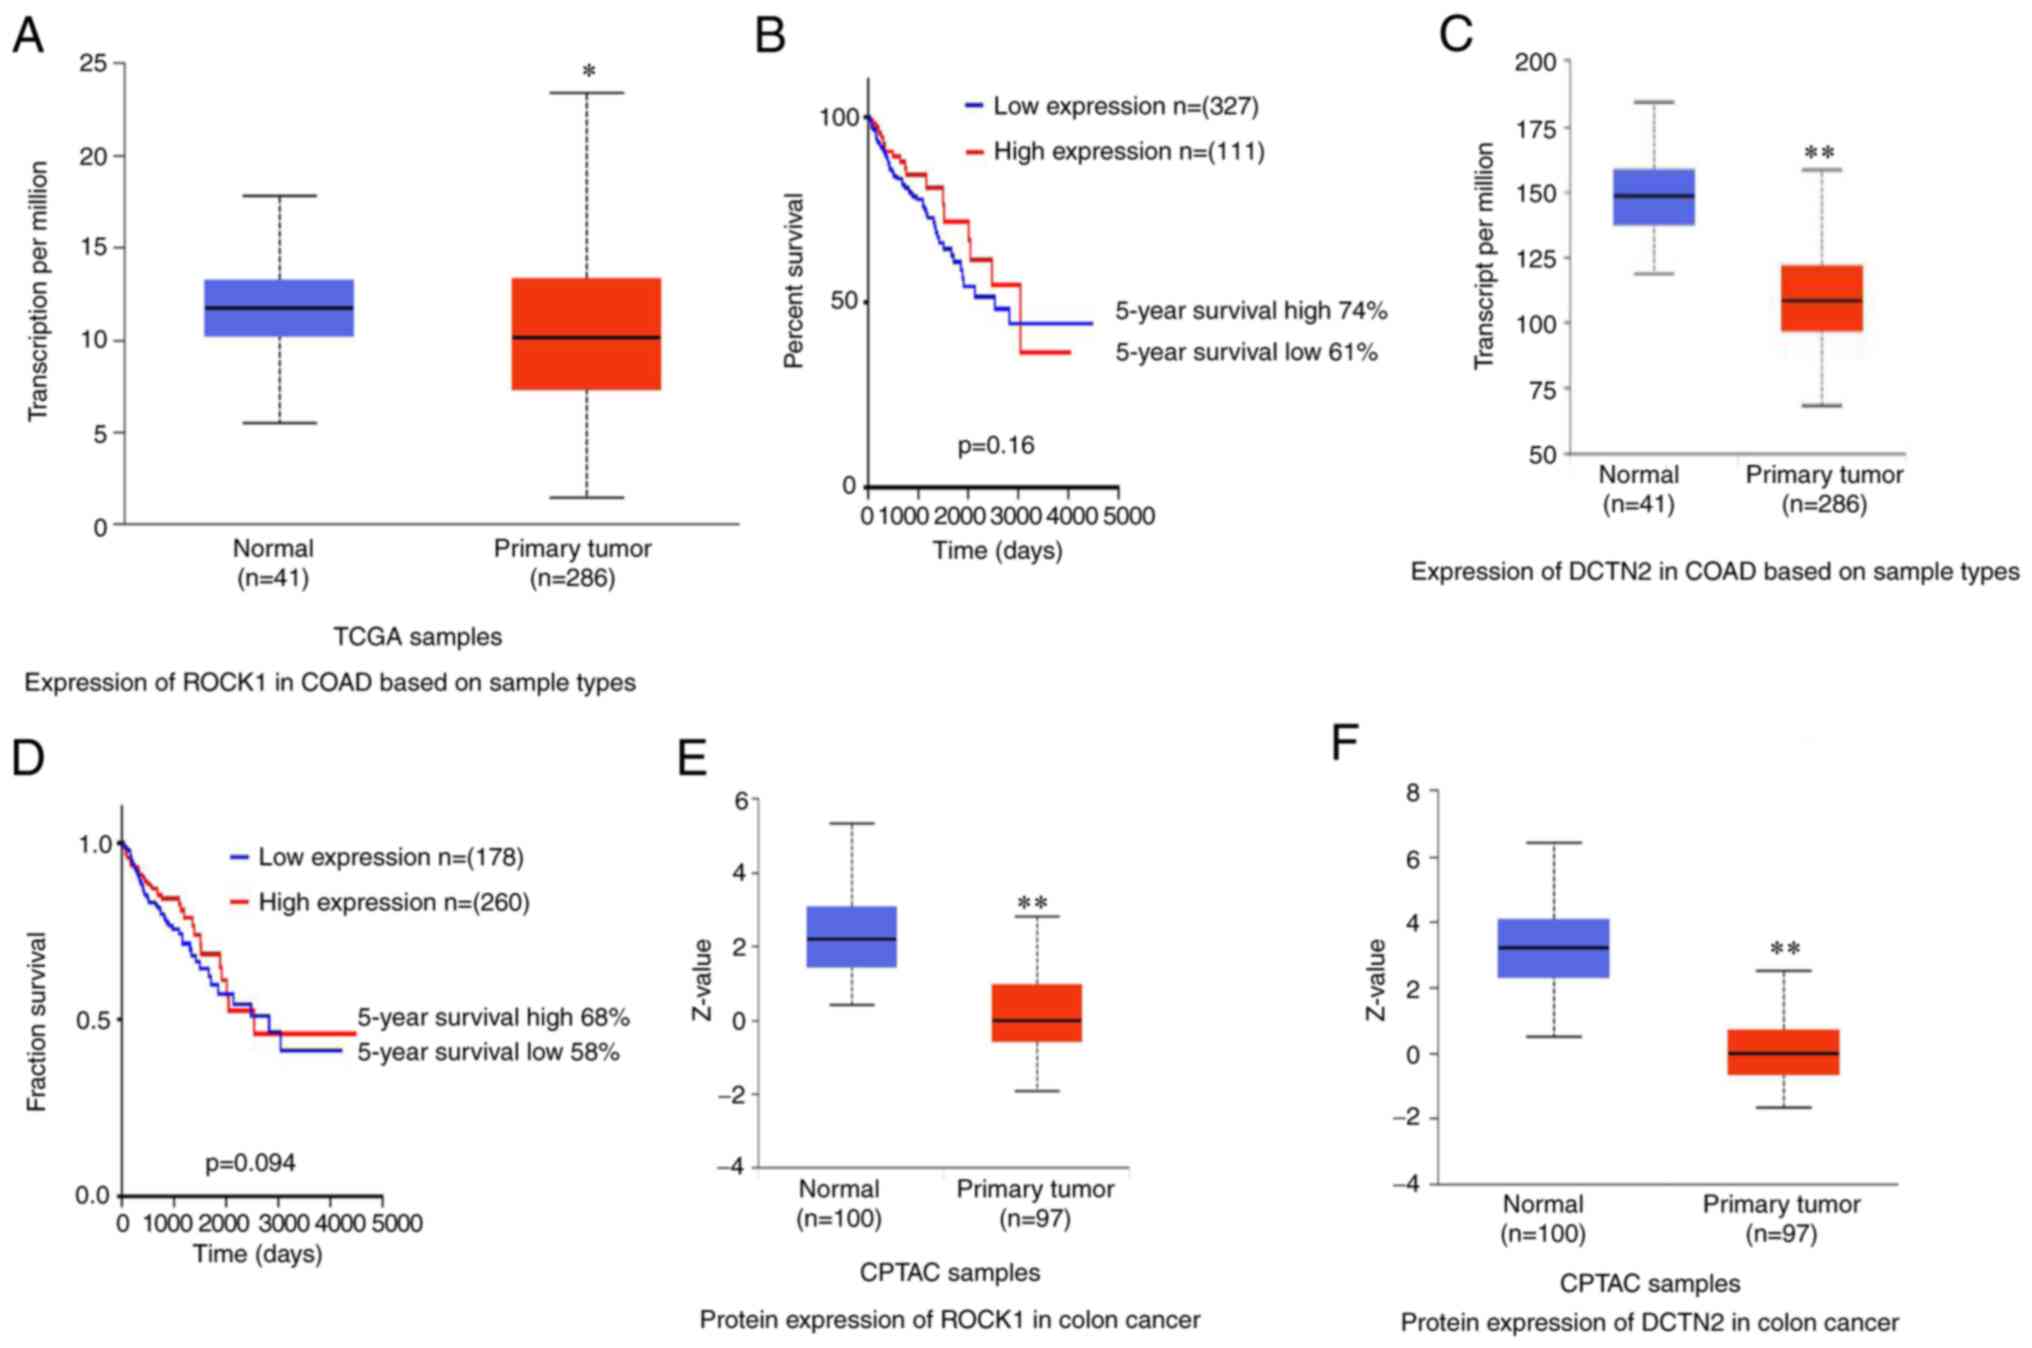
Expression levels of ROCK1 and DCTN2
in colon cancer
The expression levels of ROCK1 and DCTN2 in colon
cancer and their correlation with prognosis were analyzed using
UALCAN and the HUMAN PROTEIN ATLAS. ROCK1 mRNA expression was
higher in normal colon tissues compared with cancer tissues
(P<0.05). However, ROCK1 expression was not associated with
prognosis, and it did not predict the 5-year survival rate
(P>0.05; Fig. 6A and B).
Furthermore, the expression level of DCTN2 was lower in cancer
tissues compared with normal colon tissues (P<0.01), and was not
associated with prognosis (P>0.05; Fig. 6C and D). The expression levels of
ROCK1 and DCTN2 were also analyzed using Clinical Proteomic Tumor
Analysis Consortium, and were also decreased in cancer tissues in
comparison with normal tissues (both P<0.001; Fig. 6E and F). It would be interesting to
investigate whether binding between ROCK1 and DCTN2, rather than
the expression levels, is associated colon cancer prognosis.
Discussion
The results of the present study demonstrated that
treating HCT116 human colon cancer cells and non-cancerous IEC-6
cells with high glucose, insulin and palmitic acid, increased the
expression levels and binding interaction between ROCK1 and DCTN2,
which resulted in centrosome amplification. These results confirmed
those of our previous study, indicating that ROCK1 is an initiating
signal for diabetes-associated centrosome amplification (6); notably, knockdown of both ROCK1 and
DCTN2 blocked centrosome amplification, suggesting that the
formation of the ROCK1-DCTN2 protein complex is a key signaling
event. It was indicated that the binding of the two proteins was
more important than their expression levels, as these levels were
not associated with prognosis, although their individual roles in
cancer development should be further investigated. It should be
noted that binding between the two proteins should be confirmed
using other methodologies, such as far-western blot analysis, yeast
two-hybrids and fluorescence resonance energy transfer analyses.
Whether the increased binding in response to the treatment occurred
in the centrosomes should also be tested. Moreover,
immunofluorescent staining in combination with confocal imaging is
not accurate enough to differentiate the level of protein complex
in the centrosome before and after treatment. The present study was
unable to predict the binding model between ROCK1 and DCTN2 using
existing databases, since the three-dimensional structure of DCTN2
is not available. In addition, data from experiments using other
technologies are required to further support the current view that
ROCK1 and DCTN2 form a complex under the present experimental
conditions.
DCTN2 is a 50 kDa subunit of dynactin, which is a
multiprotein complex associated with dynein. Cytoplasmic dynein is
a molecular motor responsible for minus-end-directed movement along
microtubules (29). DCTN2 is also
required for efficient autophagy under hypertonic stress, where it
is likely to act within dynein (30),
supporting the notion that dynein serves a regulatory role in
autophagy (31). In a Norwegian
family, the DCTN2 gene was found to be associated with
Charcot-Marie-Tooth disease (32),
suggesting that it contributes to the pathogenesis of this
inherited neuropathy. The DCTN2 is located on chromosome 12q13-15,
which is a region prone to stable amplification in various cancer
types. For example, in osteosarcoma, DCTN2 is upregulated in SJSA-1
cells compared with SJRH30 cells, which is associated with
diminished centrosomes (33),
suggesting that it serves a role in centrosome homeostasis. In
glioma, amplification of 12q13-21 is observed even in low grade
tumors, leading to the upregulation of genes including DCTN2
(34), thereby suggesting a role for
this region in glioma development. Furthermore, low DCTN2 mRNA
expression is associated with favorable prognosis in cutaneous
melanoma (35), and its upregulation
is associated with colon cancer (36). These results suggest that enhanced
expression of DCTN2 is not a desirable event. The present study
demonstrated a new functional role of ROCK1 and DCTN2, with
particular relevance in cancer development.
How the ROCK1-DCTN2 complex promotes centrosome
amplification remains unknown. Our previous study identified
nucleophosmin 1 (NPM) as a signal for centrosome amplification
(37). NPM phosphorylation and
dissociation from the centrosome is known to cause centrosome
amplification (29). Therefore, it
would be interesting to determine whether the protein complex
targets NPM, directly or indirectly. It also remains unknown
whether the ROCK1-DCTN2 complex interacts with other recognized
protein mediators of centrosome amplification, such as polo kinase
4. Both ROCK1 and DCTN2 are localized to one centrosome, at least
at some stage in centrosome dynamics (6). This raises the issue of whether a
centrosome harboring these proteins is classified as a mother or
daughter centrosome.
As a key signaling complex, The ROCK1-DCTN2 provides
a target for the effective inhibition of centrosome amplification,
which allows for the production of cells with defective centrosome
amplification upon stable inhibition of cellular signal(s). This
may facilitate investigation into the roles of diabetes-associated
centrosome amplification in tumorigenesis and cancer cell
metastasis, where it is required to show that inhibiting centrosome
amplification prevents diabetes-associated tumor development. These
results may promote the assessment of centrosome amplification in
tumorigenesis and metastasis in cancer in general. The ROCK1-DCTN2
complex serves as a promising target for the potential future
development of intervention protocols targeting centrosome
amplification. In addition, centrosome amplification has other
pathological consequences (38), such
as disturbed cilia signaling (39),
and the dysregulation of cilia function is associated with kidney,
retinal and neural defects. In particular, ciliopathy is implicated
in the development of a retinal-renal ciliopathy (18,40).
Moreover, amplification of the centrosome disrupts renal
development and causes cystogenesis (16). Thus, it would be beneficial to
determine whether the ROCK1-DCTN2 protein complex triggers
centrosome amplification to promote other diseases, such as
diabetic retinopathy, nephropathy and neuropathy.
In conclusion, the results of the present suggested
that the binding between ROCK1 and DCTN2 regulates centrosome
homeostasis, which is a key signal for the centrosome amplification
triggered by pathophysiological factors in type 2 diabetes, such as
high glucose, insulin and palmitic acid. The ROCK1-DCTN2 protein
complex may therefore be a favorable target for inhibiting
centrosome amplification in future research and therapeutic
development.
Supplementary Material
Supporting Data
Acknowledgements
Not applicable.
Funding
The present study was supported by grants from the
Shanxi Health Commission Research Project (grant no. 09509) and
Jiangsu Normal University (grant no. 9212418102), as well as the
Department of Science and Technology of the Jiangsu Province (grant
no. BX2019029).
Availability of data and materials
The datasets used and/or analyzed during the current
study are available from the corresponding author on reasonable
request.
Authors' contributions
YFL and SCL contributed to the grant application,
study design and manuscript preparation. PW, LJS, JWW and GYS
performed the experiments. PW and YFL were responsible for the
statistical analysis. YFL and SCL confirm the authenticity of all
the raw data. All authors have read and approved the final
manuscript.
Ethics approval and consent to
participate
Not applicable.
Patient consent for publication
Not applicable.
Competing interests
The authors declare that they have no competing
interests.
References
|
1
|
Zheng Y, Ley SH and Hu FB: Global
aetiology and epidemiology of type 2 diabetes mellitus and its
complications. Nat Rev Endocrinol. 14:88–98. 2018. View Article : Google Scholar : PubMed/NCBI
|
|
2
|
Bommer C, Heesemann E, Sagalova V,
Manne-Goehler J, Atun R, Barnighausen T and Vollmer S: The global
economic burden of diabetes in adults aged 20–79 years: A
cost-of-illness study. Lancet Diabetes Endocrinol. 5:423–430. 2017.
View Article : Google Scholar : PubMed/NCBI
|
|
3
|
Nazir MA, AlGhamdi L, AlKadi M, AlBeajan
N, AlRashoudi L and AlHussan M: The burden of diabetes, its oral
complications and their prevention and management. Open Access
Maced J Med Sci. 6:1545–1553. 2018. View Article : Google Scholar : PubMed/NCBI
|
|
4
|
World Health Organization: Fact sheets.
http://www.who.int/news-room/fact-sheets/detail/diabetesJune
29–2019
|
|
5
|
Dall TM, Yang W, Gillespie K, Mocarski M,
Byrne E, Cintina I, Beronja K, Semilla AP, Iacobucci W and Hogan
PF: The economic burden of elevated blood glucose levels in 2017:
Diagnosed and undiagnosed diabetes, gestational diabetes mellitus,
and prediabetes. Diabetes Care. 42:1661–1668. 2019. View Article : Google Scholar : PubMed/NCBI
|
|
6
|
Wang P, Lu YC, Wang J, Wang L, Yu H, Li
YF, Kong A, Chan J and Lee S: Type 2 diabetes promotes cell
centrosome amplification via AKT-ROS-dependent signalling of ROCK1
and 14-3-3σ. Cell Physiol Biochem. 47:356–367. 2018. View Article : Google Scholar : PubMed/NCBI
|
|
7
|
Giovannucci E, Harlan DM, Archer MC,
Bergenstal RM, Gapstur SM, Habel LA, Pollak M, Regensteiner JG and
Yee D: Diabetes and cancer: A consensus report. Diabetes Care.
33:1674–1685. 2010. View Article : Google Scholar : PubMed/NCBI
|
|
8
|
Zhu B, Wu X, Wu B, Pei D, Zhang L and Wei
L: The relationship between diabetes and colorectal cancer
prognosis: A meta-analysis based on the cohort studies. PLoS One.
12:e01760682017. View Article : Google Scholar : PubMed/NCBI
|
|
9
|
Zhang Y, You X, Liu H, Xu M, Dang Q, Yang
L, Huang J and Shi W: High KIF2A expression predicts unfavorable
prognosis in diffuse large B cell lymphoma. Ann Hematol.
96:1485–1491. 2017. View Article : Google Scholar : PubMed/NCBI
|
|
10
|
Landman GW, Ubink-Veltmaat LJ, Kleefstra
N, Kollen BJ and Bilo HJ: Increased cancer mortality in type 2
diabetes (ZODIAC-3). Anticancer Res. 28:1373–1375. 2008.PubMed/NCBI
|
|
11
|
D'Assoro AB, Lingle WL and Salisbury JL:
Centrosome amplification and the development of cancer. Oncogene.
21:6146–6153. 2002. View Article : Google Scholar
|
|
12
|
Basto R, Brunk K, Vinadogrova T, Peel N,
Franz A, Khodjakov A and Raff JW: Centrosome amplification can
initiate tumorigenesis in flies. Cell. 133:1032–1042. 2008.
View Article : Google Scholar : PubMed/NCBI
|
|
13
|
Li J, Xuan JW, Khatamianfar V, Valiyeva F,
Moussa M, Sadek A, Yang BB, Dong BJ, Huang YR and Gao WQ: SKA1
over-expression promotes centriole over-duplication, centrosome
amplification and prostate tumourigenesis. J Pathol. 234:178–189.
2014. View Article : Google Scholar : PubMed/NCBI
|
|
14
|
Fan G, Sun L, Shan P, Zhang X, Huan J,
Zhang X, Li D, Wang T, Wei T, Zhang X, et al: Loss of KLF14
triggers centrosome amplification and tumorigenesis. Nat Commun.
6:84502015. View Article : Google Scholar : PubMed/NCBI
|
|
15
|
Levine MS, Bakker B, Boeckx B, Moyett J,
Lu J, Vitre B, Spierings DC, Lansdorp PM, Cleveland DW, Lambrechts
D, et al: Centrosome amplification is sufficient to promote
spontaneous tumorigenesis in mammals. Dev Cell. 40:313–322.e5.
2017. View Article : Google Scholar : PubMed/NCBI
|
|
16
|
Dionne LK, Shim K, Hoshi M, Cheng T, Wang
J, Marthiens V, Knoten A, Basto R, Jain S and Mahjoub MR:
Centrosome amplification disrupts renal development and causes
cystogenesis. J Cell Biol. 217:2485–2501. 2018. View Article : Google Scholar : PubMed/NCBI
|
|
17
|
Godinho SA, Picone R, Burute M, Dagher R,
Su Y, Leung CT, Polyak K, Brugge JS, Théry M and Pellman D:
Oncogene-like induction of cellular invasion from centrosome
amplification. Nature. 510:167–171. 2014. View Article : Google Scholar : PubMed/NCBI
|
|
18
|
Lee SC and Chan JC: Evidence for DNA
damage as a biological link between diabetes and cancer. Chin Med J
(Engl). 128:1543–1548. 2015. View Article : Google Scholar : PubMed/NCBI
|
|
19
|
Dodson H, Bourke E, Jeffers LJ, Vagnarelli
P, Sonoda E, Takeda S, Earnshaw WC, Merdes A and Morrison C:
Centrosome amplification induced by DNA damage occurs during a
prolonged G2 phase and involves ATM. EMBO J. 23:3864–3873. 2004.
View Article : Google Scholar : PubMed/NCBI
|
|
20
|
He QJ, Wang P, Liu Q, Wu Q, Li YF, Wang J
and Lee SC: Secreted Wnt6 mediates diabetes-associated centrosome
amplification via its receptor FZD4. Am J Physiol Cell Physiol.
318:C48–C62. 2020. View Article : Google Scholar : PubMed/NCBI
|
|
21
|
Hartmann S, Ridley AJ and Lutz S: The
function of Rho-associated kinases ROCK1 and ROCK2 in the
pathogenesis of cardiovascular disease. Front Pharmacol. 6:2762015.
View Article : Google Scholar : PubMed/NCBI
|
|
22
|
Liang H, Zhang C, Guan H, Liu J and Cui Y:
LncRNA DANCR promotes cervical cancer progression by upregulating
ROCK1 via sponging miR-335-5p. J Cell Physiol. 234:7266–7278. 2019.
View Article : Google Scholar : PubMed/NCBI
|
|
23
|
Tsai NP and Wei LN: RhoA/ROCK1 signaling
regulates stress granule formation and apoptosis. Cell Signal.
22:668–675. 2010. View Article : Google Scholar : PubMed/NCBI
|
|
24
|
Chen S, Liu Z, Lu S and Hu B: EPEL
promotes the migration and invasion of osteosarcoma cells by
upregulating ROCK1. Oncol Lett. 17:3133–3140. 2019.PubMed/NCBI
|
|
25
|
Zucchini C, Martinelli M, De Sanctis P,
Rodia MT, Mattei G, Ugolini G, Montroni I, Ghignone F and Solmi R:
Possible gender-related modulation by the ROCK1 gene in colorectal
cancer susceptibility. Pathobiology. 82:252–258. 2015. View Article : Google Scholar : PubMed/NCBI
|
|
26
|
Akagi EM, Lavorato-Rocha AM, Maia Bde M,
Rodrigues IS, Carvalho KC, Stiepcich MM, Baiocchi G, Sato-Kuwabara
Y, Rogatto SR, Soares FA and Rocha RM: ROCK1 as a novel prognostic
marker in vulvar cancer. BMC Cancer. 14:8222014. View Article : Google Scholar : PubMed/NCBI
|
|
27
|
Beeharry N, Lowe JE, Hernandez AR,
Chambers JA, Fucassi F, Cragg PJ, Green MH and Green IC: Linoleic
acid and antioxidants protect against DNA damage and apoptosis
induced by palmitic acid. Mutat Res. 530:27–33. 2003. View Article : Google Scholar : PubMed/NCBI
|
|
28
|
Huang da W, Sherman BT and Lempicki RA:
Systematic and integrative analysis of large gene lists using DAVID
bioinformatics resources. Nat Protoc. 4:44–57. 2009. View Article : Google Scholar : PubMed/NCBI
|
|
29
|
Chan N and Lim TM: Cytoplasmic
nucleophosmin has elevated T199 phosphorylation upon which G2/M
phase progression is dependent. Sci Rep. 5:117772015. View Article : Google Scholar : PubMed/NCBI
|
|
30
|
Nunes P, Ernandez T, Roth I, Qiao X,
Strebel D, Bouley R, Charollais A, Ramadori P, Foti M, Meda P, et
al: Hypertonic stress promotes autophagy and microtubule-dependent
autophagosomal clusters. Autophagy. 9:550–567. 2013. View Article : Google Scholar : PubMed/NCBI
|
|
31
|
Xu M, Li XX, Chen Y, Pitzer AL, Zhang Y
and Li PL: Enhancement of dynein-mediated autophagosome trafficking
and autophagy maturation by ROS in mouse coronary arterial
myocytes. J Cell Mol Med. 18:2165–2175. 2014. View Article : Google Scholar : PubMed/NCBI
|
|
32
|
Braathen GJ, Høyer H, Busk ØL, Tveten K,
Skjelbred CF and Russell MB: Variants in the genes DCTN2, DNAH10,
LRIG3, and MYO1A are associated with intermediate
charcot-marie-tooth disease in a Norwegian family. Acta Neurol
Scand. 134:67–75. 2016. View Article : Google Scholar : PubMed/NCBI
|
|
33
|
Bransfield KL, Askham JM, Leek JP,
Robinson PA and Mighell AJ: Phenotypic changes associated with
DYNACTIN-2 (DCTN2) over expression characterise SJSA-1 osteosarcoma
cells. Mol Carcinog. 45:157–163. 2006. View Article : Google Scholar : PubMed/NCBI
|
|
34
|
Fischer U, Keller A, Leidinger P,
Deutscher S, Heisel S, Urbschat S, Lenhof HP and Meese E: A
different view on DNA amplifications indicates frequent, highly
complex, and stable amplicons on 12q13-21 in glioma. Mol Cancer
Res. 6:576–584. 2008. View Article : Google Scholar : PubMed/NCBI
|
|
35
|
Wang Q, Wang X, Liang Q, Wang S, Liao X,
Li D and Pan F: Prognostic value of dynactin mRNA expression in
cutaneous melanoma. Med Sci Monit. 24:3752–3763. 2018. View Article : Google Scholar : PubMed/NCBI
|
|
36
|
Wang S, Wang Q, Zhang X, Liao X, Wang G,
Yu L, Zhang W, Zhou Q, Hu S and Yuan W: Distinct prognostic value
of dynactin subunit 4 (DCTN4) and diagnostic value of DCTN1, DCTN2,
and DCTN4 in colon adenocarcinoma. Cancer Manag Res. 10:5807–5824.
2018. View Article : Google Scholar : PubMed/NCBI
|
|
37
|
Han X, Hou S and Yang A: Correlation
between IGFs-related proteins expression and incidence of
colorectal cancer in diabetic patients and related mechanisms. Med
Sci Monit. 22:848–854. 2016. View Article : Google Scholar : PubMed/NCBI
|
|
38
|
Marthiens V, Rujano MA, Pennetier C,
Tessier S, Paul-Gilloteaux P and Basto R: Centrosome amplification
causes microcephaly. Nat Cell Biol. 15:731–740. 2013. View Article : Google Scholar : PubMed/NCBI
|
|
39
|
Mahjoub MR and Stearns T: Supernumerary
centrosomes nucleate extra cilia and compromise primary cilium
signaling. Curr Biol. 22:1628–1634. 2012. View Article : Google Scholar : PubMed/NCBI
|
|
40
|
Otto EA, Hurd TW, Airik R, Chaki M, Zhou
W, Stoetzel C, Patil SB, Levy S, Ghosh AK, Murga-Zamalloa CA, et
al: Candidate exome capture identifies mutation of SDCCAG8 as the
cause of a retinal-renal ciliopathy. Nat Genet. 42:840–850. 2010.
View Article : Google Scholar : PubMed/NCBI
|