Introduction
Gastrointestinal stromal tumors (GIST) is the most common mesenchymal tumor of the digestive tract (1). The incidence of GIST is between 10 and 15 cases per 1 million worldwide (2). Imatinib mesylate (imatinib) is the primary agent of choice used for GIST treatment, which inhibits the expression of the tyrosine kinase receptor gene (KIT) (3). Imatinib is typically administered to patients with unresectable primary GIST or metastasized recurrent GIST (3). However, drug resistance to imatinib poses a major concern reducing the efficacy of GIST treatment. Generally, resistance to imatinib develops after a median of 18–24 months of treatment (4,5). Therefore, characterization of the mechanism underlying the acquisition of imatinib resistance in patients with GIST is essential for developing novel treatment strategies.
Cancer cells metabolize glucose through aerobic glycolysis in abundant levels of oxygen (6). Although the quantity of ATP produced using mitochondrial oxidative phosphorylation by tumor cells is lower compared with that produced by healthy cells, they proliferate rapidly by using the pentose phosphate pathway for nucleic acid synthesis (7,8). Cancer cells typically exhibit increased rates of glucose uptake and glycolysis (9). This key feature of cancer cells is called the Warburg effect (10,11). In terms of this phenomenon, a number of studies have reported an association between cancer-specific energy metabolism and cancer progression in non-small cell lung cancer, breast ductal carcinoma and brain tumor (11–13). In addition, several studies have reported that the Warburg effect can facilitate to chemotherapeutic resistance (14,15).
The rate of glycolysis in cancer cells depends on the presence of key glycolytic components, including glucose transporters (GLUT) (16). GLUT is the first rate-limiting factor in the glucose metabolic pathway (17). GLUT-1 is primarily responsible for basal glucose uptake and the maintenance of basal glucose metabolism, where it serves as a key modulator of intracellular ATP production (18,19). High GLUT-1 expression has been previously associated with high tumor aggressiveness and high rates of tumorigenesis in GIST, non-small cell lung cancer, breast ductal carcinoma and gastric adenocarcinoma (13,20,21). Furthermore, high GLUT-1 expression has been linked to chemotherapeutic resistance in colon cancer and in head and neck cancer cell lines (22,23). Although a numerous studies have reported an association between imatinib resistance and increased rates of glycolysis (24–28), the mechanism of action and role of GLUT-1 underlying this entire process in GIST remains unclear.
Evasion of apoptosis is a key characteristic feature of cancer cells (29). Specifically, disequilibrium between the activities of pro-and anti-apoptotic Bcl-2 proteins can determine cancer cell survival (30). Overexpression of anti-apoptotic Bcl-2 proteins has been frequently associated with recurrence, poorer prognosis and resistance to various cancer therapies (31). Furthermore, silencing GLUT-1 expression has been reported to induce apoptosis and inhibit cell proliferation in breast cancer cells (30).
Therefore, the present study aimed to investigate the relationship between the expression of components in the glycolytic pathway and imatinib resistance in GIST cells, with emphasis on GLUT-1. The aim of the present study was to explore a potential treatment strategy for overcoming drug resistance in imatinib-resistant GIST cells.
Materials and methods
Cell culture and cell viability assessment
The human gastrointestinal stromal tumor cell line GIST-T1 (cat. no. PMC-GIST01C) showing a negative result for mycoplasma contamination was purchased from Cosmo Bio Co., Ltd., who performed cell line authentication and characterization. The GIST-T1 cell line has a 57-nucleotide in-frame deletion in the KIT exon, which leads to the production of KIT proteins without the valine 570 and tyrosine 578 residues (32). The GIST-T1 cells were cultured in DMEM supplemented with 10% (v/v) FBS and glutamine without penicillin/streptomycin (HyClone; Cytiva) supplementation at 37°C in a humidified atmosphere containing 5% CO2.
Cell viability
The GLUT-1 inhibitor WZB117 was obtained from Selleck Chemicals. A total of 5×10³ cells/well were seeded into 96-well plates. DMSO (control), imatinib (2, 3.25, 4, 6.5, 8, 10, 13, 20, 26, 50, 52, 100, 200 and 500 nM) and/or WZB117 (2.5, 5, 10, 20, 40 and 80 µM) were administered either alone or in combination, respectively. The treatment of cells was at 37°C in a humidified atmosphere containing 5% CO2 for 72 h. The number of viable cells was determined by using the MTT assay (Sigma-Aldrich; Merck KGaA) assay to calculate the half-maximal inhibitory concentration (IC50) of imatinib and WZB117 either alone or in combination (33). The formazan crystals were dissolved using DMSO. The wavelengths used for the measurements in each well were 550 and 670 nm. The OD value of the control was set at 100 and the percentage of viable cells was calculated relative to the control. The IC50 values were calculated according to the equation in the Boltzman sigmoidal concentration response curve using nonlinear regression fitting models (Graph Pad Prism Version 8; GraphPad Software, Inc.). The combination index (CI), an indicator of drug-drug interactions in combination chemotherapy based on the median-effect principle of the mass-action law (34), was calculated using the CompuSyn software Version 1.0 (https://www.combosyn.com/index.html). The fraction of growth inhibition was calculated from the MTT assay data, where each corresponding concentration was entered into CompuSyn. CI values at 50% growth inhibition by drug combination treatment (CI50), which are the most reliable CI values, were then calculated using CompuSyn according to previous reports (35,36). CI values <1, 1, and >1 indicate synergistic, additive and antagonistic effects, respectively.
Induction of imatinib-resistance
GIST-T1 cells were treated with 1 nM imatinib (Gleevec®; Adooq Bioscience) to generate imatinib-resistant GIST cells. After treatment the cells were cultured at 37°C in a humidified atmosphere containing 5% CO2. The cells were passaged to 70–80% confluency. The concentration of imatinib was kept constant until the cells start to proliferate. The concentration was then gradually increased from 1 to 100 nM over a period of ~10 months, which was repeated to obtain the imatinib-resistant GIST-T1 cell line (GIST-T1/IM-R). GIST-T1/IM-R cells obtained were cultured in the continuous presence of 100 nM imatinib before use. After the establishment of GIST-T1/IM-R, Sanger sequencing (Genewiz, Inc.) was performed to confirm mutations in KIT (exons 8, 9, 11, 13, 14, 17 and 18) and in platelet-derived growth factor receptor α (PDGFRA) (exons 12, 14 and 18).
Western blotting
A total of 5×10⁴ cells/well were seeded into 6-well plates. After each treatment with different concentrations of DMSO (control), imatinib (0, 6.5, 13 and 500 nM), gene silencing or WZB117 (10 µM) either alone or in combination for 72 h at 37°C, whole cells were homogenized in a chilled RIPA assay buffer containing 25 mmol/l Tris-HCl (pH 7.6), 1% NP-40, 0.1% deoxycholic acid, 0.1% SDS, and 150 mmol/l NaCl (Thermo Fisher Scientific, Inc.) with protease inhibitor cocktail 1 (cat. no. 25955-24; Nacalai Tesque, Inc.), protease inhibitor cocktail 2 (cat. no. P5726; Sigma-Aldrich; Merck KGaA), and protease inhibitor cocktail 3 (cat. no. P0044; Sigma-Aldrich; Merck KGaA) and incubated for 15 min on ice. After centrifugation at 13,697 × g for 20 min at 4°C, the supernatants containing whole-cell protein samples were collected. Protein content was measured using a DC Protein Assay Kit (Bio-Rad Laboratories, Inc.). The protein lysate (7 µg) was separated by SDS-PAGE on 10–15% gels (FujiFilm Wako Pure Chemical Corporation) and then transferred onto PVDF membranes. After blocking the nonspecific binding sites with 5% non-fat milk in phosphate-PBS containing 0.1% Tween 20 (PBS-T) or PVDF blocking reagent for Can Get Signal (Toyobo Life Science) for 1 h at room temperature, the membranes were incubated overnight at 4°C with primary antibodies, which were diluted in the Can Get Signal Immunoreaction Enhancer Solution (Toyobo Life Science). The next day, the membranes were washed with PBS-T and incubated with a secondary antibody for 1 h before being washed with PBS-T at room temperature. The protein bands were visualized using Immobilon Forte Western HRP Substrate (EMD Millipore). The detection and quantification of bands were performed using Fusion-FX7 (Vilber Lourmat) (37,38).
The following primary antibodies were used: Anti-c-Kit (YR145; 1:1,000 dilution; cat. no. ab32363; Abcam), anti-phosphorylated (p-) c-Kit (pY703; 1:1,000 dilution; cat. no. ab62154; Abcam), anti-glucose transporter GLUT1 (1:5,000 dilution; cat. no. ab115730; Abcam), anti-lactate dehydrogenase (LDHA; 1:5,000 dilution; cat. no. ab52488; Abcam), anti-Bcl-2 (1:2,000 dilution; cat. no. ab182858; Abcam), anti-AKT (1:1,000 dilution; cat. no. 4691; Cell Signaling Technology, Inc.), anti-p-AKT (Ser473; 1:2,000 dilution; cat. no. 4060; Cell Signaling Technology, Inc.), anti-ERK1/2 (1:1,000 dilution; cat. no. 4695; Cell Signaling Technology, Inc.), anti-p-ERK1/2 (1:2,000 dilution; cat. no. 4370; Cell Signaling Technology, Inc.), anti-pyruvate kinase M2 (PKM2; 1:1,000 dilution; cat. no. 3198; Cell Signaling Technology, Inc.), anti-p-PKM2 (1:1,000 dilution; cat. no. 3827; Cell Signaling Technology, Inc.), anti-cleaved caspase-3 (1:1,000 dilution; cat. no. 9661; Cell Signaling Technology, Inc.), anti-cleaved caspase-9 (1:1,000 dilution; cat. no. 9505; Cell Signaling Technology, Inc.), anti-cleaved poly (ADP-ribose) polymerase (PARP; 1:1,000 dilution; cat. no. 5625; Cell Signaling Technology, Inc.), anti-GAPDH (1:1,000 dilution; cat. no. 2118; Cell Signaling Technology, Inc.) and anti-hexokinase 2 (HK2; 1:2,000 dilution; cat. no. 22029-1-AP; ProteinTech Group, Inc.). HRP-conjugated horse anti-rabbit IgG (1:10,000 dilution; cat. no. 7074S; Cell Signaling Technology, Inc.) was used as a secondary antibody.
Reverse transcription-quantitative PCR (RT-qPCR)
According to the manufacturer's protocols, total RNA was extracted using NucleoSpin miRNA (cat. no. U0971B; Takara Bio, Inc.). Reverse transcription was performed on the RNA using the One Step PrimeScript RT-PCR Kit (cat. no. RR064A; Takara Bio, Inc.) and the Applied Biosystems 7500 Real-Time PCR System (Thermo Fisher Scientific, Inc.). The reaction conditions were 37°C (15 min), 85°C (5 sec) and then the reaction was stopped at 4°C. Predesigned TaqMan fluorogenic probes and primer sets for the solute carrier family 2 member 1 (SLC2A1; Hs00892681 m1), HK2 (Hs00606086 m1), LDHA (Hs01378790 g1) and GAPDH (Hs03929097 g1) were purchased from Applied Biosystems (Thermo Fisher Scientific, Inc.). A dual-labeled fluorescent (fluorescein amidite and minor groove binder) probe and a primer set for PKM2 (PrimePCR™ Probe Assay: PKM2, Human; qHsaCIP0040657) were purchased from Bio-Rad Laboratories, Inc. THUNDERBIRD™ Probe qPCR Mix (cat. no. QPS-101) were purchased from Toyobo Life Science. The thermocycling conditions were 95°C (20 sec) followed by 40 cycles 95°C (3 sec) and 60°C (30 sec). Relative quantification was normalized to GAPDH expression using the 2−∆∆Cq method (39).
Measurement of glucose and lactate concentrations
A total of 5×10³ cells/well were seeded into 96-well plates. After each treatment with different concentrations of imatinib (0, 6.5 and 13 nM) for 72 h at 37°C, the culture medium was collected and cell viability and glucose and lactate concentrations were measured using the CellTiter-Glo 3D Cell Viability Assay (cat. no. G9681; Promega Corporation), Glucose Uptake-Glo Assay (cat. no. J1341; Promega Corporation) and the Lactate-Glo Assay (cat. no. J5021; Promega Corporation), respectively. All procedures were performed according to the manufacturer's protocols of each kit. Absorbance was measured using the GloMax Multi plus Detection System (Promega Corporation) to calculate the relative concentrations of lactate and glucose.
Gene expression omnibus (GEO) database
Clinical information and previously published transcriptomics data were obtained from the GEO database. The data reported by Rink et al (40) (GSE15966; 18-paired human GIST tissues samples) (https://www.ncbi.nlm.nih.gov/geo/query/acc.cgi?acc=GSE15966) were used to determine the effect of imatinib administration on the expression of the genes of interest. This gene expression profiling was performed using oligonucleotide microarrays on tumor samples obtained before and after imatinib therapy. The inclusion criteria are that the dataset that it contains the response data of imatinib therapy as well as expression data. There were no specific exclusion criteria. The non-responder group (tumor shrink rate ≤0) and the responder group (tumor shrinkage rate >0) were designated (40). These data were analyzed using the publicly available software R (version 4.0.1; http://stat.ethz.ch/pipermail/r-announce/2020/000655.html) to generate a boxplot and statistical significance of the association between the groups was evaluated using paired t-test.
Gene silencing or inhibition experiments
WZB117 is a small compound that inhibits GLUT-1-mediated sugar transport by binding reversibly at the exofacial sugar-binding site (41). The mature siRNAs for SLC2A1 [HSS109812 (siR-SLC2A1 #1; sense, 5′-GCCCAUGUAUGUGGGUGAAGUGUCA-3′ and antisense, 5′-UGACACUUCACCCACAUACAUGGGC-3′) and HSS109811 (siR-SLC2A1 #2; sense, 5′-GGCGGAAUUCAAUGCUGAUGAUGAA-3′ and antisense: 5′-UUCAUCAUCAGCAUUGAAUUCCGCC-3′) Human Stealth Select RNAi; Invitrogen; Thermo Fisher Scientific, Inc.] were used for the transfection of the cells.
A total of 5×10⁴ cells/well were seeded into 6-well plates 1 day before each treatment. The cells were treated with imatinib (13 nM) and WZB117 (10 µM) either alone or in combination for 72 h at 37°C. The inhibition level was assessed from 0 to 72 h of treatment. DMSO was used to control for non-specific effects during the inhibition experiments. For gene silencing, a total of 5×10⁴ cells/well were seeded into 6-well plates. At 6 h after seeding, transfection was performed using Lipofectamine RNAiMAX (Invitrogen; Thermo Fisher Scientific, Inc.). Silencer negative control siRNA (cat. no. 4390843; Invitrogen; Thermo Fisher Scientific, Inc.) was used as a control for nonspecific effects. In total, six experimental groups were defined based on the treatment of cells with the following for 72 h: i) DMSO (control); ii) imatinib (13 nM); iii) siR-SLC2A1 #1 (10 nM) alone; iv) siR-SLC2A1 #2 (10 nM) alone; v) siR-SLC2A1 #1 in combination with imatinib; and vi) siR-SLC2A1 #2 in combination with imatinib. The cells were assessed 72 h after transfection. Silencer negative control siRNA was administered as a negative control for i) and ii).
Apoptosis assay
Cells were seeded into cell culture flasks and treated with the indicated reagents for 72 h and then harvested for Annexin V-FITC/PI staining on 1×10⁶ cells using the Annexin V-FITC Early Apoptosis Detection Kit (cat. no. 6592; Cell Signaling Technology, Inc.). To 1×10⁶ cells, 1 µl Annexin V-FITC and 12.5 µl PI were added and the cells were stained for 10 min on ice. The double-stained cells were then analyzed using BD FACSAria II (BD Biosciences). Data were analyzed using the CellQuest™ software (BD Biosciences). In total, ≥10,000 cells were analyzed for each sample using the FlowJo software (FlowJo LLC).
Three-dimensional culture experiment
Cells were seeded into a 96-well plate (EZ-BindShunt® II; AGC Techno Glass Co., Ltd.) at a concentration of 0.3×10⁴ cells/well 48 h before each experiment. Imatinib (13 or 26 nM) and WZB117 (10 µM) were administered either alone or in combination. At 72 h after administration, the three-dimensional cell viability was assessed using a CellTiter-Glo 3D Cell Viability Assay (Promega Corporation) according to the manufacturer's protocols and measured using the GloMax Multi Detection System (Promega Corporation). Two-dimensional images of three-dimensional GIST-T1/IM-R cell spheroids were taken using light microscopy (BZ-X700; Keyence Corporation) at ×40 magnification (37). The diameter of the spheroid was measured by BZ-X Analyzer software (version 1.4.0.1; Keyence Corporation).
Statistical analysis
Each experiment was performed ≥ three times. Statistical significance between two groups was determined using the two-sided unpaired t-test. The publicly available software R (version 4.0.1; http://stat.ethz.ch/pipermail/r-announce/2020/000655.html) was used to plot the data obtained from the analysis of the glycolysis-related genes in GSE15966. Statistical significance among ≥ three groups was determined using one-way analysis of variance and Tukey's post hoc test were used for statistical analysis. The values are presented as the mean ± standard deviation. P<0.05 was considered to indicate a statistically significant difference.
Results
Effects of imatinib on GIST-T1 and GIST-T1/IM-R cells
The IC50 of imatinib in GIST-T1 and GIST-T1/IM-R cells was calculated to be 6.50 and 127.1 nM, respectively, suggesting that imatinib resistance in GIST-T1/IM-R cells was >19-fold higher compared with that in GIST-T1 cells (Fig. 1A). Sequencing analysis revealed that GIST-T1/IM-R cells harbored a secondary PDGFRA mutation on exon 12 (c.1701A>G) in addition to a deletion in KIT exon 11 (Fig. S1). Therefore, for the standard dosing concentrations of imatinib in the present study, 6.5 nM was set (IC50 of the parental GIST-T1 cells), whilst 13 nM was also set (double the IC50). In addition, 500 nM was identified to be at the upper limit of the imatinib dosage, which reduced cell viability of GIST-T1/IM-R cells by ~80%. The effect of imatinib administration on the activity of components in the KIT cascade in GIST-T1 and GIST-T1/IM-R cells was subsequently examined. The phosphorylation of KIT, AKT and ERK 1/2 remained unchanged after imatinib administration even at 13 nM in both cell lines tested (Figs. 1B and S2). Treatment with 500 nM imatinib significantly decreased the phosphorylation of KIT, AKT and ERK1/2 in both GIST-T1 and GIST-T1/IM-R cells compared with that in untreated controls cells (Figs. 1B and S2). Imatinib administration reduced GIST-T1 cell viability even at low concentrations without affecting the phosphorylation of KIT, AKT and ERK1/2. Therefore, other mechanisms independent of KIT phosphorylation may have mediated this suppression of viability after low-dose imatinib administration.
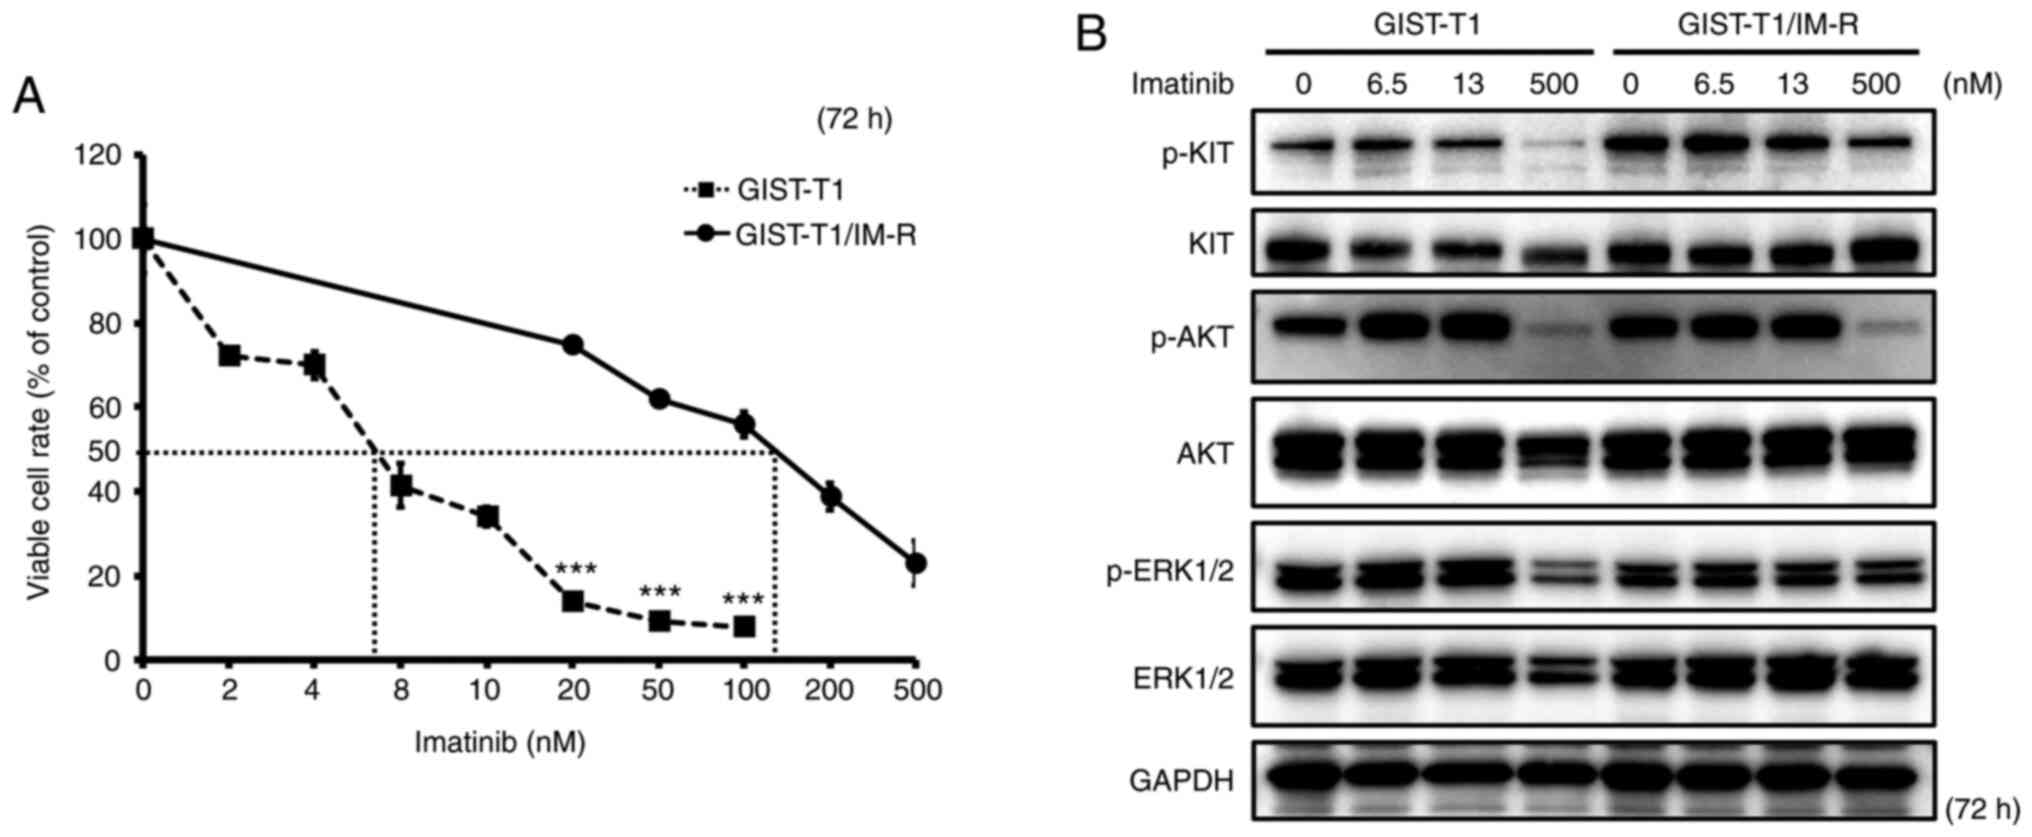 |
Figure 1.
Establishment of the GIST-T1/IM-R cell line. (A) The IC50 of imatinib in GIST-T1 and GIST-T1/IM-R cells as determined using the MTT 72 h after imatinib treatment. Treatment with imatinib (20 to 100 nM) significantly inhibited cell viability in GIST-T1 cells compared with that in GIST-T1/IM-R cells at the same doses. ***P<0.001 vs. GIST-T1. (B) Western blot analysis for determining the effect of imatinib on the phosphorylation of KIT, AKT and ERK, components in the tyrosine kinase receptor cascade in parental and imatinib-resistant GIST-T1 cells at 72 h after treatment. Imatinib (0, 6.5, 13 and 500 nM) was administered to parental cells and imatinib-resistant GIST-T1 cells. IM-R, imatinib-resistant.
|
Effect of imatinib administration on the glycolysis pathway in GIST-T1 and GIST-T1/IM-R cells
The effect of imatinib administration on the expression of glycolysis-related genes GLUT-1, HK2, PKM2 and LDHA in both GIST-T1 and GIST-T1/IM-R cells was next examined. Administration of 13 nM imatinib, a concentration that did not affect KIT expression or phosphorylation, decreased the mRNA expression of SLC2A1, HK2, PKM2 and LDHA in parental GIST-T1 cells, but instead increased their expression in GIST-T1/IM-R cells (Fig. 2A). GLUT-1 levels in GIST-T1 cells was decreased in a dose-dependent manner after treatment with a low doses imatinib (6.5 or 13 nM), whereas those in GIST-T1/IM-R cells were increased in a dose-dependent manner (Figs. 2B and S3). The expression and/or phosphorylation profile of glycolysis-related proteins PKM2 and LDHA in both cell lines were similar to that of GLUT-1 expression (Figs. 2B and S3). Results from glucose and lactate assays showed that both glucose uptake and lactate production were decreased in GIST-T1 cells after imatinib treatment but were instead increased in GIST-T1/IM-R cells (Fig. 2C). Furthermore, the effects of imatinib administration on GLUT-1, HK2 and LDHA expression in human GIST tissues obtained before and after imatinib therapy were measured by utilizing the GSE19566 dataset. In total, 18 paired samples were categorized into the following two groups: Non-responder group (tumor shrink rate, ≤0) and the responder group (tumor shrink rate, >0). Although the expression of GLUT-1 was significantly downregulated after imatinib treatment in the responder group, it did not change significantly in the non-responder group (Fig. 2D). These results suggest that alterations in GLUT-1 expression contributed to imatinib resistance in GIST-T1 cells.
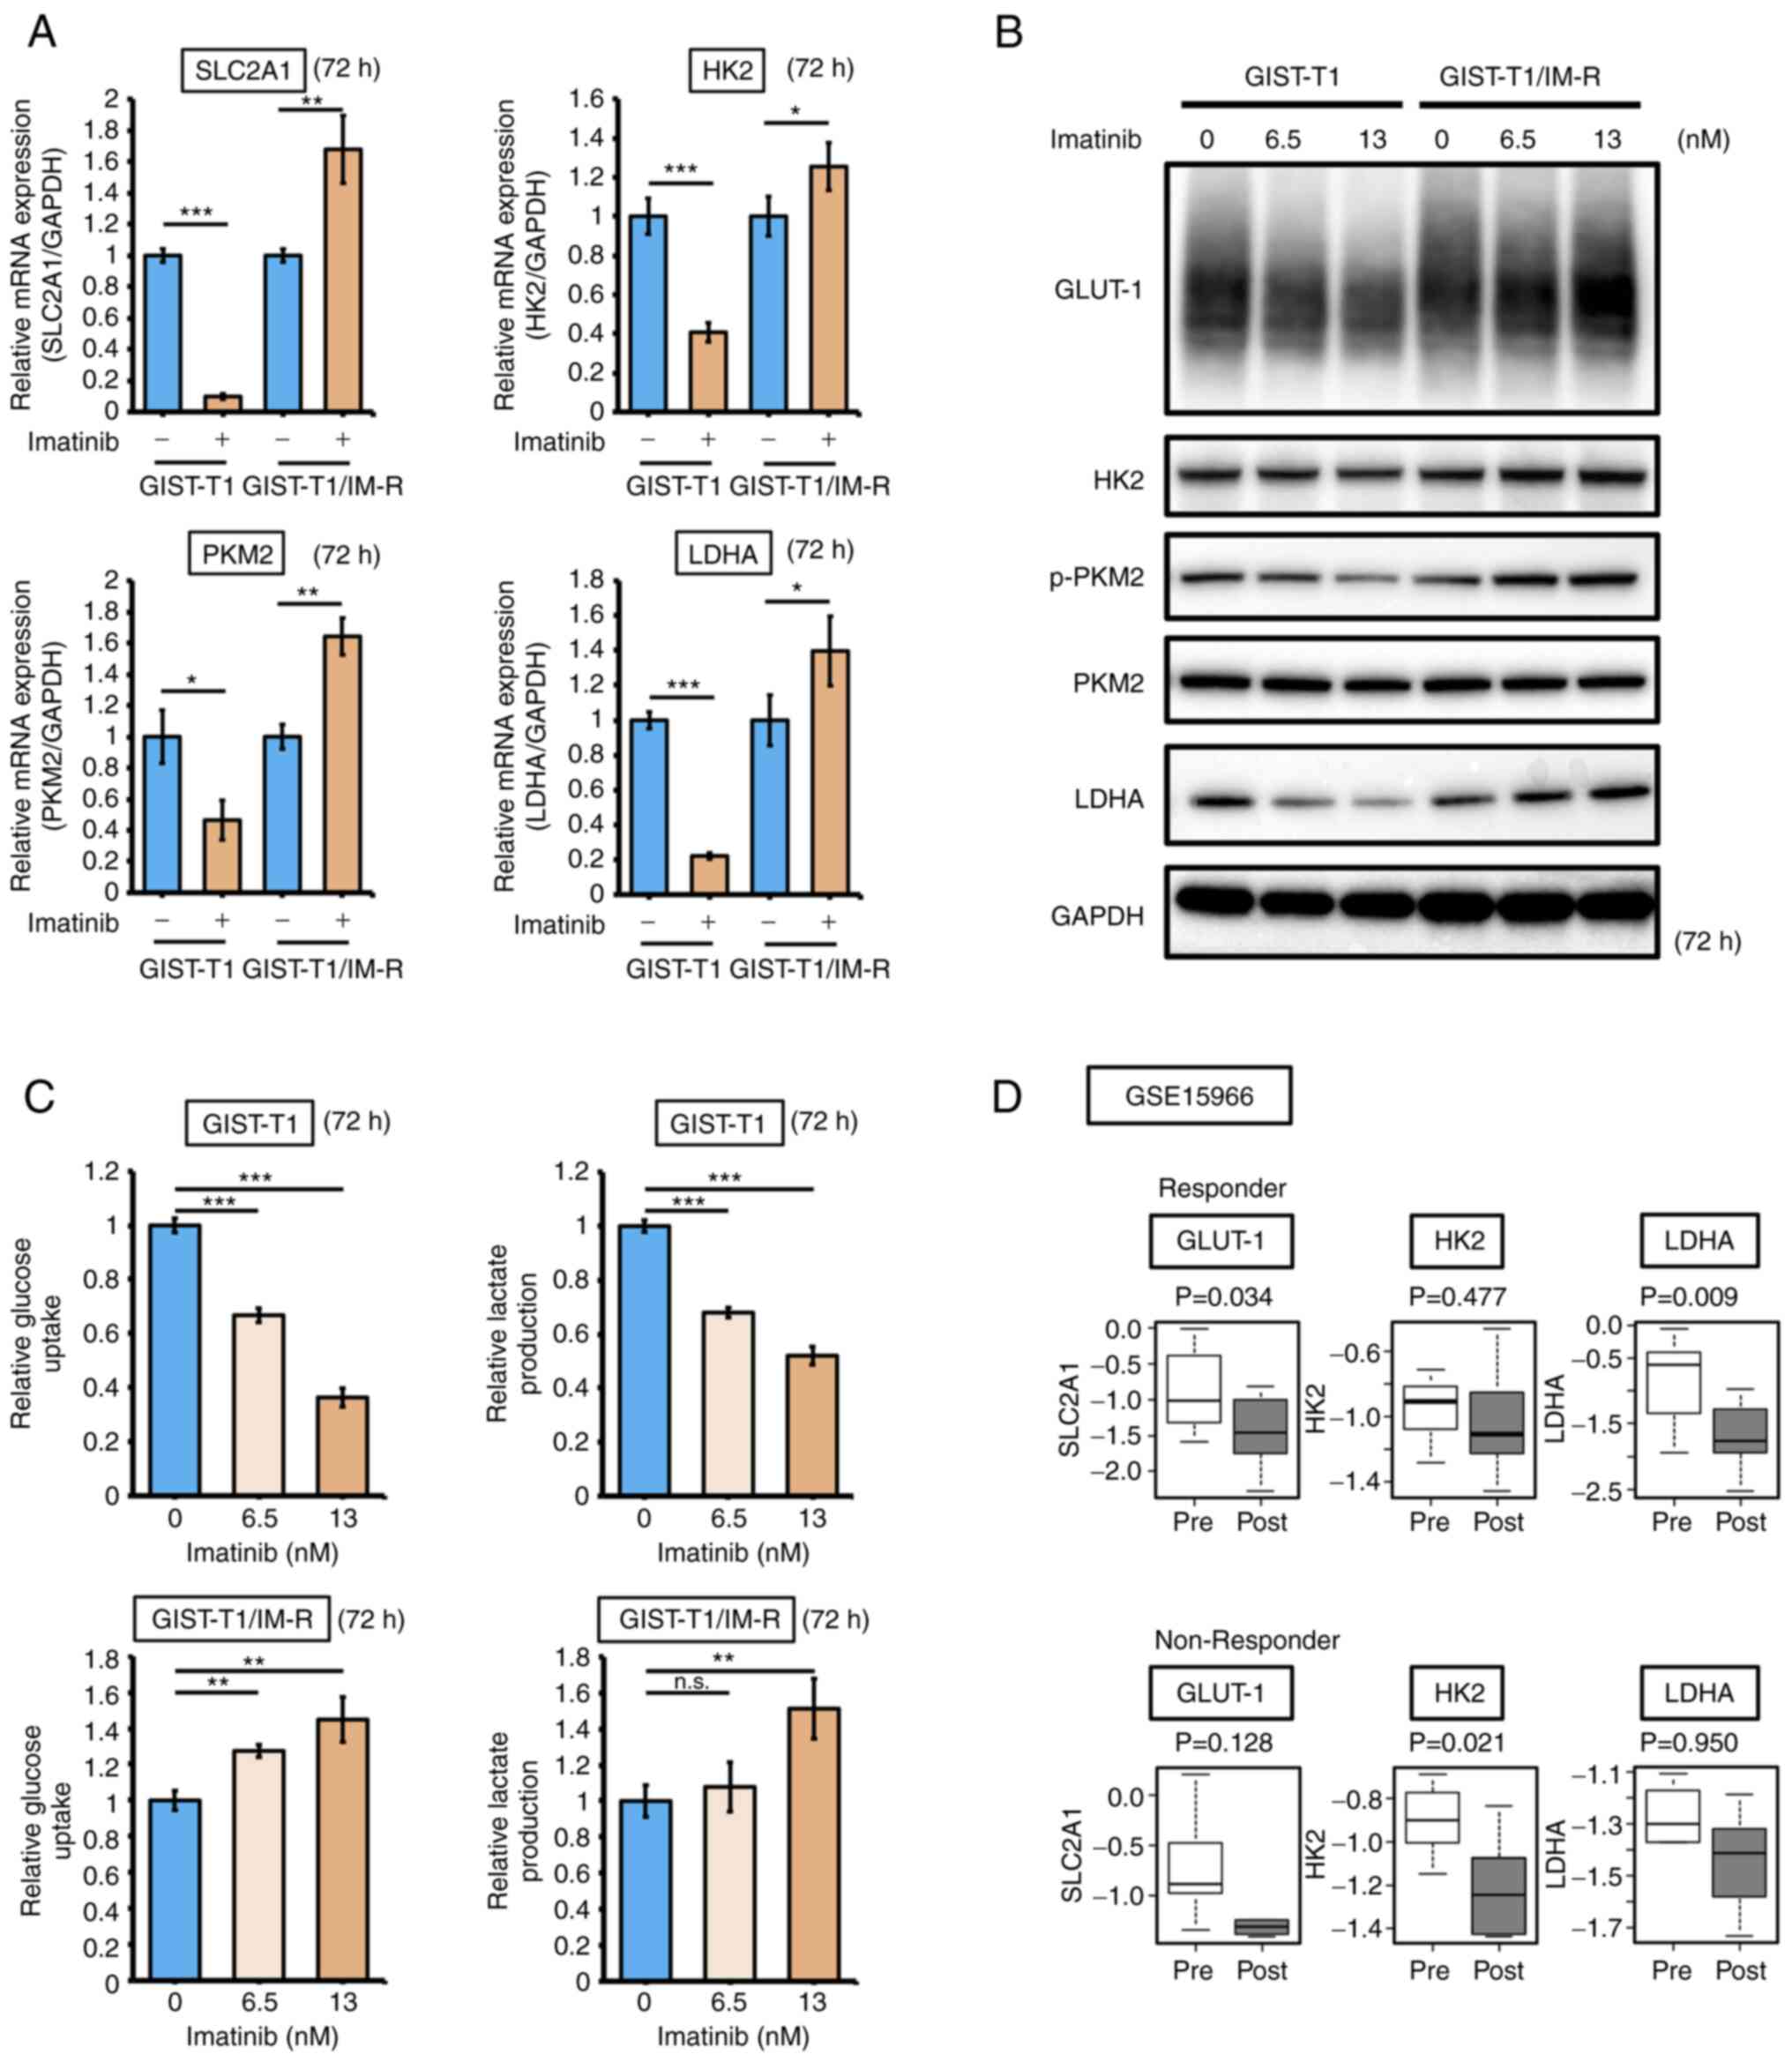 |
Figure 2.
Imatinib treatment suppresses glycolysis in GIST-T1 cells but enhances glycolysis in GIST-T1/IM-R cells. (A) mRNA expression of glycolysis-related genes SLC2A1, HK2, PKM2 and LDHA in parental and imatinib-resistant GIST-T1 cells at 72 h after treatment as detected using reverse transcription-quantitative PCR. The values are shown with the control (non-administration group) normalized to 1.0. (B) Western blot analysis of the expression and/or phosphorylation of glycolysis-related proteins HK2, PKM2 and LDHA in parental and imatinib-resistant GIST-T1 cells at 72 h after treatment. Imatinib (0, 6.5 and 13 nM) was administered to parental cells and imatinib-resistant cells. (C) Glucose and lactate assays in parental and imatinib-resistant GIST-T1 cells at 72 h after treatment. (D) The effect of imatinib on the expression of glycolysis-related genes HK2, PKM2 and LDHA according to the GSE15966 dataset. Their expression in responder (13 paired human GIST tissue samples) and non-responder (5 paired human GIST tissue samples) samples were compared. The black line inside the boxplots indicate the median value and the span of the rectangle presents the inter-quartile ranges. *P<0.05; **P<0.01 and ***P<0.001. GIST-T1, parental cells; GIST-T1/IM-R, imatinib-resistant GIST-T1 cells; SLC2A1, solute carrier family 2 member 1; HK2, hexokinase 2; p-, phosphorylated; PKM2, pyruvate kinase M2; LDHA, lactate dehydrogenase; GLUT-1, glucose transporter 1; Pre, Pre-treatment samples; Post, Post-treatment samples.
|
Effect of SLC2A1 gene silencing on imatinib-resistant GIST cells
To determine the effects of imatinib treatment on GLUT-1 expression in imatinib-resistant cells, SLC2A1 expression was knocked down in GIST-T1/IM-R cells. Transfection with siR-SLC2A1 downregulated the expression of SLC2A1 and GLUT-1 (Fig. 3A and B). In addition, significant reduction in cell viability was observed in GIST-T1/IM-R cells transfected with siR-SLC2A1 and/or treated with imatinib compared with that in control (Fig. 3C). Furthermore, combined transfection with siR-SLC2A1 and treatment with imatinib induced significant reductions in cell viability in GIST-T1/IM-R cells compared with that in cells treated with imatinib alone or transfected with siR-SLC2A1 alone (Fig. 3C). However, HK2, p-PKM2 and LDHA protein levels did not show significant changes in any of the siR-SLC2A1-transfected groups compared to control or imatinib (13 nM) alone (Figs. 3D and S4). These findings suggest that in GIST-T1/IM-R cells, transfection with siR-SLC2A1 and imatinib treatment significantly reduced cell viability but did not affect the expression of glycolysis-related proteins, implying that other mechanisms may have contributed to the reduced cell viability.
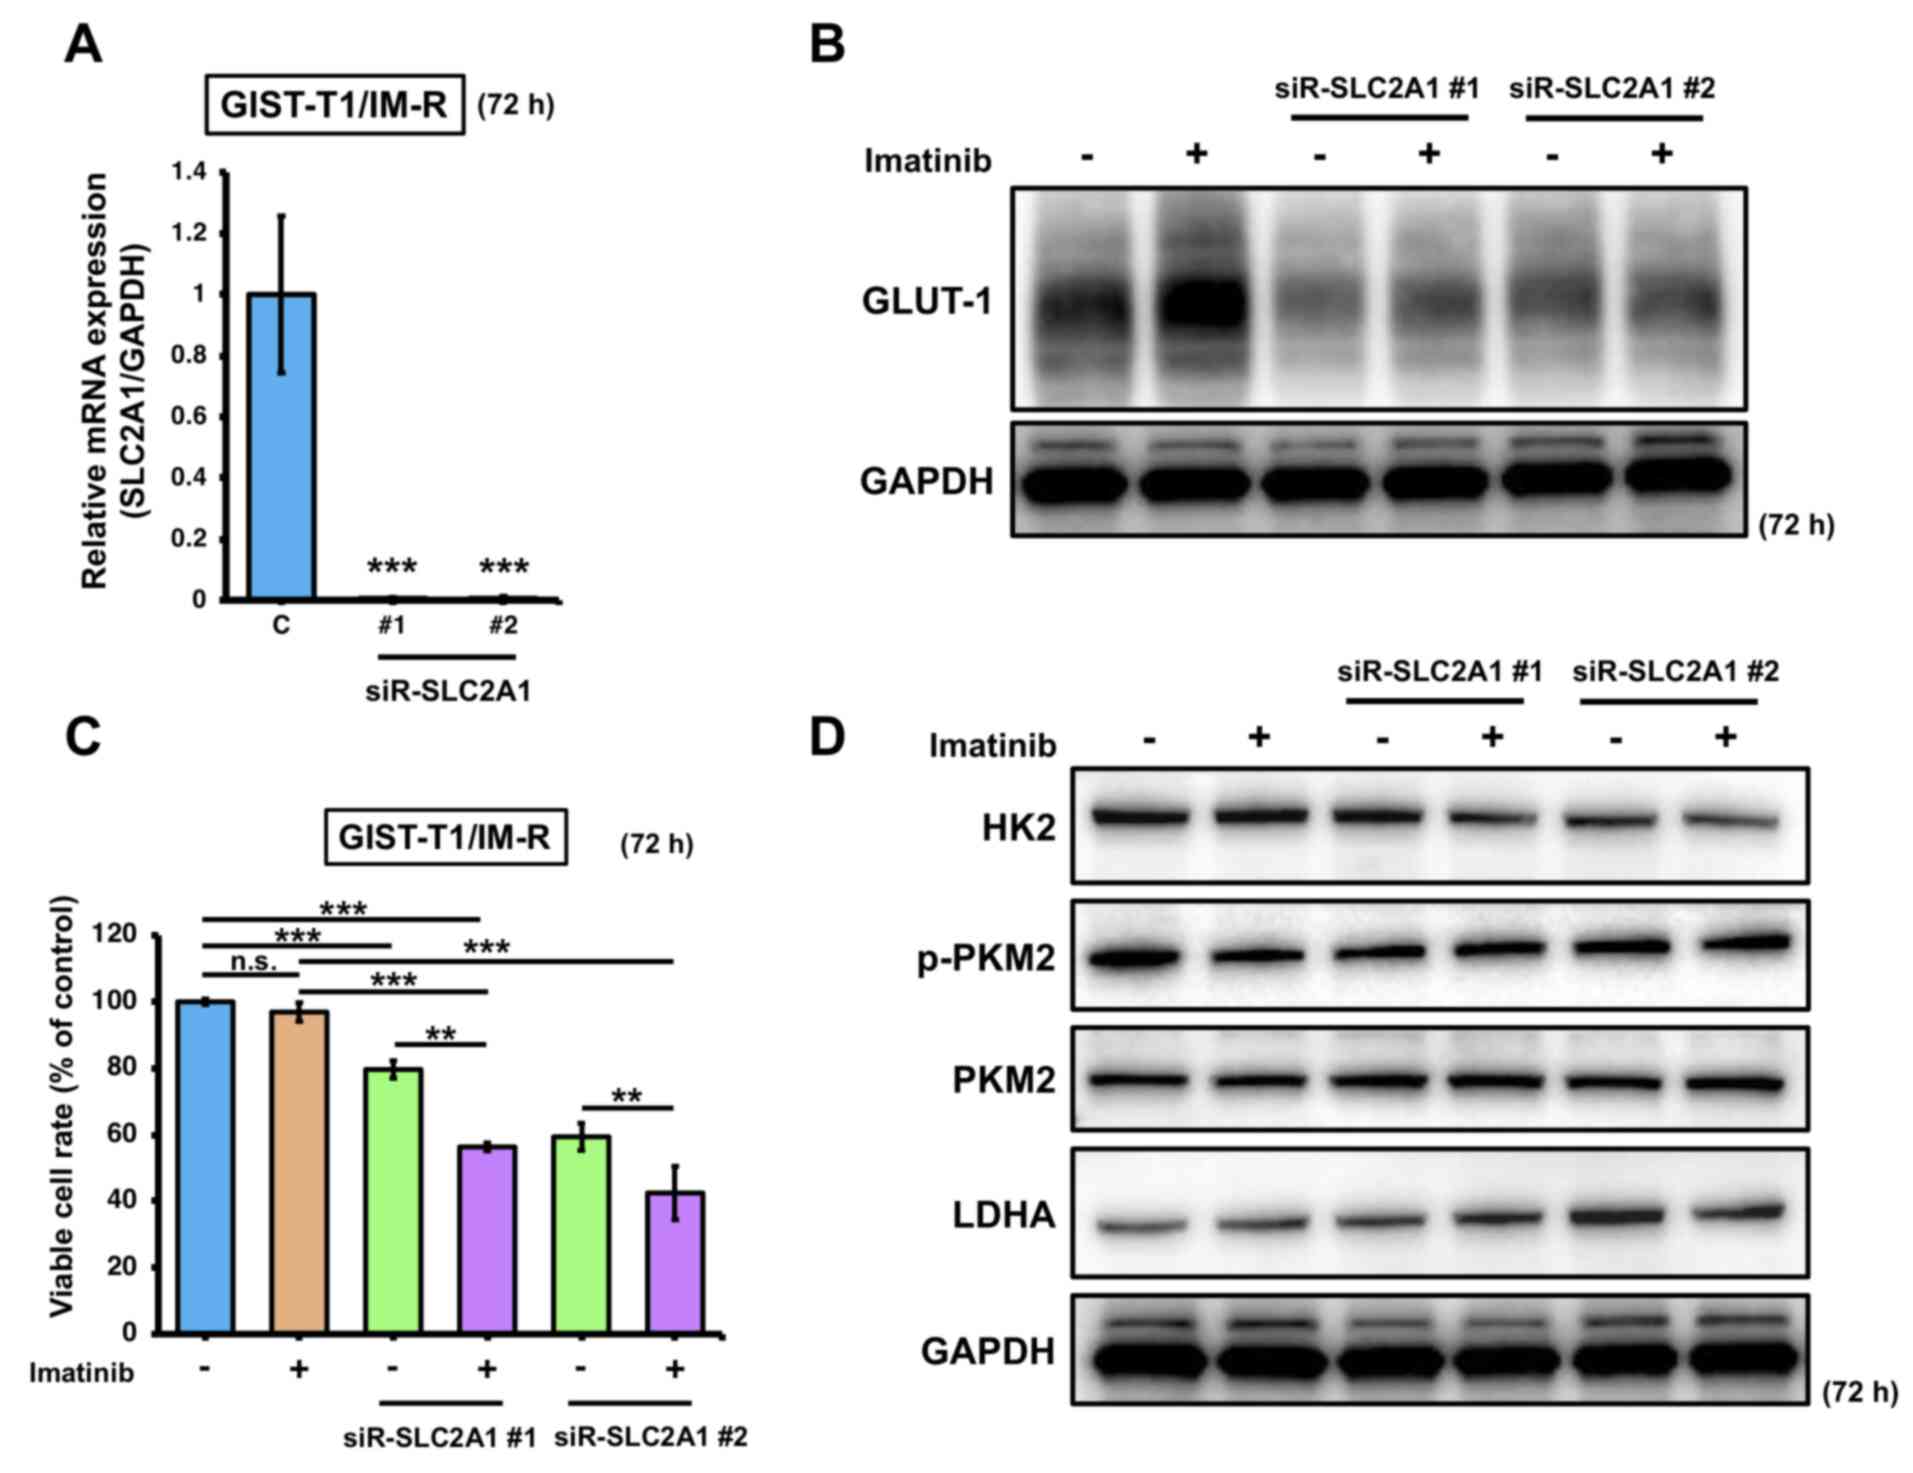 |
Figure 3.
Effects of combined SLC2A1 silencing and imatinib administration on GIST-T1/IM-R cells. (A) mRNA expression of SLC2A1 at 72 h after transfection with siR-SLC2A1 (10 nM). The values are shown with control siRNA normalized to 1.0. ***P<0.001 vs. C. (B) Western blot analysis of GLUT-1 expression at 72 h after treatment with imatinib (13 nM) and/or transfection with siR-SLC2A1 (10 nM) in GIST-T1/IM-R cells. (C) GIST-T1/IM-R cell viability 72 h after imatinib (13 µM) treatment and/or siR-SLC2A1 (10 nM) transfection. (D) Protein expression levels of glycolysis components HK2, PKM2 and LDHA in GIST-T1/IM-R cells as measured by western blotting. The experimental conditions were the same as those in (B). **P<0.01 and ***P<0.001. GIST-T1/IM-R, imatinib-resistant GIST-T1 cells; C, control siRNA; #1; siR, small interfering RNA; n.s., not significant SLC2A1; solute carrier family 2 member 1; siR-SLC2A1 #1, #2; siR-SLC2A1 #2; HK2, hexokinase 2; p-, phosphorylated; PKM2, pyruvate kinase M2; LDHA, lactate dehydrogenase; GLUT-1, glucose transporter 1.
|
Effect of the GLUT-1 inhibitor WZB117 on GIST-T1/IM-R cell viability and glycolysis
The effect of the GULT-1 inhibitor WZB117 on GIST-T1/IM-R cells was next assessed. The IC50 of WZB117 was calculated to be 15.8 µM in GIST-T1/IM-R cells (Fig. S5). Based on this result, 10 µM was set as the standard administration concentration of WZB117, whereas 13 nM was set as the standard administration concentration of imatinib. GIST-T1/IM-R cells were treated with imatinib (0-104 nM) and/or WZB117 (0-80 µM) at a molar rate of 13:10,000 before cell viability was assessed. The CI50 value was calculated to be 0.708 (CI value, <1) for both imatinib and WZB117, indicating a synergistic inhibitory effect on GIST-T1/IM-R cell viability (Fig. 4A). Considerable reduction in cell viability was also observed after combination treatment with 13 nM imatinib and 10 µM WZB117 in GIST-T1/IM-R cells compared with that in control or imatinib (13 nM) alone (Fig. 4B). Changes in the expression of glycolysis-related proteins in WZB117-treated GIST-T1/IM-R cells was next measured. GLUT-1 protein expression was reduced to the greatest extent at 6 h after WZB117 treatment, but the protein levels of p-PKM2 and LDHA at 6 h after WZB117 treatment remained unchanged (Figs. 4C and S6A). The protein expression level of HK2 was significantly increased at 48 and 72 h after WZB treatment compared with that in the control group (Figs. 4C and S6A). Similarly, the protein expression of GLUT-1 was significantly downregulated in GIST-T1/IM-R cells treated with both imatinib and WZB117 compared to control or imatinib alone, but those of the other glycolysis-related proteins remained unchanged (Figs. 4D and S6B). These findings also suggest that in GIST-T1/IM-R cells, although GLUT-1 suppression contributed to the reduction of cell viability, factors other than glycolysis were associated with this effect.
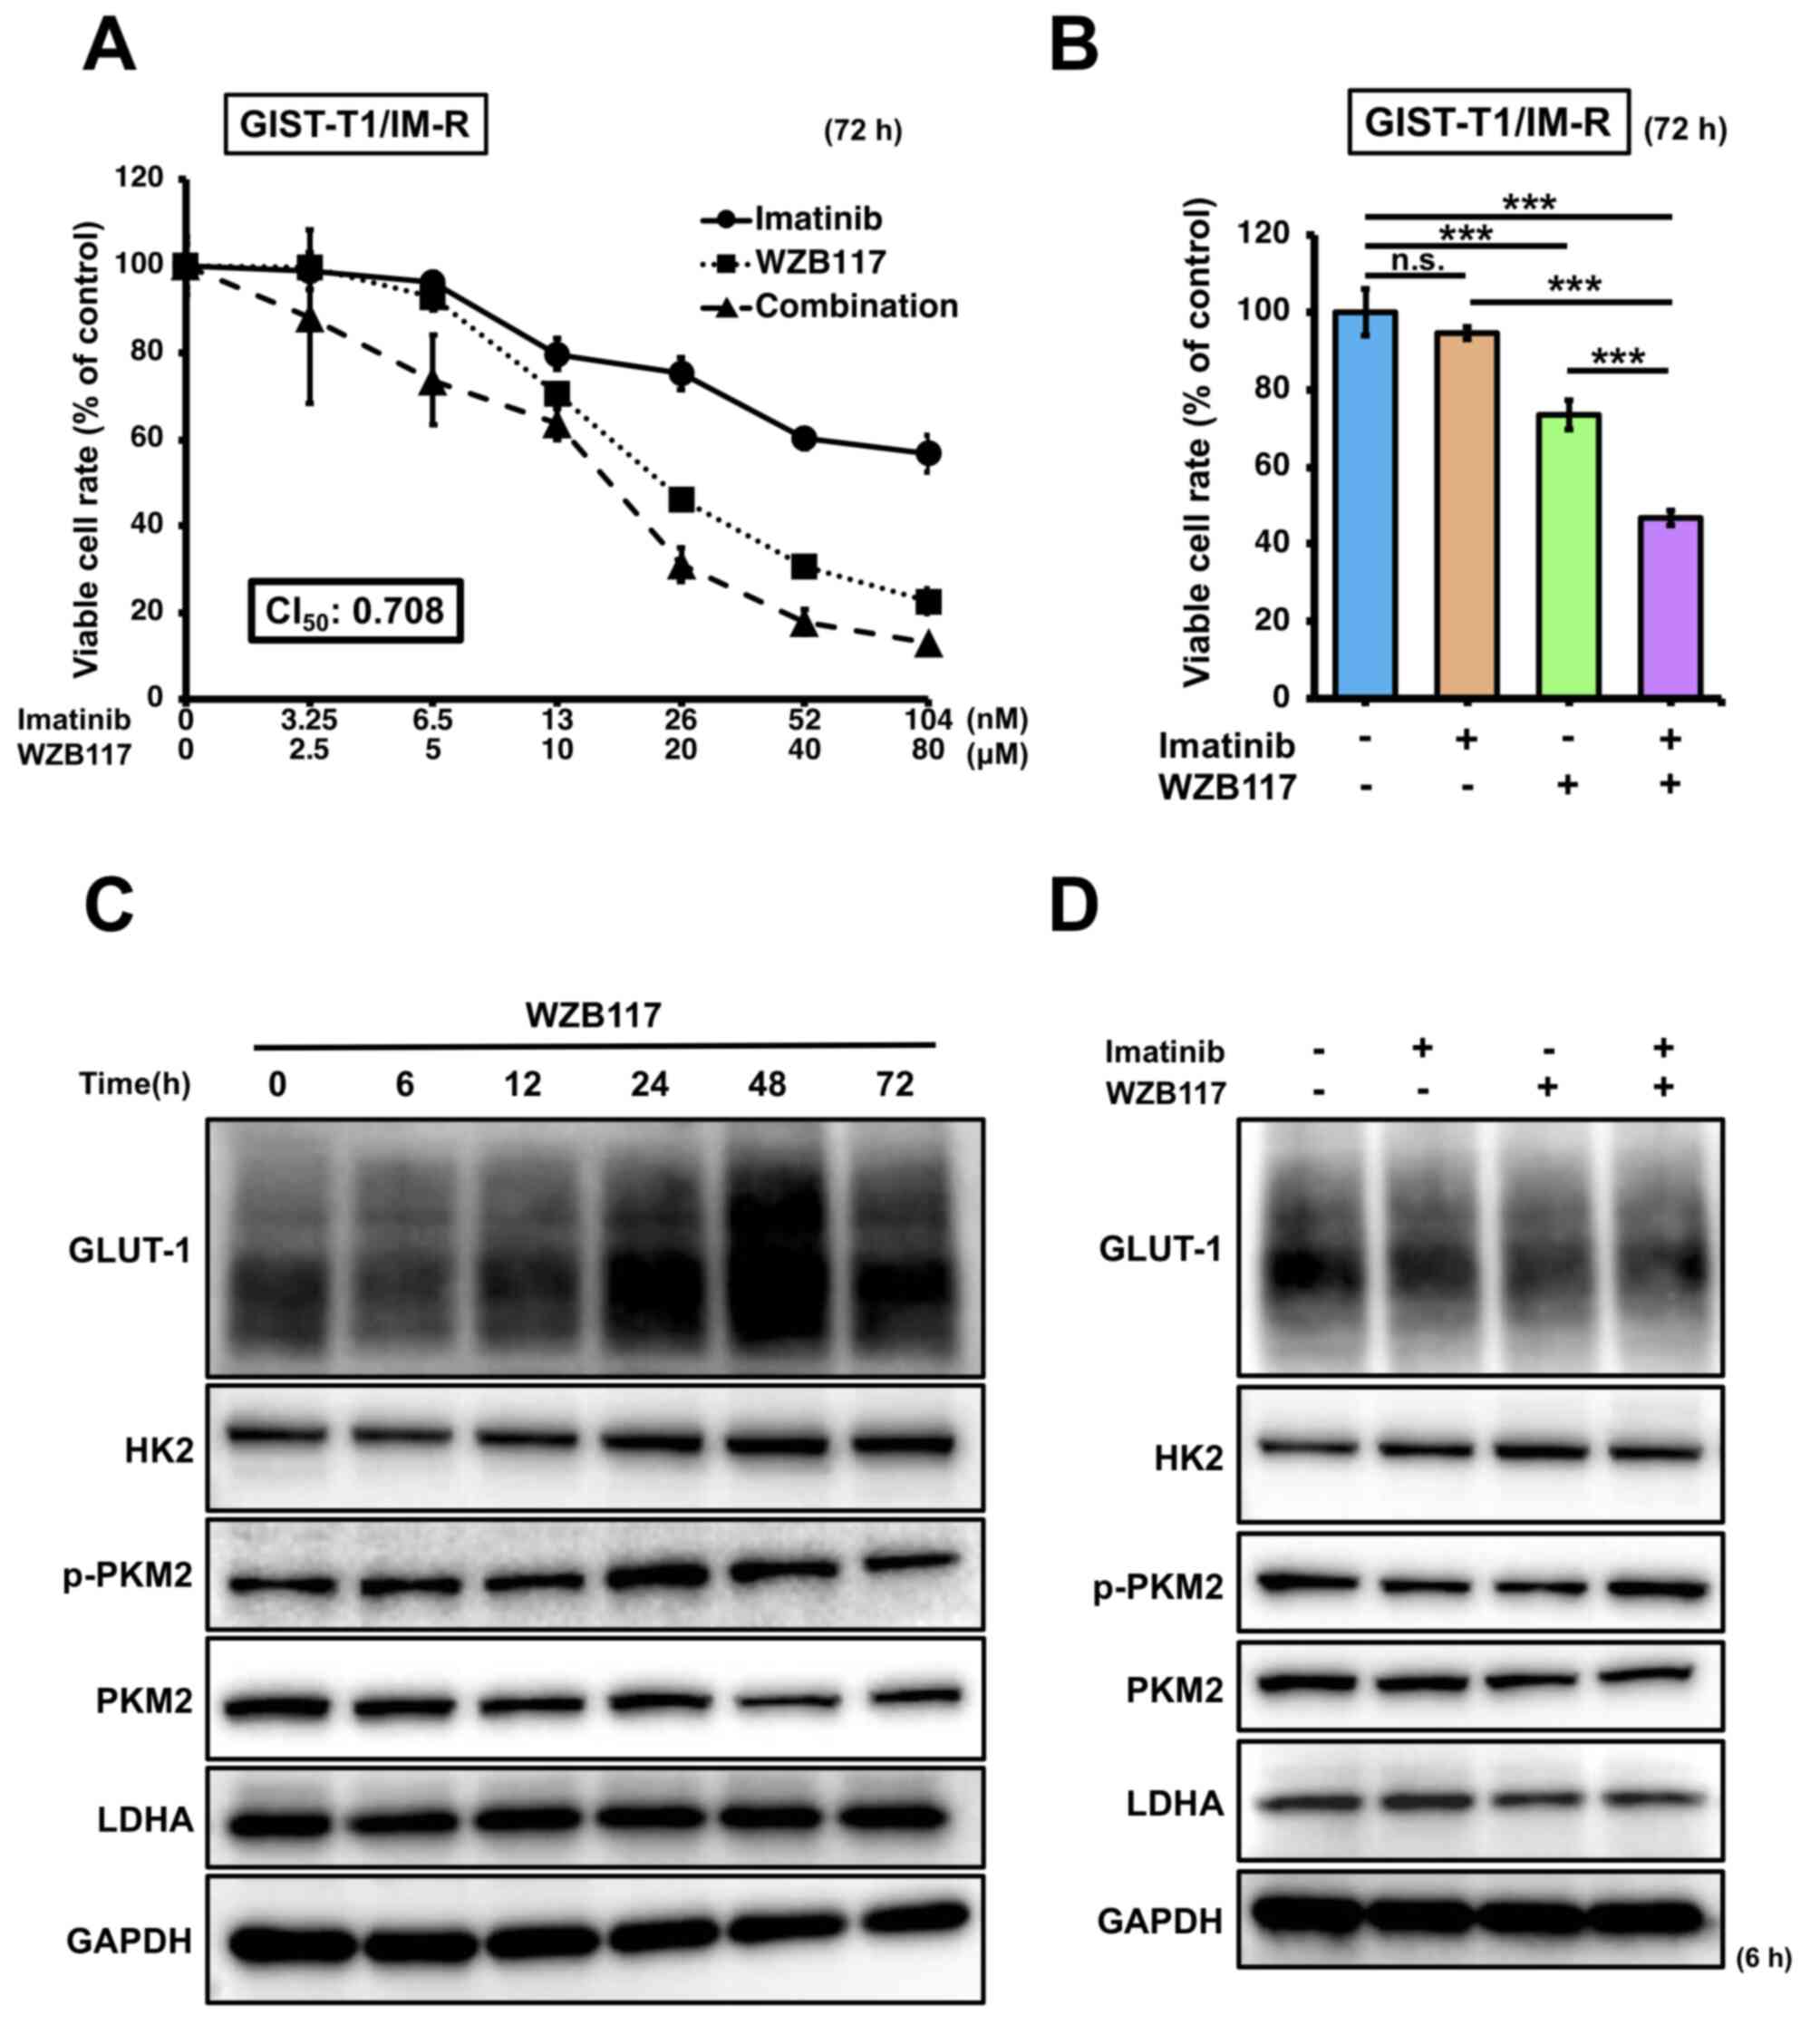 |
Figure 4.
Effects of combined treatment of the GLUT-1 inhibitor WZB117 and imatinib. (A) Dose-response curves of GIST-IM-R cells treated with imatinib and/or WZB117 for 72 h. Cell viability was measured using MTT assay. (B) Cell viability response to combination therapy with imatinib (13 nM) and WZB117 (10 µM) 72 h after treatment. Protein expression levels of glycolysis-related components GLUT-1, HK2, PKM2 and LDHA (C) at various time points (0-72 h) after treatment with WZB117 (10 µM), or (D) at 6 h after treatment with imatinib (13 nM) and/or WZB117 (10 µM) in GIST-T1/IM-R cells. ***P<0.001. GIST-T1/IM-R, imatinib-resistant GIST-T1 cells; n.s., not significant; CI50, combination index at 50% growth inhibition; GLUT-1, glucose transporter; HK2, hexokinase 2; p-, phosphorylated; PKM2, pyruvate kinase M2; LDHA, lactate dehydrogenase.
|
Effect of treatment of imatinib, siR-SLC2A1 transfection and/or WZB117 treatment on apoptosis in GIST-T1/IM-R cells
The effects of imatinib treatment and/or siR-SLC2A1 transfection on apoptosis in GIST-T1/IM-R cells were first investigated. Both treatment with imatinib and siR-SLC2A1 transfection significantly decreased AKT phosphorylation in GIST-T1/IM-R cells compared to control or imatinib alone. However, the expression of Bcl-2, an apoptosis suppressor, remained unchanged in GIST-T1/IM-R cells (Figs. 5A and S7). Treatment with both imatinib and siR-SLC2A1 transfection increased the expression of cleaved PARP and caspase-9 compared with that in the imatinib alone group. However, no significant changes were observed in the expression levels of cleaved PARP, caspase-3 and caspase-9 in siR-SLC2A1-transfected cells treated with or without imatinib (Figs. 5A and S7). Annexin V-FITC/PI staining showed that siR-SLC2A1 transfection exerted no significant effects on the apoptosis in GIST-T1/IM-R cells when combined with imatinib treatment (Fig. 5B). The phosphorylation of AKT (6 h after treatment) and Bcl-2 (12 h after treatment) in GIST-T1/IM-R cells were both decreased after combined treatment with WZB117 and imatinib compared to control or imatinib alone (Figs. 6A and S8). By contrast, the protein levels of cleaved PARP, caspase-3 and caspase-9 were increased in the WZB117 and imatinib combined group compared with those in the control or imatinib groups alone (Figs. 6A and S8). Annexin V-FITC/PI staining revealed the induction of apoptosis after the combined treatment of GIST-T1/IM-R cells with WZB117 and imatinib compared to control or imatinib alone (Fig. 6B). These findings suggest that the combination of siR-SLC2A1 transfection or WZB117 treatment and imatinib suppressed not only the expression of GLUT-1 protein, but also the phosphorylation of AKT in GIST-T1/IM-R cells. In addition, combined treatment with WZB117 and imatinib resulted in significant increases in apoptosis. This result may have been caused by reductions in Bcl-2 protein expression.
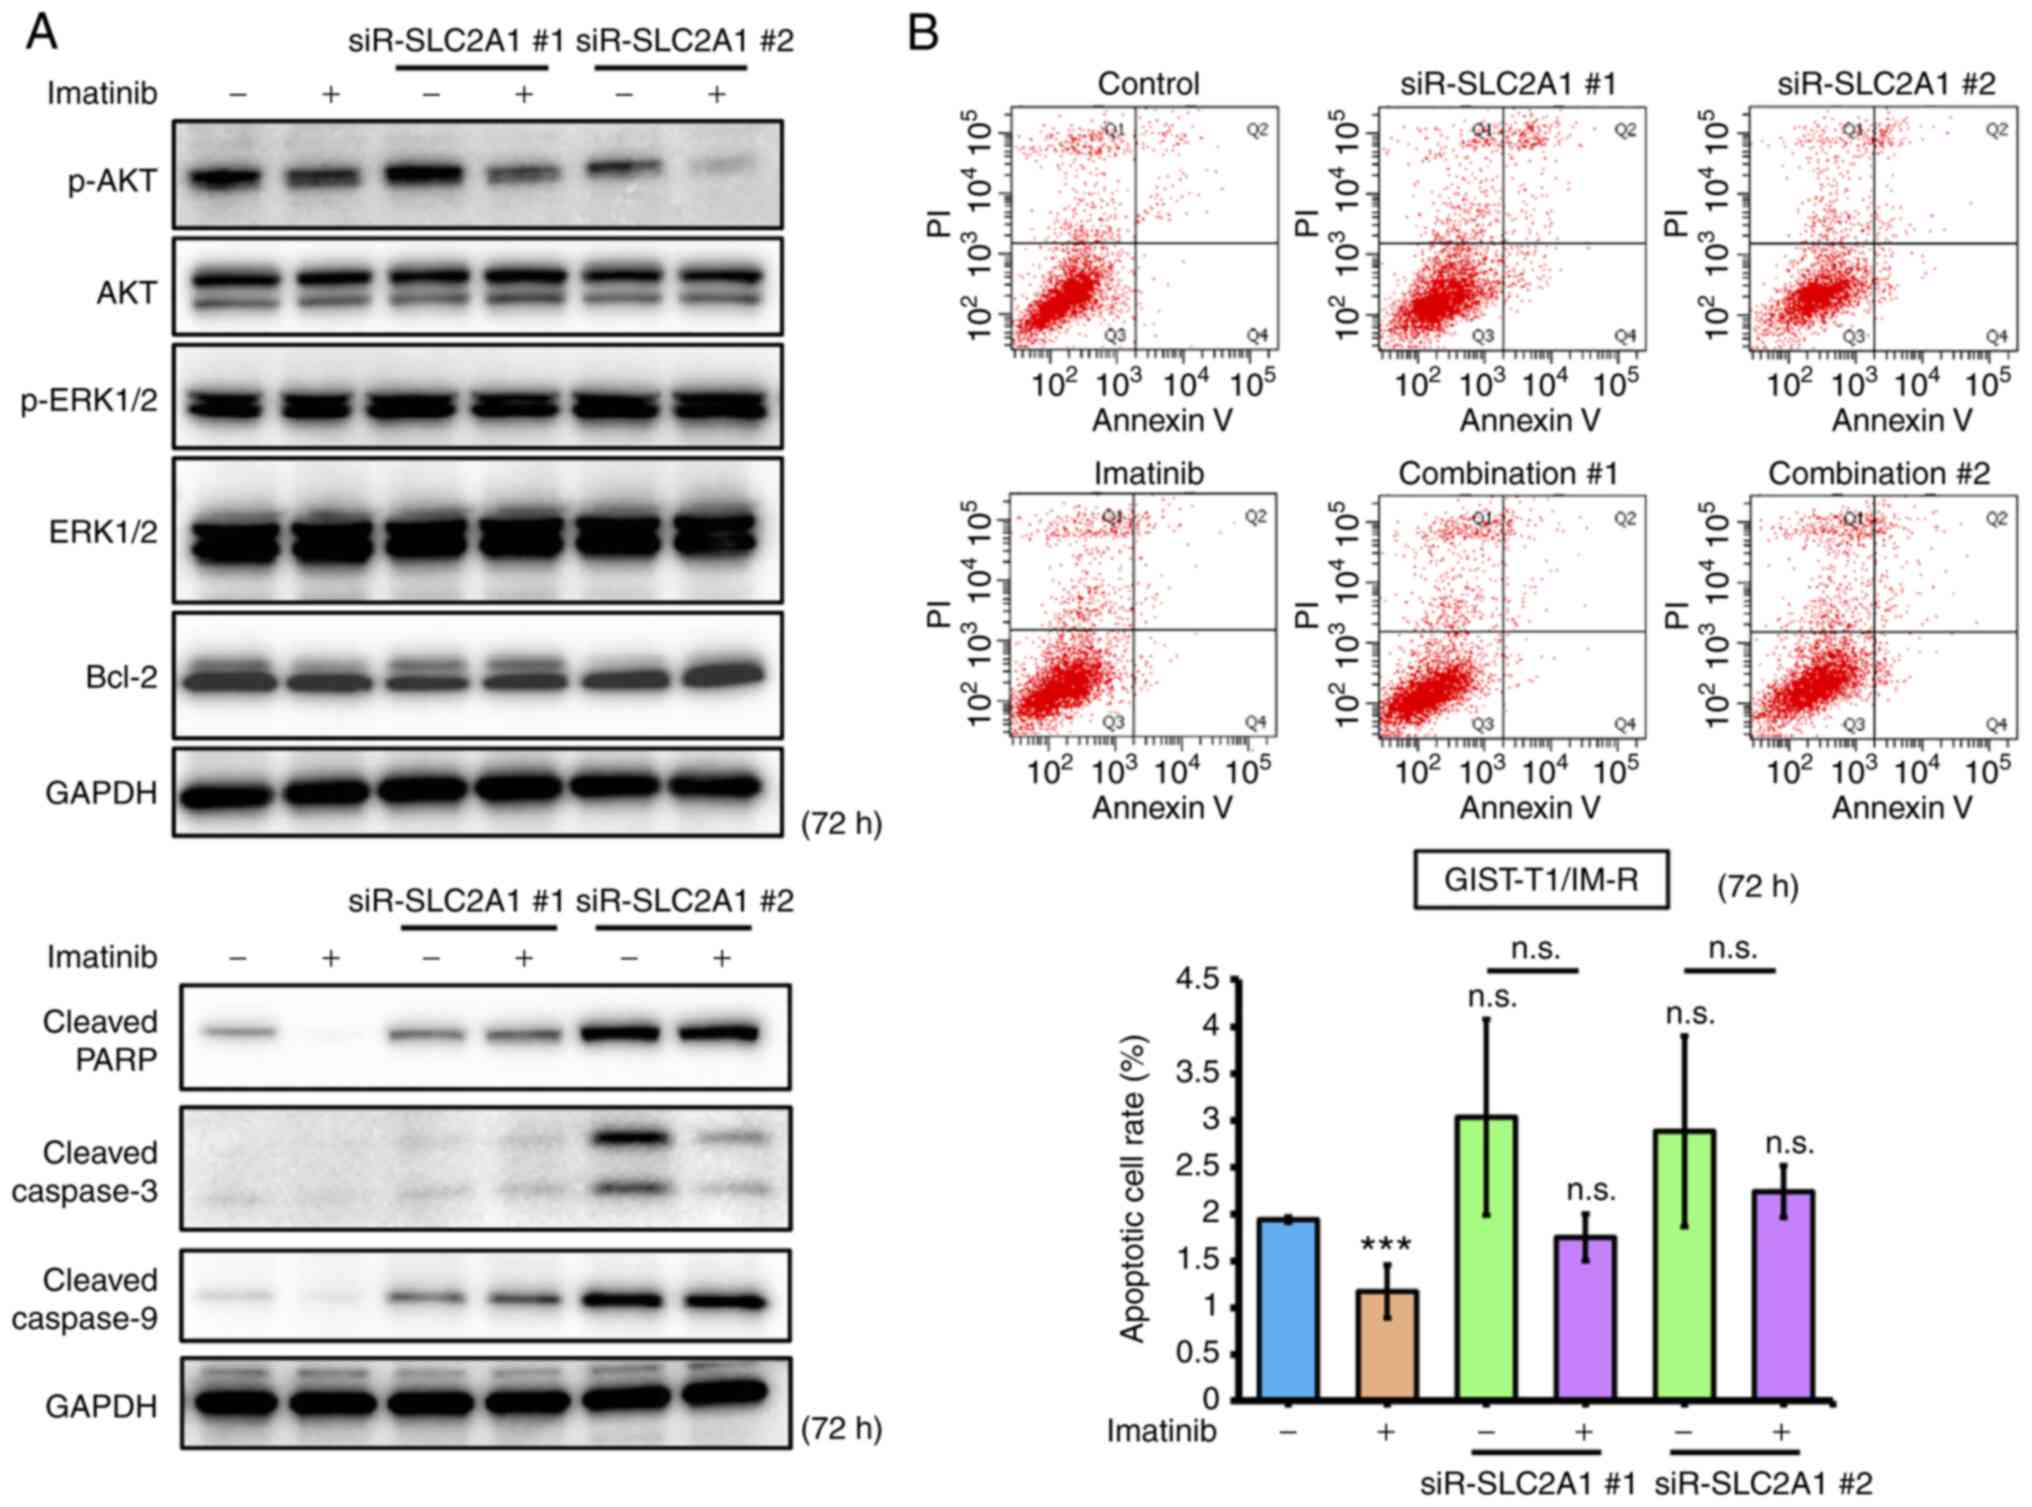 |
Figure 5.
Comparison of effects mediated by SLC2A1 knockdown and imatinib treatment in GIST-T1/IM-R cells. (A) Western blot analysis of cell growth/survival signaling and apoptosis-related proteins at 72 h after treatment with imatinib (13 nM) or transfection with siR-SLC2A1 (10 nM) in GIST-T1/IM-R cells. (B) Population of apoptotic cells double-stained with propidium iodide and FITC-labeled Annexin V using flow cytometry. The cells were treated with imatinib (13 nM) and/or transfected with siR-SLC2A1 (10 nM) for 72 h. ***P<0.001 vs. control. siR, small interfering RNA; SLC2A1, solute carrier family 2 member 1; GIST-T1/IM-R, imatinib-resistant GIST-T1 cells; casp, caspase; PARP, poly (ADP ribose) polymerase; Combination #1, siR-SLC2A1 #1 + imatinib; Combination #2, siR-SLC2A1 #2 + imatinib; n.s. not significant.
|
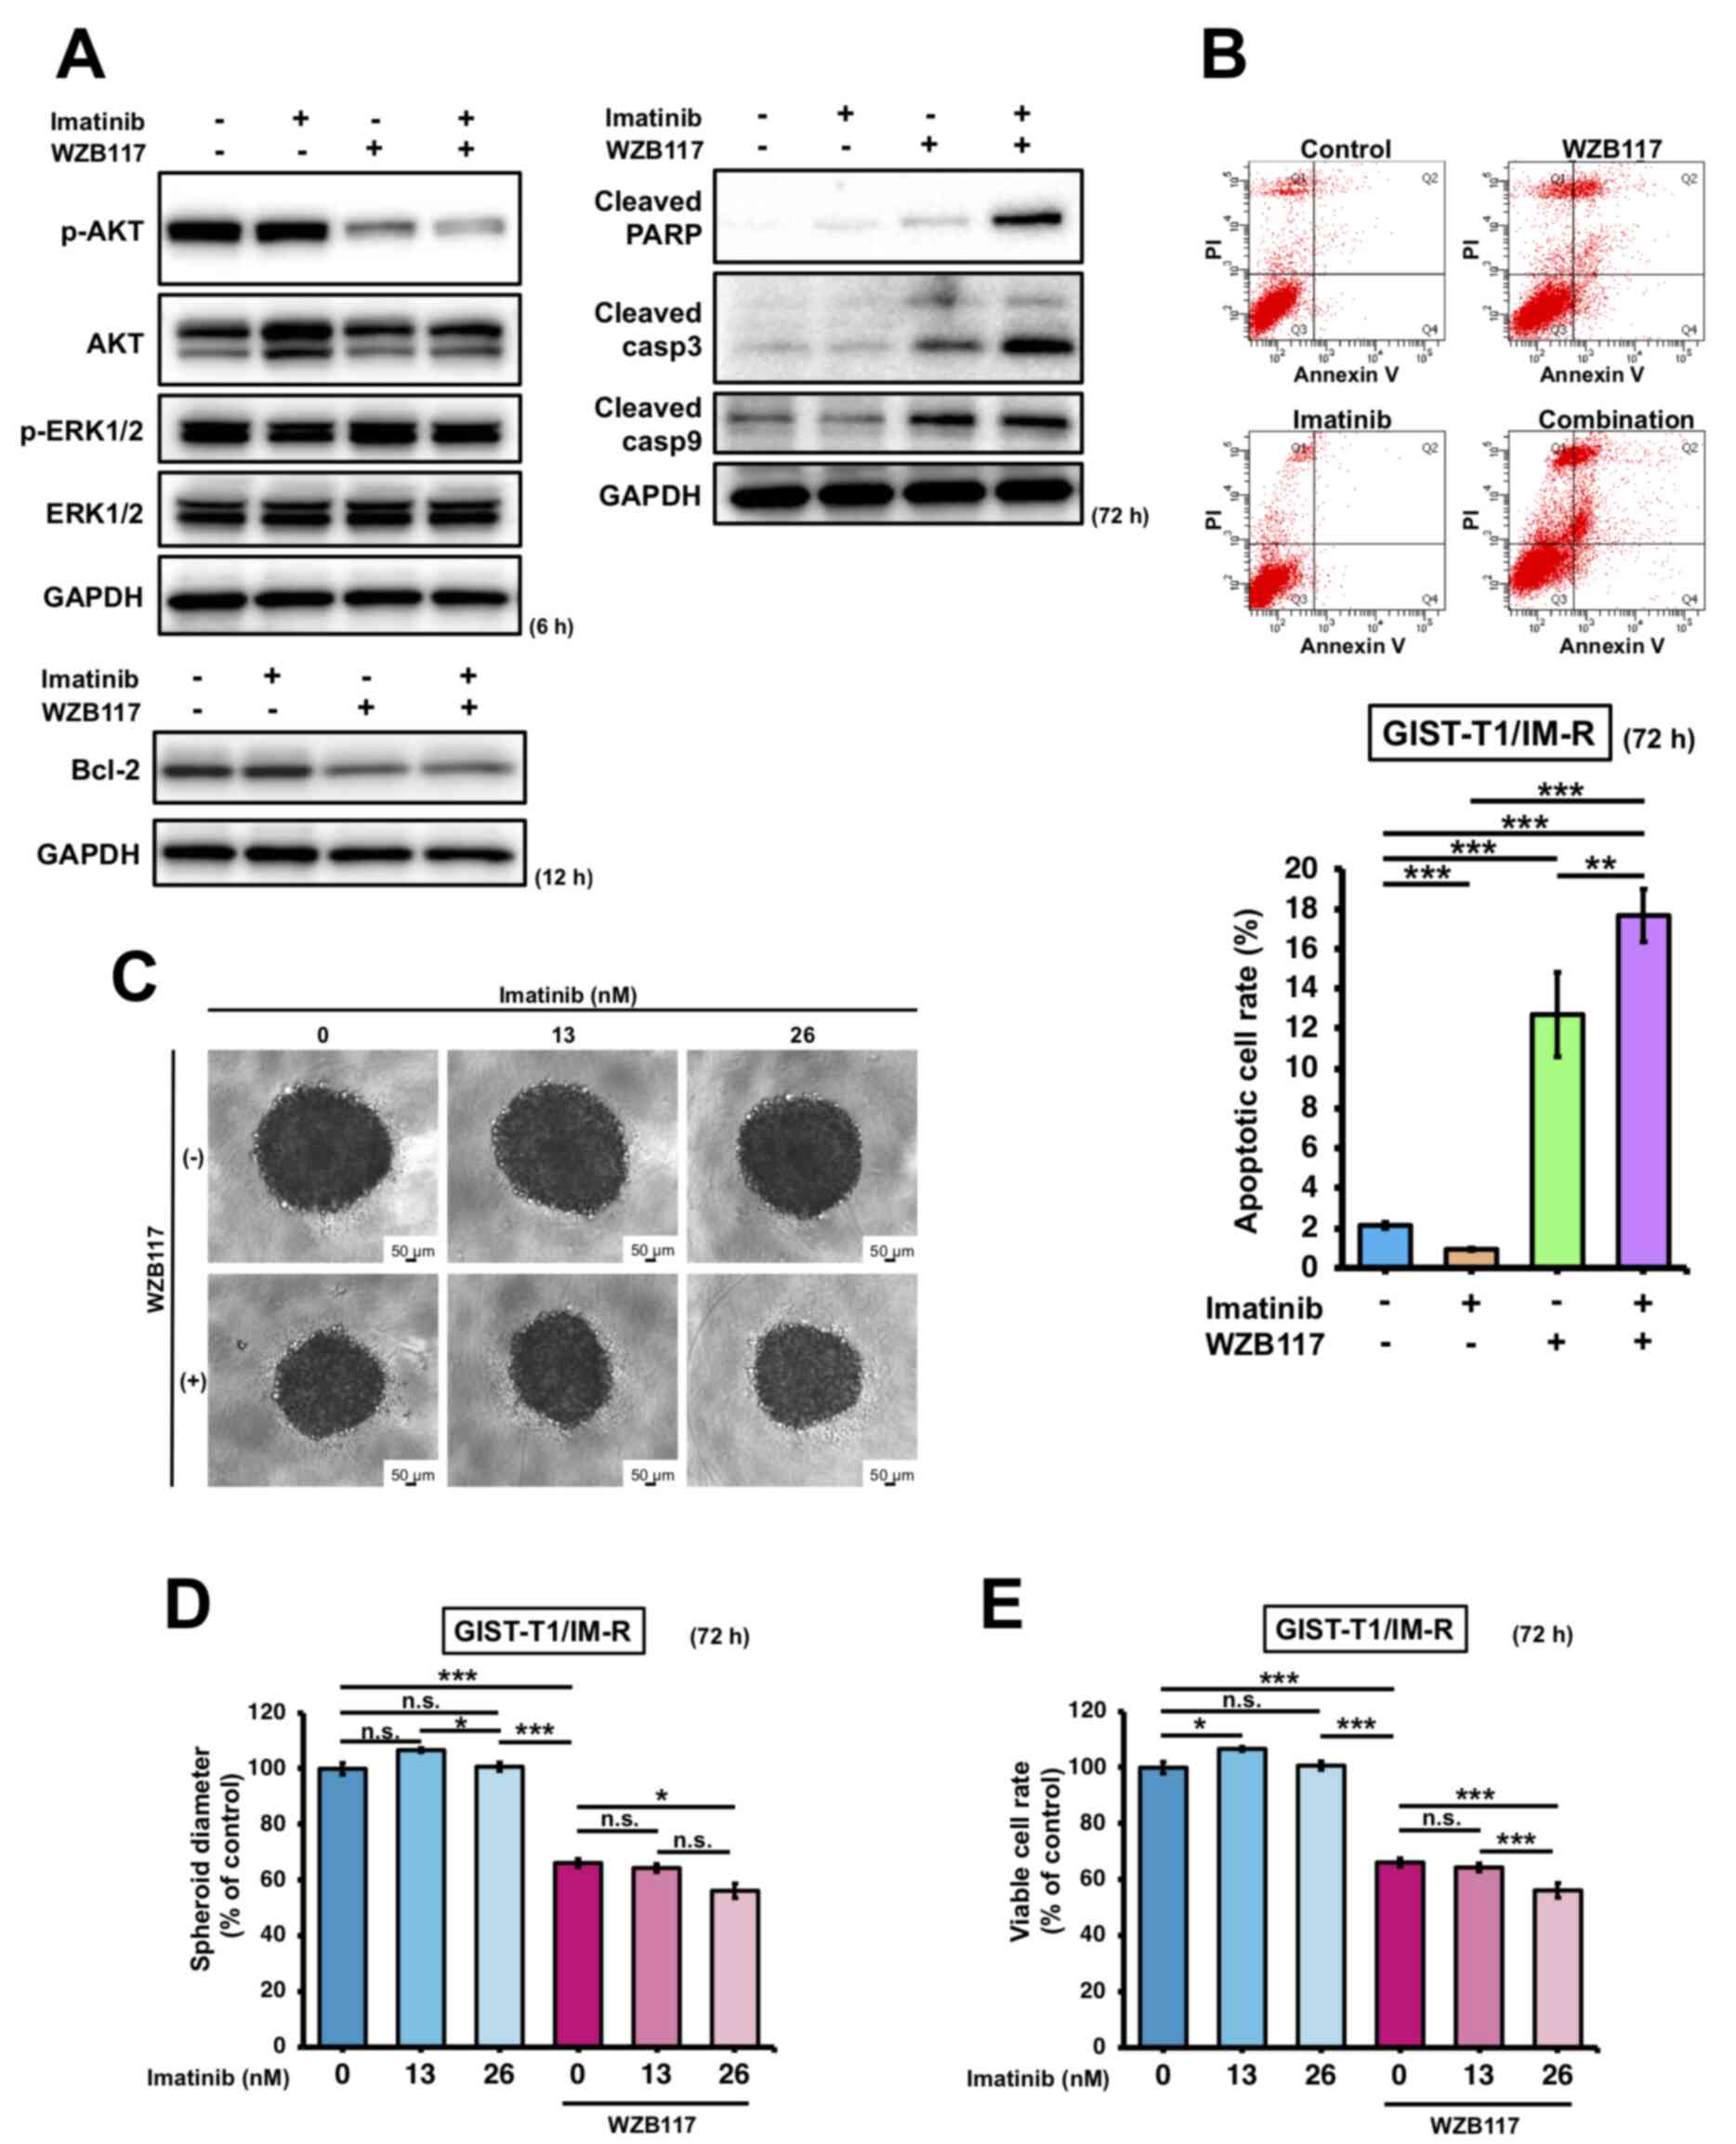 |
Figure 6.
Comparison of the effects exerted by treatment with the GLUT-1 inhibitor WZB117 and imatinib in GIST-T1/IM-R cells. (A) Western blot analysis of cell growth/survival signaling and apoptosis-related proteins at 6, 12 and 72 h after treatment with imatinib (13 nM) and WZB117 (10 µM) in GIST-T1/IM-R cells. (B) The population of apoptotic cells double-stained with PI and FITC-labeled Annexin V using flow cytometry. The cells were treated with imatinib (13 nM) and/or WZB117 (10 µM) for 72 h. (C-E) Spheroid formation at 72 h after treatment of GIST/IM-R cells with imatinib (13 or 26 nM) and/or WZB117 (10 µM). (C) Representative photographs of colonies after the respective treatment. (D) The spheroid diameters are quantified. (E) Cell viability was quantified. *P<0.05; **P<0.01 and ***P<0.001. GLUT-1, glucose transporter 1; GIST-T1/IM-R, imatinib-resistant cells; PARP, poly (ADP ribose) polymerase; casp, caspase; n.s., not significant.
|
Effect of combination treatment with imatinib and WZB117 on proliferation of GIST-T1/IM-R cell spheroids
The effect of combined imatinib and WZB117 treatment on the proliferation of GIST-T1/IM-R cells was next examined. WZB117 treatment-induced disaggregation of the edges of colonies, where treatment with WZB117 alone or in combination with 26 nM imatinib significantly suppressed spheroid diameter and cell viability compared with those in the control group (Fig. 6). Treatment with WZB117 and 26 nM imatinib in combination significantly suppressed spheroid diameter and cell viability compared with those in WZB117 alone (Fig. 6C-E). This suggest that this combined treatment was effective in inhibiting the proliferation of imatinib-resistant GIST cells.
These results suggest that GLUT-1 is involved in the acquisition of imatinib resistance, where combined administration of the GLUT-1 inhibitor WZB117 and imatinib may reverse this imatinib resistance in GIST-T1/IM-R cells (Fig. 7).
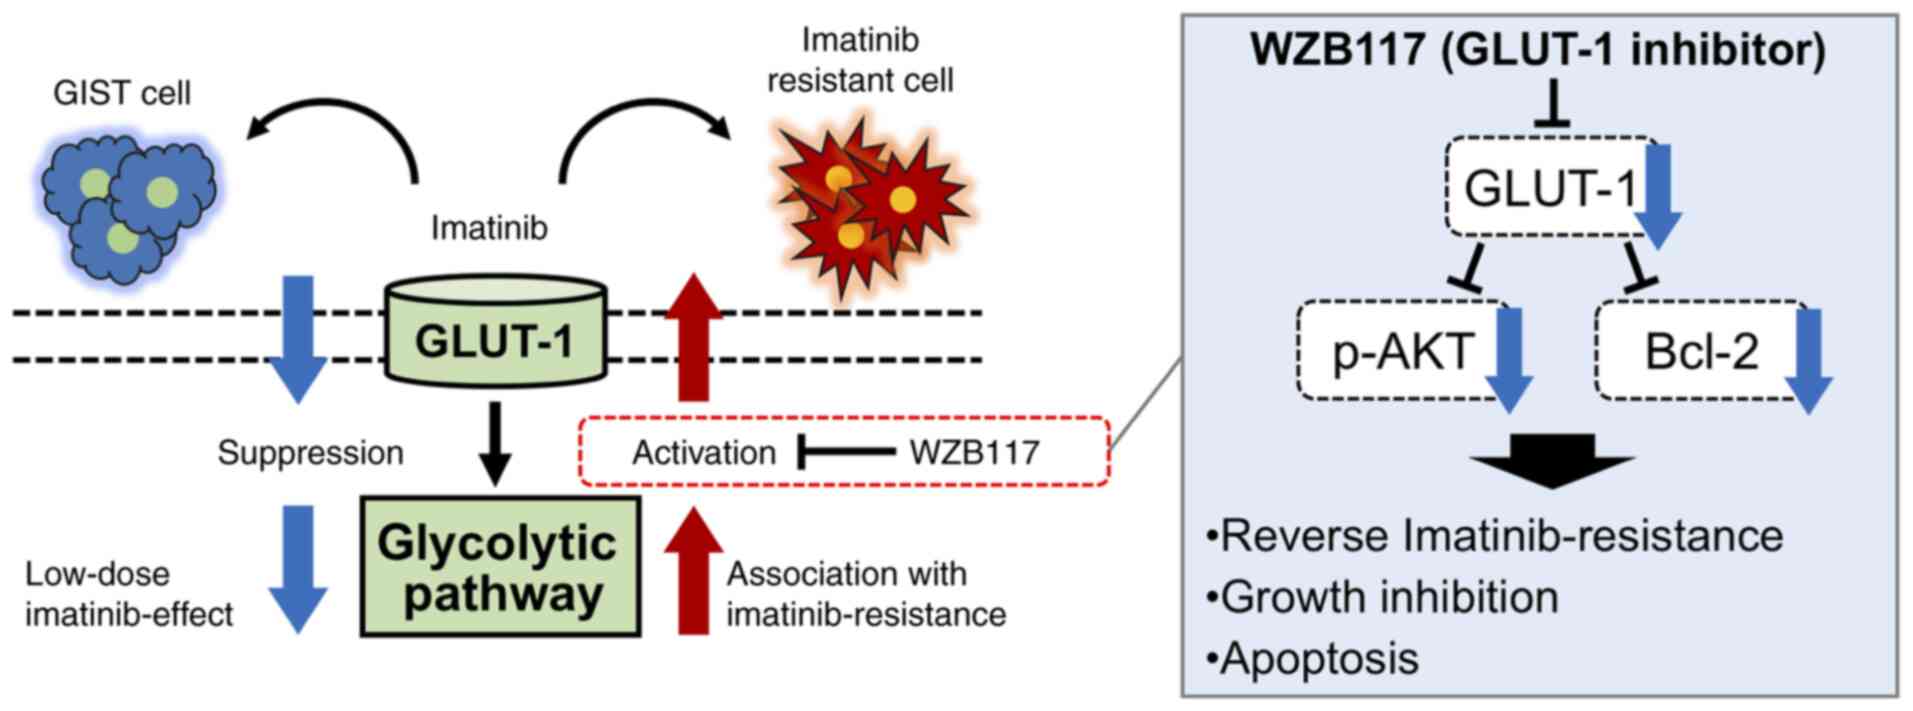 |
Figure 7.
Schematic model from the present study. Low-dose imatinib treatment suppressed glycolysis in the parental gastrointestinal stromal tumor GIST-T1 cells, whereas glycolysis was enhanced in imatinib-resistant GIST-TI cells. The glycolytic pathway may serve a pivotal role in the survival of GIST-T1 cells. Alterations in the glycolytic pathway contributes to imatinib resistance. In addition, GLUT-1 inhibitor WZB117 treatment overcame imatinib resistance by inducing intrinsic apoptosis in imatinib-resistant GIST cells. Data from the present study also suggest that WZB117 administration causes growth inhibition in imatinib-resistant GIST cells by suppressing p-AKT and Bcl-2. GLUT-1, glucose transporter 1.
|
Discussion
The present study revealed that GLUT-1, a key glycolytic molecule, is involved in the acquisition of imatinib resistance by GIST cells. In addition, combined treatment with the GLUT-1 inhibitor WZB117 and imatinib mediated synergistic inhibitory effects by inducing apoptosis in imatinib-resistant GIST cells.
Imatinib resistance in GIST cells poses an additional obstacle due to limited availability of antitumor agents for unresectable GIST treatment (42–45). Recent studies have reported that imatinib-resistant GIST cells exhibit high glycolysis rates (24,25), which may contribute to imatinib resistance. However, it was previously reported that imatinib-resistant GIST cells exhibited higher oxidative phosphorylation and higher glycolytic rates compared with those in imatinib-sensitive GIST cells (24). However, the exact mechanism underlying the acquisition of imatinib resistance remains unclear, where a diverse range of metabolic modifications may be involved (24,25,46). In addition, it has been reported that the PI3K/AKT/mTOR pathway can be partially activated after secondary imatinib resistance in GIST (27). The possible involvement of GLUT-1 in the acquisition of imatinib resistance in BCR-ABL-positive leukemia cells has also been reported, where combining imatinib with Bcl-2 antisense oligonucleotides has been shown to significantly increase apoptosis in imatinib-resistant cells (26,28). However, the function of GLUT-1 in the acquisition of imatinib resistance in GIST cells remains unclear.
Although imatinib can inhibit KIT, downregulates AKT expression and causes the transient dephosphorylation of ERK1/2, the imatinib concentrations required for inhibiting KIT phosphorylation have not been found to correlate well with the proliferation of GIST cells (47). The present study showed that administration of imatinib at the IC50 dose of did not inhibit KIT, AKT or ERK1/2 phosphorylation in both parental GIST and GIST-T1/IM-R cells. Although the administration of low-dose imatinib did not inhibit KIT phosphorylation, significant suppression of the expression of components in the glycolysis pathway, glucose uptake and lactate production were all observed in parental GIST-T1 cells. These results suggest that glycolysis may be an important pathway for energy production in GIST cells. In addition, low-dose imatinib administration to GIST-T1/IM-R cells resulted in increased glycolytic pathway activation. Therefore, the glycolysis pathway may be essential for GIST cells acquiring imatinib resistance and for cell survival.
The present study next examined the effects of GLUT-1 inhibition by gene silencing or WZB117 administration on the expression of glycolysis components. WZB117 is a small compound that inhibits GLUT-1-mediated sugar transport by binding reversibly at the exofacial sugar-binding site and has been reported to inhibit cell proliferation in a number of cancer cell lines, including such as non-small cell lung cancer, colon cancer and KRAS-mutant cancer (13,41,48,49). In the present study, the protein expression of GLUT-1 in GIST-T1/IM-R cells was suppressed at its greatest extent at 6 h after WZB117 administration, which increased again over time. Therefore, combination treatment of imatinib with WZB117 6 h after administration was performed. A previous report showed that the protein expression of GLUT-1 was temporarily decreased after WZB117 administration but increased again over time (13), suggesting that WZB117 administration does not permanently inhibit GLUT-1 activity. Inhibition of glucose transport by WZB117 likely reduced the supply of glucose into GIST-T1/IM-R cells, thereby necessitating an increase in glucose import and an upregulation of GLUT-1 protein expression. Although expression of the GLUT-1 protein was increased again, cell viability was reduced at 72 h after administration. Therefore, suppression of GLUT-1 protein expression by WZB117 may be involved in the survival of GIST-T1/IM-R cells, albeit transiently. Although WZB117 administration reduced cell viability even when administered alone, the CI50 value, which measures the nature of drug-drug interaction in combination chemotherapy (34–36,50), showed that WZB117 was more effective in combination with imatinib. In siR-SLC2A1-transfected and WZB117-treated cells, administration of a low dose of imatinib considerably reduced cell viability. However, the expression of all proteins in the glycolysis pathway apart from GLUT-1 remained unchanged. These results suggest that a robust compensatory mechanism is operational when GLUT-1 is inhibited, since the glycolytic pathway is crucial for tumor cell function (51).
The effect of GLUT-1 inhibition on the AKT and ERK signaling pathways and apoptosis was next investigated in imatinib-resistant GIST-T1/IM-R cells. Combined administration of GULT-1 inhibition and imatinib suppressed AKT phosphorylation, which may have in turn inhibited GIST-T1/IM-R cell proliferation. However, transfection with siR-SLC2A1 and WZB117 treatment conferred different effects on the induction of apoptosis. SLC2A1 silencing did not significantly increase the apoptotic rate, whereas WZB117 treatment resulted in a considerable increase in apoptosis, especially when administered in combination with imatinib. Although SLC2A1 knockdown has been reported to induce apoptosis and inhibit cell proliferation in breast cancer cells, this phenomenon has not been observed in GIST cells (30). A previous report showed that Bcl-2 expression was downregulated by WZB117 treatment in breast cancer cells (35). In the present study, unlike SLC2A1 knockdown, WZB117 administration suppressed the expression of Bcl-2, GLUT-1 and the phosphorylation of AKT in GIST-T1/IM-R cells. Furthermore, the WZB117 dose (10 µM) used was lower than its IC50 in GIST-T1/IM-R cells (15.8 µM) or that used in a previous study for breast cancer cells (60 µM) (35). Therefore, the results obtained in the present study are unlikely the result of an off-target effect mediated by WZB117. Bcl-2 downregulation may be a key mechanism for the induction of apoptosis in GIST cells treated with imatinib and a GLUT-1 inhibitor in combination.
The relationship between GLUT-1 and AKT is highly complex. Previous studies have reported that GLUT-1 downregulation by suppressing AKT phosphorylation can inhibit pancreatic cancer and hepatocellular carcinoma growth (52,53). By contrast, SLC2A1 silencing has been shown to inhibit cell proliferation by promoting apoptosis in colorectal cancer cells by inactivating the TGF-β/PI3K/AKT/mTOR signaling pathway (54). Therefore, a possible interaction between GLUT-1 and AKT may exist, such that the suppression of one can suppress the other, where GLUT-1 inhibition may inhibit AKT phosphorylation in GIST cells. However, the possible underlying mechanism is not precisely understood at present and further investigation of these pathways is required. WZB117 administration was found to inhibit cell proliferation more efficiently compared with that mediated by SLC2A1 silencing, which was likely due to WZB117 inducing apoptosis by simultaneously suppressing Bcl-2 expression in GIST-T1/IM-R cells.
The present study has a number of limitations. Only one cell line was used. The GIST-T1/IM-R cells established in the present study had a PDGFRA mutation on exon 12. PDGFRA is one of the two PDGFR subunits, which transduces signals through numerous downstream pathways, including PI3K/AKT, Src kinase, phospholipase C/protein kinase C and Ras/Raf/MEK/ERK, all of which have been documented to serve important roles in tumorigenesis (55,56). The activation of PDGFR may in turn activate the ERK pathway and lead to increased GLUT-1 expression (57). In the present study, a mutation in PDGFRA may have been involved in promoting GLUT-1 synthesis after imatinib treatment, thereby leading to increased cell survival. However, further experiments are required to clarify the relationship between this mutation and glycolysis.
To validate the in vitro results in the present study, additional experiments were performed using human sample data obtained from the GEO database. GLUT-1 expression was found to be significantly suppressed in the responder group compared with that in the non-responder group after imatinib treatment, though the number of sample specimens used was not high (18 pairs). Although this result is in line with the present finding that GLUT-1 expression is involved in the acquisition of imatinib resistance, HK2 expression was significantly suppressed after imatinib treatment in the non-responder group. It may be the complex metabolic morphology in the actual clinical GIST specimen. Therefore, further investigation involving the accumulation of non-responder clinical samples to imatinib is required. In addition, the possible side effects of WZB117 administration was not validated in vivo in the present study, although they were attempted by transplanting GIST-T1/IM-R cells into mice. However, transplantation proved to be difficult. Therefore, a three-dimensional model examination of the GIST-T1/IM-R cells was performed instead. In this model, administration of 26 nM imatinib and 10 µM WZB117 exerted a synergistic effect, possibly due to the lower efficiency of imatinib treatment in three-dimensional conditions than that in two-dimensional conditions (38). Further validation of these phenomena is required. In addition to the in vivo validation of the possible therapeutic effects of WZB117, it is important to identify the optimal drug delivery system and any side effects of WZB117. Data obtained in this preclinical study should be used to guide the planning of clinical trials involving patients with imatinib-resistant GIST.
In the present study, a key role of GLUT-1 in the acquisition of imatinib resistance by GIST cells was revealed. Furthermore, combined treatment with the GLUT-1 inhibitor WZB117 and imatinib was shown to overcome this resistance.
Supplementary Material
Supporting Data
Acknowledgements
The authors would like to thank Ms Akiko Miyamoto (Laboratory of General and Gastroenterological Surgery, Osaka Medical and Pharmaceutical University, Takatsuki, Osaka, Japan) for her technical assistance.
Funding
The present study was partially supported by the Japan Society for the Promotion of Science KAKENHI (grant no. KT-16H07344) and Osaka Medical College (OMC) Internal Research.
Availability of data and materials
The datasets used and/or analyzed during the present study are available from the corresponding author on reasonable request.
Authors' contributions
Conception and design of the study: TS and KoT. Experiments: TS (in vitro experiments) and YT (data set analysis). Analysis and interpretation of data: TS, KoT, YT, YI, JA, SWL, KY, KaT and KU. All authors read and approved the final manuscript. TS and KT confirm the authenticity of all the raw data.
Ethics approval and consent to participate
Not applicable.
Patient consent for publication
Not applicable.
Competing interests
The authors declare that they have no competing interests.
Glossary
Abbreviations
Abbreviations:
|
CI
|
combination index
|
|
GIST
|
gastrointestinal stromal tumor
|
|
GLUT
|
glucose transporter
|
|
IC50
|
half-maximal inhibitory concentration
|
|
PDGFRA
|
platelet-derived growth factor receptor α
|
|
RT-qPCR
|
reverse transcription-quantitative PCR
|
References
|
1
|
Joensuu H, Fletcher C, Dimitrijevic S, Silberman S, Roberts P and Demetri G: Management of malignant gastrointestinal stromal tumours. Lancet Oncol. 3:655–664. 2002. View Article : Google Scholar : PubMed/NCBI
|
|
2
|
Søreide K, Sandvik OM, Søreide JA, Giljaca V, Jureckova A and Bulusu VR: Global epidemiology of gastrointestinal stromal tumours (GIST): A systematic review of population-based cohort studies. Cancer Epidemiol. 40:39–46. 2016. View Article : Google Scholar : PubMed/NCBI
|
|
3
|
Milhem M and Deutsch JM: Imatinib dosing in gastrointestinal stromal tumors (GISTs): When, how much, and how long? Curr Clin Pharmacol. 10:311–320. 2015. View Article : Google Scholar : PubMed/NCBI
|
|
4
|
Blanke CD, Demetri GD, von Mehren M, Heinrich MC, Eisenberg B, Fletcher JA, Corless CL, Fletcher CD, Roberts PJ, Heinz D, et al: Long-term results from a randomized phase II trial of standard-versus higher-dose imatinib mesylate for patients with unresectable or metastatic gastrointestinal stromal tumors expressing KIT. J Clin Oncol. 26:620–625. 2008. View Article : Google Scholar : PubMed/NCBI
|
|
5
|
Blanke CD, Rankin C, Demetri GD, Ryan CW, von Mehren M, Benjamin RS, Raymond AK, Bramwell VH, Baker LH, Maki RG, et al: Phase III randomized, intergroup trial assessing imatinib mesylate at two dose levels in patients with unresectable or metastatic gastrointestinal stromal tumors expressing the kit receptor tyrosine kinase: S0033. J Clin Oncol. 26:626–632. 2008. View Article : Google Scholar : PubMed/NCBI
|
|
6
|
Lunt SY and Vander Heiden MG: Aerobic glycolysis: Meeting the metabolic requirements of cell proliferation. Annu Rev Cell Dev Biol. 27:441–464. 2011. View Article : Google Scholar : PubMed/NCBI
|
|
7
|
Mazurek S: Pyruvate kinase type M2: A key regulator of the metabolic budget system in tumor cells. Int J Biochem Cell Biol. 43:969–980. 2011. View Article : Google Scholar : PubMed/NCBI
|
|
8
|
Taniguchi K, Uchiyama K and Akao Y: PTBP1-targeting microRNAs regulate cancer-specific energy metabolism through the modulation of PKM1/M2 splicing. Cancer Sci. 112:41–50. 2020. View Article : Google Scholar : PubMed/NCBI
|
|
9
|
Akram M: Mini-review on glycolysis and cancer. J Cancer Educ. 28:454–457. 2013. View Article : Google Scholar : PubMed/NCBI
|
|
10
|
Warburg O: The metabolism of carcinoma cells. J Cancer Res. 9:148–163. 1925. View Article : Google Scholar
|
|
11
|
Warburg O: On the origin of cancer cells. Science. 123:309–314. 1936. View Article : Google Scholar : PubMed/NCBI
|
|
12
|
Flavahan WA, Wu Q, Hitomi M, Rahim N, Kim Y, Sloan AE, Weil RJ, Nakano I, Sarkaria JN, Stringer BW, et al: Brain tumor initiating cells adapt to restricted nutrition through preferential glucose uptake. Nat Neurosci. 16:1373–1382. 2013. View Article : Google Scholar : PubMed/NCBI
|
|
13
|
Liu Y, Cao Y, Zhang W, Bergmeier S, Qian Y, Akbar H, Colvin R, Ding J, Tong L, Wu S, et al: A small-molecule inhibitor of glucose transporter 1 downregulates glycolysis, induces cell-cycle arrest, and inhibits cancer cell growth in vitro and in vivo. Mol Cancer Ther. 11:1672–1682. 2012. View Article : Google Scholar : PubMed/NCBI
|
|
14
|
Gupta A, Ajith A, Singh S, Panday RK, Samaiya A and Shukla S: PAK2-c-Myc-PKM2 axis plays an essential role in head and neck oncogenesis via regulating Warburg effect. Cell Death Dis. 9:8252018. View Article : Google Scholar : PubMed/NCBI
|
|
15
|
Huang X, Gan G, Wang X, Xu T and Xie W: The HGF-MET axis coordinates liver cancer metabolism and autophagy for chemotherapeutic resistance. Autophagy. 15:1258–1279. 2019. View Article : Google Scholar : PubMed/NCBI
|
|
16
|
Vander Heiden MG: Targeting cancer metabolism: A therapeutic window opens. Nat Rev Drug Discov. 10:671–684. 2011. View Article : Google Scholar : PubMed/NCBI
|
|
17
|
Macheda ML, Rogers S and Best JD: Molecular and cellular regulation of glucose transporter (GLUT) proteins in cancer. J Cell Physiol. 202:654–662. 2005. View Article : Google Scholar : PubMed/NCBI
|
|
18
|
Olson AL and Pessin JE: Structure, function, and regulation of the mammalian facilitative glucose transporter gene family. Annu Rev Nutr. 16:235–256. 1996. View Article : Google Scholar : PubMed/NCBI
|
|
19
|
Chen Q, Meng YQ, Xu XF and Gu J: Blockade of GLUT1 by WZB117 resensitizes breast cancer cells to adriamycin. Anticancer Drugs. 28:880–887. 2017. View Article : Google Scholar : PubMed/NCBI
|
|
20
|
Cho MH, Park CK, Park M, Kim WK, Cho A and Kim H: Clinicopathologic features and molecular characteristics of glucose metabolism contributing to 18F-fluorodeoxyglucose uptake in gastrointestinal stromal tumors. PLoS One. 10:e01414132015. View Article : Google Scholar : PubMed/NCBI
|
|
21
|
Berlth F, Mönig S, Pinther B, Grimminger P, Maus M, Schlösser H, Plum P, Warnecke-Eberz U, Harismendy O, Drebber U, et al: Both GLUT-1 and GLUT-14 are independent prognostic factors in gastric adenocarcinoma. Ann Surg Oncol. 22 (Suppl 3):S822–S831. 2015. View Article : Google Scholar : PubMed/NCBI
|
|
22
|
Wang YD, Li SJ and Liao JX: Inhibition of glucose transporter 1 (GLUT1) chemosensitized head and neck cancer cells to cisplatin. Technol Cancer Res Treat. 12:525–535. 2013. View Article : Google Scholar : PubMed/NCBI
|
|
23
|
Abouzeid AH, Patel NR, Rachman IM, Senn S and Torchilin VP: Anti-cancer activity of anti-GLUT1 antibody-targeted polymeric micelles co-loaded with curcumin and doxorubicin. J Drug Target. 21:994–1000. 2013. View Article : Google Scholar : PubMed/NCBI
|
|
24
|
Huang WK, Gao J, Chen Z, Shi H, Yuan J, Cui HL, Yeh CN, Bränström R, Larsson C, Li S, et al: Heterogeneity of metabolic vulnerability in imatinib-resistant gastrointestinal stromal tumor. Cells. 9:13332020. View Article : Google Scholar : PubMed/NCBI
|
|
25
|
Xu K, He Z, Chen M, Wang N, Zhang D, Yang L, Xu Z and Xu H: HIF-1α regulates cellular metabolism, and imatinib resistance by targeting phosphogluconate dehydrogenase in gastrointestinal stromal tumors. Cell Death Dis. 11:5862020. View Article : Google Scholar : PubMed/NCBI
|
|
26
|
Kominsky DJ, Klawitter J, Brown JL, Boros LG, Melo JV, Eckhardt SG and Serkova NJ: Abnormalities in glucose uptake and metabolism in imatinib-resistant human BCR-ABL-positive cells. Clin Cancer Res. 15:3442–3450. 2009. View Article : Google Scholar : PubMed/NCBI
|
|
27
|
Li J, Dang Y, Gao J, Li Y, Zou J and Shen L: PI3K/AKT/mTOR pathway is activated after imatinib secondary resistance in gastrointestinal stromal tumors (GISTs). Med Oncol. 32:1112015. View Article : Google Scholar : PubMed/NCBI
|
|
28
|
Tauchi T, Sumi M, Nakajima A, Sashida G, Shimamoto T and Ohyashiki K: BCL-2 antisense oligonucleotide genasense is active against imatinib-resistant BCR-ABL-positive cells. Clin Cancer Res. 9:4267–4273. 2003.PubMed/NCBI
|
|
29
|
Rozeboom B, Dey N and De P: ER+ metastatic breast cancer: Past, present, and a prescription for an apoptosis-targeted future. Am J Cancer Res. 9:2821–2831. 2019.PubMed/NCBI
|
|
30
|
Bai F, Yu Z, Gao X, Gong J, Fan L and Liu F: Simvastatin induces breast cancer cell death through oxidative stress up-regulating miR-140-5p. Aging (Albany NY). 11:3198–3219. 2019. View Article : Google Scholar : PubMed/NCBI
|
|
31
|
Goldar S, Khaniani MS, Derakhshan SM and Baradaran B: Molecular mechanisms of apoptosis and roles in cancer development and treatment. Asian Pac J Cancer Prev. 16:2129–2144. 2015. View Article : Google Scholar : PubMed/NCBI
|
|
32
|
Taguchi T, Sonobe H, Toyonaga S, Yamasaki I, Shuin T, Takano A, Araki K, Akimaru K and Yuri K: Conventional and molecular cytogenetic characterization of a new human cell line, GIST-T1, established from gastrointestinal stromal tumor. Lab Invest. 82:663–665. 2002. View Article : Google Scholar : PubMed/NCBI
|
|
33
|
Kawaguchi N, Tashiro K, Taniguchi K, Kawai M, Tanaka K, Okuda J, Hayashi M and Uchiyama K: Nogo-B (Reticulon-4B) functions as a negative regulator of the apoptotic pathway through the interaction with c-FLIP in colorectal cancer cells. Biochim Biophys Acta Mol Basis Dis. 1864:2600–2609. 2018. View Article : Google Scholar : PubMed/NCBI
|
|
34
|
Chou TC and Talalay P: Quantitative analysis of dose-effect relationships: The combined effects of multiple drugs or enzyme inhibitors. Adv Enzyme Regul. 22:27–55. 1984. View Article : Google Scholar : PubMed/NCBI
|
|
35
|
Li YL, Weng HC, Hsu JL, Lin SW, Guh JH and Hsu LC: The combination of MK-2206 and WZB117 exerts a synergistic cytotoxic effect against breast cancer cells. Front Pharmacol. 10:13112019. View Article : Google Scholar : PubMed/NCBI
|
|
36
|
Chou TC: Drug combination studies and their synergy quantification using the Chou-Talalay method. Cancer Res. 70:440–446. 2010. View Article : Google Scholar : PubMed/NCBI
|
|
37
|
Taniguchi K, Wada SI, Ito Y, Hayashi J, Inomata Y, Lee SW, Tanaka T, Komura K, Akao Y, Urata H and Uchiyama K: α-Aminoisobutyric acid-containing amphipathic helical peptide-cyclic RGD conjugation as a potential drug delivery system for microRNA replacement therapy in vitro. Mol Pharm. 16:4542–4550. 2019. View Article : Google Scholar : PubMed/NCBI
|
|
38
|
Matsuo K, Taniguchi K, Hamamoto H, Ito Y, Futaki S, Inomata Y, Shima T, Asakuma M, Lee SW, Tanaka K, et al: Delta-like 3 localizes to neuroendocrine cells and plays a pivotal role in gastrointestinal neuroendocrine malignancy. Cancer Sci. 110:3122–3131. 2019. View Article : Google Scholar : PubMed/NCBI
|
|
39
|
Livak KJ and Schmittgen TD: Analysis of relative gene expression data using real-time quantitative PCR and the 2(-Delta Delta C(T)) method. Methods. 25:402–408. 2001. View Article : Google Scholar : PubMed/NCBI
|
|
40
|
Rink L, Skorobogatko Y, Kossenkov AV, Belinsky MG, Pajak T, Heinrich MC, Blanke CD, von Mehren M, Ochs MF, Eisenberg B and Godwin AK: Gene expression signatures and response to imatinib mesylate in gastrointestinal stromal tumor. Mol Cancer Ther. 8:2172–2182. 2009. View Article : Google Scholar : PubMed/NCBI
|
|
41
|
Ojelabi OA, Lloyd KP, Simon AH, De Zutter JK and Carruthers A: WZB117 (2-Fluoro-6-(m-hydroxybenzoyloxy) Phenyl m-Hydroxybenzoate) inhibits GLUT1-mediated sugar transport by binding reversibly at the exofacial sugar binding site. J Biol Chem. 291:26762–26772. 2016. View Article : Google Scholar : PubMed/NCBI
|
|
42
|
Demetri GD, Reichardt P, Kang YK, Blay JY, Rutkowski P, Gelderblom H, Hohenberger P, Leahy M, von Mehren M, Joensuu H, et al: Efficacy and safety of regorafenib for advanced gastrointestinal stromal tumours after failure of imatinib and sunitinib (GRID): An international, multicentre, randomised, placebo-controlled, phase 3 trial. Lancet. 381:295–302. 2013. View Article : Google Scholar : PubMed/NCBI
|
|
43
|
Demetri GD, von Mehren M, Blanke CD, Van den Abbeele AD, Eisenberg B, Roberts PJ, Heinrich MC, Tuveson DA, Singer S, Janicek M, et al: Efficacy and safety of imatinib mesylate in advanced gastrointestinal stromal tumors. N Engl J Med. 347:472–480. 2002. View Article : Google Scholar : PubMed/NCBI
|
|
44
|
Matsumoto K, Sawaki A, Mizuno N, Hara K, Hijioka S, Niwa Y, Tajika M, Kawai H, Kondo S and Yamao K: Clinical efficacy and safety of sunitinib after imatinib failure in Japanese patients with gastrointestinal stromal tumor. Jpn J Clin Oncol. 41:57–62. 2011. View Article : Google Scholar : PubMed/NCBI
|
|
45
|
Antonescu CR, Besmer P, Guo T, Arkun K, Hom G, Koryotowski B, Leversha MA, Jeffrey PD, Desantis D, Singer S, et al: Acquired resistance to imatinib in gastrointestinal stromal tumor occurs through secondary gene mutation. Clin Cancer Res. 11:4182–4190. 2005. View Article : Google Scholar : PubMed/NCBI
|
|
46
|
Vitiello GA, Medina BD, Zeng S, Bowler TG, Zhang JQ, Loo JK, Param NJ, Liu M, Moral AJ, Zhao JN, et al: Mitochondrial inhibition augments the efficacy of imatinib by resetting the metabolic phenotype of gastrointestinal stromal tumor. Clin Cancer Res. 24:972–984. 2018. View Article : Google Scholar : PubMed/NCBI
|
|
47
|
Tarn C, Skorobogatko YV, Taguchi T, Eisenberg B, von Mehren M and Godwin AK: Therapeutic effect of imatinib in gastrointestinal stromal tumors: AKT signaling dependent and independent mechanisms. Cancer Res. 66:5477–5486. 2006. View Article : Google Scholar : PubMed/NCBI
|
|
48
|
Liu W, Fang Y, Wang XT, Liu J, Dan X and Sun LL: Overcoming 5-Fu resistance of colon cells through inhibition of Glut1 by the specific inhibitor WZB117. Asian Pac J Cancer Prev. 15:7037–7041. 2014. View Article : Google Scholar : PubMed/NCBI
|
|
49
|
Erber J, Steiner JD, Isensee J, Lobbes LA, Toschka A, Beleggia F, Schmitt A, Kaiser RWJ, Siedek F, Persigehl T, et al: Dual inhibition of GLUT1 and the ATR/CHK1 kinase axis displays synergistic cytotoxicity in KRAS-mutant cancer cells. Cancer Res. 79:4855–4868. 2019. View Article : Google Scholar : PubMed/NCBI
|
|
50
|
Shalinsky DR, Slovak ML and Howell SB: Modulation of vinblastine sensitivity by dipyridamole in multidrug resistant fibrosarcoma cells lacking mdr1 expression. Br J Cancer. 64:705–709. 1991. View Article : Google Scholar : PubMed/NCBI
|
|
51
|
Pelicano H, Martin DS, Xu RH and Huang P: Glycolysis inhibition for anticancer treatment. Oncogene. 25:4633–4646. 2006. View Article : Google Scholar : PubMed/NCBI
|
|
52
|
Melstrom LG, Salabat MR, Ding XZ, Milam BM, Strouch M, Pelling JC and Bentrem DJ: Apigenin inhibits the GLUT-1 glucose transporter and the phosphoinositide 3-kinase/Akt pathway in human pancreatic cancer cells. Pancreas. 37:426–431. 2008. View Article : Google Scholar : PubMed/NCBI
|
|
53
|
Hu Y, Yang Z, Bao D, Ni JS and Lou J: miR-455-5p suppresses hepatocellular carcinoma cell growth and invasion via IGF-1R/AKT/GLUT1 pathway by targeting IGF-1R. Pathol Res Pract. 215:1526742019. View Article : Google Scholar : PubMed/NCBI
|
|
54
|
Wu XL, Wang LK, Yang DD, Qu M, Yang YJ, Guo F, Han L and Xue J: Effects of Glut1 gene silencing on proliferation, differentiation, and apoptosis of colorectal cancer cells by targeting the TGF-β/PI3K-AKT-mTOR signaling pathway. J Cell Biochem. 119:2356–2367. 2018. View Article : Google Scholar : PubMed/NCBI
|
|
55
|
Farahani RM and Xaymardan M: Platelet-derived growth factor receptor alpha as a marker of mesenchymal stem cells in development and stem cell biology. Stem Cells Int. 2015:3627532015. View Article : Google Scholar : PubMed/NCBI
|
|
56
|
Heldin CH, Ostman A and Rönnstrand L: Signal transduction via platelet-derived growth factor receptors. Biochim Biophys Acta. 1378:F79–F113. 1998.PubMed/NCBI
|
|
57
|
Heilig CW, Deb DK, Abdul A, Riaz H, James LR, Salameh J and Nahman NS Jr: GLUT1 regulation of the pro-sclerotic mediators of diabetic nephropathy. Am J Nephrol. 38:39–49. 2013. View Article : Google Scholar : PubMed/NCBI
|


