Introduction
Pancreatic ductal adenocarcinoma (PDAC) is a highly aggressive and lethal malignant tumor encountered worldwide (1–5). Although extensive research studies have investigated diagnostic biomarkers for PDAC, detailed analyses of the underlying molecular mechanisms are still needed for the development of targeted therapies (1).
MicroRNAs (miRNAs/miRs) can regulate the expression of tumor-related genes and, thus, may function as tumor suppressors or oncogenes (6–13). miR-190b has been found to be aberrantly expressed in several types of cancer, such as hepatocellular carcinoma, gastric cancer, bladder cancer and Wilms' tumor. Furthermore, miR-190b was found to be downregulated in radioresistant gastric cancer cells and to inhibit cell viability via negative regulation of Bcl-2 (14–17). However, the role of miR-190b in PDAC has yet to be determined.
The aim of the present study was to evaluate miR-190b expression in pancreatic cancer cell lines and tissues. Additionally, the effects of miR-190b on cell invasion, metastasis and proliferation were assessed to identify potential targets for the treatment of PDAC.
Materials and methods
Patients and PDAC tissues
Samples of human PDAC tissues and matched non-tumor adjacent tissues were obtained from 50 patients (25 men and 25 women; mean age, 61 years; range, 40-80 years) who were diagnosed with PDAC and underwent surgical resection at the Shengjing Hospital of China Medical University (Shenyang, China) between March 2015 and April 2020. The inclusion criteria were tissue samples collected from patients who had not undergone chemotherapy, radiotherapy or other auxiliary treatment prior to surgery. The exclusion criteria were tissue samples collected from patients who had other severe comorbidities.
Immediately after resection, fresh tissues were snap-frozen in liquid nitrogen and stored at −80°C. The samples were histologically confirmed using H&E staining. The original patient data were reviewed to obtain clinicopathological information including sex, age, pT stage, pN stage, 8th American Joint Committee on Cancer (AJCC) stage, obstructive jaundice, tumor site, operative time and overall survival time. The present study was carried out in compliance with the principles of the Declaration of Helsinki and was approved by the Research Ethics Committee of the Shengjing Hospital of China Medical University (approval no. 2017PS177K). Written informed consent was obtained from all the patients.
Cell lines and cell culture
The normal human pancreatic ductal epithelial cell line HPDE and the human pancreatic cancer cell lines AsPC-1, BxPC-3, HPC-Y5, SW1990, Capan-2, PANC-1 and MIA PaCa-2 were obtained from the American Tissue Culture Collection. Short tandem repeat profiling was used for the authentication of all cell lines, which were propagated for <6 months after resuscitation. PANC-1 cells were propagated in DMEM (Thermo Fisher Scientific, Inc.); HPDE, AsPC-1 and BxPC-3 cells were propagated in RPMI-1640 medium (Thermo Fisher Scientific, Inc.); Capan-2, HPC-Y5 and MIA PaCa-2 cells were propagated in high-glucose DMEM (Thermo Fisher Scientific, Inc.); and SW1990 cells were propagated in L15 medium (Thermo Fisher Scientific, Inc.). All culture media were supplemented with 10% FBS (HyClone; Cytiva). All cells were cultured at 37°C with 5% CO2 in a humidified incubator. AsPC-1 and MIA PaCa-2 cells exhibited lower miR-190b expression levels, low differentiation, high cell malignant potential and high transfection efficiency. Therefore, AsPC-1 and MIA PaCa-2 cells were used in the subsequent experiments.
RNA extraction and reverse transcription (RT)
Extraction of total RNA, inclusive of the small RNA fraction, was performed using a miRNeasy Mini Kit (Qiagen GmbH) according to the manufacturer's instructions. A NanoDrop 2000c UV–Vis spectrophotometer (Thermo Fisher Scientific, Inc.) was used to determine the purity and concentration of RNA and reverse transcription was performed using a Mir-X™ miRNA First-Strand Synthesis Kit (Takara Bio, Inc.) according to the manufacturer's instructions.
Quantitative PCR (qPCR)
To confirm the expression levels of miR-190b, myocyte enhancer factor 2C (MEF2C) and transcription factor 4 (TCF4), qPCR was performed using an ABI 7500 Real-Time PCR System (Applied Biosystems; Thermo Fisher Scientific, Inc.), the corresponding analytical 7500 software (v2.3) and a SYBR Premix Ex Taq II Kit (Takara Bio, Inc.) according to the manufacturers' instructions. The PCR reactions used for the amplification of miRNA-190b and mRNAs were conducted at 95°C for 30 sec, followed by 45 cycles of 95°C for 5 sec and 60°C for 34 sec. U6 or GAPDH were used as an endogenous reference genes for normalization of miRNA or mRNA levels, respectively. The forward primer for the amplification of miR-190b was 5′-TGATATGTTTGATATTGGGTTG-3′; the reverse primer for the amplification of miR-190b was the mRQ 3′ Primer from the Mir-XTM miRNA First-Strand Synthesis Kit. The forward primer for the amplification of MEF2C was 5′-GCACCAACAAGCTGTTCCAG-3′; the reverse primer for the amplification of MEF2C was 5′-GGATGGAGACTGGCATCTCG-3′. The forward primer for the amplification of TCF4 was 5′-CAAGCACTGCCGACTACAATA-3′; the reverse primer for the amplification of TCF4 was 5′-CCAGGCTGATTCATCCCACTG-3′. The ratio between the expression level of miR-190b, MEF2C and TCF4 in cancer samples and that in non-tumor controls was examined using the 2−ΔΔCq method (18), in which ΔCq = CqmiR-190b-CqU6. A relative expression ratio of <0.5 (P<0.05) indicated a statistically significant difference between the cancer and control groups.
RNA oligoribonucleotides and cell transfection
All RNA oligoribonucleotides and the respective negative controls (NCs) were synthesized by Shanghai GenePharma Co., Ltd. The pyrimidine nucleotides in the miR-190b mimics and a stable NC were replaced by 2-O-methyl analogs to improve RNA stability. AsPC-1 cells were plated in 6-well-plates 1 day before RNA oligoribonucleotides were transfected. A total of 4×10⁵ cells in RPMI-1640 medium supplemented with 10% FBS were added to each well and were cultured at 37°C with 5% CO2. Transfection was performed using Lipofectamine® 2000 (Thermo Fisher Scientific, Inc.) according to the manufacturer's instructions. Opti-MEM (Thermo Fisher Scientific, Inc.) was used for transfection and was incubated at 37°C with 5% CO2. After 6 h, the medium was exchanged with RPMI-1640 medium supplemented with 10% FBS. After 48 h, the cells were harvested for further experiments. The RNA oligoribonucleotide sequences are shown in Table I.
 |
Table I.
Sequences of miR-190b-5p mimics, NC, anti-miR-190b-5p and anti-NC.
|
Table I.
Sequences of miR-190b-5p mimics, NC, anti-miR-190b-5p and anti-NC.
| RNA oligoribonucleotides |
Sequences (5–3) |
| miR-190b-5p |
F: UGAUAUGUUUGAUAUUGGGUUG |
| |
R: ACCCAAUAUCAAACAUAUCAUU |
| NC |
F: UUCUCCGAACGUGUCACGUTT |
| |
R: ACGUGACACGUUCGGAGAATT |
| Anti-miR-190b-5p |
CAACCCAAUAUCAAACAUAUCA |
| Anti-NC |
CAGUACUUUUGUGUAGUACAA |
Cell invasion assay. A Transwell cell invasion assay was used to evaluate the invasion ability of pancreatic cancer cells in vitro using 24-well tissue culture plates (Corning, Inc.) with a Transwell device containing culture inserts (8-µm pore). Matrigel (BD Biosciences) was rehydrated by the addition of 45 µl serum-free RPMI-1640 medium and used to coat the bottom of the culture inserts for 4 h at 37°C. After the mixture solidified, 5×10⁴ cells (AsPC-1 or MIA PaCa2) in serum-free RPMI-1640 or high-glucose DMEM (25×104 cells/ml) were added to the upper chamber at 37°C with 5% CO2. RPMI-1640 or high-glucose DMEM supplemented with 10% FBS was added to the lower chamber to serve as a chemoattractant. After 24 h, the non-invading cells on the upper surface of the filter were wiped with a cotton swab and cells that had invaded to the lower surface of the filter were fixed with 4% poly(methanol) (Sigma-Aldrich; Merck KGaA) for 15 min at room temperature and stained with H&E (3 min with hematoxylin and 15 sec with eosin) at room temperature. Five fields were randomly selected under a light microscope (magnification, ×400; Nikon Corporation) to observe and count the number of invasive cells.
Cell Counting Kit-8 (CCK-8) proliferation assay
Cell proliferation ability was measured using a CCK-8 assay (Nanjing KeyGen Biotech Co., Ltd.) according to the manufacturer's instructions. AsPC-1 cells were seeded into 96-well culture plates at a density of 5×10³ cells/well for 24, 48, 72 and 96 h prior to being incubated with 20 µl CCK-8 solution/well for 2 h at 37°C. Absorbance was measured at a wavelength of 450 nm using an iMARK microplate reader (Bio-Rad Laboratories, Inc.).
Animal experiments. A total of 48 female BALB/c nude mice (aged 4-5 weeks and weighing 15-20 g) were obtained from the Vital River Laboratory Animal Technology Co. Ltd. (Beijing, China) and housed at 25°C and 50% humidity under specific-pathogen-free conditions with a 12/12-h light/dark cycle. Sterile food and water were provided daily at the Department of Laboratory Animal Science of China Medical University. The animals had access to food and water ad libitum. All animal experimental protocols were in accordance with the Guide for the Care and Use of Laboratory Animals and the institutional ethical guidelines for animal experiments and were approved by the Ethics Committee Review Board of China Medical University (Shenyang, China; approval no. CMU2019224). A total of 24 mice were randomly assigned into three groups (n=8 per group). Approximately 5×10⁶ AsPC-1 cells in 0.1 ml PBS were subcutaneously injected into the right armpit region of each mouse. The tumor size was measured every 2 days by using calipers. At 16 days after injection, the mice were anesthetized with an intraperitoneal injection of 1% pentobarbital (50 mg/kg) and were then sacrificed by cervical dislocation. The subcutaneous tumors were isolated and measured, and the maximum tumor diameter did not exceed 1.5 cm. Tumor volume was calculated using the formula: 1/2 (LxW2), where L is the length and W is the width of the tumor. For the metastasis experiments, a total of 24 mice were randomly assigned into three groups (n=8 per group) and each mouse was injected with 1×10⁶ AsPC-1 cells in 0.1 ml PBS into the lateral tail vein. The mice were sacrificed 4 weeks after injection, their lungs were extracted, fixed in 4% paraformaldehyde overnight at room temperature in PBS, embedded in paraffin, cut into 4-µm sections and stained with H&E (3 min with hematoxylin and 15 sec with eosin) at room temperature. Ki67 antibody was used for immunohistochemistry at 4°C overnight. Visible lung metastases were measured and counted under a light microscope (magnification, ×200). The maximum diameter of the lung metastatic lesions did not exceed 0.2 cm.
Bioinformatics analyses and luciferase reporter assays
To predict potential target genes, TargetScan release 7.2 (http://www.targetscan.org/vert_72/) was used, and all compiled genes were searched against the National Center for Biotechnology Information (NCBI) database (https://www.ncbi.nlm.nih.gov/) to determine their potential roles in pancreatic cancer cell proliferation and metastasis.
The wild-type (WT) 3′-untranslated region (UTR) segments of MEF2C and TCF4 containing the miR-190b-binding sites were amplified through PCR. DNA fragments with mutated (MUT) target sites (MEF2C-MUT and TCF4-MUT), which were designed to interfere with miR-190b seed sequence recognition, were cloned. The DNA fragments were inserted into the pGL3-control vector (Promega Corporation) using the XbaI site. For the luciferase reporter assay, AsPC-1 cells were plated in 24-well plates at a density of 2×10⁵ cells per plate 1 day prior to transfection. The firefly and pRL Renilla (Promega Corporation) luciferase reporters were co-transfected with miR-190b mimics or NCs into AsPC-1 cells using Lipofectamine® 2000, in line with the manufacturer's instructions. On day 1 post-transfection, firefly and Renilla luciferase activities were measured consecutively using the Dual-Luciferase Reporter Assay (Promega Corporation) and a Centro LB 960 Microplate Luminometer (Titertek-Berthold). The sequences of the primers and DNA segments are provided in Table II.
|
Table II.
Primers and DNA segments used for vector construction.
|
Table II.
Primers and DNA segments used for vector construction.
| Genes |
Sequences (5–3) |
| MEF2C |
F: GCTCTAGATGCAGTTGCACATTTGAG |
| |
R: GCTCTAGAAATGGTGAGATCAGAAAGG |
| TCF4 |
F: GCTCTAGAAAACAAGAGACCACTTCC |
| |
R: GCTCTAGAAGTTTAGGCACAAATGC |
| MEF2C-MUTa |
GCTCTAGATGCAGTTGCACATTTGAGTAACTATTTTCTTTCTGTTTTCTT TTACTCTGCTTACATTTT |
| |
ATAAGTTTAAGGTCAGCTGTCAAAAGGATAACCTGTGG GGTTAGACTGAGGACCATTGCAACACC |
| |
CTAAATTGTTTTTAATACATTAGCAATCTAT TGGGTCAACTGACATCCATTGTATATACTAGTTTCTT |
| |
TCATGCTATTTTTATTT TGTTTTTTGCATTTTTATCAAATGCAGGGCCCCTTTCTGATCTCACCATTT |
| |
CTAGAGC |
| TCF4-MUT |
GCTCTAGAAAACAAGAGACCACTTCCTTAACAGCTGTATTATCTTAAACCCACAT AAACACTTCTC |
| |
CTTAACCCCCATTTTTGTAATATAAGACAAGTCTGAGTAGTTATGAA TCGCAGACGCAAGAGGTTT |
| |
CAGCATTCCCAATTATCAAAAAACAGAAAA ACAAAAAAAAGAAAGAAAAAAGTGCAACTTGAG |
| |
GGACGACTTTCTTTACGTCCGATTTCAGAATGTGCAAAGCAGTATGTACAGGCTGAGACACAGCC |
| |
CAGAGACTGAACGGCAATCTTTCCACACTGTGGAACAATGCATTTGTGCCTAAACT TCTAGAGC |
Protein extraction and western blotting
Total protein was extracted using a Total Protein Extraction Kit (Nanjing KeyGen Biotech Co., Ltd.), and the protein concentration was quantified by using a BCA Protein Assay Kit (Nanjing KeyGen Biotech Co., Ltd.), according to the manufacturer's instructions. Subsequently, 30 µg of protein was separated using 10% SDS-PAGE and then electrophoretically transferred to PVDF membranes (MilliporeSigma). The membranes were incubated at room temperature for 2 h with 5% non-fat dry milk in Tris-buffered saline-0.5% Tween-20 prior to immunoblotting with primary antibodies against MEF2C (1:1,000; cat. no. YT2702, ImmunoWay Biotechnology Company) and TCF4 (1:1,000; cat. no. YT4580; ImmunoWay Biotechnology Company) at 4°C overnight. Following incubation with 1:10,000 donkey anti-mouse (cat. no. sa00001-1) or donkey anti-rabbit (cat. no. sa00001-9) peroxidase-conjugated secondary antibodies (Wuhan Sanying Biotechnology; ProteinTech Group, Inc.) for 2 h at room temperature, the antigen-antibody complexes were visualized using the FluorChem 2.01 System (Alpha Innotech Corporation; ProteinSimple) and an Enhanced Chemiluminescence Kit (Pierce; Thermo Fisher Scientific, Inc.). Protein levels in miR-190b mimic-transfected AsPC-1 cells are presented as fold-change values relative to the levels in NC-transfected AsPC-1 cells after normalization to GAPDH as an endogenous reference.
Immunohistochemistry (IHC)
Antibodies against Ki67 (1:50; cat. no. M7240, Dako; Agilent Technologies, Inc.), MEF2C (1:300; cat. no. YT2702, ImmunoWay Biotechnology Company) and TCF4 (1:300; cat. no. YT4580, ImmunoWay Biotechnology Company) were used in the present study. In brief, the slides were dewaxed, and endogenous peroxidase activity was then quenched with 3% H2O2. Tissue samples were heated in 1 mmol/l EDTA buffer for 15 min in a water bath (96-98°C) to retrieve antigens, and cross-reactivity was blocked with normal goat serum (Abcam). The slides were then incubated overnight at 4°C with primary antibodies. The subsequent steps were performed using the streptavidin-peroxidase method according to the instructions of the manufacturer (Zymed; Thermo Fisher Scientific, Inc.). The primary antibodies were replaced by normal serum or PBS as negative controls.
Evaluation of immunostaining results. For Ki67, the criterion for a positive reaction was nuclear staining only. Two experienced pathologists analyzed the staining results, which were quantified as percentage of cells with positive nuclear staining.
For MEF2C and TCF4, the criterion for a positive reaction was cytoplasmic and/or nuclear staining
Two experienced pathologists analyzed the staining results, which were quantified using a staining index (values, 0-6) determined by multiplying the score of staining intensity by the score of the positive area, as described previously (19). The intensity was scored as follows: 0, negative; 1, weakly positive; and 2, moderately positive. The percentage of positive cells was defined as follows: 0, <5%; 1, 5-25%; 2, 26-50%; and 3, 51-100%. MEF2C and TCF4 staining scores were classified as low expression (0–1) or high expression (2–6).
Statistical analysis
The non-parametric Mann-Whitney U test was used to compare the relative expression levels of miR-190b between groups as detected by RT-qPCR. Other results are presented as the mean ± SD of at least three separate experiments. One-way analysis of variance or unpaired Student's t-tests were used to analyze statistical differences between groups, with P<0.05 (two-tailed tests) considered to indicate statistically significant differences. One-way ANOVA followed by Tukey's multiple comparisons tests were selected for multiple group comparisons. Survival curves were plotted using the Kaplan-Meier method. Differences between survival curves were analyzed using the log-rank test. Pearson's correlation analysis was used to determine the correlations between miR-190b expression and the mRNA levels of MEF2C and TCF4. SPSS v16.0 (SPSS, Inc.) was used for all statistical analyses.
Results
miR-190b is downregulated in human pancreatic cancer cell lines and PDAC tissues
The expression of miR-190b was first evaluated in eight human pancreatic cell lines using RT-qPCR. The results demonstrated that miR-190b levels were lower in the pancreatic cancer cell lines PANC-1 (0.004±0.0002-fold; P<0.01), MIA PaCa-2 (0.008±0.0003-fold; P<0.01), AsPC-1 (0.20±0.04-fold; P<0.01), HPC-Y5 (0.35±0.08-fold; P<0.01), SW1990 (0.61±0.10-fold; P<0.05), Capan-2 (0.76±0.26-fold; P>0.05), and BxPC-3 (0.83±0.22-fold; P>0.05) compared with those in the normal HPDE cell line (Fig. 1A). Furthermore, miR-190b expression was examined in 50 samples of human PDAC tissues and matched non-tumor adjacent tissues using RT-qPCR. It was demonstrated that miR-190b expression was significantly lower in PDAC tissues compared with that in non-tumor adjacent tissues (0.51±1.56-fold; P<0.01, non-parametric test on two independent samples; Fig. 1B). Furthermore, the correlation between miR-190b expression and clinicopathological characteristics in the 50 patients with PDAC was analyzed. PDAC was staged according to the TNM classification system (20). As shown in Table III and Fig. 1C, low miR-190b expression levels were associated with higher T (P<0.05), N (P<0.05) and AJCC (P<0.05) classifications compared with patients with high miR-190b expression levels. The cut-off value of miR-190b expression used to generate the two groups of patients was 0.5. A relative expression ratio of <0.5 (P<0.05) was considered to indicate a significantly lower expression in PDAC tissues compared with matched non-tumor adjacent tissues. A relative expression ratio of ≥0.5 (P>0.05) was considered to indicate a non-significantly lower expression in PDAC tissues compared with matched non-tumor adjacent tissues. The Kaplan-Meier method with the log-rank test revealed that patients with PDAC exhibiting significantly lower miR-190b expression had shorter survival compared with patients in whom the expression of miR-190b did not differ significantly between PDAC tissues and matched non-tumor adjacent tissues (P<0.05; Fig. 1D).
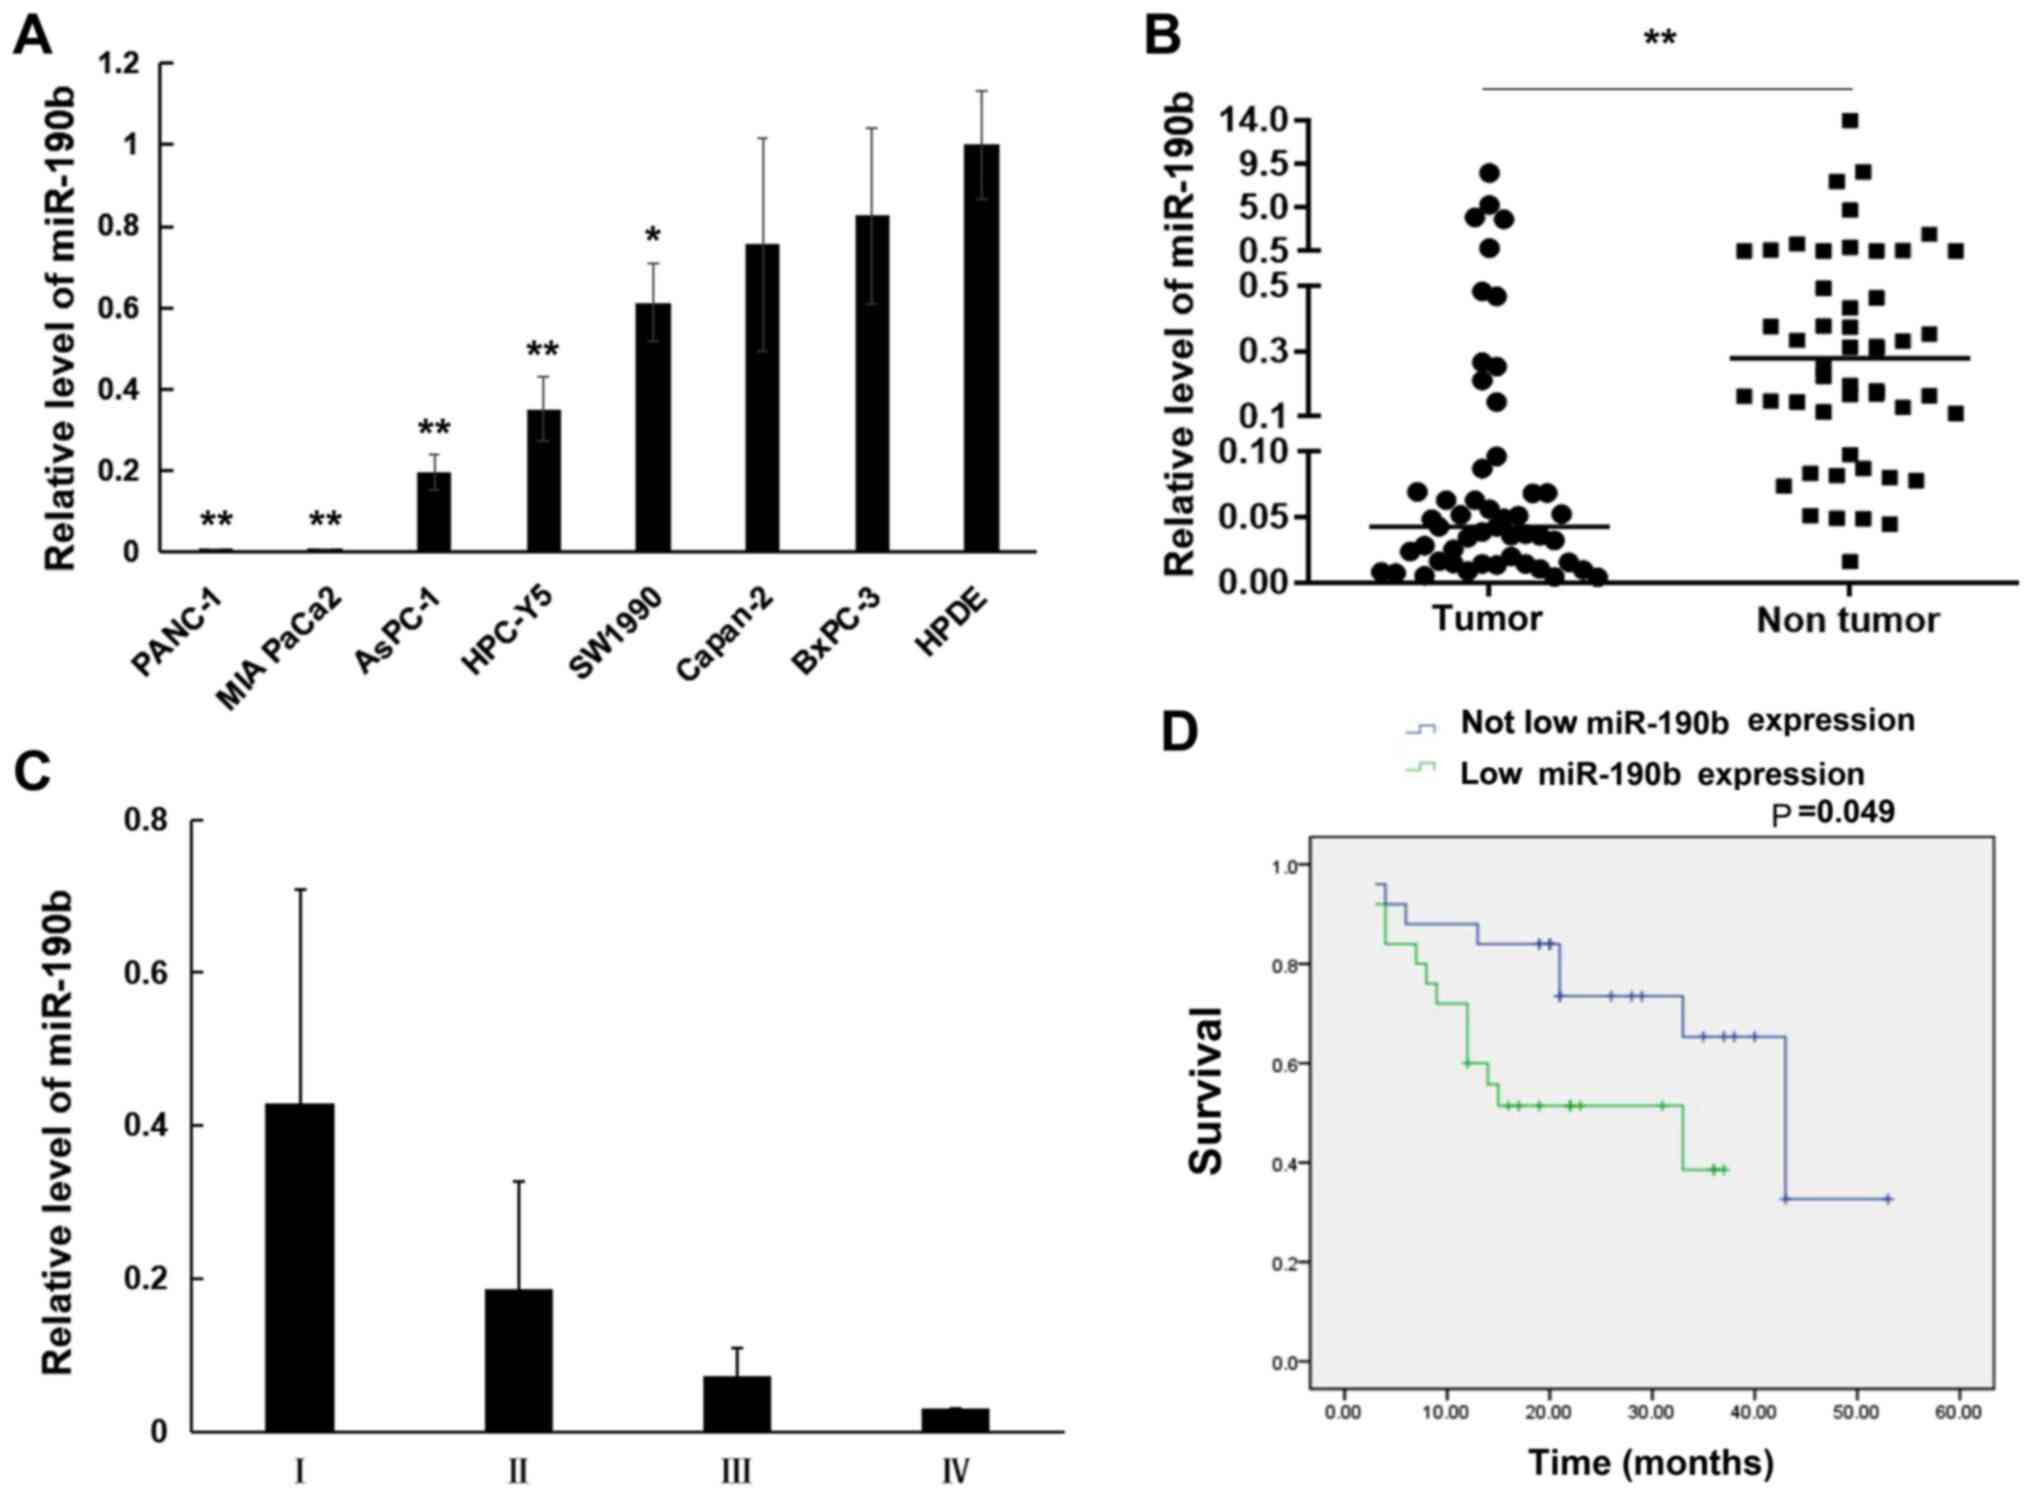 |
Figure 1.
miR-190b expression in pancreatic cell lines and pancreatic tissues. Relative expression levels were determined by reverse transcription-quantitative PCR analysis. (A) miR-190b expression levels in pancreatic cancer cell lines relative to the normal human pancreatic ductal cell line HPDE. (B) Comparison of miR-190b levels between pancreatic cancer tissues and non-tumor tissues. (C) Non-parametric test demonstrated that patients with lower AJCC stage (I and II) had significantly higher miR-190b expression compared with those with higher AJCC stage (II and III) (P<0.01). (D) Survival curves according to miR-190b expression levels in patients with PDAC. The cut-off value of miR-190b expression used to generate the two groups of patients was a relative expression ratio of 0.5. Values are presented as mean ± SD. n=3. *P<0.05 and **P<0.01. miR, microRNA; AJCC, American Joint Committee on Cancer; PDAC, pancreatic ductal adenocarcinoma.
|
|
Table III.
Association between the expression levels of miR-190b and clinicopathological characteristics in patients with pancreatic cancer.
|
Table III.
Association between the expression levels of miR-190b and clinicopathological characteristics in patients with pancreatic cancer.
| Characteristics |
n |
Median (quartiles) of miR-190b expression |
P-value |
| Sex |
|
|
0.57 |
| Male |
25 |
0.19 (0.09-0.38) |
|
| Female |
25 |
0.21 (0.11-0.48) |
|
| Age (years) |
|
|
0.53 |
| ≥60 |
31 |
0.21 (0.10-0.42) |
|
| <60 |
19 |
0.18 (0.11-0.38) |
|
| pT stage |
|
|
0.000a |
| T1 |
8 |
0.52 (0.39-0.67) |
|
| T2 |
25 |
0.24 (0.18-0.41) |
|
| T3 |
16 |
0.10 (0.06-0.13) |
|
| T4 |
1 |
0.03 |
|
| pN stage |
|
|
0.018a |
| N0 |
34 |
0.21 (0.12-0.52) |
|
| N1 |
12 |
0.20 (0.12-0.38) |
|
| N2 |
4 |
0.06 (0.03-0.10) |
|
| 8th AJCC stage |
|
|
0.000a |
| IA |
6 |
0.58 (0.48-0.71) |
|
| IB |
17 |
0.24 (0.18-0.49) |
|
| IIA |
11 |
0.10 (0.06-0.15) |
|
| IIB |
12 |
0.20 (0.12-0.38) |
|
| III |
3 |
0.08 (0.03-0.10) |
|
| IV |
1 |
0.03 |
|
| Obstructive jaundice |
|
|
0.49 |
| Negative |
29 |
0.19 (0.10-0.37) |
|
| Positive |
21 |
0.24 (0.11-0.56) |
|
| Tumor site |
|
|
0.81 |
| Pancreatic body |
7 |
0.19 (0.05-0.53) |
|
| Pancreatic body and tail |
14 |
0.19 (0.10-0.28) |
|
| Pancreatic head |
29 |
0.21 (0.11-0.46) |
|
miR-190b suppresses pancreatic cancer cell invasion in vitro
To explore the role of miR-190b in pancreatic cancer, AsPC-1 cells were transfected with miR-190b mimics, anti-miR-190b and corresponding NCs. The transfection efficiency was confirmed by using RT-qPCR (Fig. 2A and B). Transwell cell invasion assay demonstrated that the in vitro invasive ability of AsPC-1 cells transfected with miR-190b mimics was lower compared with that of cells transfected with NC; in addition, the invasion ability of AsPC-1 cells transfected with anti-miR-190b was higher compared with that of cells transfected with anti-NC and blank control. The number of miR-190b-transfected AsPC-1 cells invading through the membrane was significantly lower (19±7) compared with that of their NC-transfected counterparts (38±7) or parental counterparts (41±6) (both P<0.05; Fig. 2C and D). The number of anti-miR-190b-transfected AsPC-1 cells (56±7) invading through the Matrigel membrane was significantly higher compared with that of their anti-NC-transfected counterparts (39±6) and parental AsPC-1 cells (40±8) (both P<0.01; Fig. 2E and F). Similar results were obtained for MIA PaCa-2 cells (Fig. 3).
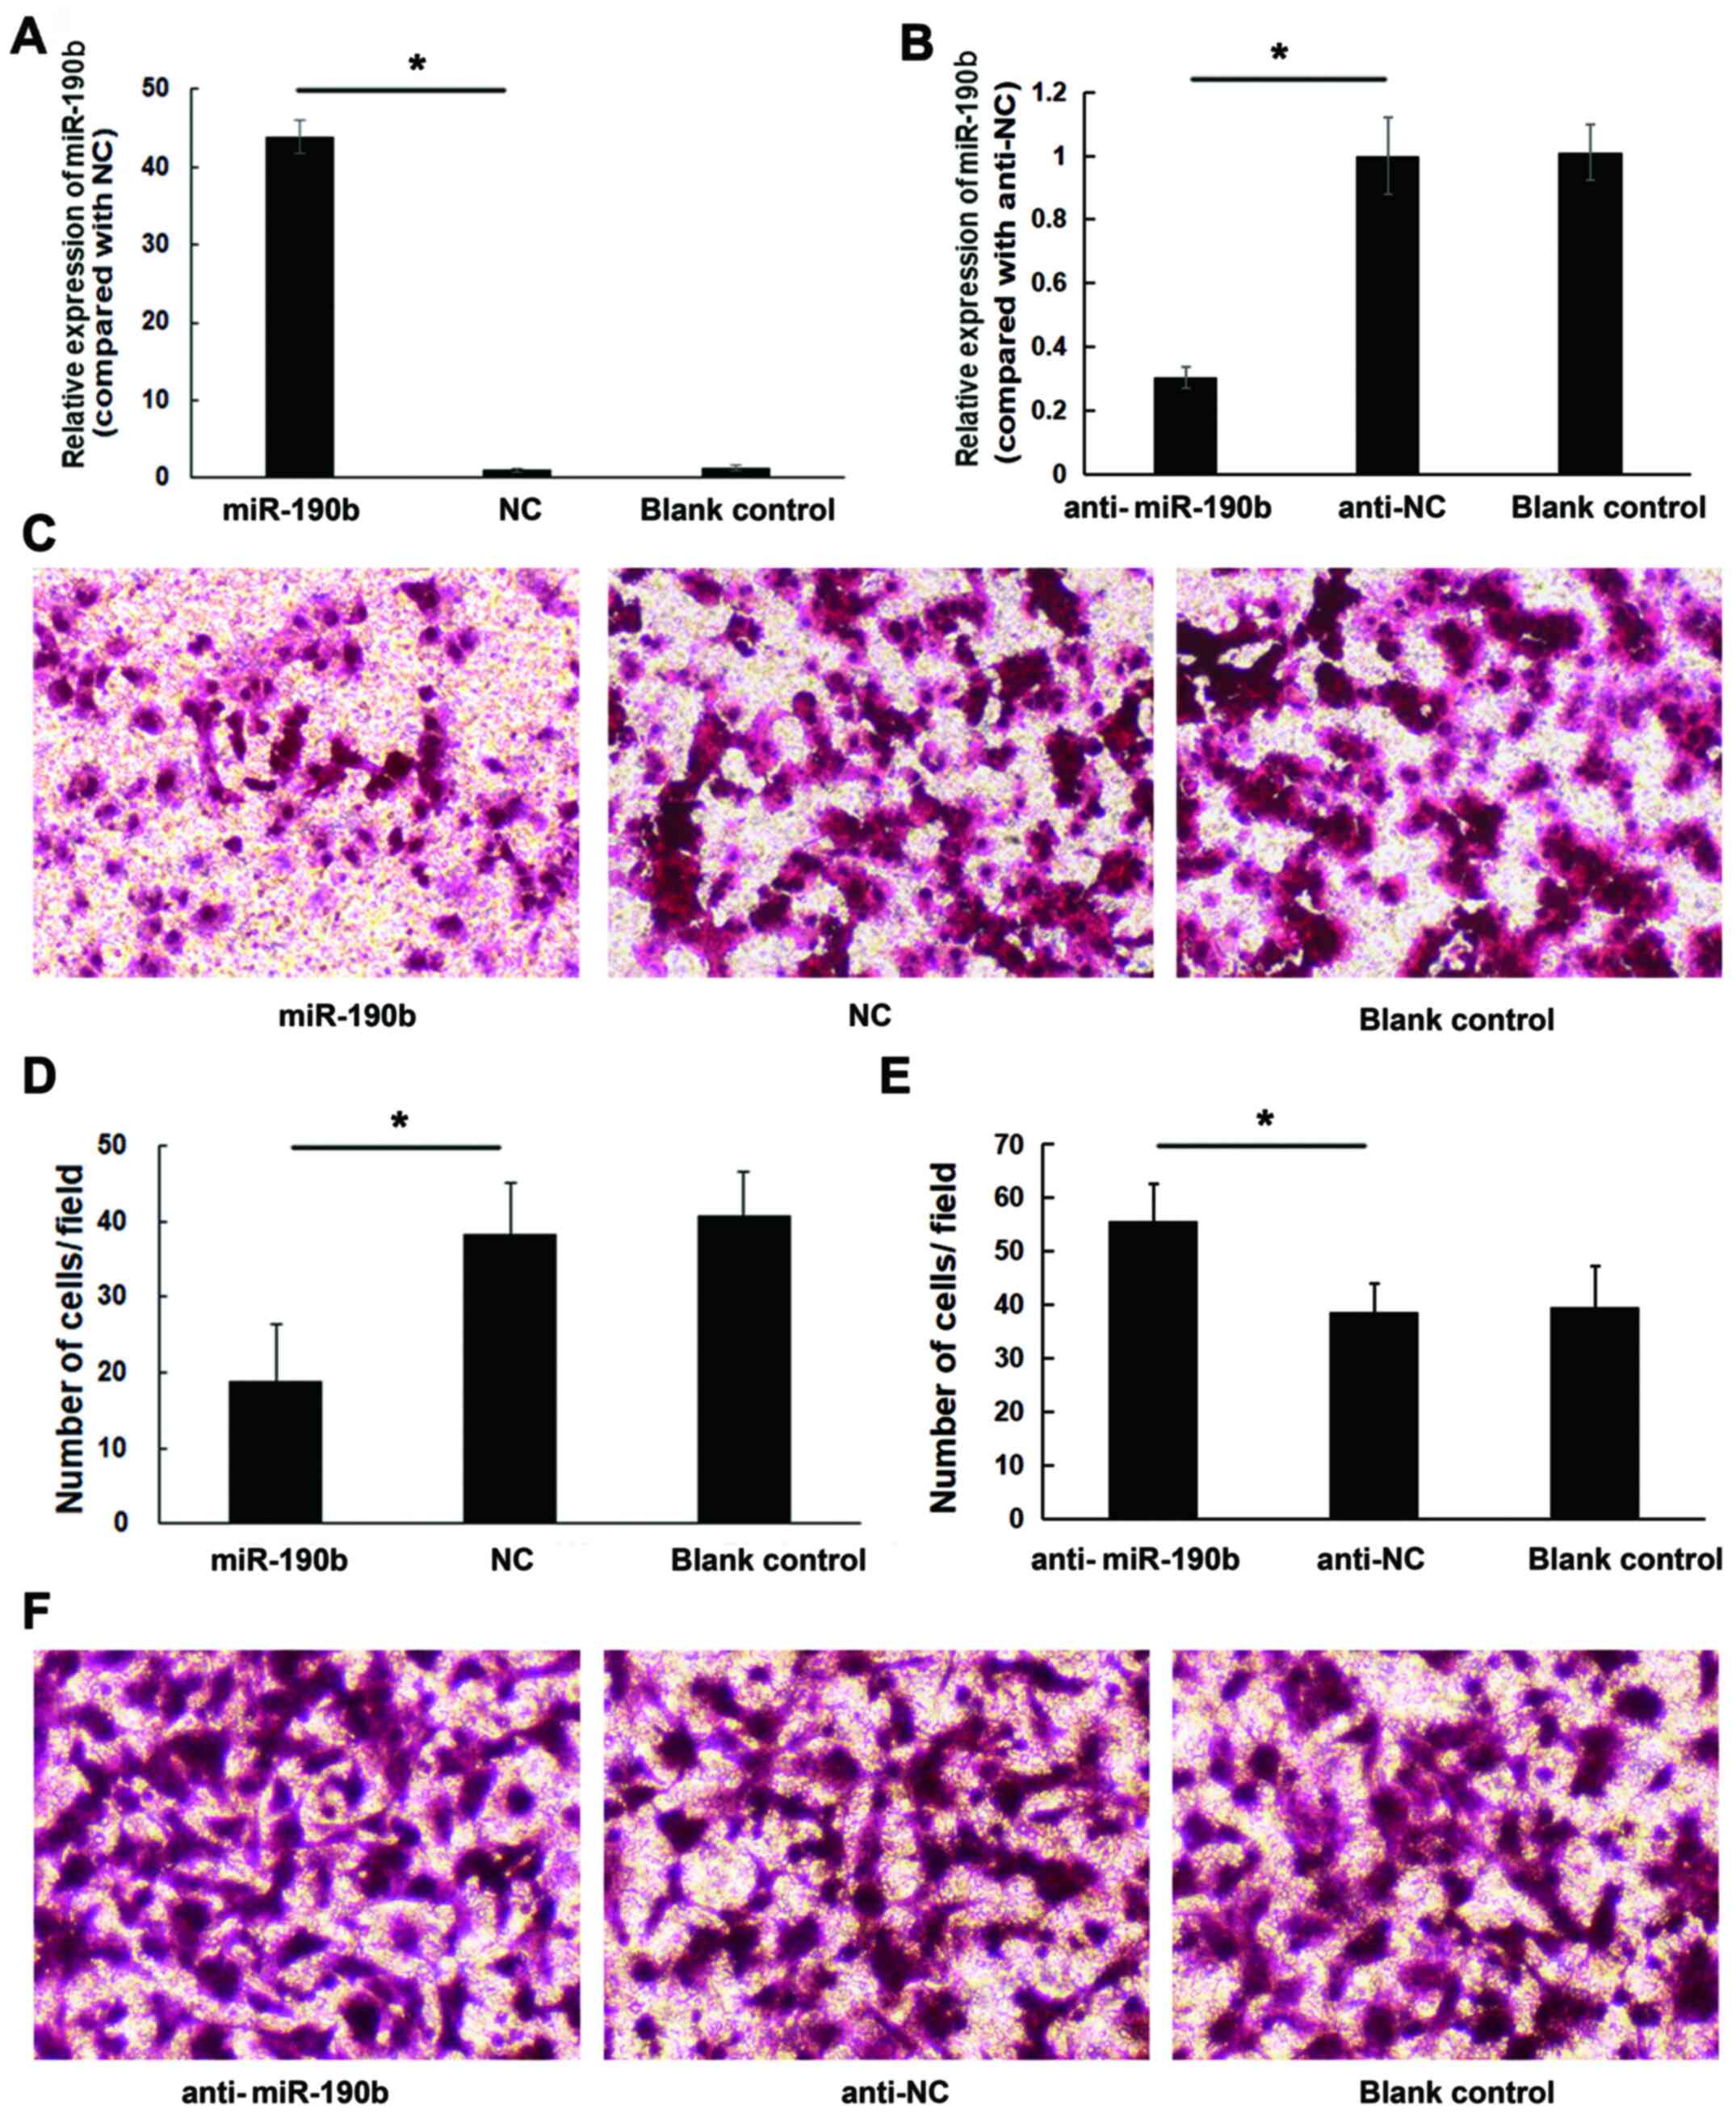 |
Figure 2.
miR-190b suppresses AsPC-1 cell invasion in vitro. (A) AsPC-1 cells were transfected with miR-190b mimics or NC. Following transfection with miR-190b mimics, miR-190b expression increased by 42.88±2.18-fold. (B) AsPC-1 cells were transfected with anti-miR-190b or anti-NC. Following transfection with anti-miR-190b, miR-190b expression decreased by 0.30±0.03-fold. (C) Representative photomicrographs of Transwell assay results for AsPC-1 cells (original magnification, ×100). (D) The numbers of miR-190b-transfected AsPC-1 cells invading through the Matrigel membrane were significantly lower compared with NC-transfected and parental AsPC-1 cells (blank control). Cells were counted in 16 independent symmetrical visual fields under an inverted microscope (original magnification, ×400) in three independent experiments. (E) The numbers of anti-miR-190b-transfected AsPC-1 cells invading through the Matrigel membrane were significantly higher compared with anti-NC-transfected and parental AsPC-1 cells (blank control). Cells were counted in 16 independent symmetrical visual fields under an inverted microscope (original magnification, ×400) in three independent experiments. (F) Representative photomicrographs of Transwell assay results for AsPC-1 cells (original magnification, ×100). Values are shown as mean ± SD; n=3. *P<0.05. miR, microRNA; NC, negative control.
|
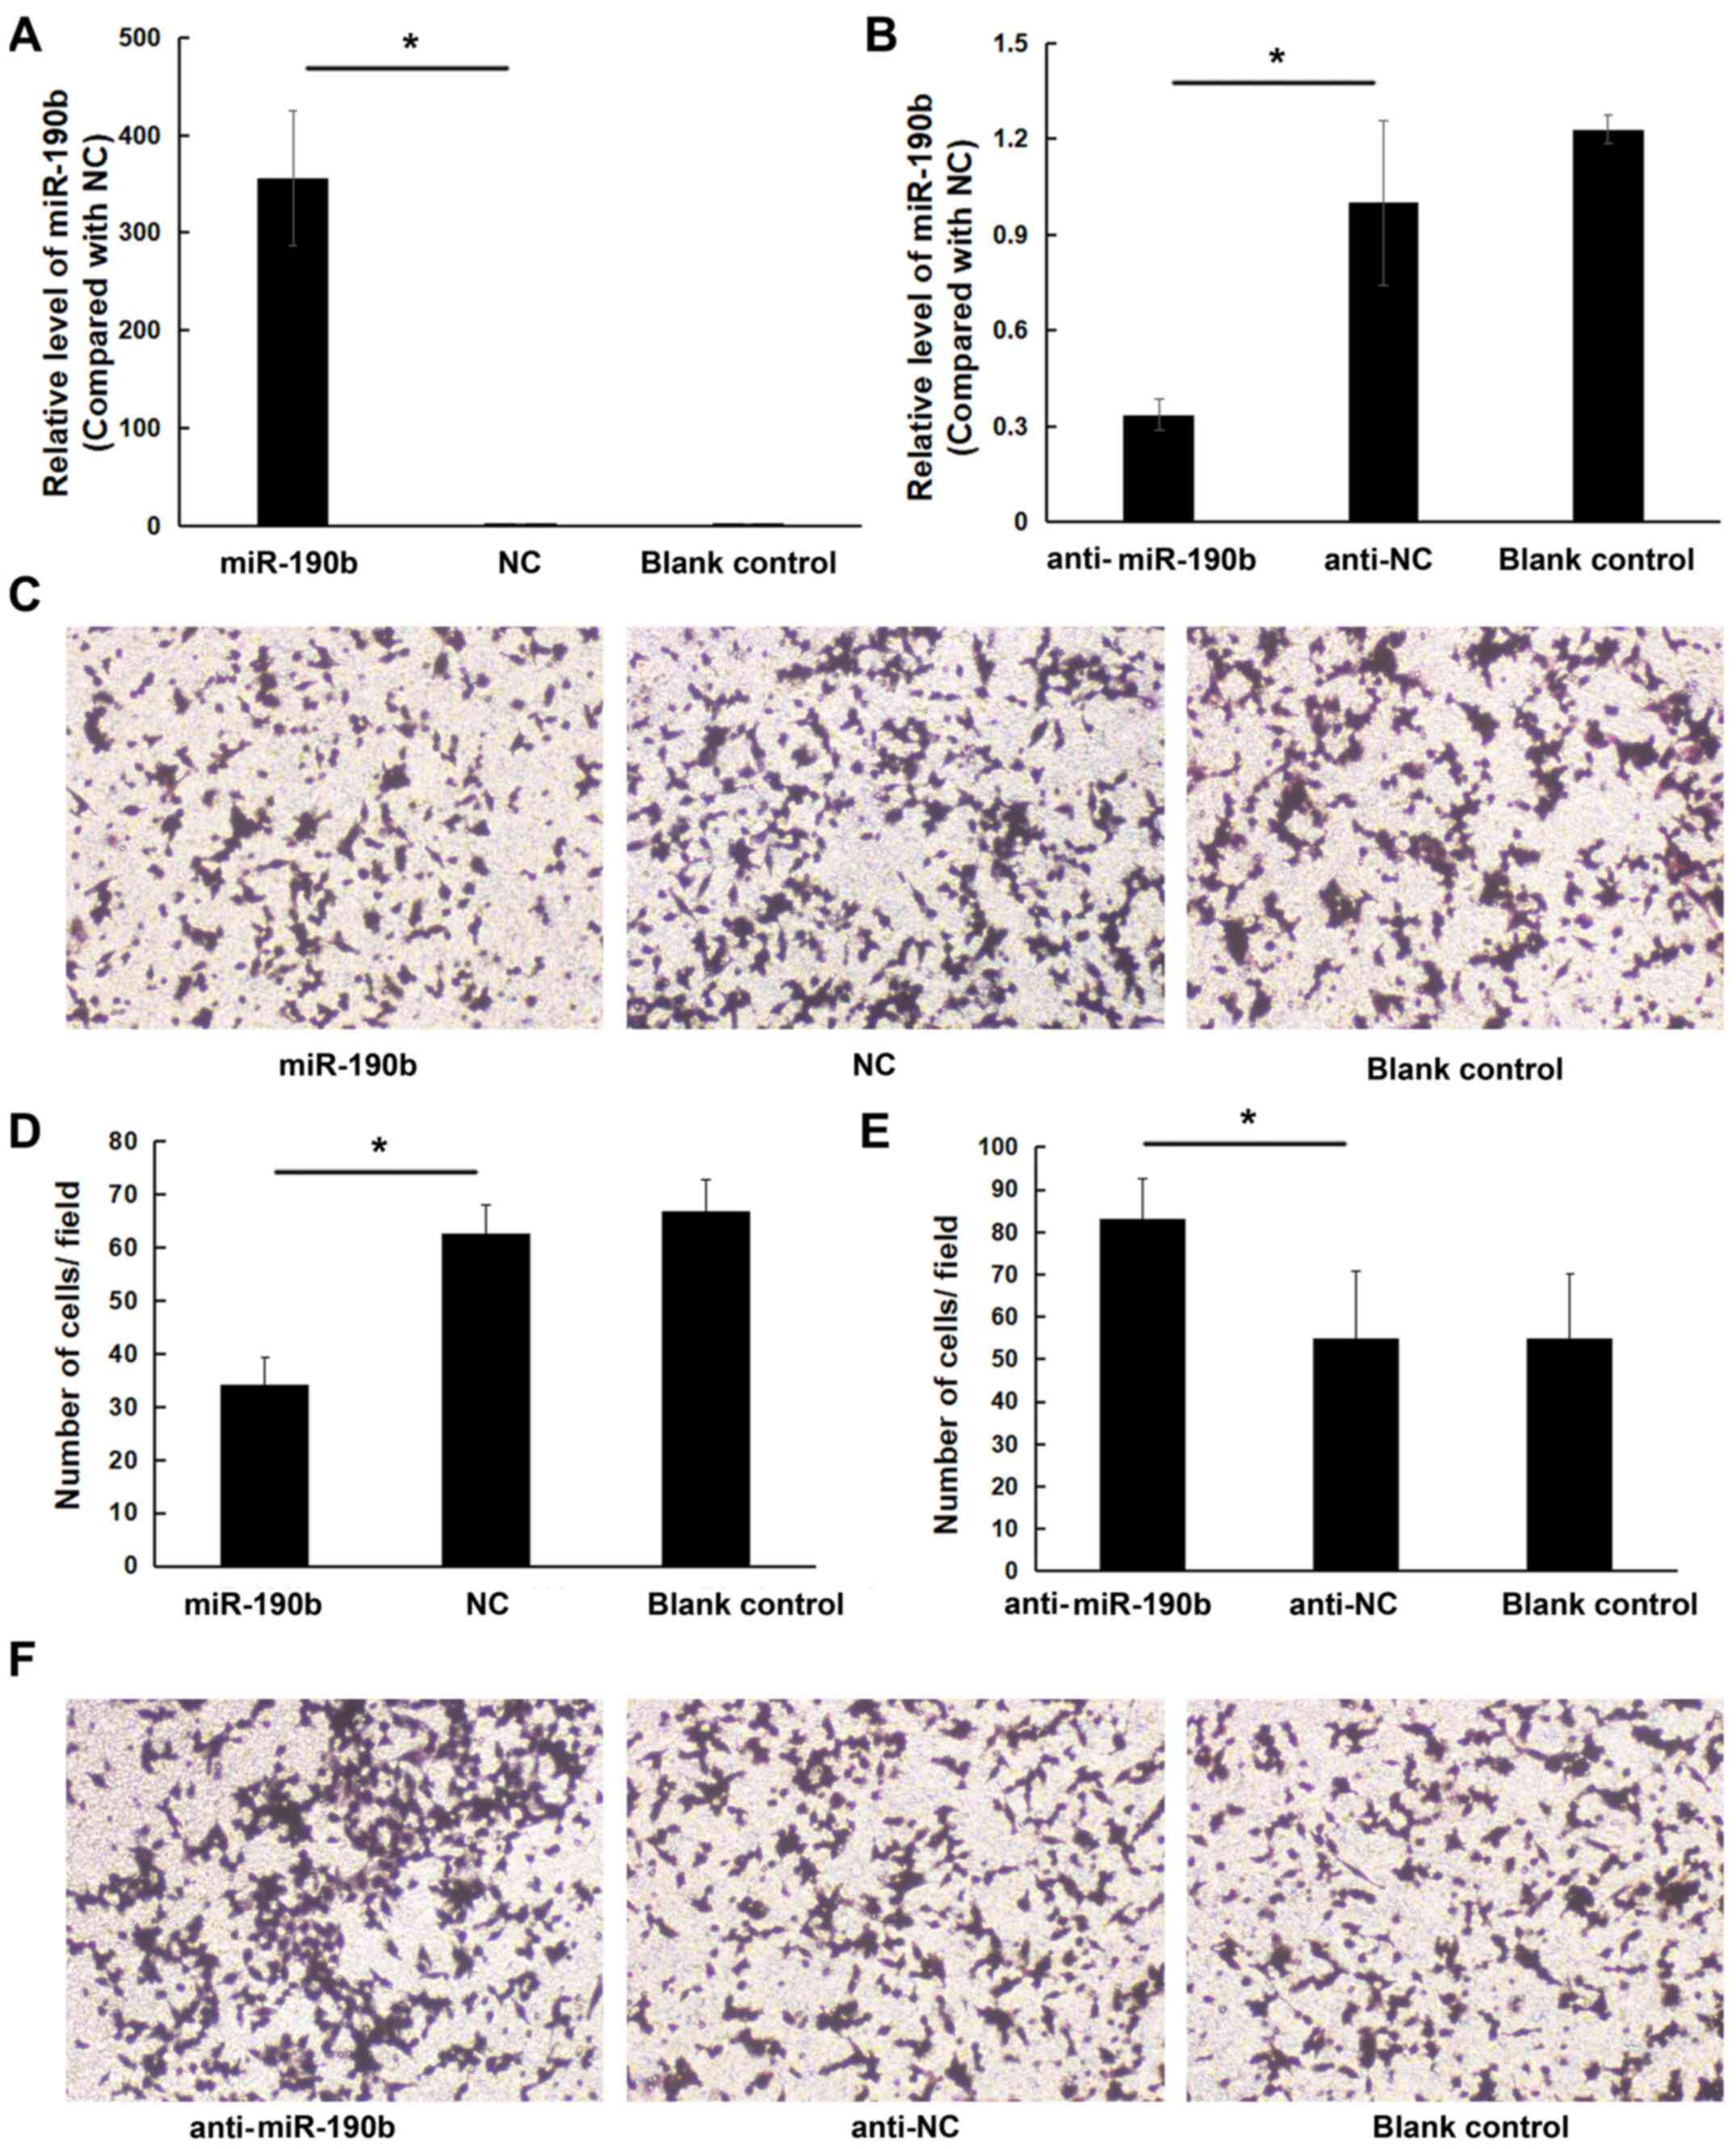 |
Figure 3.
miR-190b suppresses MIA PaCa-2 cell invasion in vitro. (A) MIA PaCa2 cells were transfected with miR-190b mimics or NC. Following transfection with miR-190b mimics, miR-190b expression increased by 354.62±69.44-fold. (B) MIA PaCa-2 cells were transfected with anti-miR-190b or anti-NC. Following transfection with anti-miR-190b, miR-190b expression decreased by 0.34±0.05-fold. (C) Representative photomicrographs of Transwell assay results for MIA PaCa-2 cells (original magnification, ×100). (D) The numbers of miR-190b-transfected MIA PaCa-2 cells invading through the Matrigel membrane were significantly lower compared with NC-transfected and parental MIA PaCa-2 cells (blank control). Cells were counted in 16 independent symmetrical visual fields under a light microscope (original magnification, ×400) in three independent experiments. (E) The numbers of anti-miR-190b-transfected MIA PaCa-2 cells invading through the Matrigel membrane were significantly higher compared with anti-NC-transfected and parental MIA PaCa-2 cells (blank control). Cells were counted in 16 independent symmetrical visual fields under a light microscope (original magnification, ×400) in three independent experiments. (F) Representative photomicrographs of Transwell assay results for MIA PaCa-2 cells (original magnification, ×100). Values are shown as mean ± SD; n=3. *P<0.05. miR, microRNA; NC, negative control.
|
miR-190b suppresses pancreatic cancer cell proliferation in vitro
A CCK-8 assay was performed to evaluate the effect of miR-190b on pancreatic cancer cell proliferation. There was a significant inhibitory effect of miR-190b on the proliferation of AsPC-1 cells at 72 and 96 h (P<0.05). No significant differences were found between the miR-190b and NC groups at 24 and 48 h (Fig. 4A). Low miR-190b expression levels were correlated with a significant increase in AsPC-1 cell proliferation (Fig. 4B). Similar results were obtained for MIA PaCa-2 cells (Fig. 4C and D).
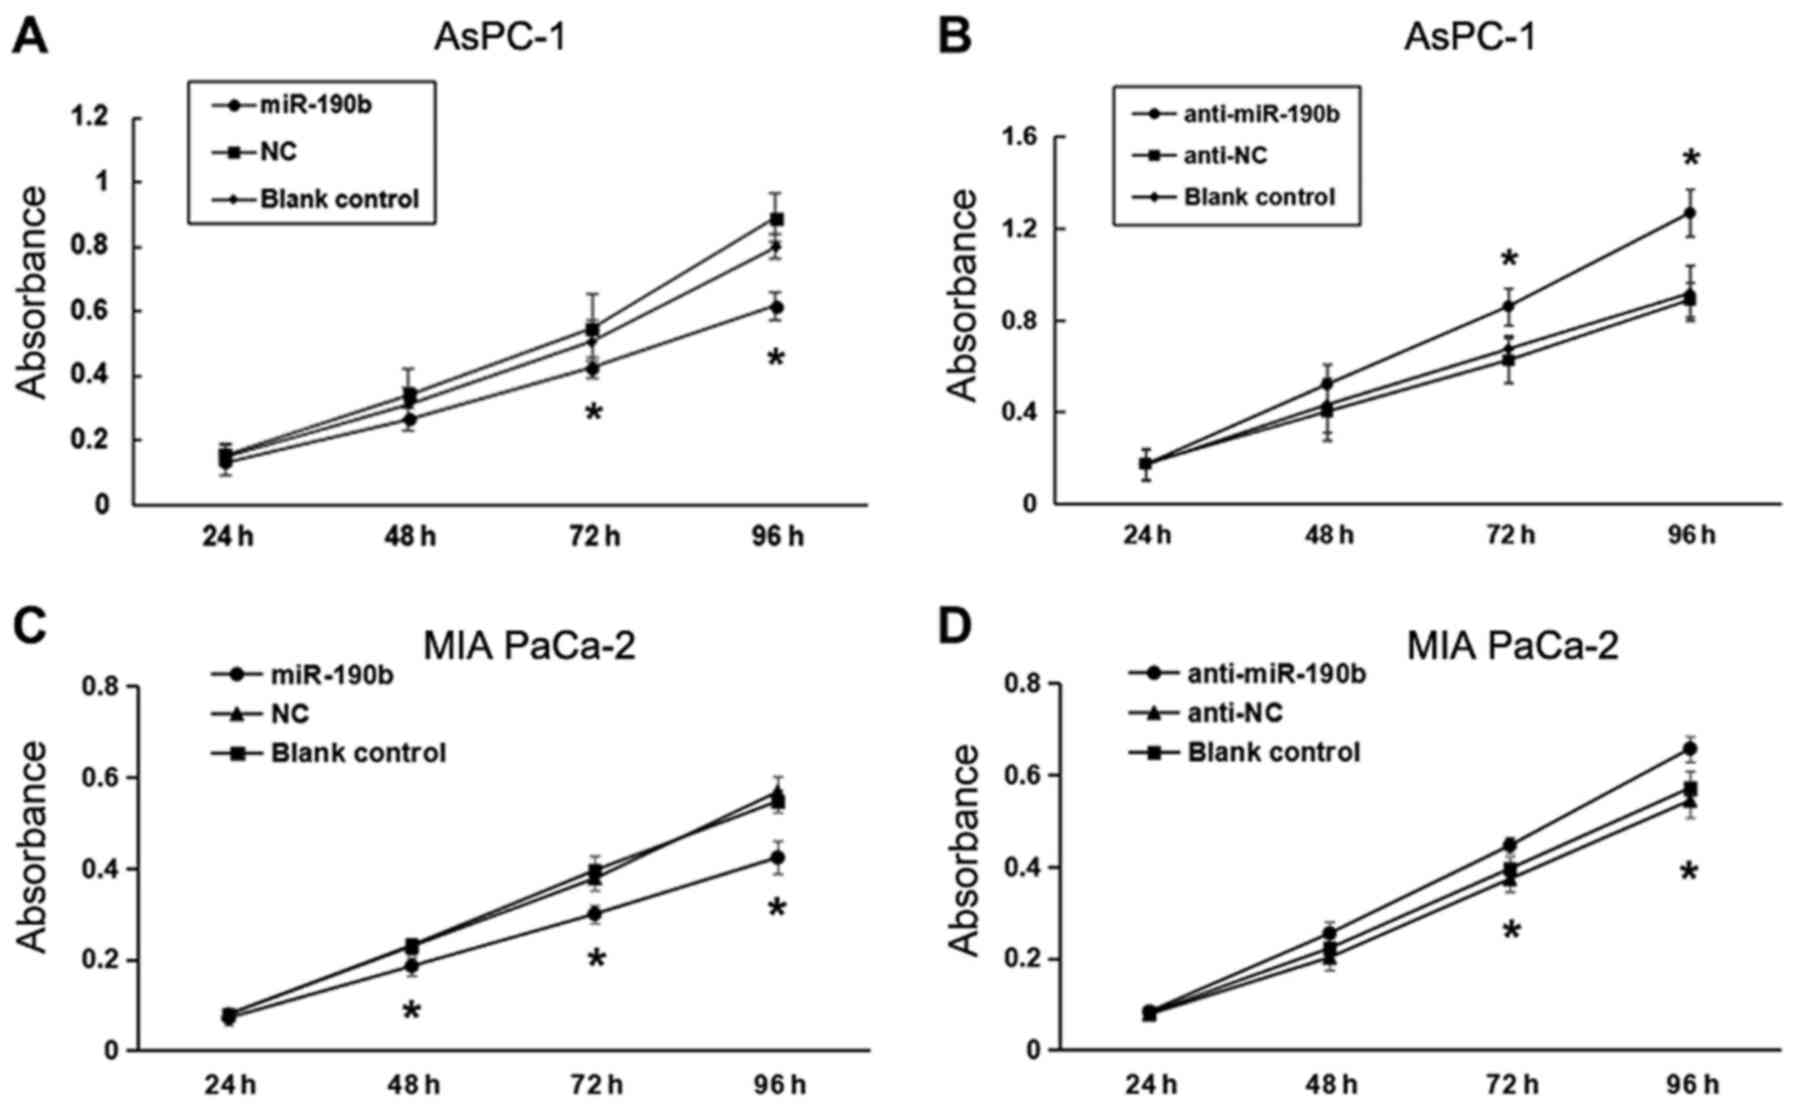 |
Figure 4.
miR-190b suppresses pancreatic cancer cell proliferation in vitro. CCK-8 assay demonstrated that (A) miR-190b suppressed AsPC-1 cell proliferation and (B) anti-miR-190b significantly promoted AsPC-1 cell proliferation at 72 and 96 h. CCK-8 assay demonstrated that (C) miR-190b suppressed MIA PaCa-2 cell proliferation and (D) anti-miR-190b significantly promoted MIA PaCa-2 cell proliferation at 72 and 96 h. miR, microRNA; CCK-8, Cell Counting Kit-8; NC, negative control. *P<0.05.
|
miR-190b suppresses pancreatic cancer growth and metastasis in vivo
To further observe the effects of miR-190b on AsPC-1 cell proliferation in vivo, nude mice were subcutaneously injected with miR-190b-transfected, NC-transfected and parental AsPC-1 cells. At 4 days post-injection, the tumors in the miR-190b group were significantly smaller compared with those in each of the other groups (Fig. 5A-C), indicating a causal relationship between miR-190b overexpression and a decreased cell proliferative capacity, as measured by a CCK-8 assay.
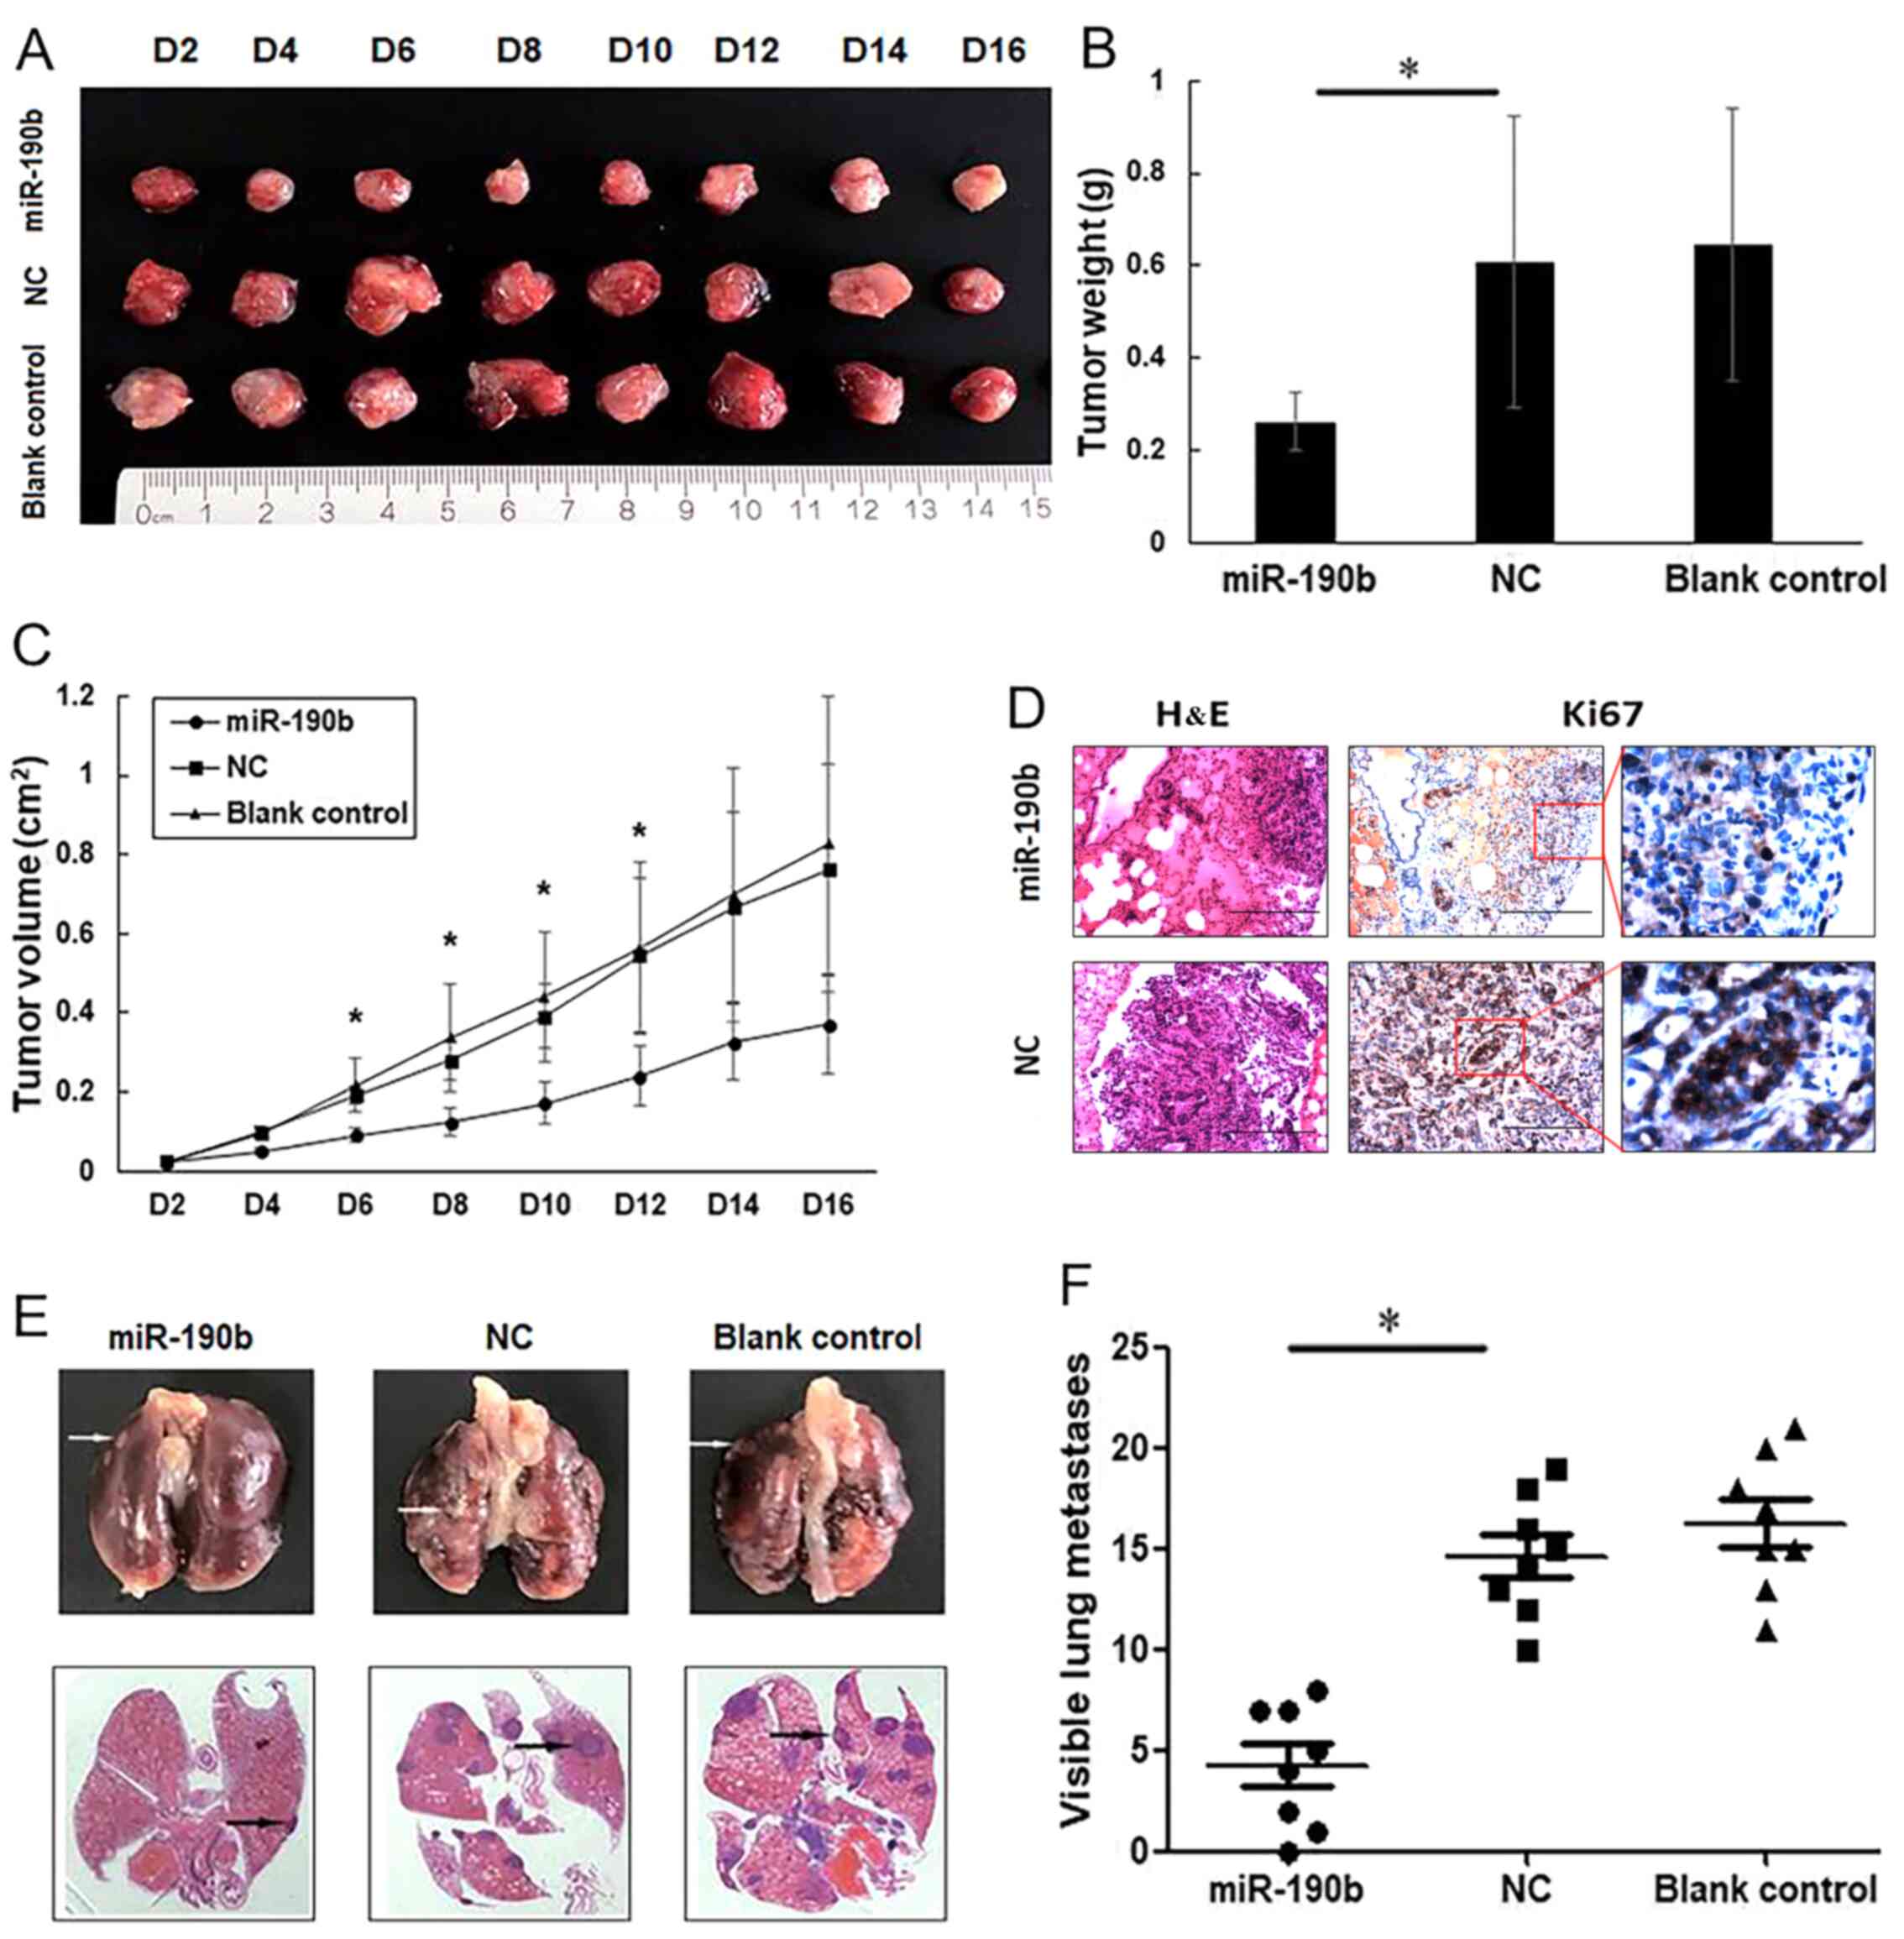 |
Figure 5.
miR-190b suppresses pancreatic cancer growth and metastasis in vivo. (A) Xenograft mouse models were used to detect the proliferative ability of AsPC-1 cells in vivo. Images of tumors in each group up to day 16 after injection. (B) Mean tumor weight in each group. (C) Tumor growth curves based on in vivo tumor volume. (D) Representative microscopic images showing histological morphology (H&E staining; magnification, ×100) and Ki67 expression [magnification, ×100 and ×400 (inset)]. Scale bar, 100 µm. (E) Representative images of mouse lung tissues (upper panels) and corresponding histological sections (lower panels). Cell aggregates with dark-stained nuclei represent lung metastases (arrows). (F) Data are shown graphically by the number of lung metastases at 4 weeks in each mouse injected with 1×10⁶ AsPC-1 cells. Values are shown as mean ± SD; n=8. *P<0.05. miR, microRNA; NC, negative control.
|
For metastasis experiments, 1×10⁶ viable parental AsPC-1 cells or AsPC-1 cells transfected with miR-190b mimics or stable NC were injected into the lateral tail vein. At 4 weeks after injection, the lungs were dissected for microscopic histological examination and Ki67 expression analysis, which demonstrated that mice injected with miR-190b-transfected AsPC-1 cells had lower percentages of Ki67-positive cells in the lung metastases (0.46±0.03-fold; P<0.01). The representative Ki67 staining diagram is shown in Fig. 5D. Mice injected with miR-190b-transfected AsPC-1 cells also exhibited lower numbers of lung metastases compared with those injected with NC-transfected AsPC-1 cells (Fig. 5E and F), suggesting that the overexpression of miR-190b clearly inhibited cancer metastasis in vivo.
miR-190b targets MEF2C and TCF4 in PDAC cells
TargetScan release 7.2 was used for target gene prediction. Among all the 223 genes compiled in this analysis, MEF2C and TCF4 were identified as likely contributors to pancreatic cancer cell proliferation and metastasis based on searches against the NCBI database (Fig. 6A).
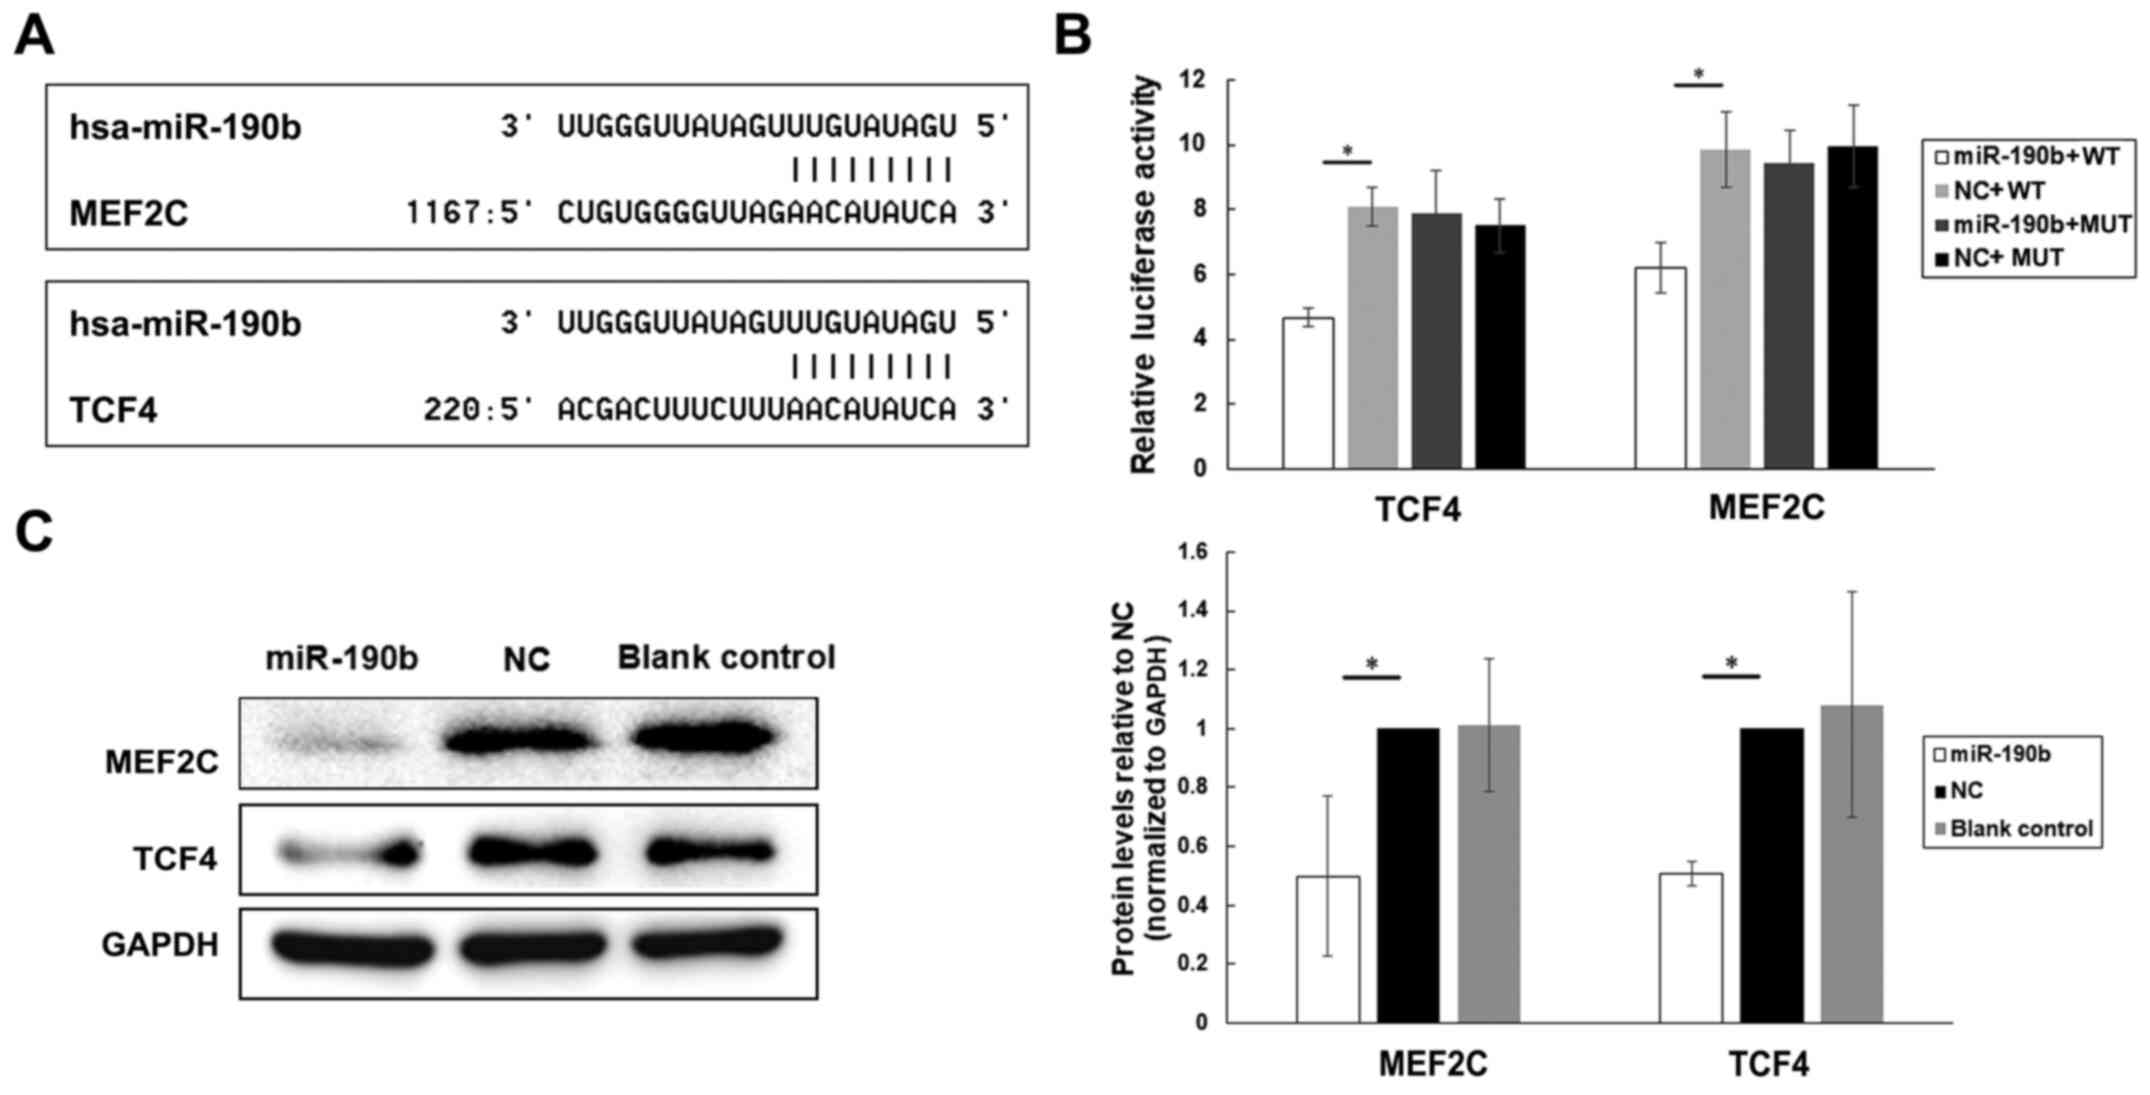 |
Figure 6.
MEF2C and TCF4 are direct targets of miR-190b in pancreatic cancer. (A) Potential target genes of miR-190b were predicted by using bioinformatic analyses. (B) Luciferase activities of MEF2C, TCF4, MEF2C-MUT and TCF4-MUT in AsPC-1 cells transfected with miR-190b mimics or NC. (C) Western blot analyses of MEF2C and TCF4 in transfected and parental AsPC-1 cells. Levels were normalized to those of GAPDH, and endogenous MEF2C and TCF4 levels were notably reduced in miR-190b-transfected AsPC-1 cells. Values are shown as mean ± SD. n=3. *P<0.05. miR, microRNA; MEF2C, myocyte enhancer factor 2C; TCF4, transcription factor 4; NC, negative control; WT, wild-type; MUT, mutated.
|
To determine whether MEF2C and TCF4 are directly targeted by miR-190b, the segments MEF2C−3′UTR (WT), TCF4−3′UTR (WT), MEF2C-MUT and TCF4-MUT were inserted into the pGL3-control vector. The results of the luciferase reporter assay demonstrated that the level of luciferase activity of the pGL3-MEF2C−3′UTR (WT) and pGL3-TCF4−3′UTR (WT) reporters was significantly lower in miR-190b-transfected AsPC-1 cells compared with those in NC-transfected AsPC-1 cells (Fig. 6B). By contrast, no significant differences were found between miR-190b-transfected and NC-transfected AsPC-1 cells in terms of the relative luciferase activity of the pGL3-MEF2C-MUT or pGL3-TCF4-MUT reporters (Fig. 6B).
Furthermore, the MEF2C and TCF4 protein levels in transfected and parental AsPC-1 cells were examined using western blotting. Lower levels of endogenous MEF2C and TCF4 expression were observed in miR-190b-transfected AsPC-1 cells compared with those in NC-transfected and parental AsPC-1 cells after normalization to the levels of the endogenous reference protein GAPDH (Fig. 6C), indicating that miR-190b may target MEF2C and TCF4 in pancreatic cancer.
MEF2C and TCF4 are highly expressed in association with reduced miR-190b expression
IHC was used to examine the expression of MEF2C and TCF4 in clinical samples (Fig. 7A and B). There was high expression of MEF2C in 48% (24/50) and of TCF4 in 46% (23/50) of PDAC samples. Furthermore, miR-190b expression was significantly lower in samples with high expression of MEF2C and TCF4 (Fig. 7C; P<0.05). In addition, miR-190b expression levels were significantly negatively correlated with MEF2C and TCF4 mRNA levels in pancreatic cancer cell lines (Fig. 7D; P<0.05).
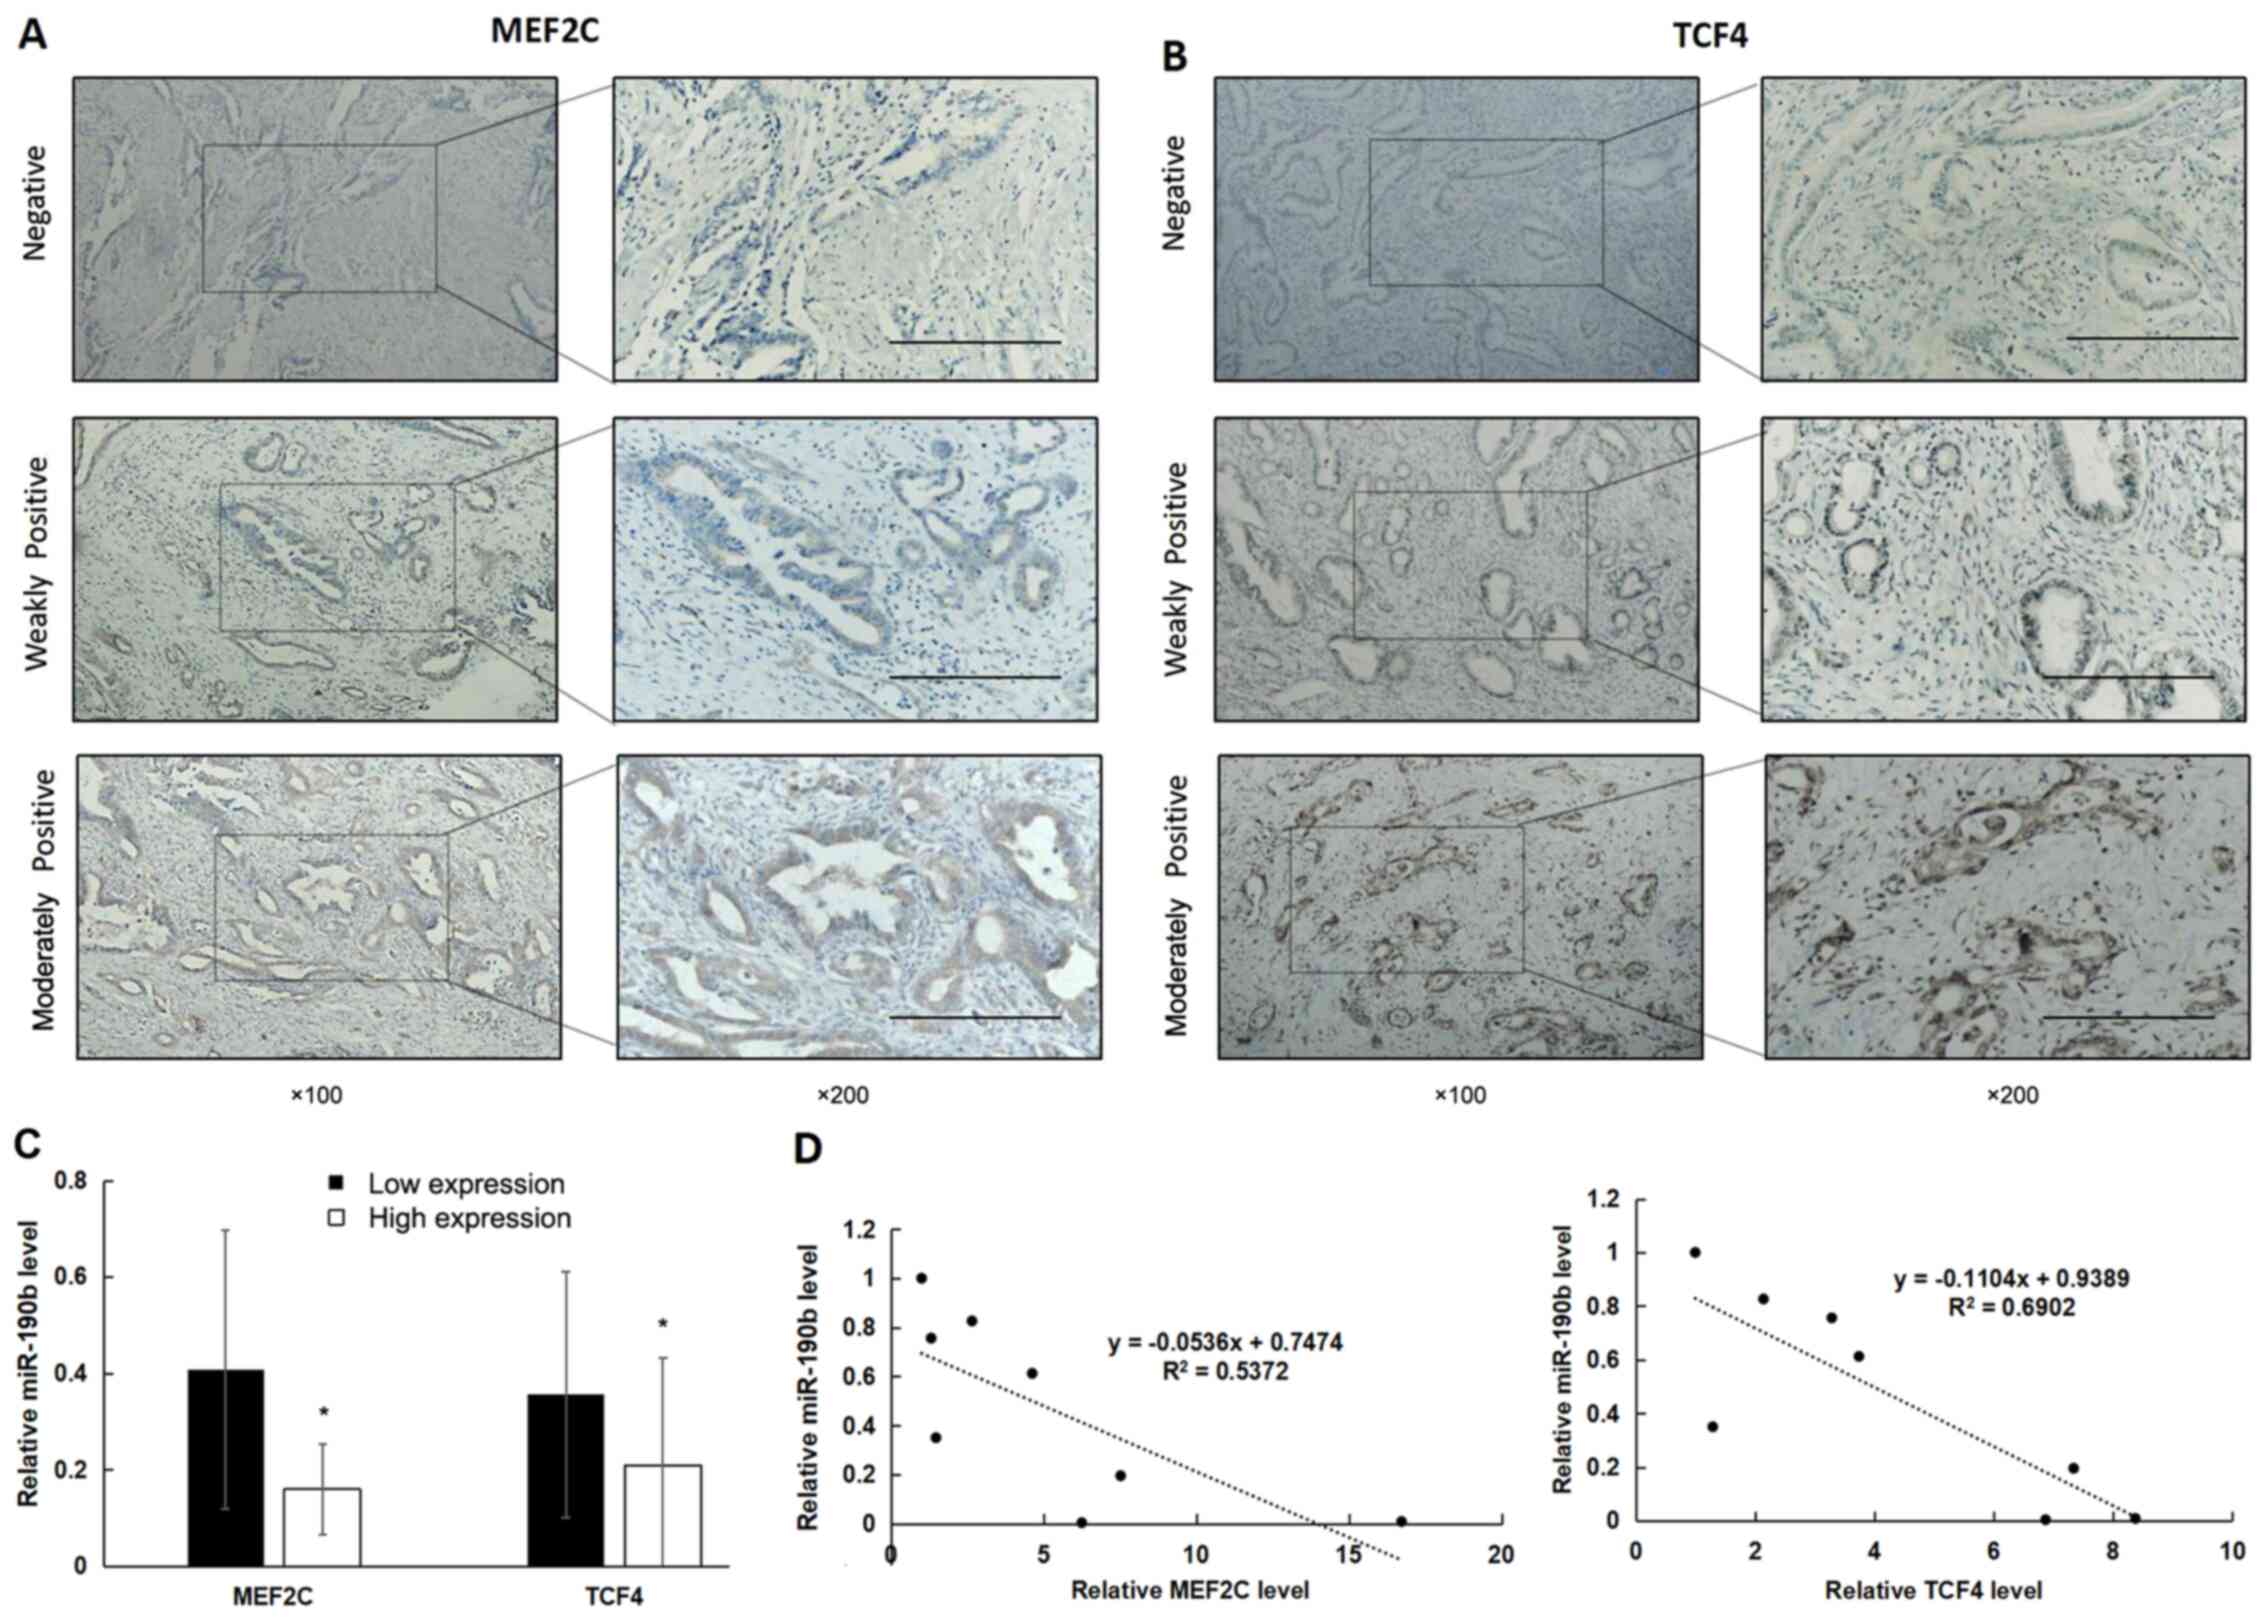 |
Figure 7.
High expression of MEF2C and TCF4 is associated with reduced miR-190b expression. (A and B) MEF2C and TCF4 expression in PDAC tissues was determined using immunohistochemistry. Positive expression is shown as brown-yellow particles distributed in the cell nucleus and cytoplasm. The cellular staining was classified using a scale of 0-2 as follows: 0, negative; 1, weakly positive; and 2, moderately positive. Scale bar, 200 µm. Magnification, ×100 (main panels) and ×200 (insets). (C) The non-parametric test demonstrated that miR-190b levels were significantly lower in samples with high expression of MEF2C and TCF4. (D) Pearson's correlation analysis demonstrated that miR-190b levels were significantly negatively correlated with MEF2C and TCF4 levels in pancreatic cell lines. Values are shown as mean ± SD. n=3. *P<0.05. miR, microRNA; MEF2C, myocyte enhancer factor 2C; TCF4, transcription factor 4; PDAC, pancreatic ductal adenocarcinoma.
|
Discussion
A body of research exists regarding non-coding RNAs (ncRNAs), such as long non-coding RNAs (lncRNAs), miRNAs and circular RNAs (circRNAs), including extensive findings on the relationships between numerous ncRNAs and the development, progression, metastasis and prognosis of pancreatic cancer (21,22). Elucidating the regulatory relationships among oncogenes, tumor suppressor genes and ncRNAs may contribute to the development of multitargeted treatment strategies. Both lncRNAs and circRNAs may act as miRNA sponges, regulating the expression of oncogenes and tumor suppressor genes by binding to miRNAs; therefore, miRNAs serve major roles in these regulatory networks (23–25).
miR-190 consists of two family members, miR-190a and miR-190b, both of which are involved in cancer. Using RT-qPCR, Zhang et al (26) demonstrated that miR-190a levels were significantly increased in pancreatic cancer tissues and cell lines. The RT-qPCR results of the present study demonstrated that miR-190b was downregulated in pancreatic cancer cell lines and PDAC tissues. However, there were no significant differences in the miR-190b levels between HPDE cells and Capan-2 and BxPC-3 cells. Capan-2 cells are derived from pancreatic head cancer with local invasion, whereas BxPC-3 cells are derived from non-metastatic pancreatic body cancer. Compared with other pancreatic cancer cell lines, these two cell lines are relatively less malignant (27). Therefore, it was hypothesized that the lower expression levels of miR-190b in these two cell lines compared with the other pancreatic cancer cell lines may be explained by the differences in the degree of malignancy. Both miR-190 family members may be implicated in pancreatic cancer and low miR-190b expression may serve as a diagnostic marker for PDAC. However, high expression of miR-190b has also been detected in other types of cancer, including hepatocellular carcinoma, bladder cancer and Wilms' tumor (14,16,17). Thus, the effects of this miRNA appear to be cancer type-specific. miR-190b has been shown to inhibit tumor cell proliferation in osteosarcoma (28). Consistent with these previous results, the present study demonstrated that miR-190b inhibited pancreatic cancer cell proliferation in vitro and in vivo. The expression levels of miR-190b were examined in all cell lines used in the present study, but only AsPC-1 and MIA PaCa-2 cells were used in the subsequent experiments. First, the expression levels of miR-190b in AsPC-1 and MIA PaCa-2 cells were lower compared with the other cell lines. Second, AsPC-1 and MIA PaCa-2 cells are derived from ascites and pancreatic cancer respectively, and they are characterized by low differentiation and high cell malignant potential. Furthermore, cytological experiments demonstrated high transfection efficiency in these two cell lines. Therefore, AsPC-1 and MIA PaCa-2 cells were used in the subsequent experiments. Using a Transwell cell invasion assay in vitro and a tumor metastasis formation assay in vivo, it was demonstrated that miR-190b suppresses pancreatic cancer cell invasion. These findings indicate that miR-190b may serve as a tumor suppressor in pancreatic cancer.
The present study investigated the molecular mechanism underlying the function of miR-190b as a tumor suppressor in pancreatic cancer by employing luciferase reporter assay and western blotting. The results revealed that MEF2C is a target of miR-190b in pancreatic cancer cells. MEF2C acts as a potential oncogene in pancreatic cancer. Zhang et al (29) found that MEF2C is a direct activator of MMP10, which is significantly associated with pancreatic cancer progression and metastasis (30,31). Furthermore, MEF2C mediates VEGF-induced angiogenesis, invasion and metastasis (32). Therefore, it was hypothesized that miR-190b may suppress PDAC metastasis by targeting MEF2C.
The Wnt/β-catenin signaling pathway plays important roles in several biological processes. It interacts with TCF/lymphoid-enhancing factor to induce the expression of downstream target genes (e.g., c-Jun, C-myc and cyclin D1), which regulate cell proliferation, migration and differentiation. The proliferation, invasion and metastasis of cancer cells may also be activated by the Wnt/β-catenin signaling pathway (33–35). Activated Wnt signaling in pancreatic cancer cells leads to their proliferation and metastasis (36,37). TCF4 is a mediator of canonical Wnt signaling and has been found to be highly expressed in PDAC cell lines (38). Inhibition of the Wnt/β-catenin/TCF4 pathway was shown to result in decreased cell proliferation, invasion and migration (39,40). In the present study, it was confirmed that TCF4 is directly targeted by miR-190b; inhibition of TCF4 by miR-190b may lead to the inhibition of the Wnt/β-catenin/TCF4 pathway. Thus, miR-190b may also suppress pancreatic cancer cell proliferation and metastasis via the Wnt/β-catenin/TCF4 pathway in PDAC. Furthermore, MEF2C and TCF4 expression was examined in 50 PDAC samples, and the results revealed that MEF2C and TCF4 expression was negatively correlated with miR-190b expression, further supporting the possible regulation of MEF2C and TCF4 by miR-190b.
In summary, RT-qPCR analysis in the present study demonstrated that miR-190b expression levels were low in human pancreatic cancer cell lines and pancreatic cancer tissues. Furthermore, high expression of miR-190b was found to be correlated with lower malignancy in PDAC. Overexpression of miR-190b significantly suppressed pancreatic cancer cell proliferation and metastasis, as determined using a Transwell cell invasion assay, CCK-8 assay and in vivo experiments. Moreover, miR-190b was shown to function as a tumor suppressor in pancreatic cancer by targeting MEF2C and TCF4. These findings underscore the potential role of miR-190b as an effective diagnostic biomarker and therapeutic target in pancreatic cancer.
Acknowledgements
Not applicable.
Funding
The present study was supported by the National Natural Science Foundation of China (grant no. 81773108) and the 345 Talent Project of Shengjing Hospital.
Availability of data and materials
The datasets used and/or analyzed during the current study are available from the corresponding author on reasonable request.
Authors' contributions
XY and YL designed the study. JZ and FZ carried out the study, including data collection and data analysis. YL, FZ and JZ performed data analysis. FZ and ZW wrote the original draft. YL edited the manuscript. YL, FZ and ZW confirm the authenticity of the raw data. All the authors have read and approved the final manuscript.
Ethics approval and consent to participate
The present study was approved by the Research Ethics Committee of Shengjing Hospital of China Medical University (Shenyang, China; approval no. 2017PS177K), and all the patients provided signed informed consent. All animal experimental protocols were in accordance with the Guide for the Care and Use of Laboratory Animals and the institutional ethical guidelines for animal experiments and were approved by the Ethics Committee Review Board of China Medical University (Shenyang, China; approval no. CMU2019224)
Patient consent for publication
Not applicable.
Competing interests
The authors declare that they have no competing interests.
Glossary
Abbreviations
Abbreviations:
|
PDAC
|
pancreatic ductal adenocarcinoma
|
|
miRNAs
|
microRNAs
|
|
RT-qPCR
|
reverse transcription-quantitative PCR
|
|
CCK-8
|
Cell Counting Kit-8
|
|
AJCC
|
American Joint Committee on Cancer
|
References
|
1
|
Wang S, Lei Y, Cai Z, Ye X, Li L, Luo X and Yu C: Girdin regulates the proliferation and apoptosis of pancreatic cancer cells via the PI3K/Akt signalling pathway. Oncol Rep. 40:599–608. 2018.PubMed/NCBI
|
|
2
|
Candido S, Abrams SL, Steelman LS, Lertpiriyapong K, Martelli AM, Cocco L, Ratti S, Follo MY, Murata RM, Rosalen PL, et al: Effects of the MDM-2 inhibitor Nutlin-3a on PDAC cells containing and lacking WT-TP53 on sensitivity to chemotherapy, signal transduction inhibitors and nutraceuticals. Adv Biol Regul. 72:22–40. 2019. View Article : Google Scholar : PubMed/NCBI
|
|
3
|
Zhou Z, Cheng Y, Jiang Y, Liu S, Zhang M, Liu J and Zhao Q: Ten hub genes associated with progression and prognosis of pancreatic carcinoma identified by co-expression analysis. Int J Biol Sci. 14:124–136. 2018. View Article : Google Scholar : PubMed/NCBI
|
|
4
|
Chernichenko N, Omelchenko T, Deborde S, Bakst RL, He S, Chen CH, Gusain L, Vakiani E, Katabi N, Hall A, et al: Cdc42 Mediates Cancer Cell Chemotaxis in Perineural Invasion. Mol Cancer Res. 18:913–925. 2020. View Article : Google Scholar : PubMed/NCBI
|
|
5
|
Flinck M, Hagelund S, Gorbatenko A, Severin M, Pedraz-Cuesta E, Novak I, Stock C and Pedersen SF: The vacuolar H+ ATPase α3 subunit negatively regulates migration and invasion of human pancreatic ductal adenocarcinoma cells. Cells. 9:4652020. View Article : Google Scholar : PubMed/NCBI
|
|
6
|
Shen J, Hong L, Yu D, Cao T, Zhou Z and He S: LncRNA XIST promotes pancreatic cancer migration, invasion and EMT by sponging miR-429 to modulate ZEB1 expression. Int J Biochem Cell Biol. 113:17–26. 2019. View Article : Google Scholar : PubMed/NCBI
|
|
7
|
Zhang HD, Jiang LH, Sun DW, Hou JC and Ji ZL: CircRNA: A novel type of biomarker for cancer. Breast Cancer. 25:1–7. 2018. View Article : Google Scholar : PubMed/NCBI
|
|
8
|
Qadir MI and Faheem A: miRNA: A diagnostic and therapeutic tool for pancreatic cancer. Crit Rev Eukaryot Gene Expr. 27:197–204. 2017. View Article : Google Scholar : PubMed/NCBI
|
|
9
|
Calin GA, Sevignani C, Dumitru CD, Hyslop T, Noch E, Yendamuri S, Shimizu M, Rattan S, Bullrich F, Negrini M, et al: Human microRNA genes are frequently located at fragile sites and genomic regions involved in cancers. Proc Natl Acad Sci USA. 101:2999–3004. 2004. View Article : Google Scholar : PubMed/NCBI
|
|
10
|
Xu Y, Zhao F, Wang Z, Song Y, Luo Y, Zhang X, Jiang L, Sun Z, Miao Z and Xu H: MicroRNA-335 acts as a metastasis suppressor in gastric cancer by targeting Bcl-w and specificity protein 1. Oncogene. 31:1398–1407. 2012. View Article : Google Scholar : PubMed/NCBI
|
|
11
|
Rupaimoole R and Slack FJ: MicroRNA therapeutics: Towards a new era for the management of cancer and other diseases. Nat Rev Drug Discov. 16:203–222. 2017. View Article : Google Scholar : PubMed/NCBI
|
|
12
|
Lin S and Gregory RI: MicroRNA biogenesis pathways in cancer. Nat Rev Cancer. 15:321–333. 2015. View Article : Google Scholar : PubMed/NCBI
|
|
13
|
Esquela-Kerscher A and Slack FJ: Oncomirs - microRNAs with a role in cancer. Nat Rev Cancer. 6:259–269. 2006. View Article : Google Scholar : PubMed/NCBI
|
|
14
|
Hung TM, Ho CM, Liu YC, Lee JL, Liao YR, Wu YM, Ho MC, Chen CH, Lai HS and Lee PH: Up-regulation of microRNA-190b plays a role for decreased IGF-1 that induces insulin resistance in human hepatocellular carcinoma. PLoS One. 9:e894462014. View Article : Google Scholar : PubMed/NCBI
|
|
15
|
Wang C and Qiao C: MicroRNA-190b confers radio-sensitivity through negative regulation of Bcl-2 in gastric cancer cells. Biotechnol Lett. 39:485–490. 2017. View Article : Google Scholar : PubMed/NCBI
|
|
16
|
Chen Z, Yang L, Chen L, Li J, Zhang F, Xing Y and Zhao J: miR-190b promotes tumor growth and metastasis via suppressing NLRC3 in bladder carcinoma. FASEB J. 34:4072–4084. 2020. View Article : Google Scholar : PubMed/NCBI
|
|
17
|
An NN, Shawn J, Peng JP, Wu MD and Huang LG: Up-regulation of miR-190b promoted growth, invasion, migration and inhibited apoptosis of Wilms' tumor cells by repressing the PTEN expression. Eur Rev Med Pharmacol Sci. 22:961–969. 2018.PubMed/NCBI
|
|
18
|
Livak KJ and Schmittgen TD: Analysis of relative gene expression data using real-time quantitative PCR and the 2(-Delta Delta C(T)) method. Methods. 25:402–408. 2001. View Article : Google Scholar : PubMed/NCBI
|
|
19
|
Song Y, Tang MY, Chen W, Wang Z and Wang SL: High JAK2 protein expression predicts a poor prognosis in patients with resectable pancreatic ductal adenocarcinoma. Dis Markers. Sep 21–2020.(Epub ahead of print). doi: 10.1155/2020/7656031. View Article : Google Scholar
|
|
20
|
Kulkarni NM, Soloff EV, Tolat PP, Sangster GP, Fleming JB, Brook OR, Wang ZJ, Hecht EM, Zins M, Bhosale PR, et al: White paper on pancreatic ductal adenocarcinoma from society of abdominal radiology's disease-focused panel for pancreatic ductal adenocarcinoma: Part I, AJCC staging system, NCCN guidelines, and borderline resectable disease. Abdom Radiol (NY). 45:716–728. 2020. View Article : Google Scholar : PubMed/NCBI
|
|
21
|
Müller S, Raulefs S, Bruns P, Afonso-Grunz F, Plötner A, Thermann R, Jäger C, Schlitter AM, Kong B, Regel I, et al: Next-generation sequencing reveals novel differentially regulated mRNAs, lncRNAs, miRNAs, sdRNAs and a piRNA in pancreatic cancer. Mol Cancer. 14:942015. View Article : Google Scholar : PubMed/NCBI
|
|
22
|
Xu Z, Shen J, Hua S, Wan D, Chen Q, Han Y, Ren R, Liu F, Du Z, Guo X, et al: High-throughput sequencing of circRNAs reveals novel insights into mechanisms of nigericin in pancreatic cancer. BMC Genomics. 20:7162019. View Article : Google Scholar : PubMed/NCBI
|
|
23
|
Tang XJ, Wang W and Hann SS: Interactions among lncRNAs, miRNAs and mRNA in colorectal cancer. Biochimie. 163:58–72. 2019. View Article : Google Scholar : PubMed/NCBI
|
|
24
|
He JH, Han ZP, Luo JG, Jiang JW, Zhou JB, Chen WM, Lv YB, He ML, Zheng L, Li YG, et al: Hsa_Circ_0007843 Acts as a mIR-518c-5p sponge to regulate the migration and invasion of colon cancer SW480 cells. Front Genet. 11:92020. View Article : Google Scholar : PubMed/NCBI
|
|
25
|
Kang Y, Guo S, Sun Q, Zhang T, Liu J and He D: Differential circular RNA expression profiling during osteogenic differentiation in human adipose-derived stem cells. Epigenomics. 12:289–302. 2020. View Article : Google Scholar : PubMed/NCBI
|
|
26
|
Zhang Y, Li M, Wang H, Fisher WE, Lin PH, Yao Q and Chen C: Profiling of 95 microRNAs in pancreatic cancer cell lines and surgical specimens by real-time PCR analysis. World J Surg. 33:698–709. 2009. View Article : Google Scholar : PubMed/NCBI
|
|
27
|
Deer EL, González-Hernández J, Coursen JD, Shea JE, Ngatia J, Scaife CL, Firpo MA and Mulvihill SJ: Phenotype and genotype of pancreatic cancer cell lines. Pancreas. 39:425–435. 2010. View Article : Google Scholar : PubMed/NCBI
|
|
28
|
Kang M, Xia P, Hou T, Qi Z, Liao S and Yang X: MicroRNA-190b inhibits tumor cell proliferation and induces apoptosis by regulating Bcl-2 in U2OS osteosarcoma cells. Pharmazie. 72:279–282. 2017.PubMed/NCBI
|
|
29
|
Zhang JJ, Zhu Y, Xie KL, Peng YP, Tao JQ, Tang J, Li Z, Xu ZK, Dai CC, Qian ZY, et al: Yin Yang-1 suppresses invasion and metastasis of pancreatic ductal adenocarcinoma by downregulating MMP10 in a MUC4/ErbB2/p38/MEF2C-dependent mechanism. Mol Cancer. 13:1302014. View Article : Google Scholar : PubMed/NCBI
|
|
30
|
Rath N, Morton JP, Julian L, Helbig L, Kadir S, McGhee EJ, Anderson KI, Kalna G, Mullin M, Pinho AV, et al: ROCK signaling promotes collagen remodeling to facilitate invasive pancreatic ductal adenocarcinoma tumor cell growth. EMBO Mol Med. 9:198–218. 2017. View Article : Google Scholar : PubMed/NCBI
|
|
31
|
Shi WD, Meng ZQ, Chen Z, Lin JH, Zhou ZH and Liu LM: Identification of liver metastasis-related genes in a novel human pancreatic carcinoma cell model by microarray analysis. Cancer Lett. 283:84–91. 2009. View Article : Google Scholar : PubMed/NCBI
|
|
32
|
Bai XL, Zhang Q, Ye LY, Liang F, Sun X, Chen Y, Hu QD, Fu QH, Su W, Chen Z, et al: Myocyte enhancer factor 2C regulation of hepatocellular carcinoma via vascular endothelial growth factor and Wnt/β-catenin signaling. Oncogene. 34:4089–4097. 2015. View Article : Google Scholar : PubMed/NCBI
|
|
33
|
King TD, Suto MJ and Li Y: The Wnt/β-catenin signaling pathway: A potential therapeutic target in the treatment of triple negative breast cancer. J Cell Biochem. 113:13–18. 2012. View Article : Google Scholar : PubMed/NCBI
|
|
34
|
He YM, Xiao YS, Wei L, Zhang JQ and Peng CH: CUL4B promotes metastasis and proliferation in pancreatic cancer cells by inducing epithelial-mesenchymal transition via the Wnt/β-catenin signaling pathway. J Cell Biochem. 119:5308–5323. 2018. View Article : Google Scholar : PubMed/NCBI
|
|
35
|
Lei Y, Chen L, Zhang G, Shan A, Ye C, Liang B, Sun J, Liao X, Zhu C, Chen Y, et al: MicroRNAs target the Wnt/β-catenin signaling pathway to regulate epithelial-mesenchymal transition in cancer (Review). Oncol Rep. 44:1299–1313. 2020.PubMed/NCBI
|
|
36
|
Wall I and Schmidt-Wolf IG: Effect of Wnt inhibitors in pancreatic cancer. Anticancer Res. 34:5375–5380. 2014.PubMed/NCBI
|
|
37
|
Cui Z, Liu G and Kong D: miRNA-27a promotes the proliferation and inhibits apoptosis of human pancreatic cancer cells by Wnt/β-catenin pathway. Oncol Rep. 39:755–763. 2018.PubMed/NCBI
|
|
38
|
Li J, Yang R, Dong Y, Chen M, Wang Y and Wang G: Knockdown of FOXO3a induces epithelial-mesenchymal transition and promotes metastasis of pancreatic ductal adenocarcinoma by activation of the β-catenin/TCF4 pathway through SPRY2. J Exp Clin Cancer Res. 38:382019. View Article : Google Scholar : PubMed/NCBI
|
|
39
|
Sano M, Driscoll DR, DeJesus-Monge WE, Quattrochi B, Appleman VA, Ou J, Zhu LJ, Yoshida N, Yamazaki S, Takayama T, et al: Activation of WNT/β-catenin signaling enhances pancreatic cancer development and the malignant potential via up-regulation of Cyr61. Neoplasia. 18:785–794. 2016. View Article : Google Scholar : PubMed/NCBI
|
|
40
|
Wu CW, Yu J and Sung JJ: Peroxisome proliferator-activated receptor delta and gastric cancer (Review). Oncol Rep. 22:451–457. 2009.PubMed/NCBI
|


