Introduction
Colorectal cancer (CRC) is estimated to be the third
most common cancer and the second common cause of cancer-related
mortality worldwide in 2020, accounting for ~900,000 deaths
annually (1). Therapeutic
strategies for metastatic colorectal cancer (mCRC) have improved
over the past number of decades, which resulted in prolonged
patient survival for ≤3 years (2).
However, an urgent demand exists for in the treatment of patients
who have progressed even after treatment with cytotoxic
chemotherapy and targeted agents (3). Although anti-EGFR antibodies, such as
cetuximab or panitumumab, have been proven to be effective against
RAS oncogene wild-type mCRC, intrinsic and acquired
resistance has provided a major obstacle during this particular
course of treatment (3). In this
regard, efforts have been made to elucidate the mechanism
underlying the acquisition of resistance to anti-EGFR therapy.
Several signaling pathways, including RAS/RAF/MAPK, PI3K/PTEN/AKT
and Janus kinase (JAK)/STAT pathways, have been revealed to be
potential therapeutic targets for colorectal cancer (4). However, therapeutic approaches that
were proposed for overcoming resistance to anti-EGFR therapy thus
far have rarely been able to confer clinical benefits (5,6).
Therefore, this necessitates further investigations on the
mechanism of anti-EGFR therapy resistance for the development of
novel therapeutic strategies.
Neurofibromin 1 (NF1) is a protein that is 2,818
amino acids long and is a negative regulator of RAS signaling by
accelerating guanosine triphosphate (GTP) hydrolysis by the RAS
protein (7). In addition, NF1 is
among the potential targets that have been previously implicated in
mediating anti-EGFR resistance, specifically in lung cancer and CRC
(8,9). Profiles on somatic NF1
aberrations in solid tumors, including lung cancer, breast cancer
and melanoma, have been previously established by various cancer
genome sequencing projects (10–12),
which enabled in-depth studies into the therapeutic implications of
those aberrations (13). A number
of translational studies have previously shown that gene mutations
in NF1 or the levels of NF1 expression can influence the
therapeutic efficacy of anti-cancer treatments, including BRAF
inhibitors for melanoma, anti-EGFR treatments for lung cancer,
tamoxifen for breast cancer and retinoic acids for neuroblastoma
(14–16). However, little is known about the
effects of differential expression NF1 levels on the therapeutic
outcome in the context of anti-EGFR therapy for CRC.
In the present study, the potential association
between NF1 expression and response to anti-EGFR treatment in CRC
cell lines was investigated. In addition, the possible effects of
manipulating NF1 expression on sensitivity to anti-EGFR treatment
were explored. Subsequently, NF1 expression levels in tumor samples
from patients who were treated with anti-EGFR therapy were
measured, following which the incidence of NF1 mutations in
the patient database (Genomic Laboratory Information System of Asan
Medical Center, Seoul, South Korea) was explored after genomic
profiling.
Materials and methods
Colorectal cancer cell lines
In total, four CRC cell lines, NCI-H508, Caco-2,
KM12C and SW480, were obtained from Korean Cell Line Bank (Korean
Cell Line Research Foundation). According to a previous study
(17), NCI-H508, Caco-2 and KM12C
are of the wild-type KRAS/BRAFV600
genotype, whilst KM12C originated from a microsatellite-high tumor
harboring NF1 mutations (T676fs, F945L, L1361R). SW480 is a
KRAS G12V mutant cell line. The NCI-H508 and SW480 cells
were cultured in RPMI-1640 (cat. no. SH30027.01; Hyclone; Cytiva)
supplemented with 10% FBS (Gibco; Thermo Fisher Scientific, Inc.)
and 100 U/ml penicillin/streptomycin (Hyclone; Cytiva). The Caco-2
and KM12C cells were cultured in minimum essential medium (MEM;
cat. no. LM007-07; Welgene, Inc.) supplemented with 10% FBS and 100
U/ml penicillin/streptomycin. All cells were maintained at 37°C
under 5% CO2 in a humidified atmosphere and passaged for
a maximum of 6 months. For cell lines used in the present study,
the short tandem repeat (STR) was verified by the Korean Cell Line
Bank; Korean Cell Line Research Foundation. All cell cultures were
checked using an EZ-PCR mycoplasma detection kit (cat. no.
SKU:20-700-20; Biological Industries), and all of them were free
from mycoplasma contamination.
Western blotting
Cells were trypsinized, washed with ice-cold PBS and
lysed with the RIPA lysis buffer [50 mM HEPES (pH 7.4), 150 mM
NaCl, 1 mM EDTA, 2.5 mM EGTA, 1 mM dithiothreitol and 1% Triton
X-100] containing a protease and phosphatase inhibitor cocktail
(Sigma-Aldrich; Merck KGaA). After lysis, the cell debris were
removed by centrifugation at 20,000 × g for 20 min at 4°°C. Protein
concentration was determined using Bradford assay. The cellular
protein samples (30 µg) were separated by 8–15% SDS-PAGE and
transferred onto nitrocellulose membranes. The membranes were
blocked with 5% non-fat dry milk in TBST (20 mM Tris-HCl pH 7.4,
150 mM NaCl and 0.1% Tween-20) for 1 h at room temperature and
probed with anti-NF1 (1:1,000; cat. no. 14623; Cell Signaling
Technology, Inc.), anti-MEK1/2 (1:1,000; cat. no. 9122; Cell
Signaling Technology, Inc.), anti-phosphorylated (p-)-MEK1/2
(ser217/221; 1:1,000, cat. no. 9121; Cell Signaling Technology,
Inc.), anti-ERK1/2 (1:1,000; cat. no. 9102; Cell Signaling
Technology, Inc.), anti-p-ERK1/2 (Thr202/tyr204; 1:1,000; cat. no.
9101; Cell Signaling Technology, Inc.), anti-caspase-3 (1:1,000;
cat. no. 9662; Cell Signaling Technology, Inc.), anti-cleaved
(c-)-caspase-3 (Asp175; 1:1,000; cat. no. 9661; Cell Signaling
Technology, Inc.), anti-PARP (1:1,000; cat. no. ab32138; Abcam),
anti-c-PARP (1:1,000; cat. no. 9532S; Cell Signaling Technology,
Inc.) or anti-actin (1:20,000; cat. no. A3854; Sigma-Aldrich; Merck
KGaA) primary antibodies for overnight at 4°C. After washing with
TBST, the membranes were incubated with HRP-conjugated goat
anti-mouse (1:10,000; cat. no. 31430; Thermo Fisher Scientific,
Inc.) or goat-rabbit (1:10,000; cat. no. 31460; Thermo Fisher
Scientific, Inc.) secondary antibodies for 1 h at room temperature.
The proteins were developed using the chemiluminescent (ECL)
substrate (SuperSignal™West Femto Maximum Sensitivity Substrate;
cat. no. 34095; Thermo Fisher Scientific, Inc.). A detection system
(LuminoGraph II; cat. no. WSE-6200; ATTO Corporation) with a
controlling software (ImageSaver 6; version 2.7.2; ATTO
Corporation) was used to visualize the bands. The obtained band
images were quantified by densitometry analysis using the ImageJ
software (v1.53a; National Institutes of Health).
Reverse transcription-quantitative PCR
(RT-qPCR)
Total RNA was collected from cells using the QIAzol
lysis reagent (cat. no. 79306; Qiagen GmbH) and the RNeasy mini kit
(cat. no. 74106, Qiagen GmbH) using a modified protocol. Briefly,
the CRC cells (2.0×10⁶ cells) were treated with 0.5 ml
QIAzol lysis buffer and were collected, mixed with 0.1 ml
chloroform and centrifuged at 16,000 × g for 15 min at 4°C. for 10
min. The clear supernatants were separately collected, and the
nucleic acids were precipitated using 70% ethanol. The precipitated
total RNAs were bound on the silica column from the RNeasy mini kit
components, washed twice with the RPE buffer (provided in the kit)
and eluted with RNase-free distilled water (provided in the kit).
The concentration and quality of the extracted RNA were measured
using Nanodrop 2000 (Thermo Fisher Scientific, Inc.). Samples with
an optical density 260/280 value >1.8 were used for further
experiments. The cDNA was generated from the mRNA using the
ReverTra Ace™ qPCR RT Master Mix (Toyobo Life Science) by
incubating at 37°C for 15 min, heating at 50°C for 5 min and
cooling to 4°C. The transcripts were quantified by qPCR using the
CFX Connect Real-Time PCR Detection System (Bio-Rad Laboratories,
Inc.) with 5X HOT FIREPol® EvaGreen® qPCR
Supermix (Solis BioDyne). The samples were first denatured at 95°C
for 15 min, followed by 40 cycles of denaturation at 95°C for 15
sec, annealing at 55–60°C for 15 sec and elongation at 72°C for 20
sec. The primer sequences were as follows: GAPDH forward,
5′-GAGTCAACGGATTTGGTCGT-3′ and reverse, 5′-TTGATTTTGGAGGGATCTCG-3′
and NF1 forward, 5′-GGATCTCCAGACAAGAGCTACA-3′ and reverse,
5′-CTCTCAAACCGATCAGCCAATAC-3′. The data were expressed as the fold
change in the treatment groups relative to the control and
normalized to GAPDH levels.
Small interfering RNA (siRNA) and
plasmid construct transfection
siRNAs specific for either NF1 (NF1-siRNA) or a
scrambled sequence (scrambled-siRNA) were prepared and designed by
Bioneer Corporation. The siRNA sequences were as follows:
NF1-siRNA1 (targeting the NF1 exon 11 region) sense,
5′-CACCUUCUACAUUUCACUA-3′ and antisense, 5′-UAGUGAAAUGUAGAAGGUG-3′;
NF1-siRNA2 (targeting the NF1 exon 9 region) sense,
5′-CUGUGUAAAGCAAGUACUU-3′ and antisense, 5′-AAGUACUUGCUUUACACAG-3′
and scrambled-siRNA sense, 5′-UCCCAGAUAGAGACUUCAATT-3′ and
anti-sense, 5′-UUGAAGUCUCUAUCUGGGATT-3′.
The negative control plasmid (pEYFP-C1; Empty) and
the NF1-GTPase-activating protein related domain (GRD)-expressing
plasmids (NF1-GRD) in pEYFP-C1 were kindly provided by Professor
Seon-Yong Jeong, Ajou University School of Medicine (Suwon, South
Korea) (18). Briefly, the NF1-GRD
expressing vectors were generated by the subcloning cDNAs of
NF1-GRD into the pEYFP-C1 vector (Clontech Laboratories, Inc.)
using two restriction enzymes (BglII and HindIII).
The cDNAs of the GRD region of NF1 were generated by reverse
transcription-PCR from total RNAs of IMR-90 human fibroblasts
(purchased from ATCC; cultured in DMEM with 10% FBS at 37°C in 5%
CO2) using the following primers: Forward
5′-ATAGATCTACCATGGATCTCCAGACAAGAGCTACATTTATG-3′ and reverse,
5′-GTAAGCTTAACCAGTGTGTATCTGCCACAGGT-3′ (18). These primer sequences correspond to
the region of human (GRCh38) chr17:31,233,018-31,261,811 (NF1
accession no. NM_001042492).
The cells were transfected with siRNAs (200 nM) or
vectors (5 µg) using Lipofectamine® 3000 reagent
(Invitrogen; Thermo Fisher Scientific, Inc.) according to the
manufacturer's protocol. The efficiency of siRNA-based NF1
knockdown and plasmid transfection was assessed by RT-qPCR and
western blotting. To measure the effect of siRNAs or vectors on
cell viability, the relative number of cells was compared between
control and transfected samples. The cells were maintained for 72 h
after siRNA or vector transfection before images of the cells were
acquired at ×20 magnification using an EVOS-FL automated
fluorescence microscope (Thermo Fisher Scientific, Inc.) under
bright-field mode. The relative number of transfected cells was
counted from the image using the ImageJ software (v1.53a; National
Institutes of Health, USA). The clustering cells were counted
according to particle analysis protocol (https://imagej.net).
For western blotting and nuclear staining after
siRNA or plasmid transfection, cells were seeded into 12-well
plates at 5×10⁵ cells/well prior to transfection.
Cetuximab (100 µg/ml) was added 24 h after transfection and cells
were collected for western blotting or nuclear staining 48 h after
cetuximab treatment at 37°C under 5% CO2 in a humidified
atmosphere.
Cell growth assay
For cell growth assays, cells were seeded into
24-well plates at 5,000 cells/well and cultured in the complete
medium supplemented with 0, 50, 100 and 200 µg/ml cetuximab (Merck
KGaA). The full culture medium was not changed throughout the
course of the experiment. The cells were fixed in 10% neutral
buffered formalin for 20 min at room temperature and stained with
0.1% crystal violet for 20 min at room temperature. The dye was
extracted with 10% acetic acid, and relative proliferation levels
were determined according to the optical density at 595 nm using a
Sunrise microplate reader (Tecan Group, Ltd.).
Colony formation assay
For the colony formation assays, cells were seeded
at 500 cells/well into 6-well plates and then cultured in the
complete medium with 0, 50, 100 and 200 µg/ml cetuximab at 37°C.
The full culture medium was not changed throughout the course of
the experiment. After 10 days, the cells were fixed in 80% methanol
for 20 min at room temperature and stained with a 0.2% crystal
violet for 20 min at room temperature. The number of colonies
(diameters >200 µm) was counted using the Oxford Optronix
GelCount™ system (v1.1.2.0; Oxford Optronix).
Nuclear staining
DAPI staining assay was conducted to detect the
possible occurrence of nucleus condensation in the siRNA- and
plasmid-transfected cells. The cells were fixed with freshly
prepared ice-cold 10% neutral buffered formalin for 10 min at 4°C
and then exposed to 0.1% Triton X-100 in PBS for 10 min for
permeabilization. They were subsequently stained with Fluoroshield
Mounting Medium with DAPI (cat. no. ab104139; Abcam) for 1 min at
room temperature. Image acquisition at ×20 magnification was
performed using the EVOS FL Auto-fluorescence microscope (Thermo
Fisher Scientific, Inc.). The relative number of cells was counted
using ImageJ software (v1.53a; National Institutes of Health)
(19).
Tumor samples
To estimate the NF1 expression levels in the
cetuximab-treated samples, RNA sequencing data from the tumor
samples of patients with mCRC who received cetuximab were used.
Patients were eligible for this study if the patient participated
in the mCRC biomarker discovery program of the Department of
Medical Oncology of Asan Medical Center, which enrolled those with
histologically proven CRC who were supposed to undergo or were
undergoing chemotherapy with adjuvants or palliative treatment.
Among these, the selection criteria for the present study were as
follows: i) Patients who received cetuximab as their treatment for
mCRC before March 2018; ii) those who were followed up ≥6 months
from the first dose of cetuximab; iii) those who had tumor tissues
adequately archived, iv) patients with samples which were confirmed
as the RAS and BRAFV600 wild-type by
either Sanger sequencing or next-generation sequencing (NGS); v)
patients with samples which were also obtained before or after ≥
one dose of cetuximab administration; and vi) patients with
available clinical data regarding responses to cetuximab-based
treatment (Tx). Among the 2,589 participants who enrolled into the
biomarker discovery program from September 2011 to March 2018, 92
patients with 113 samples met the criteria aforementioned (Table I). The samples were categorized
into the following four groups: i) Pre-treatment samples from
patients who achieved a complete response (CR)/partial response
(PR) using Response Evaluation Criteria in Solid Tumor (RECIST)
v.1.1 (20) as their best response
(pre-Tx CR/PR; n=60); ii) pre-treatment samples from patients with
stable disease (SD)/progressive disease (PD; pre-Tx SD/PD; n=16);
iii) post-treatment samples with non-progressive disease (post-Tx
nPD; n=16) if the sample was obtained before the clinical
determination of disease progression; and iv) post-progression
samples (post-Tx PD; n=21) if excision or biopsy had been conducted
after progression was adjudged according to RECIST v1.1.
 | Table I.Characteristics of the colorectal
tumor samples collected from the cetuximab-treated patients with
the RAS and BRAFV600 wild-type who underwent
RNA-sequencing testing. |
Table I.
Characteristics of the colorectal
tumor samples collected from the cetuximab-treated patients with
the RAS and BRAFV600 wild-type who underwent
RNA-sequencing testing.
| Category | Valuesa |
|---|
| Age, years | 58
(22–80)b |
| Sex |
|
|
Male | 57 (62%) |
|
Female | 35 (38%) |
| Lines of
treatment |
|
| 1 | 75 (82%) |
| ≥2 | 17 (18%) |
| Regimen |
|
|
Cetuximab | 5 (5%) |
|
Cetuximab + irinotecan | 12 (13%) |
|
Cetuximab + FOLFIRI | 66 (72%) |
|
Cetuximab + FOLFOX | 9 (10%) |
| Primary site |
|
|
Right | 19 (21%) |
|
Left | 73 (79%) |
| Test for RAS and
BRAFV600 mutations status |
|
| Sanger
sequencing | 15 (16%) |
|
Next-generation
sequencing | 77 (84%) |
| Initial stage |
|
| Stage
I–III | 10 (11%) |
| Stage
IV | 82 (89%) |
| MSI status |
|
|
MSI-H | 1 (1%) |
|
MSI-L | 3 (3%) |
| MSS or
pMMR | 86 (93%) |
| Not
tested | 2 (2%) |
| Progression-free
survival |
|
| First
line, months | 13.48
(12.66-14.66)c |
| ≥Second line or
more, months | 6.46
(1.57-9.41)c |
| Clinical status of
samples (n=111) |
|
|
Pre-treatment, CR/PR | 59 (53%) |
|
Pre-treatment, SD/PD | 16 (14%) |
|
Post-treatment, non-PD | 16 (14%) |
|
Post-treatment, PD | 20 (18%) |
| Tumor sample origin
(n=111) |
|
| Primary
tumor | 84 (76%) |
|
Metastasis | 27 (24%) |
| Neurofibromin 1
mRNA expression, |
|
| FPKM |
51.14±12.71d |
To assess the frequency of NF1 mutations, the
Genomic Laboratory Information System of Asan Medical Center
genomic database containing data of patients who underwent NGS
testing for diagnostic purposes was screened. The clinical NGS data
of 1,449 patients with CRC who underwent testing diagnostic
purposes from March 2017 to May 2020 were screened. No specific
exclusion criteria was applied for this screening process.
Immunohistochemical staining (IHC) for NF1 was conducted for the
selected samples identified from the database.
The biomarker discovery program, including RNA
sequencing and IHC staining, was approved (approval no. 2011-0511)
by the Institutional Review Board of Asan Medical Center and
conducted in accordance with the tenets of the Declaration of
Helsinki and Good Clinical Practice.
RNA sequencing and bioinformatic
analyses
Formalin-fixed (10%, for 12–18 h at a room
temperature) and paraffin-embedded tissues were used for
transcriptomic analysis. Macro-dissection was performed from a
tumor portion of an unstained 6-µm-thick slide and RNA was
extracted using the RNeasy FFPE kit (cat. no. 7350; Qiagen GmbH)
according to the manufacturer's protocol. A cDNA library was
constructed using the TruSeq RNA Access Library Prep Kit (cat. no.
RS-301-2002; Illumina, Inc.). Briefly, mRNA was purified from total
RNA using poly A selection and then cleaved and converted into
double-stranded cDNA fragments using random primers. The library
was prepared by the random fragmentation of cDNA samples followed
by 5′ and 3′ adaptor ligation. Adaptor-ligated fragments were
PCR-amplified and gel-purified before their quality was assessed
with a 2100 Bioanalyzer (Agilent Technologies, Inc.) using an
Agilent DNA 1000 Kit (cat. no. G2938-90015; Agilent Technologies,
Inc.) (21). Samples that passed
the library quality assurance process (concentration >5 nM and
library size 200–400 bp) were proceeded to sequencing. A total of
113 samples were analyzed, where two samples (one pre-Tx CR/PR and
one post-Tx PD) failed to meet the quality assurance criteria
(Table SI). Paired-end sequencing
with 100 bp per read was conducted using an HiSeq 2500 platform
(cat. no. SY-401-2501; Illumina, Inc.). HiSeq PE Rapid Cluster kit
v2 (cat. no. PE-402-4002; Illumina, Inc.) and HiSeq Rapid SBS kit
v2 (cat. no. FC-402-4021; Illumina, Inc.) were used for the
sequencing, with each well loaded with 5 nM of DNA. After
sequencing was completed, the raw data were processed using an
RNA-seq analysis pipeline. All FASTQ format reads were assessed for
quality control using the FASTQC software (v0.11.8) (22). The Illumina sequencing
platform-specific adaptors and poor quality read bases were trimmed
using Trim Galore (v0.4.5) (23).
The trimmed reads were mapped onto the reference genome (human
reference genome build version GRCh38/hg38) using STAR aligner
(v2.6.0) (24), such that output
SAM/BAM files were obtained. The mean of the total reads was
123,416,623 and the GC content per sequence was 47.69%. Each sample
had an average of 35,361,303 reads. Gene expression was quantified
using RSEM (v1.2.23) (25) and
normalized through the DESeq2 BiocManager package (v1.20.0)
(26), which derived fragments per
kilobase of transcript per Million (FPKM) values for between-sample
comparisons.
Differential gene expression analysis (DGE) was
performed by using the same DESeq2 package. In DGE analysis,
log2fold change of the normalized abundance between
groups was calculated using the DESeq2 package. Log2
transformation is commonly used to analyze expressions based on the
proportional changes rather than additive changes and to obtain
normality of the expression distribution. Using the differential
expression (DE) results, which ranked the list of genes and
log2 fold-change, gene set enrichment analysis (GSEA)
was conducted using the clusterProfiler package (27). In the result of the GSEA, the
pathway ID, enrichment score, P-values are listed. The P-values are
calculated by testing how frequently the enrichment score in the
actual ranking is bigger compared with that in the random
permutation. A significant P-value implies that the expressions in
the pathway are significantly enriched. Only pathways related to
the NF1 (has:4763) and EGFR genes (hsa:1956) were
focused upon in the present study. The KEGG pathways related to
these genes were retrieved using the following approach: WebDBGET
(https://www.genome.jp/dbget-bin/www_bget?-h), an
integrated database retrieval system, describes how to retrieve
related pathways to a gene by using a specific web URL format along
with the gene accession identifier (28). Protocols on this website were
followed to search for NF1-related pathways (https://www.genome.jp/dbget-bin/get_linkdb?-t+pathway+hsa:4763)
and EGFR-related pathways (https://www.genome.jp/dbget-bin/get_linkdb?-t+pathway+hsa:1956).
In each retrieval site, pathways contained in the ‘Pathway’ section
were used. In the GSEA results, pathways that did not overlap with
these KEGG pathways were excluded, where three NF1-related pathways
(hsa01521, hsa04014 and hsa04010) and two EGFR-related pathways
(hsa05235, hsa01521) were included.
Immunohistochemistry
IHC for NF1 was performed using the IHC-plus™
polyclonal rabbit anti-human NF1 antibody (1:500; cat. no.
LS-B14758; LifeSpan BioSciences, Inc.). All staining procedures
were performed using a BenchMark XT automatic immunostaining device
(Ventana Medical Systems) according to the manufacturer's protocol.
Briefly, antigen retrieval was done by boiling sections using Cell
Conditioning 1 buffer (cat. no. 950-124; Ventana Medical Systems,
Inc.) for 32 min at 95°C. The sections were incubated with the
anti-NF1 antibody for 16 min at 37°C in the automatic
immunostainer. Signals were visualized using the Ventana OptiView
DAB IHC Detection kit (cat. no. 06396500001; Ventana Medical
Systems, Inc.): OptiView HQ Linker for 8 min at 37°C, Optiview HRP
Multimer for 8 min at 37°C, OptiView H2O2/DAB for 8 min at 37°C and
OptiView Copper for 4 min at 37°C. All specimens were reviewed and
scored semi-quantitatively by a pathologist (JK) who gave a score
ranging from 0 to 3. Since the NF1 staining was mostly diffuse, the
four-tier scoring system was based on the average staining
intensity (1, weak; 2, moderate; 3, strong). In addition, 0 was
given only when NF1 expression was negligible in all tumor cells.
NF1 was regarded to be lost if cytoplasmic staining was absent in
tumor cells in the presence of intact expression in the internal
non-neoplastic control cells.
NGS test
Targeted sequencing with Oncopanel AMC version 3 was
conducted as described in a previous study (29). Only 88 of the 113 samples could be
analzyed with RNA sequencing due to insufficient tumor tissues.
Briefly, genomic DNA was extracted from formalin-fixed,
paraffin-embedded (FFPE) tissue specimens using a NEXprep™ FFPE
Tissue kit (cat. no. NexK-F02T5/NexK-F02TH; Genes Laboratories,
Inc.). The quantity and quality of the extracted DNA were examined
using a Qubit dsDNA HS Assay kit (Thermo Fisher Scientific, Inc.).
Targeted NGS analysis was done using the MiSeqDx or Nextseq 500Dx
platforms (Illumina, Inc.) depending on the required sample
throughput with Oncopanel AMC version 3, which was designed by Asan
Medical Center through SureDesign (https://earray.chem.agilent.com/suredesign/index.htm;
Oncopanel AMC version 3 RNA bait; Agilent Technologies, Inc.). This
panel targets 382 genes, including entire exons of 199 genes, 184
hot spots and partial introns for eight genes that were frequently
reported to be rearranged in cancer. In total, 200 ng gDNA was used
in library preparation with SureSelectXT Reagent kit, HSQ, 96 (cat.
no. G9611B, Agilent Technologies, Inc.) and concentration of the
target-enriched libraries was measured by quantitative PCR (KAPA
SYBR fast qPCR kits; cat. no. 07959362001; Kapa Biosystems; Roche
Diagnostics) before loading onto the sequencing platform for
paired-end sequencing (sequencing read length 2×75 bp; using MiSeq
Reagent kit v3; cat. no. MS-102-3001; Illumina, Inc.). Sequenced
reads were aligned to the human reference genome (Build 37;
National Center for Biotechnology Information) with Burrows-Wheeler
Aligner (version 0.5.9; http://sourceforge.net/projects/bio-bwa/postdownload)
using default options. PCR duplicates were removed using the
MarkDuplicates tool (version 2.20.5; http://broadinstitute.github.io/picard). Base
qualities were recalibrated using the GATK BaseRecalibrator tool
(version 4.1.5.0; https://software,
broadinstitute.org/gatk/download). Somatic single nucleotide
variants (SNVs) and short indels were detected with an unmatched
normal using ‘Mutect’ version 1.1.6 and the ‘SomaticIndelocator’
tool within GATK. Common and germline variants from somatic variant
candidates were filtered out using the common ‘dbSNP’ build 141,
Exome Aggregation Consortium release 0.3.1 (https://exac.broadinstitute.org) and Korean Reference
Genome Database (https://152.99.75.168/KRGDB) and an in-house panel of
normal variants. Final somatic variants were annotated using
Variant Effect Predictor version 79 (https://m.ensembl.org/info/docs/tools/vep/script/vep_download.html)
and converted to maf file format using vcf2maf (GitHub; http://github.com/mskcc/vcf2maf).
Statistical analysis
Continuous variables were presented as mean ±
standard deviation from three to eight samples per condition.
Student's t-test was performed for two experimental groups
evaluated using two-sample equal-variance unpaired t-test. One-way
analysis of variance (ANOVA) was performed for multiple
experimental groups involving one factor, whereas two-way ANOVA was
performed for experiments involving two or three factors. Tukey's
multiple comparison test was used as a post-hoc test for ANOVA.
P<0.05 was considered to indicate a statistically significant
difference. For western blotting analysis, three repeats were
performed. For all statistical analysis, GraphPad Prism 7.0
(GraphPad Software, Inc.) and Stata15.1 (StataCorp LP) software
were used.
Results
Basal levels of NF1 expression of CRC
cell lines and cetuximab sensitivity
The experimental design of the present study is
summarized in Fig. S1. The
expression levels of NF1 in the CRC cell lines were first tested.
Western blotting (Fig. 1A and B)
revealed that the levels of NF1 protein expression is significantly
higher in NCI-H508 (KRAS/BRAFV600 wild-type) and
Caco-2 (KRAS/BRAFV600 wild-type) cells compared
with those in KM12C (KRAS/BRAFV600 wild-type;
microsatellite-high; NF1 mutant) and SW480 (KRAS G12V
mutant). RT-qPCR also demonstrated the significantly higher
expression levels of NF1 mRNA in NCI-H508 and Caco-2 cells compared
with those in KM12C and SW480 cells (Fig. 1C). Colony formation assay results
demonstrated different numbers of colonies form at baseline despite
the same number of cells being seeded under the same condition
(Fig. 1D). This may be due to
different growth patterns and growth speeds among the four cell
lines. However, the relative colony numbers formed by
cetuximab-treated cells were significantly reduced compared with
those in the control at 100 µg/ml (NCI-H508) or 50 µg/ml (Caco-2),
but no significance could be observed in cell lines with little to
low NF1 expression (NF1-Low) (Fig.
1E). Cell viability testing also revealed significant growth
inhibition by cetuximab in NF1-high cell lines, whilst NF1-low cell
lines were found to be intrinsically more resistant to cetuximab
(Fig. 1F).
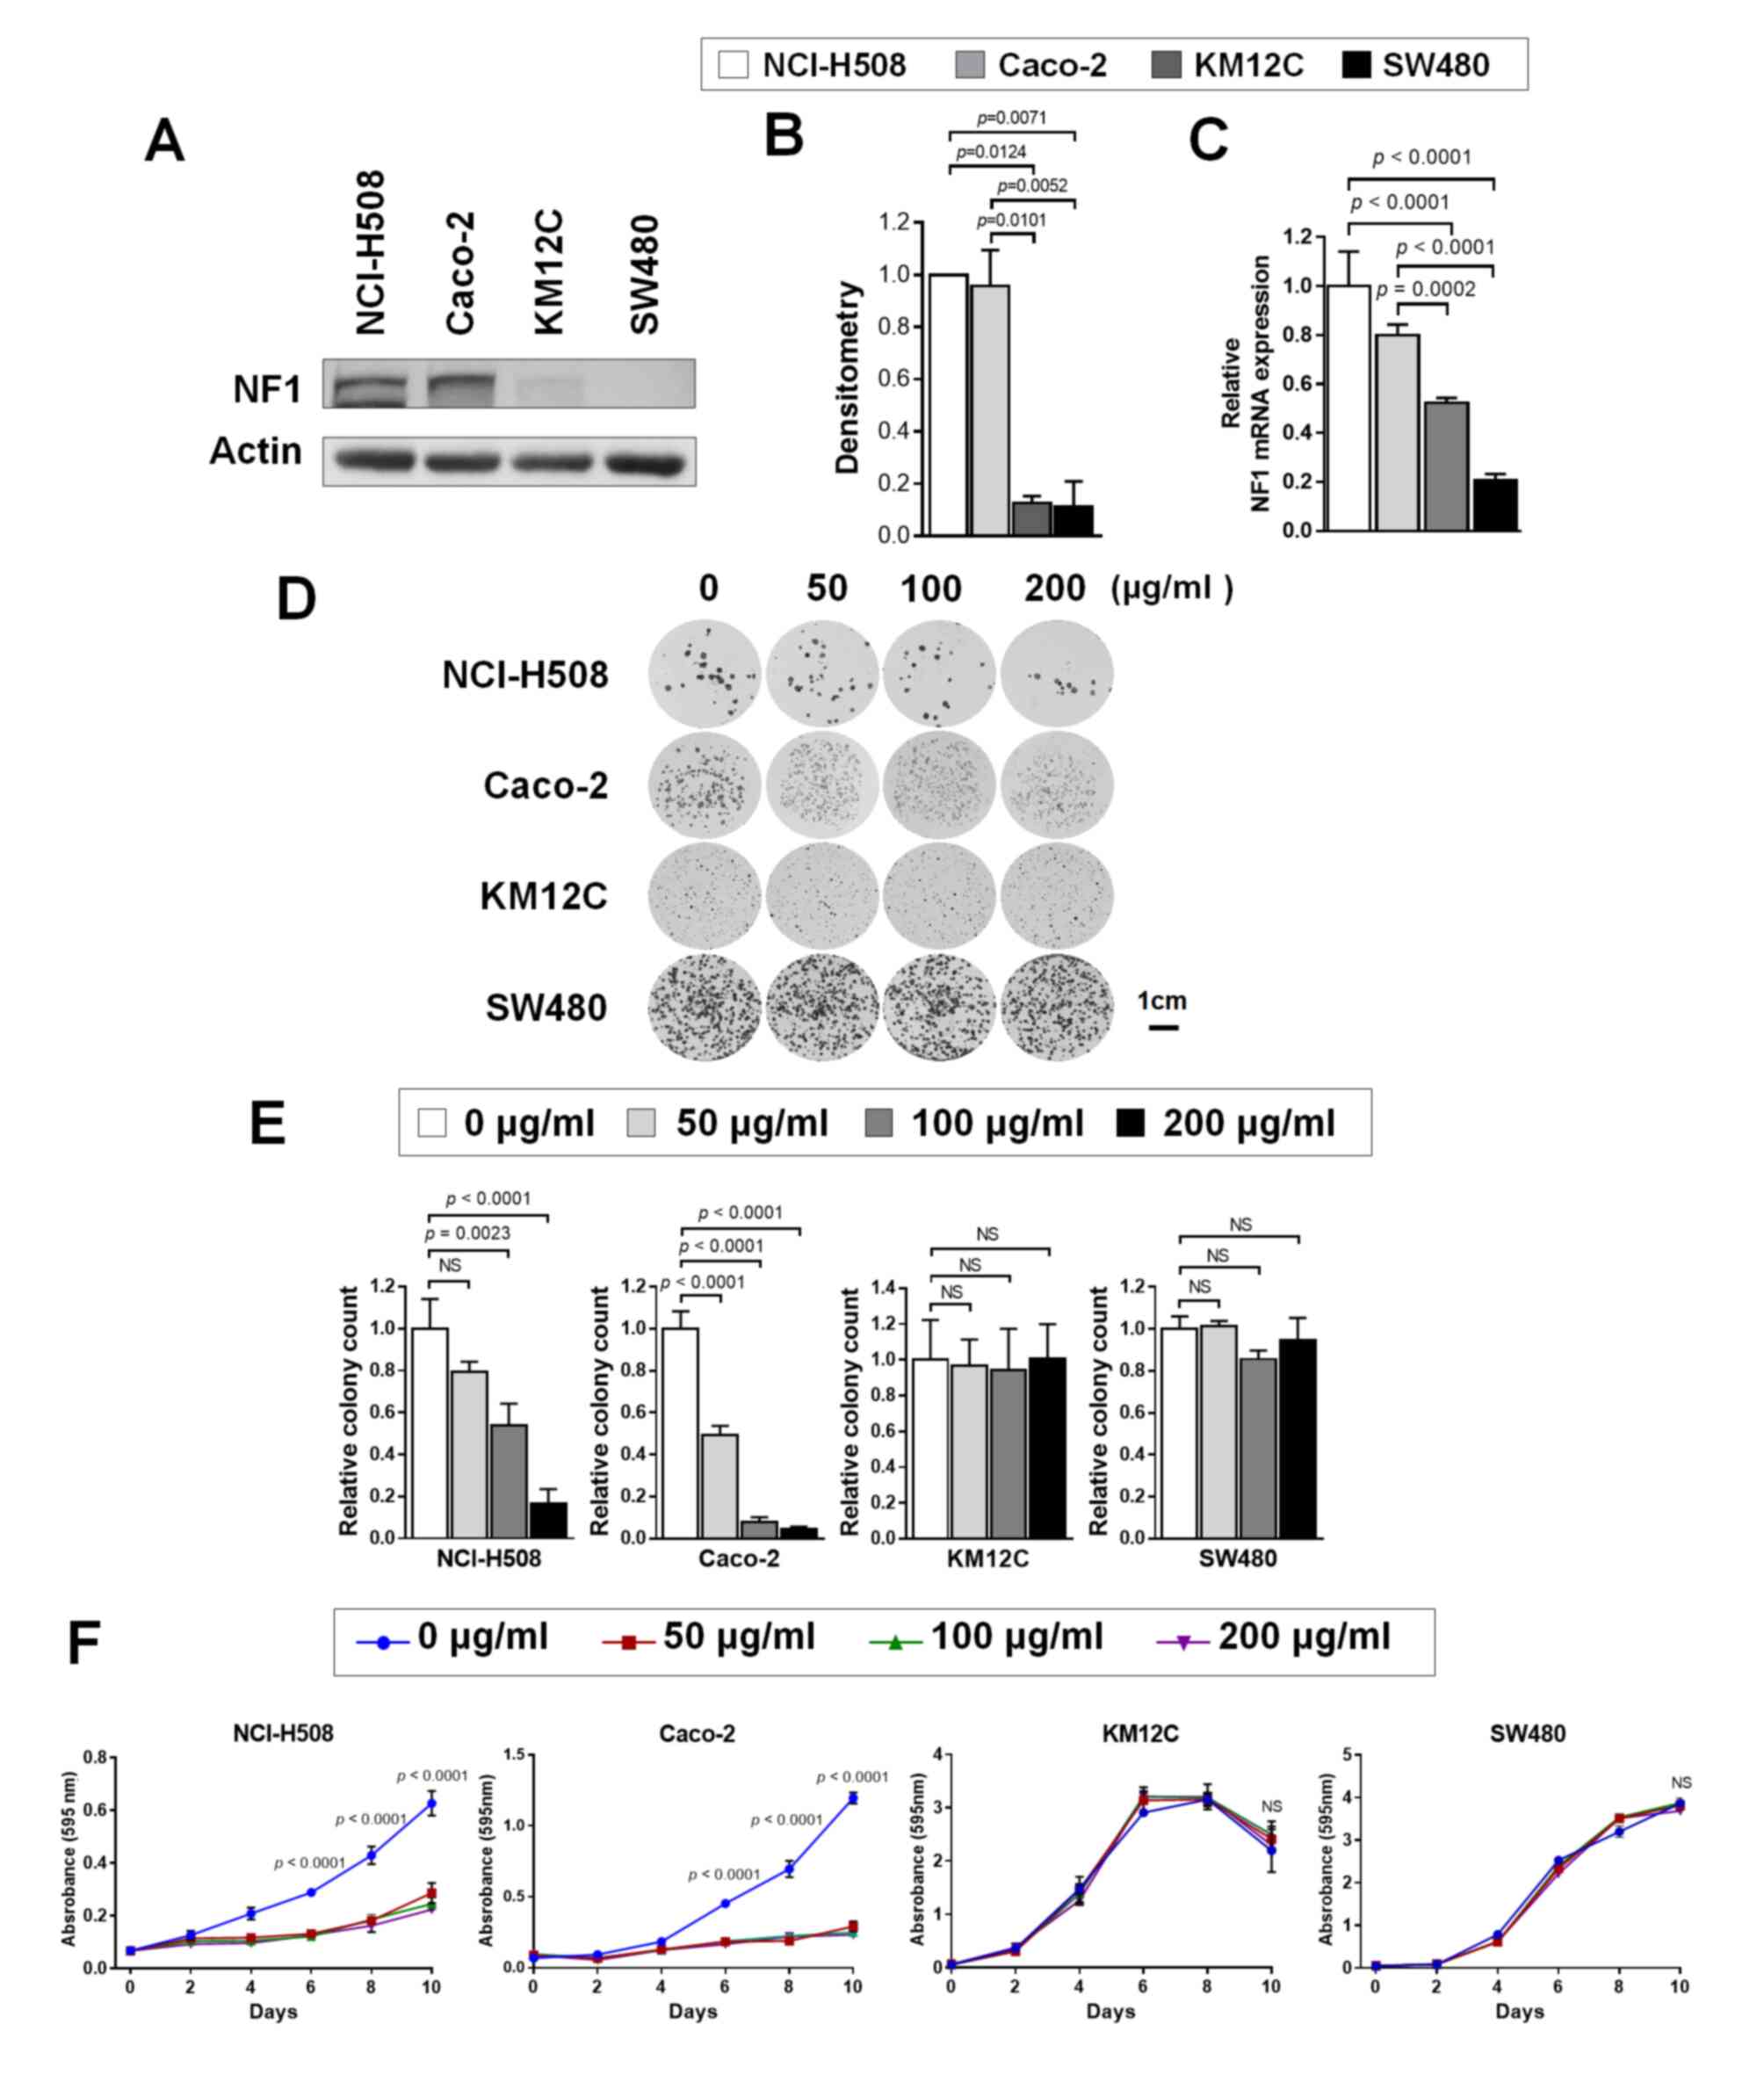 | Figure 1.CRC cell lines with resistance to
cetuximab shows lower NF1 expression levels. (A) Western blotting
was used to measure NF1 expression in NCI-H508, Caco-2, KM12C and
SW480 cells. (B) Relative expression of NF1 by densitometric
quantification of the western blotting images in (A). P<0.05;
n=3. (C) NF1 mRNA expression in NCI-H508, Caco-2, KM12C and SW480
cells. P<0.001, n=3. (D) NCI-H508, Caco-2, KM12C and SW480 cells
were cultured with 0, 50, 100, and 200 µg/ml cetuximab for 10 days
and stained with crystal violet before imaging. (E) The number of
surviving colonies at each cetuximab concentration were normalized
to the control and plotted. P<0.01, n=3. (F) The cells were
cultured with 0, 50, 100 and 200 µg/ml of cetuximab for 0, 2, 4, 6,
8 and 10 days, stained with crystal violet and assayed for cell
growth. P<0.001. Actin was used as the loading control as the
housekeeping gene for use in western blot analysis. GAPDH was used
as the housekeeping gene for reverse transcription-quantitative
PCR. NF1, neurofibromin; siRNA, small-interfering RNA; CRC,
colorectal cancer. |
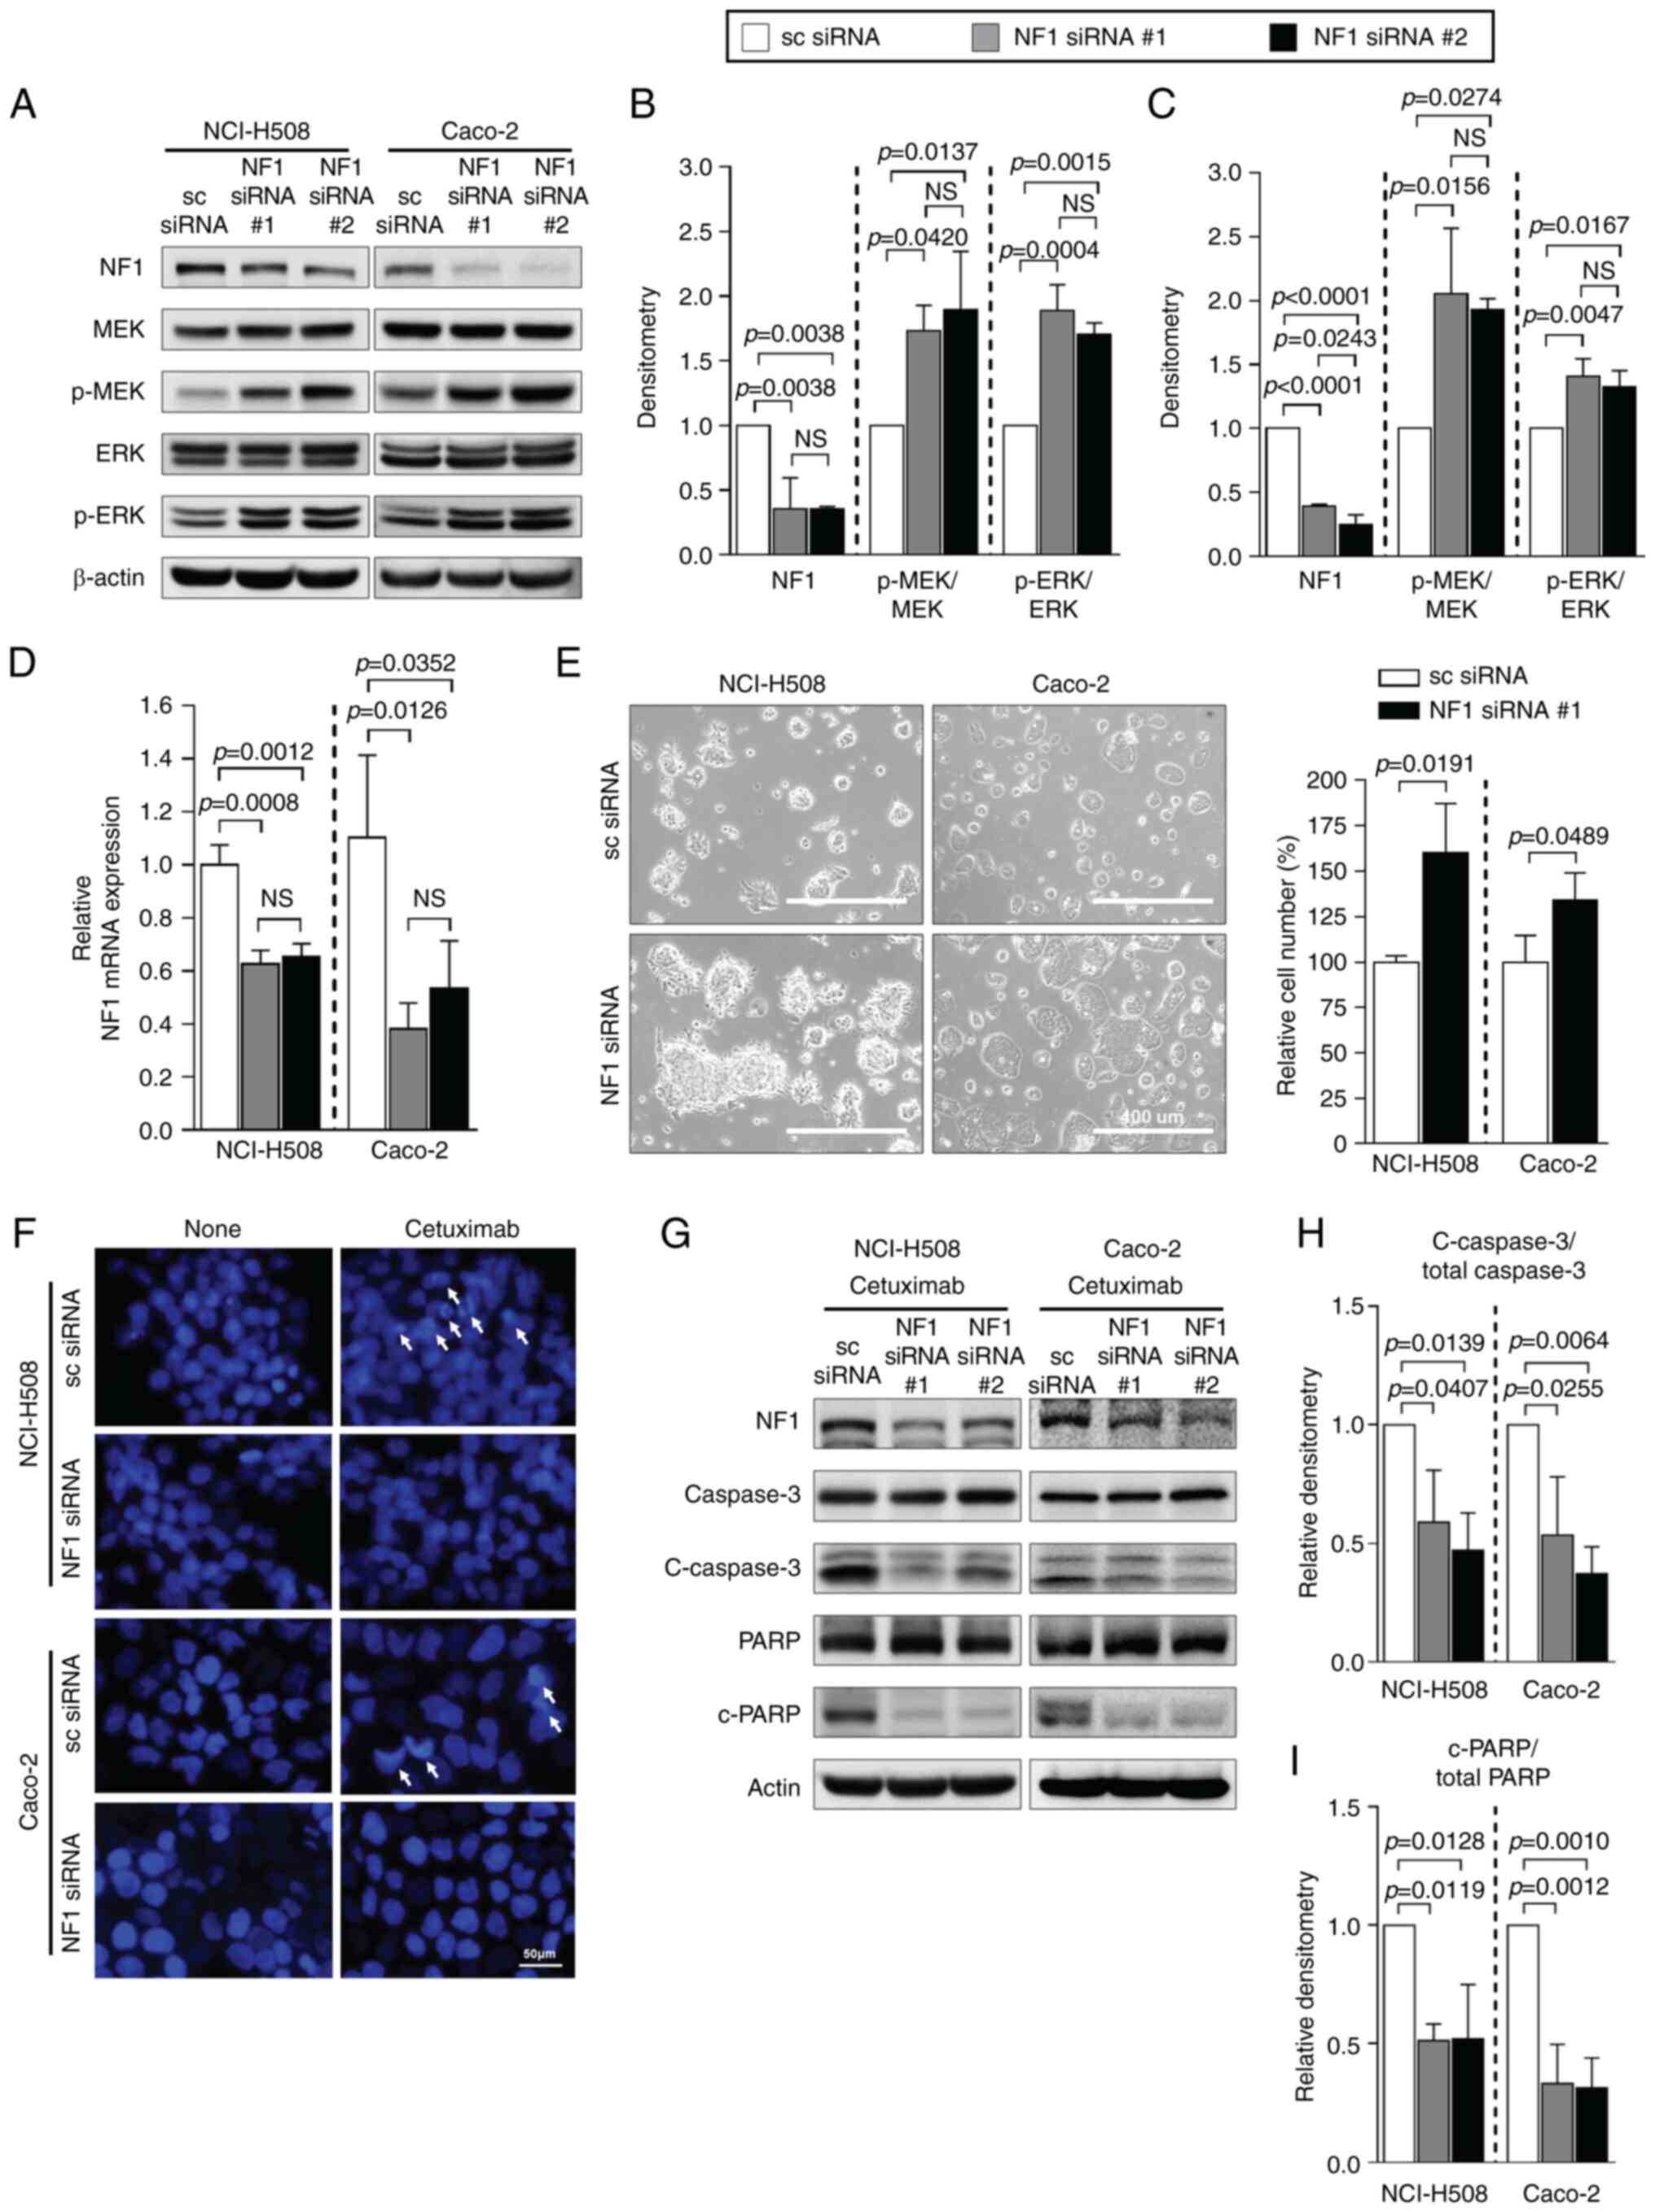
NF1 knockdown with siRNA
To investigate whether the downregulation of NF1 is
sufficient to induce resistance to cetuximab, the NF1-high cell
lines were transfected with NF1-siRNAs. Both NF1-siRNAs
significantly reduced NF1 protein expression in both NCI-H508 and
Caco-2 cells (Fig. 1A-C).
Elevations in the phosphorylation levels of MEK and ERK was
prominent in NF1-knockdown cells compared with cells transfected
with scrambled-siRNA, but total MEK and ERK expression were not
changed in both NCI-H508 and Caco-2 cells (Fig. 2A-C). The significantly reduced
expression of NF1 mRNA after siRNA transfection compared
with those in cells transfected with scrambled siRNA was also
confirmed by RT-qPCR (Fig. 2D).
The cell lines transfected with NF1 siRNA demonstrated a change
into a more attached growth pattern and a significantly greater
number of cells compared with those in cells transfected with
scrambled siRNA (Fig. 2E). Data
from the DAPI assay indicated lower levels of cetuximab-induced
apoptosis by observing fewer apoptotic bodies, referred to as
extracellular vesicles containing fragmented nucleus component with
intense staining by DAPI, in cells transfected with NF1-siRNA than
those in cells transfected with scrambled siRNA (Fig. 2F). In the presence of cetuximab,
western blotting of apoptosis markers in both cell lines also
showed significantly decreased cleavage of caspase 3 and PARP after
transfection with NF1-siRNA compared with that in cells transfected
with scrambled siRNA (Fig.
2G-I).
NF1-GRD plasmid expression
Subsequently, NF1-Low cell lines were tested for the
physiological effects of NF1 overexpression. KM12C and SW480 cells
were transfected with the NF1-GRD plasmid (Fig. 3A). NF1-GRD mRNA expression was
significantly increased in NF1-GRD-transfected cells compared with
that in cells transfected with empty vector in both KM12C and SW480
cells (Fig. 3B). The expression of
total NF1 protein also increased in NF1-GRD-transfected cells
compared with that in empty vector-transfected cells in all NF1-Low
cells (Fig. 3C). The
phosphorylation of MEK and ERK was significantly decreased by
NF1-GRD overexpression in both cell lines compared with that in
cells transfected with the empty vector (Fig. 3C-E). NF1-GRD overexpression also
inhibited cell proliferation in KM12C and SW480, as shown by a
significantly lower number of cells in the NF1-GRD overexpression
group compared with those cells transfected with the empty vector
(Fig. 3F) Furthermore, NF1-GRD
overexpression was sufficient to potentiate cetuximab-induced
apoptosis in these resistant cell lines, which was supported by the
increased cleavage of caspase and PARP according to western
blotting (Fig. 3G-I). DAPI assay
also showed increased nuclear fragmentation in cells overexpressing
NF1-GRD transfection compared with that in cells transfected with
the empty vector but not treated with cetuximab (Fig. 3J). However, this phenomenon was
more prominent following cetuximab treatment (Fig. 3J).
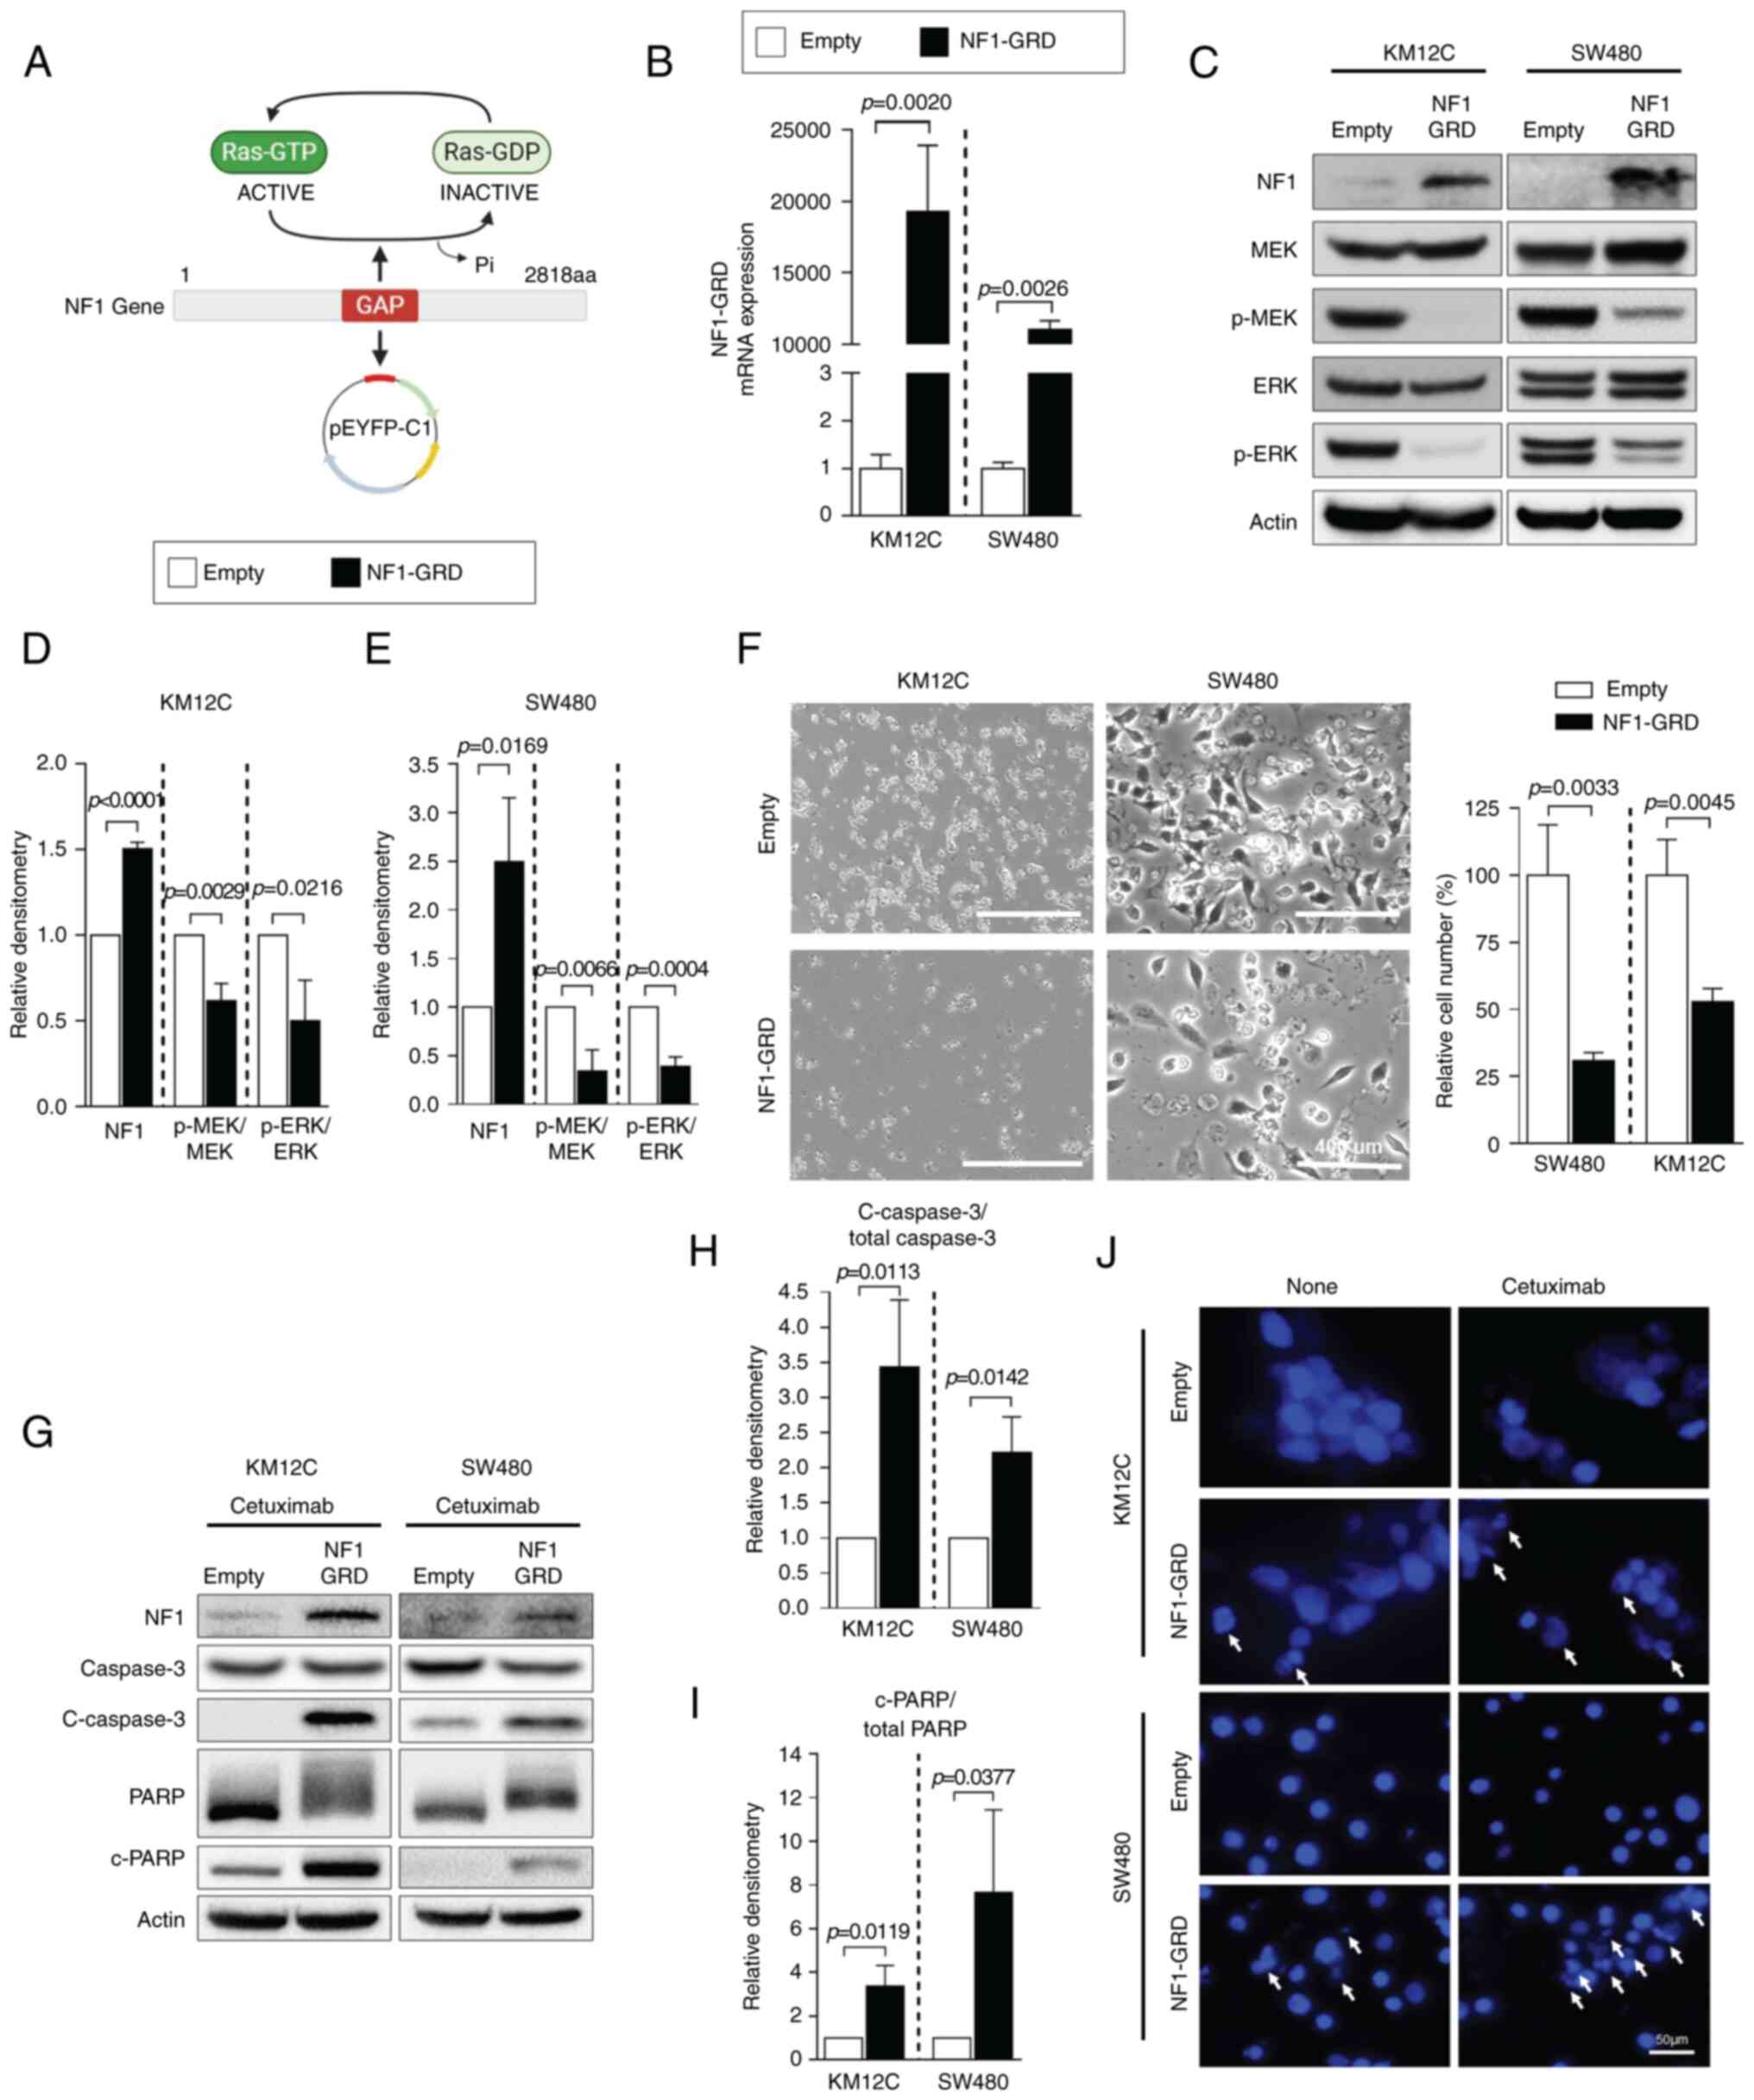 | Figure 3.NF1 overexpression restores
sensitivity to cetuximab in CRC cell lines expressing low levels of
NF1 by repressing the MAPK pathway. (A) Schematic representation of
the NF1-GRD expression vector. The illustration was created with
BioRender.com. (B) Relative expression of NF1-GRD as measured using
reverse transcription-quantitative PCR in KM12C and SW480 cells,
which express low levels of NF1. Their expression levels are
normalized to those of GAPDH. (C) Western blot analysis of MAPK
signaling activation, specifically p-MEK and p-ERK, which were
quantified in (D) KM12C and (E) SW480 cells following normalization
to that of total MEK and/or total ERK. n=3. (F) Cell morphology as
analyzed using the by EVOS microscope with relative cell numbers
counted with the ImageJ software. Magnification, ×200. (G) Western
blot analysis of apoptosis markers caspase-3 and PARP, where the
relative densities of (H) c-caspase 3 and (I) c-PARP were
quantified and normalized to that of total caspase 3 and/or total
PARP. n=3. (J) DAPI staining assay of KM12C and SW480 cells after
NF1-GRD transfection and cetuximab treatment. Data are presented as
the mean ± standard deviation. P<0.05, unpaired t-test. NF1,
neurofibromin 1; GRD, GAP-related domain; PARP, poly-(ADP ribose)
polymerase; p-, phosphorylated; c-, cleaved. |
NF1 mRNA expression in tumor
samples
After investigating the in vitro relationship
between NF1 expression and cetuximab sensitivity, the levels of
NF1 transcript expression in clinical CRC samples was then
estimated. To explore how different quantities of NF1
transcripts are associated with the clinical outcomes of patients
treated with anti-EGFR, 111 RAS and
BRAFV600 wild-type CRC samples from 92 patients
(19 patients provided two samples and 73 patients provided one
sample) who received cetuximab as palliative chemotherapy were
analyzed using RNA sequencing. Patient characteristics are listed
in Table I. In the present study,
the majority of patients underwent first-line treatment with
cetuximab and combination chemotherapy (82%), were diagnosed with
left-sided CRC (79%) and stage IV disease (89%). In total, 75
pre-treatment samples (69 from primary tumors and six from
metastatic organs) and 36 post-treatment samples (15 from primary
tumors and 21 from metastatic organs) were analyzed. The majority
of samples (104 samples) were obtained at the time of metastatic
spread except for seven pre-treatment samples, which were obtained
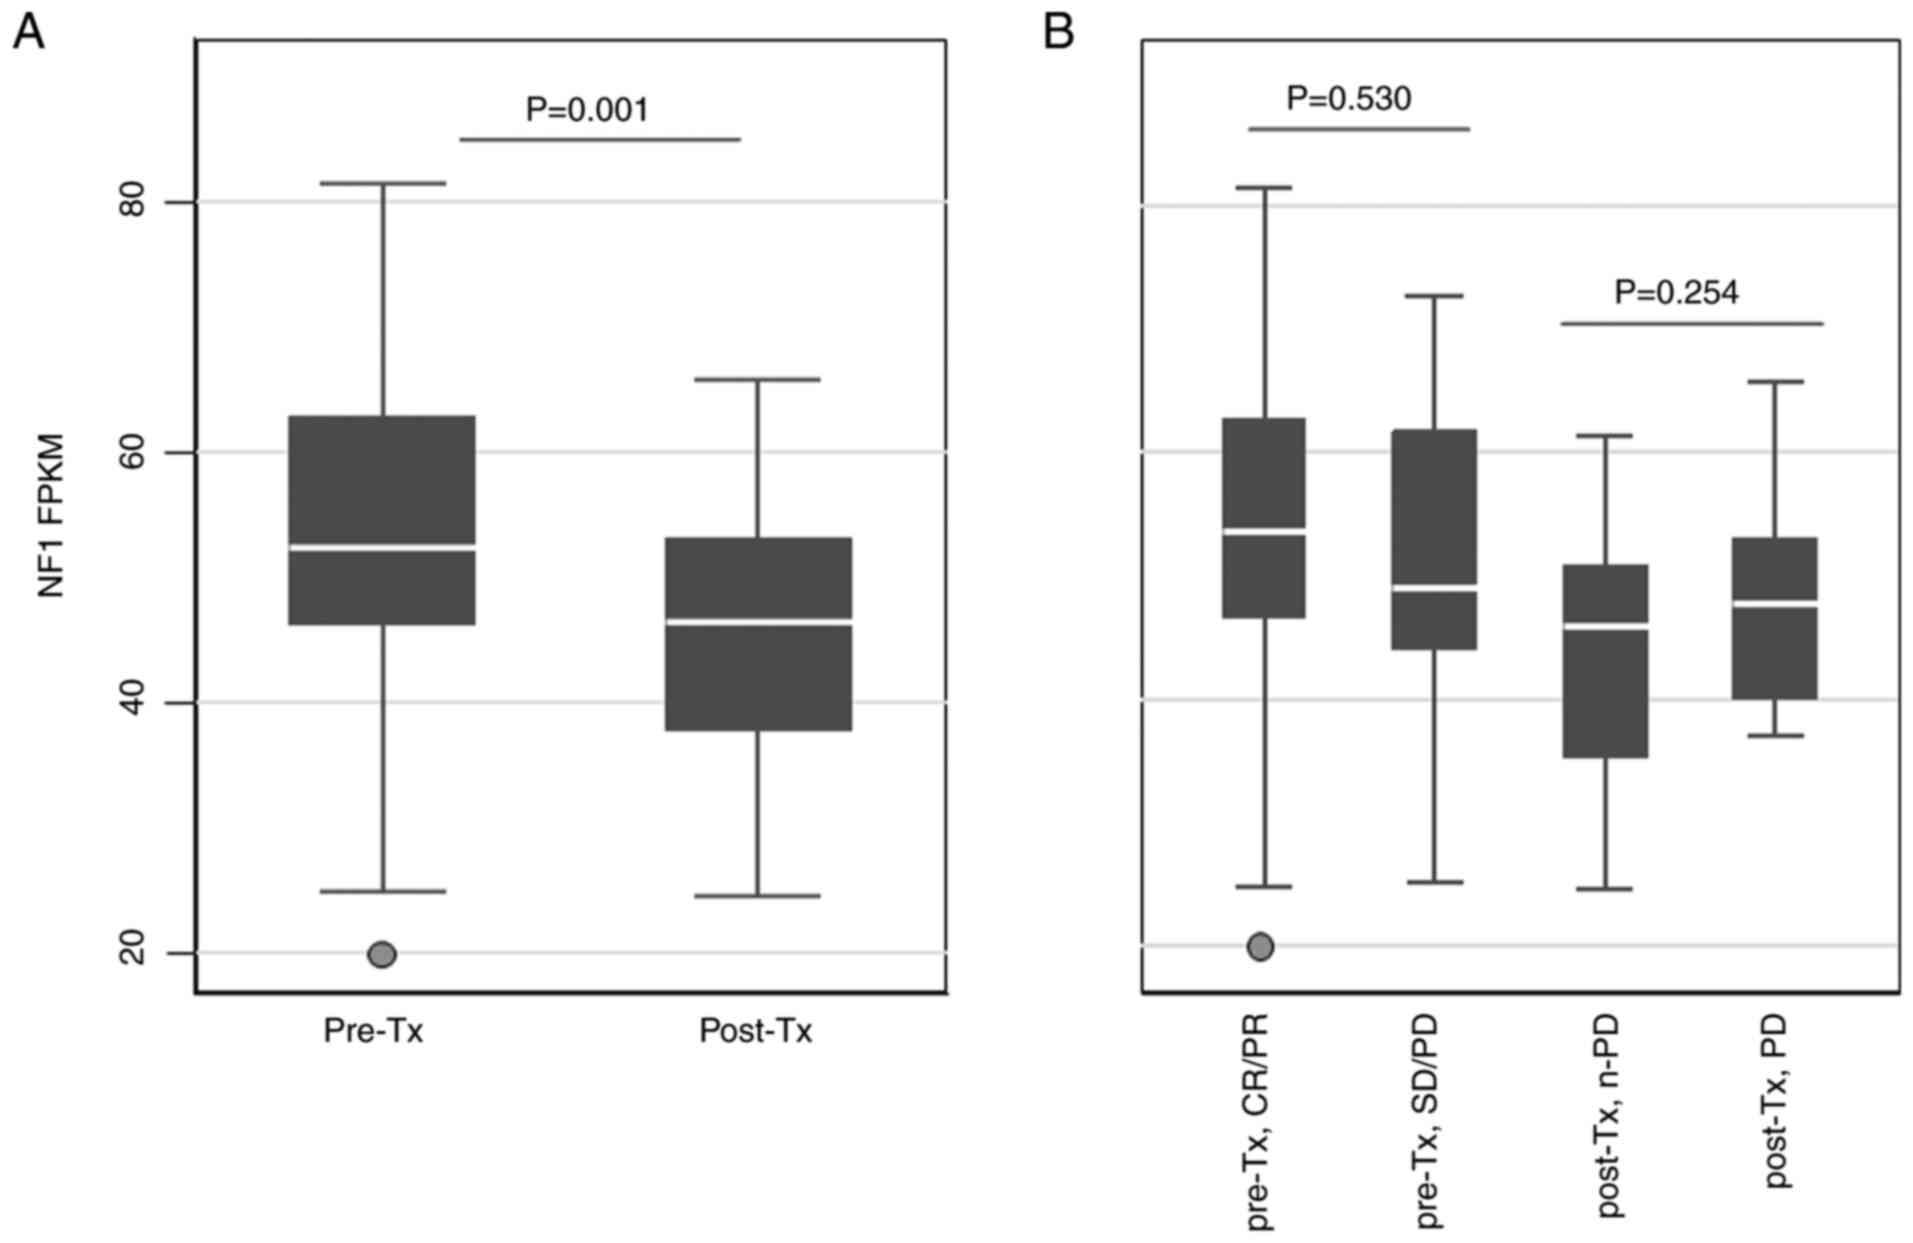
from stage I–III surgical specimens before recurrence. The FPKM
values of NF1 were then compared according to the clinical
status of the samples (Fig. 4).
Post-treatment samples showed significantly lower NF1 FPKM
values compared with those in the pre-treatment samples (Fig. 4A). However, there were no
significant differences between pre-Tx CR/PR and SD/PD or between
post-Tx non-PD and PD (Fig. 4B).
There were also no significant associations between the NF1
FPKM values and other clinical characteristics, namely treatment
lines, side of tumor sample origin or whether the sample was from
the primary tumor or a metastasis (Fig. S2).
Among the 111 samples, 88 (79%) were also analyzed
with NGS, which revealed only two (2.2%) samples showing
non-synonymous NF1 mutations. One post-treatment sample
obtained at PD showed a truncating mutation (K918Gfs*17) with the
variant allele frequency of 0.11, of which the NF1 FPKM
value was 52.6, whilst its paired pre-treatment sample did not
harbor the NF mutation (the NF1 FPKM value was 56.7). The
other was a missense mutation (p.T1627A) with the allele frequency
of 0.46, and its NF1 FPKM value was 74.9. It was found in a
pre-treatment sample that showed clinical CR, not matched with a
post-treatment sample.
Subsequently, the expression profiles of NF1 and
EGFR signaling components were analyzed according to the clinical
status of the tumor samples. For differentially expressed gene
analysis using the RNA sequencing data, pathways containing ‘NF1
(entrez ID: 4763)’ or ‘EGFR (entrez ID: 1956)’ were selected in the
pathway names or pathway gene set. Pathways in the pathway sets
defined as NF1-related pathways or EGFR-related pathways by the
KEGG pathway database were also selected. After this selection
procedure, three NF1-related pathways (hsa01521, hsa04014 and
hsa04010) and two EGFR-related pathways (hsa05235 and hsa01521)
were found in the GSEA results (Table
SII). In all of these pathways found, the GSEA P-values were
not significant, meaning that expressions in these pathways were
not significantly enriched.
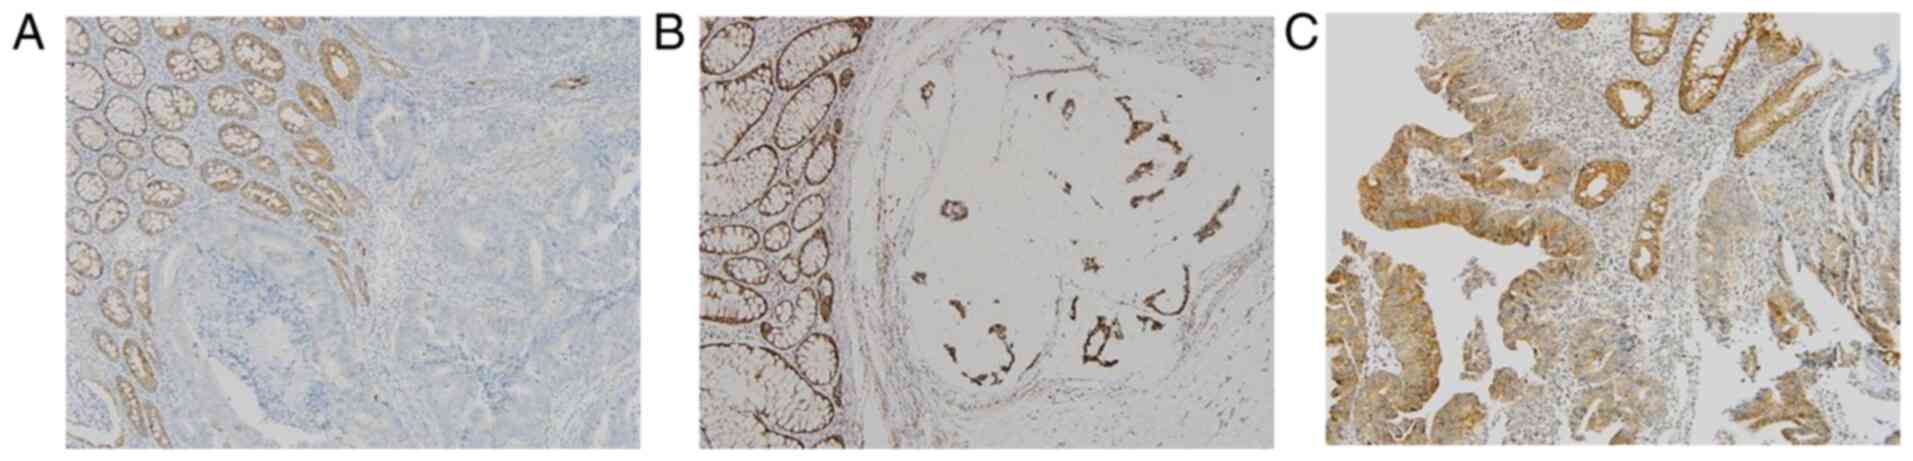
Frequency of NF1 mutation in CRC and
NF1 protein expression associated with mutation
In a total of the 1,449 patients with CRC who
underwent the clinical NGS test, 29 truncated mutations in the
NF1 gene (nonsense, frameshift, or splice site) were found
in 26 (1.8%) patients (Table
SIII). The majority of the allele frequencies were <0.5,
whilst only five cases showed allele frequencies >0.5, where
four cases were found with frameshift mutations and one with
splice-site mutations (5/1,449, 0.3%). In addition, one of the
tumors harboring those high allele frequencies of NF1
frameshift mutations (CRC-1213) showed the absent expression of NF1
in tumor cells but adjacent normal colonic crypts were positive for
NF1 (Fig. 5A), whilst tumors with
lower NF1 mutation allele frequencies showed comparable NF1
expression levels compared with tumors with wild-type NF1
(Fig. 5B and C).
Discussion
The present study showed that reduced NF1 expression
may be associated with anti-EGFR antibody resistance in CRC, where
the level of expression was generally downregulated after
treatment, implicating a role for NF1 in the acquisition of
resistance to anti-EGFR therapy. The NF1 gene is located on
the 17q11.2 locus and is relatively large in terms of genomic size
(350 kbp), which also has a complex structure consisting of 61
exons (30). In addition,
mutations are generally spread over all regions without specific
clusters of recurrent mutations (30). Pathogenic germline mutations of
NF1 are known to cause the neurofibromatosis type 1 disease,
which is an inherited syndrome that increases the predisposition of
developing tumors, including neurofibromas, malignant peripheral
nerve sheath tumors, optic gliomas, rhabdomyosarcomas and
neuroblastomas (13). Furthermore,
somatic mutations or other molecular aberrations in the NF1
gene in non-NF1-associated sporadic tumors, such as melanoma
(14), lung cancer (31,32),
breast cancer (33,34), or CRC (9,35),
have been previously investigated, where their roles in resistance
to targeted agents or hormonal therapy are being elucidated
(30). In CRC, RAS/MAPK
dysregulation occurs in ~80% microsatellite-stable subtypes and 60%
microsatellite-unstable subtypes and is a crucial factor of
anti-EGFR resistance (36).
Therefore, NF1 aberrations may hold have potential
predictive values.
Notable differences were observed in the NF1 protein
expression levels in the CRC cell lines according to their genotype
and sensitivity to cetuximab. Cetuximab-sensitive cell lines
NCI-H508 and Caco-2 were of the RAS/BRAFV600
wild-type genotype and microsatellite stable without NF1
mutations, which showed higher NF1 expression. By contrast,
cetuximab-resistant cell lines with lower NF1 expression levels
were found to harbor KRAS mutations (SW480) or the
microsatellite-unstable genotype with NF1 frameshift
mutation (KM12C) (17).
Downregulation of NF1 expression in KM12C may be explained by the
presence of the NF1 truncating mutation (T676fs; allele
frequency, 0.44). In SW480 cells, reduced NF1 expression may be
associated with the KRAS G12V mutant protein, which is
constitutively active irrespective of its upstream signal, EGFR
(37). Codon 12 KRAS mutant
protein is known to inhibit NF1 by forming nonproductive binding so
that wild-type KRAS is activated during the scarcity of NF1
(38).
In cetuximab-sensitive cell lines with high NF1
expression, suppression of NF1 expression was sufficient for
inducing resistance to cetuximab, which also resulted in enhanced
MEK and ERK signaling downstream and reduced apoptosis. These
findings are in line with those from previous studies, which
demonstrated that siRNA- and genome-side CRISPR-mediated NF1
inactivation induced cetuximab resistance in RAS and
BRAF wild-type CRC cell lines (9,38,39).
Conversely, it was also demonstrated that NF1-GRD overexpression in
NF1-low cell lines reversed their intrinsic resistance to cetuximab
whilst also attenuating ERK and MEK signaling. In addition, the
expression levels of the apoptosis markers were elevated in the
cetuximab-resistant cell lines transfected with the NF1-GRD
plasmid. This phenomenon could also be observed in the KRAS
mutant cell line SW480, suggesting that overcoming the intrinsic
resistance of RAS-mutant CRC to cetuximab can be achieved by
restoring NF1 expression. These results are consistent with those
reported by a recent study, which revealed the role of NF1
interaction with mutant KRAS protein in anti-EGFR resistance
(38). The study showed the levels
of wild-type RAS-GTP expression, rather than mutant RAS-GTP, was
related to resistance to cetuximab in various types of
KRAS-mutant CRC cell lines, and the cell lines harboring the
KRAS codon 12 mutation showed higher levels of wild-type
RAS-GTP compared with those with KRAS wild-type or G13D
KRAS mutants, However, NF1 transfection rendered the G12V
mutant cell line sensitive to cetuximab due to the hydrolysis of
abundant wild-type RAS-GTP by NF1. This suggests that sensitivity
to anti-EGFR treatment in KRAS mutant tumors can be enhanced
by NF1 overexpression (38).
The NF1 mRNA expression levels in RAS
and BRAFV600 wild-type CRC tumor samples obtained
before or after cetuximab treatment were next analyzed to test the
association between NF1 expression and the response to
cetuximab. Pre-treatment samples showed relatively higher
NF1 transcripts compared with those in their post-treatment
counterparts, whilst response to cetuximab was not significantly
associated the pre-treatment baseline NF1 transcript levels.
This suggests that the heterogeneity in the NF1 expression
levels within the RAS and BRAFV600
wild-type CRC group may not accurately predict the response to
cetuximab. However, exposure to cetuximab may be associated with
lower expression levels of NF1. This is in line with the findings
from a previous study in non-small-cell lung cancer tumor samples,
which identified NF1 as a determinant of EGFR tyrosine kinase
inhibitor resistance using genome-wide siRNA screening (8). This previous study also found reduced
NF1 mRNA expression in post-treatment samples with acquired
resistance (8). However, GSEA
analysis in the present study did not reveal any differences in the
expression of EGFR, RAS or MAPK signaling pathway components
between pre- and post-treatment samples or between post-treatment
non-PD and PD samples. Therefore, the slightly reduced NF1
expression in the post-treatment samples may not be associated with
a significant change in the transduction of growth signals through
the EGFR/MAPK pathway.
The mechanism underlying the reduced expression of
NF1 transcripts in the post-treatment samples remains
unclear. In breast cancer, NF1 truncating mutations, such as
frameshift, nonsense or stop-gain, which were absent in primary
tumors, became emergent in metastatic tumor tissues in ~3% patients
and was associated with resistance to endocrine therapy (34). However, previous studies that
conducted NGS analysis on cetuximab-treated CRC samples revealed no
evidence of recurrently acquired NF1 mutations with
sufficient allele fraction (9,40).
Therefore, another transcriptomic or epigenetic mechanism other
than gene regulation may be responsible for the reduced NF1
transcripts in post-treatment samples.
In the present study, mutations in NF1 in the
cetuximab-treated samples were rare, where the NF1 FPKM did
not seem to associate with NF1 mutations. Only two of the 88
samples that were tested for both RNA sequencing and NGS revealed
NF1 mutations. One was a frameshift mutation that emerged
after cetuximab treatment. However, its NF1 expression was
not downregulated since the NF1 FPKM value associated with
this mutation was comparable with the mean value of the entire
cohort. Its lower allele frequency (0.11) implies that this
frameshift mutation is a heterozygous variant that is insufficient
to suppress the function of a tumor suppressor gene such as
NF1. Another mutation (p.T1627A) found in the pre-treatment
sample was annotated as having uncertain significance in ClinVar
(https://www.ncbi.nlm.nih.gov/clinvar/variation/231988/).
This variant may not have functional implications, considering the
high NF1 FPKM value and the favorable clinical response to
cetuximab exhibited by the patient.
After the finding that mutations in the NF1
gene may not be related to NF1 expression, the prevalence and type
of NF1 mutations in a larger genomic dataset of CRC in Asan
Medical Center were investigated. Only 1.8% patients with CRC had
truncating mutations in NF1, which corresponded to the
prevalence reported by the American Association For Cancer Research
Project Genomics Evidence Neoplasia Information Exchange (2.3%;
144/6,303) (41). Previous studies
also reported the rate of somatic mutations in the NF1 gene
to be ranging from 3.8 to 6.25% in CRC (30,36,42).
However, this includes all types of mutations, of which a large
proportion may have been missense mutations of unknown
significance. Although any types of mutation could in theory result
in a pathogenic impact on the function of the NF1 gene, the
high likelihood of oncogenicity lies in the truncating mutations of
this tumor-suppressor gene (43).
This was the reason for truncating mutations in NF1 in CRC
being focused upon in the present study. The majority of the
mutations were of low allele frequencies, which implicates
heterozygous mutations. Although mono-allelic loss of NF1
has the potential for de novo tumorigenesis, these effects
are reportedly limited to benign tumors (44) and known to be insufficient for
malignant transformation (45).
IHC analysis in the present study revealed that the levels of NF1
protein expression in tumors harboring the heterozygous NF1
mutation were comparable with those in the NF1 wild-type. In
addition, only 0.3% of all patients with CRC had a sufficient
allele frequency of the NF1 truncating mutation that may
have an impact on protein expression and possibly drug resistance
(45). Taken together, loss of NF1
proteins by inactivating mutations may be a rare phenomenon in
CRC.
Several studies have previously demonstrated the
association between the efficacy of cetuximab and NF1
mutation (9,35). Mei et al (35) reported that patients with CRC
having any single nucleotide variants or insertion/deletion
mutations of NF1 or SMAD4 showed poorer
progression-free survival after cetuximab treatment compared to
those with wild-type NF1 and SMAD4 (35). However, the NF1 variants
detected in the present study population also had low allele
frequencies (1.9-7.5%), where only one of the three were detected
to have NF1 mutations, which were frameshift mutations
annotated as pathogenic in ClinVar (https://www.ncbi.nlm.nih.gov/clinvar/). In addition,
another study showed that intrinsic resistance to cetuximab in CRC
was associated with the NF1 truncating mutation combined
with the loss of heterozygosity in a small subset of patients
(9), suggesting that a ‘two-hit
hypothesis’ can be applied to explain anti-EGFR resistance
associated with NF1 mutation. In the present study, none of
the five patients who had sufficient allele frequencies of
truncating mutations were treated with cetuximab, meaning that
analysis of their association with anti-EGFR resistance was not
possible due to their rarity. Taken together, mutations causing the
biallelic inactivation of NF1 do occur in CRC but are
relatively rare. Therefore, larger groups of samples containing NGS
results are required to test the statistical significance in the
association between the mutations and response to anti-EGFR
treatment.
A tumor suppressor gene is typically not regarded
to be druggable. Therefore, restoration of the functions of these
genes is difficult. However, various strategies, including gene
therapy and small molecule inhibitors, have been attempted
(46). Although gene therapy for
tumor suppressor genes is in the early stages of development and
the size of NF1 is large for loading into gene delivery
vectors, a recent study has shown that the NF1-GRD subunit
delivered by adeno-associated virus vectors was sufficient to
inhibit RAS activity in malignant peripheral nerve sheath tumor
cell lines (47). In addition,
nanoparticle platform-mediated delivery of p53 mRNA was shown to
induce tumor regression in animal models of hepatocellular
carcinoma and non-small-cell lung cancer (48,49).
These novel strategies may yet provide alternative therapeutic
strategies for anti-EGFR-resistant tumors by restoring NF1
expression in the future.
The present study has several limitations. The
effects of NF1 knockdown and overexpression on the apoptosis of all
cell lines used in this study were not assessed, This was because
the degree of knockdown in NF1-Low cell lines and the degree of
overexpression in NF1-High cell lines were not significant (data
not shown). However, these experiments could have revealed the
relative impact of NF1 expression modulation compared with other
cell lines that have different levels of NF1 expression and
cetuximab sensitivity. For example, by comparing the effects of NF1
knockdown with NF1-Low and the effects of NF1 overexpression with
NF1-High. In addition, apoptosis induced by cetuximab in the
present study was demonstrated by measuring the cleavage of caspase
3/PARP through western blotting and imaging of apoptotic bodies
using DAPI staining. This could have been supported by
demonstrating DNA fragmentation using TUNEL assay and by showing
early changes in the membrane potential due to apoptosis using
Annexin V assay. The tumor samples with NF1 homozygous
truncating mutations are so rare that none of the studied patients
underwent anti-EGFR Ab treatment. Therefore, the association
between NF1 mutation and response to anti-EGFR treatment
could not be analyzed. RNA sequencing was performed for RNA
extracted from formalin-fixed paraffin-embedded tissues, which is
not an ideal source for RNA sequencing due to fragmentation and
chemical modification of RNA (50). Therefore, it is generally
associated with higher risk of the inadequate quality of RNA. In
addition, due to the lack of sufficient tissue quantities, the RNA
sequencing results for NF1 expression on those cetuximab-treated
samples could not be completely supported with IHC. The clinical
characteristics of tumors analyzed using RNA-seq were found to be
heterogeneous within the limited number of samples. A number of
samples were obtained before the development of metastases, which
may not represent the transcriptome of metastatic disease.
Therefore, the possibility that other clinical factor, including
sidedness or sample origin, could be associated with NF1 expression
even though the associations between NF1 FPKM and other
factors were not statistically significant in the present study
(data not shown). The finding of the reduced NF1 mRNA
expression in cetuximab-treated tumor samples was not supported by
EGFR/RAS/MAPK pathway activation in GSEA, which was not directly
proven through any cell lines or animal models in the present
study. Therefore, the causal relationship between acquired
resistance to cetuximab and NF1 downregulation was not analyzed by
this study, which warrants further investigation.
In conclusion, the present study showed that
reduced NF1 expression may serve a role in anti-EGFR resistance in
CRC cell lines, which could be overcome by restoring NF1
expression. However, its utility as a biomarker is limited in
clinical samples. Baseline NF1 expression in RAS and
BRAFV600E wild-type tumors was not related to
response to anti-EGFR therapy, but in post-treatment samples NF1
expression tended to be slightly lower than that in their
pre-treatment counterparts, suggesting that acquired resistance
could be related to NF1 downregulation during treatment. However,
the majority of NF1 mutations in CRC in the present study
were heterozygous variants, which did not impact NF1 expression.
Baseline NF1 mutation or expression levels do not seem to be
relevant biomarkers for predicting anti-EGFR response in CRC.
Nevertheless, NF1 expression in post-treatment samples warrants
further study to decipher the mechanism underlying anti-EGFR
resistance.
Supplementary Material
Supporting Data
Acknowledgements
The authors would like to thank Professor Seon-Yong
Jeong, Department of Medical Genetics, Ajou University School of
Medicine (Suwon, South Korea), for providing NF1-GRD constructs for
the present study.
Funding
The present study was supported by the Bio & Medical
Technology Development Program of the National Research Foundation
of Korea funded by the Ministry of Science and ICT (grant no.
2017M3A9B6061825) and was also supported by a grant from the Asan
Institute for Life Sciences, Seoul, Republic of Korea
(2016-735).
Availability of data and materials
The data presented in this study will be provided
upon request from the corresponding author. RNA sequencing data has
been deposited in Gene Expression Omnibus (GSE 183984; http://www.ncbi.nlm.nih.gov/geo/query/acc.cgi?acc=GSE183984).
Authors' contributions
Conceptualization: EYT, JEK, YSH, SYK and TWK. Data
curation: BH (annotated the RNA sequencing data), HDK (annotated
the RNA sequencing) and CSJ (scrubbed and maintained the RNA
sequencing data). Formal analysis: EYT, MHK, JHK, BH, HDK, CSJ and
SYK. Investigation: EYT (performed experiment), MK (performed
experiment), YGC (performed experiment), SC (performed experiment)
and JHK (performed experiment). All authors have read and agreed to
the published version of the manuscript. EYT and SYK confirm the
authenticity of all the raw data.
Ethics approval and consent to
participate
A part of the present study (Analysis of patient
samples) was approved by the Institutional Review Board of Asan
Medical Center (approval no. 2011-0511) and was conducted in
accordance with the tenets of the Declaration of Helsinki and Good
Clinical Practice. All participants of the present study provided
written informed consent for the use of their tumor samples for
research purposes.
Patient consent for publication
Not applicable.
Competing interests
The authors declare that they have no competing
interests.
References
|
1
|
Sung H, Ferlay J, Siegel RL, Laversanne M,
Soerjomataram I, Jemal A and Bray F: Global cancer statistics 2020:
GLOBOCAN estimates of incidence and mortality worldwide for 36
cancers in 185 countries. CA Cancer J Clin. 71:209–249. 2021.
View Article : Google Scholar : PubMed/NCBI
|
|
2
|
Venook AP, Niedzwiecki D, Lenz HJ,
Innocenti F, Fruth B, Meyerhardt JA, Schrag D, Greene C, O'Neil BH,
Atkins JN, et al: Effect of first-line chemotherapy combined with
cetuximab or bevacizumab on overall survival in patients with KRAS
wild-type advanced or metastatic colorectal cancer: A randomized
clinical trial. Jama. 317:2392–2401. 2017. View Article : Google Scholar : PubMed/NCBI
|
|
3
|
Kim SY and Kim TW: Current challenges in
the implementation of precision oncology for the management of
metastatic colorectal cancer. ESMO Open. 5:e0006342020. View Article : Google Scholar : PubMed/NCBI
|
|
4
|
Zhao B, Wang L, Qiu H, Zhang M, Sun L,
Peng P, Yu Q and Yuan X: Mechanisms of resistance to anti-EGFR
therapy in colorectal cancer. Oncotarget. 8:3980–4000. 2017.
View Article : Google Scholar : PubMed/NCBI
|
|
5
|
Martinelli E, Ciardiello D, Martini G,
Troiani T, Cardone C, Vitiello PP, Normanno N, Rachiglio AM,
Maiello E, Latiano T, et al: Implementing anti-epidermal growth
factor receptor (EGFR) therapy in metastatic colorectal cancer:
Challenges and future perspectives. Ann Oncol. 31:30–40. 2020.
View Article : Google Scholar : PubMed/NCBI
|
|
6
|
Li QH, Wang YZ, Tu J, Liu CW, Yuan YJ, Lin
R, He WL, Cai SR, He YL and Ye JN: Anti-EGFR therapy in metastatic
colorectal cancer: Mechanisms and potential regimens of drug
resistance. Gastroenterol Rep (Oxf). 8:179–191. 2020. View Article : Google Scholar : PubMed/NCBI
|
|
7
|
Ratner N and Miller SJ: A RASopathy gene
commonly mutated in cancer: The neurofibromatosis type 1 tumour
suppressor. Nat Rev Cancer. 15:290–301. 2015. View Article : Google Scholar : PubMed/NCBI
|
|
8
|
de Bruin EC, Cowell C, Warne PH, Jiang M,
Saunders RE, Melnick MA, Gettinger S, Walther Z, Wurtz A, Heynen
GJ, et al: Reduced NF1 expression confers resistance to EGFR
inhibition in lung cancer. Cancer Discov. 4:606–619. 2014.
View Article : Google Scholar : PubMed/NCBI
|
|
9
|
Woolston A, Khan K, Spain G, Barber LJ,
Griffiths B, Gonzalez-Exposito R, Hornsteiner L, Punta M, Patil Y,
Newey A, et al: Genomic and transcriptomic determinants of therapy
resistance and immune landscape evolution during Anti-EGFR
treatment in colorectal cancer. Cancer Cell. 36:35–50.e39. 2019.
View Article : Google Scholar : PubMed/NCBI
|
|
10
|
Cancer Genome Atlas Research Network, .
Comprehensive genomic characterization of squamous cell lung
cancers. Nature. 489:519–525. 2012. View Article : Google Scholar : PubMed/NCBI
|
|
11
|
Cancer Genome Atlas Network, .
Comprehensive molecular portraits of human breast tumours. Nature.
490:61–70. 2012. View Article : Google Scholar : PubMed/NCBI
|
|
12
|
Krauthammer M, Kong Y, Bacchiocchi A,
Evans P, Pornputtapong N, Wu C, McCusker JP, Ma S, Cheng E, Straub
R, et al: Exome sequencing identifies recurrent mutations in NF1
and RASopathy genes in sun-exposed melanomas. Nat Genet.
47:996–1002. 2015. View Article : Google Scholar : PubMed/NCBI
|
|
13
|
Yap YS, McPherson JR, Ong CK, Rozen SG,
Teh BT, Lee AS and Callen DF: The NF1 gene revisited -from bench to
bedside. Oncotarget. 5:5873–5892. 2014. View Article : Google Scholar : PubMed/NCBI
|
|
14
|
Whittaker SR, Theurillat JP, Van Allen E,
Wagle N, Hsiao J, Cowley GS, Schadendorf D, Root DE and Garraway
LA: A genome-scale RNA interference screen implicates NF1 loss in
resistance to RAF inhibition. Cancer Discov. 3:350–362. 2013.
View Article : Google Scholar : PubMed/NCBI
|
|
15
|
Mendes-Pereira AM, Sims D, Dexter T,
Fenwick K, Assiotis I, Kozarewa I, Mitsopoulos C, Hakas J, Zvelebil
M, Lord CJ and Ashworth A: Genome-wide functional screen identifies
a compendium of genes affecting sensitivity to tamoxifen. Proc Natl
Acad Sci USA. 109:2730–2735. 2012. View Article : Google Scholar : PubMed/NCBI
|
|
16
|
Hölzel M, Huang S, Koster J, Ora I,
Lakeman A, Caron H, Nijkamp W, Xie J, Callens T, Asgharzadeh S, et
al: NF1 is a tumor suppressor in neuroblastoma that determines
retinoic acid response and disease outcome. Cell. 142:218–229.
2010. View Article : Google Scholar : PubMed/NCBI
|
|
17
|
Berg KCG, Eide PW, Eilertsen IA,
Johannessen B, Bruun J, Danielsen SA, Bjørnslett M, Meza-Zepeda LA,
Eknæs M, Lind GE, et al: Multi-omics of 34 colorectal cancer cell
lines-a resource for biomedical studies. Mol Cancer. 16:1162017.
View Article : Google Scholar : PubMed/NCBI
|
|
18
|
Park HJ, Lee SJ, Sohn YB, Jin HS, Han JH,
Kim YB, Yim H and Jeong SY: NF1 deficiency causes Bcl-xL
upregulation in Schwann cells derived from neurofibromatosis type
1-associated malignant peripheral nerve sheath tumors. Int J Oncol.
42:657–666. 2013. View Article : Google Scholar : PubMed/NCBI
|
|
19
|
Schneider CA, Rasband WS and Eliceiri KW:
NIH image to imageJ: 25 years of image analysis. Nat Methods.
9:671–675. 2012. View Article : Google Scholar : PubMed/NCBI
|
|
20
|
Eisenhauer EA, Therasse P, Bogaerts J,
Schwartz LH, Sargent D, Ford R, Dancey J, Arbuck S, Gwyther S,
Mooney M, et al: New response evaluation criteria in solid tumours:
Revised RECIST guideline (version 1.1). Eur J Cancer. 45:228–247.
2009. View Article : Google Scholar : PubMed/NCBI
|
|
21
|
Schuierer S, Carbone W, Knehr J, Petitjean
V, Fernandez A, Sultan M and Roma G: A comprehensive assessment of
RNA-seq protocols for degraded and low-quantity samples. BMC
Genomics. 18:1–13. 2017. View Article : Google Scholar : PubMed/NCBI
|
|
22
|
Andrews S: FastQC: A quality control tool
for high through-put sequence data. Babraham Institute.
(Cambridge). 2010.http://www.bioinformatics.babraham.ac.uk/projects/fastqc/November
11–2019
|
|
23
|
Krueger F: Trim galore: A wrapper tool
around Cutadapt and FastQC to consistently apply quality and
adapter trimming to FastQ files with some extra functionality for
MspI-digested RRBS-type (Reduced Representation Bisufite-Seq)
libraries. Babraham Institute. (Cambridge). 2015.https://www.bioinformatics.babraham.ac.uk/projects/trim_galore/November
11–2019
|
|
24
|
Dobin A, Davis CA, Schlesinger F, Drenkow
J, Zaleski C, Jha S, Batut P, Chaisson M and Gingeras TR: STAR:
Ultrafast universal RNA-seq aligner. Bioinformatics. 29:15–21.
2013. View Article : Google Scholar : PubMed/NCBI
|
|
25
|
Li B and Dewey CN: RSEM: Accurate
transcript quantification from RNA-Seq data with or without a
reference genome. BMC Bioinformatics. 12:3232011. View Article : Google Scholar : PubMed/NCBI
|
|
26
|
Love MI, Huber W and Anders S: Moderated
estimation of fold change and dispersion for RNA-seq data with
DESeq2. Genome Biol. 15:5502014. View Article : Google Scholar : PubMed/NCBI
|
|
27
|
Yu G, Wang LG, Han Y and He QY:
clusterProfiler: An R package for comparing biological themes among
gene clusters. OMICS. 16:284–287. 2012. View Article : Google Scholar : PubMed/NCBI
|
|
28
|
Kanehisa M, Sato Y, Kawashima M, Furumichi
M and Tanabe M: KEGG as a reference resource for gene and protein
annotation. Nucleic Acids Res. 44:D457–D462. 2015. View Article : Google Scholar : PubMed/NCBI
|
|
29
|
Kim JE, Chun SM, Hong YS, Kim KP, Kim SY,
Kim J, Sung CO, Cho EJ, Kim TW and Jang SJ: Mutation burden and I
index for detection of microsatellite instability in colorectal
cancer by targeted next-generation sequencing. J Mol Diagn.
21:241–250. 2018. View Article : Google Scholar : PubMed/NCBI
|
|
30
|
Philpott C, Tovell H, Frayling IM, Cooper
DN and Upadhyaya M: The NF1 somatic mutational landscape in
sporadic human cancers. Hum Genomics. 11:132017. View Article : Google Scholar : PubMed/NCBI
|
|
31
|
Redig AJ, Capelletti M, Dahlberg SE, Sholl
LM, Mach S, Fontes C, Shi Y, Chalasani P and Jänne PA: Clinical and
molecular characteristics of NF1-mutant lung cancer. Clin Cancer
Res. 22:3148–3156. 2016. View Article : Google Scholar : PubMed/NCBI
|
|
32
|
Hayashi T, Desmeules P, Smith RS, Drilon
A, Somwar R and Ladanyi M: RASA1 and NF1 are preferentially
co-mutated and define a distinct genetic subset of
smoking-associated non-small cell lung carcinomas sensitive to MEK
inhibition. Clin Cancer Res. 24:1436–1447. 2018. View Article : Google Scholar : PubMed/NCBI
|
|
33
|
Dischinger PS, Tovar EA, Essenburg CJ,
Madaj ZB, Gardner EE, Callaghan ME, Turner AN, Challa AK, Kempston
T, Eagleson B, et al: NF1 deficiency correlates with estrogen
receptor signaling and diminished survival in breast cancer. NPJ
Breast Cancer. 4:292018. View Article : Google Scholar : PubMed/NCBI
|
|
34
|
Pearson A, Proszek P, Pascual J, Fribbens
C, Shamsher MK, Kingston B, O'Leary B, Herrera-Abreu MT, Cutts RJ,
Garcia-Murillas I, et al: Inactivating NF1 mutations are
enriched in advanced breast cancer and contribute to endocrine
therapy resistance. Clin Cancer Res. 26:608–622. 2020. View Article : Google Scholar : PubMed/NCBI
|
|
35
|
Mei Z, Shao YW, Lin P, Cai X, Wang B, Ding
Y, Ma X, Wu X, Xia Y, Zhu D, et al: SMAD4 and NF1 mutations as
potential biomarkers for poor prognosis to cetuximab-based therapy
in Chinese metastatic colorectal cancer patients. BMC Cancer.
18:4792018. View Article : Google Scholar : PubMed/NCBI
|
|
36
|
Cancer Genome Atlas Network, .
Comprehensive molecular characterization of human colon and rectal
cancer. Nature. 487:330–337. 2012. View Article : Google Scholar : PubMed/NCBI
|
|
37
|
Meng M, Zhong K, Jiang T, Liu Z, Kwan HY
and Su T: The current understanding on the impact of KRAS on
colorectal cancer. Biomed Pharmacother. 140:1117172021. View Article : Google Scholar : PubMed/NCBI
|
|
38
|
McFall T, Diedrich JK, Mengistu M,
Littlechild SL, Paskvan KV, Sisk-Hackworth L, Moresco JJ, Shaw AS
and Stites EC: A systems mechanism for KRAS mutant allele-specific
responses to targeted therapy. Sci Signal. 12:eaaw82882019.
View Article : Google Scholar : PubMed/NCBI
|
|
39
|
Georgiou A, Stewart A, Cunningham D,
Banerji U and Whittaker SR: Inactivation of NF1 promotes resistance
to EGFR inhibition in KRAS/NRAS/BRAFV600 -wild-type
colorectal cancer. Mol Cancer Res. 18:835–846. 2020. View Article : Google Scholar : PubMed/NCBI
|
|
40
|
Bray SM, Lee J, Kim ST, Hur JY, Ebert PJ,
Calley JN, Wulur IH, Gopalappa T, Wong SS, Qian HR, et al: Genomic
characterization of intrinsic and acquired resistance to cetuximab
in colorectal cancer patients. Sci Rep. 9:153652019. View Article : Google Scholar : PubMed/NCBI
|
|
41
|
AACR Project GENIE: Powering precision
medicine through an international consortium. Cancer Discov.
7:818–831. 2017. View Article : Google Scholar : PubMed/NCBI
|
|
42
|
Kandoth C, McLellan MD, Vandin F, Ye K,
Niu B, Lu C, Xie M, Zhang Q, McMichael JF, Wyczalkowski MA, et al:
Mutational landscape and significance across 12 major cancer types.
Nature. 502:333–339. 2013. View Article : Google Scholar : PubMed/NCBI
|
|
43
|
Baeissa HM, Benstead-Hume G, Richardson CJ
and Pearl FM: Mutational patterns in oncogenes and tumour
suppressors. Biochem Soc Trans. 44:925–931. 2016. View Article : Google Scholar : PubMed/NCBI
|
|
44
|
Gutmann DH, Wu YL, Hedrick NM, Zhu Y, Guha
A and Parada LF: Heterozygosity for the neurofibromatosis 1 (NF1)
tumor suppressor results in abnormalities in cell attachment,
spreading and motility in astrocytes. Hum Mol Genet. 10:3009–3016.
2001. View Article : Google Scholar : PubMed/NCBI
|
|
45
|
Brosseau JP, Liao CP, Wang Y, Ramani V,
Vandergriff T, Lee M, Patel A and Ariizumi K: NF1 heterozygosity
fosters de novo tumorigenesis but impairs malignant transformation.
Nat Commun. 9:50142018. View Article : Google Scholar : PubMed/NCBI
|
|
46
|
Guo XE, Ngo B, Modrek AS and Lee WH:
Targeting tumor suppressor networks for cancer therapeutics. Curr
Drug Targets. 15:2–16. 2014. View Article : Google Scholar : PubMed/NCBI
|
|
47
|
Bai RY, Esposito D, Tam AJ, McCormick F,
Riggins GJ, Clapp DW and Staedtke V: Feasibility of using NF1-GRD
and AAV for gene replacement therapy in NF1-associated tumors. Gene
Ther. 26:277–286. 2019. View Article : Google Scholar : PubMed/NCBI
|
|
48
|
Kong N, Tao W, Ling X, Wang J, Xiao Y, Shi
S, Ji X, Shajii A, Gan ST, Kim NY, et al: Synthetic mRNA
nanoparticle-mediated restoration of p53 tumor suppressor
sensitizes p53-deficient cancers to mTOR inhibition. Sci Transl
Med. 11:eaaw15652019. View Article : Google Scholar : PubMed/NCBI
|
|
49
|
El Sharkawi FZ, Ewais SM, Fahmy RH and
Rashed LA: PTEN and TRAIL genes loaded zein nanoparticles as
potential therapy for hepatocellular carcinoma. J Drug Target.
25:513–522. 2017. View Article : Google Scholar : PubMed/NCBI
|
|
50
|
Groelz D, Sobin L, Branton P, Compton C,
Wyrich R and Rainen L: Non-formalin fixative versus formalin-fixed
tissue: A comparison of histology and RNA quality. Exp Mol Pathol.
94:188–194. 2013. View Article : Google Scholar : PubMed/NCBI
|