Introduction
Colorectal cancer (CRC), one of the most common
cancers, was reported as having the third-highest incidence and the
second-highest number of cancer-related deaths among all the
cancers worldwide in 2020 (1). A
total of ~35% of CRC patients are diagnosed with metastasis and
20–50% of non-metastatic CRC patients develop metastasis during
their disease (2,3). Although extensive efforts have been
made to elucidate the molecular pathways associated with CRC
progression, the treatment of metastatic CRC remains challenging.
Therefore, an improved understanding of the molecular mechanisms
underlying CRC metastasis is essential.
The transcription factor Yin Yang 1 (YY1) is a
member of the GLI-Krüppel family of zinc finger DNA-binding
proteins, which is ubiquitously expressed in various tissues
(4,5). YY1 participates in various biological
functions, such as cell proliferation (6–8),
cell cycle (9), apoptosis
(10), invasion (11–13),
migration (7,13), drug resistance (14–16),
and epithelial-mesenchymal transition (17,18).
Therefore, YY1 is critical for tumor progression, and increasing
evidence suggests a close association between YY1 and cancer.
However, the association between YY1 and the
prognosis of patients with cancer is controversial. Certain studies
have demonstrated YY1 expression to be associated with favorable
outcomes (9–11,13,19,20),
whereas others have demonstrated detrimental outcomes (21–26).
These findings suggested that YY1 can activate or suppress target
gene expression, depending on the interactions between the cellular
environment, tissues and cofactors.
The present study aimed to elucidate the oncological
role of YY1 in CRC. The correlation between YY1 expression and
clinicopathological features and outcomes was evaluated in the
patients with CRC. The in vitro experiments investigated the
functions of YY1 in the CRC cells. Furthermore, the underlying
mechanisms of clinical outcomes and in vitro data were
explored by investigating the downstream molecules under YY1.
Materials and methods
Patients and tissue samples
The clinical samples and data were obtained from 143
consecutive patients who underwent surgical resection for CRC
between January 2012 and December 2013. Of these 143 patients, 12
patients underwent resection of liver metastases. Additionally, 66
pairs of CRC and liver metastatic tissues were collected after
resection between January 2005 and December 2014. The patients who
underwent both surgical resection for a primary tumor and initial
hepatectomy at Chiba University Hospital (Chiba, Japan) were
included. The patients who underwent repeat hepatectomy or
two-stage hepatectomy were excluded. The resection for CRC was
performed at the Department of Frontier Surgery, Chiba University
Hospital, and the resection for liver metastasis was performed at
the Department of General Surgery of the same hospital. The present
study was approved (approval no. 2405) by the Ethics Committee of
Chiba University Hospital and written informed consent was obtained
from each patient before surgery.
Immunohistochemistry (IHC)
Briefly, the paraffin-embedded tissue blocks were
cut into 4-µm thick sections and deparaffinized with xylene and
rehydrated with descending ethanol series. The slides were
microwave-treated with 10 mmol/l citrate buffer (pH 6) for 25 min
for antigen retrieval. The endogenous peroxidase activity was
blocked at room temperature (21–26°C) using 3%
H2O2 in methanol for 15 min. After blocking
the non-specific protein binding with 5% skimmed milk at room
temperature (21–26°C) for 10 min, the tissues were incubated
overnight at 4°C with primary antibodies against YY1 (1:500;
product code ab109228), integrin alpha V (ITGAV; 1:500; product
code ab179475) and integrin beta 1 (ITGB1; 1:100; product code
ab52971; all from Abcam). The slides were washed three times with
phosphate-buffered saline and treated with biotinylated secondary
antibody (EnVision™ kit; cat. no. K4003; Dako; Agilent
Technologies, Inc.) for 1 h at 37°C and visualized using 0.01%
3,3-diaminobenzidine, both used according to the manufacturer's
instructions. Finally, the sections were counterstained for 1 min
at room temperature (21–26°C) with hematoxylin and then rehydrated
and sealed.
IHC evaluation of YY1, ITGAV and
ITGB1
Using an inverted light microscope (BX40; Olympus,
Inc.), intranuclear YY1 expression was assessed as the percentage
of positively stained nuclei in the tumor cells relative to the
total number of malignant cells in three positive high-power fields
(magnification, ×400). The expression of ITGAV and ITGB1 was
observed in the cytoplasm of the tumor cells and the staining
intensity varied in each sample. Therefore, the expression was
assessed in three positive high-power fields based on the staining
intensity and the percentage of positively stained cells using the
following scoring system: The staining intensity was scored (0,
negative; 1, weak; 2, moderate; 3, strong staining) and the
percentage of positively stained cells was scored (0, 0; 1, 1–25;
2, 26–50; 3, 51–75; 4, 76–100% positively stained cells) and the
final score was obtained by multiplying the scores together.
Protein expression was independently assessed by two researchers
with a pathologist who was blinded to the clinical information of
the patient. In case of disagreement, the slides were re-examined
until a final consensus was reached.
Cell culture
Human colon cancer cell lines, DLD-1 (ATCC no.
CCL-221) and SW48 (ATCC no. CCL-231), were obtained from the
American Type Culture Collection. DLD-1 cells were cultured at 37°C
in the RPMI-1640 medium (Gibco; Thermo Fisher Scientific, Inc.)
containing 10% FBS (Thermo Fisher Scientific, Inc.), and the SW48
cells were cultured in Leibovitz's L-15 medium (Gibco; Thermo
Fisher Scientific, Inc.) containing 10% FBS.
RNAi transfection
The sequences of the double-stranded small
interfering (si)RNAs used to knock down YY1 were as follows:
siRNA1: Hs_YY1_1, cat. no. SI00051912 (target sequence:
5′-GACGACGACTACATTGAACAA-3′), and siRNA2: Hs_YY1_3, cat. no.
SI00051926 (target sequence: 5′-ATGCCTCTCCTTTGTATATTA-3′) (both
from Qiagen, Inc.). The control cells were treated with negative
control siRNA (AllStars negative control siRNA; cat. no. SI1027280;
Qiagen, Inc.). These siRNAs (final concentration, 5 nmol/l) were
transfected into the DLD-1 and SW48 cells using
Lipofectamine® RNAiMAX (Invitrogen; Thermo Fisher
Scientific, Inc.) at 37°C. The cells were transfected with siRNAs
24 h before each assay and the knockdown efficiency was assessed by
western blotting 72 h after transfection.
Western blot analysis
The whole-cell proteins were purified from the
cultured cell lines using the radioimmunoprecipitation assay (RIPA)
buffer (Sigma-Aldrich; Merck KGaA). The proteins (20 µg) determined
using bicinchoninic acid were loaded onto 5–12.5% XV PANTERA Gels
(cat. no. NXV-2E4HP; DRC Co., Ltd.) and transferred onto a
polyvinylidene difluoride membrane. The membranes were blocked in
5% skimmed milk in 0.1% Tris-buffered saline with Tween-20 (TBS-T)
at a temperature of 21–26°C for 60 min and incubated at 4°C
overnight with the following primary antibodies: YY1 (1:10,000),
ITGAV (1:5,000), ITGB1 (1:10,000) and β-actin (1:5,000; cat. no.
5125S; Cell Signaling Technology, Inc.). After three washes with
0.1% TBS-T, the membranes were incubated with anti-rabbit IgG
horseradish peroxidase-conjugated secondary antibody (1:2,000; cat.
no. sc-2305; Santa Cruz Biotechnology, Inc.) at 37°C for 1 h. The
protein bands were detected using an enhanced chemiluminescence
detection reagent (Chemi-Lumi One Ultra; cat. no. 11644; Nacalai
Tesque, Inc.) and developed using a LAS-4000UV mini luminescent
image analyzer (FUJIFILM Wako Pure Chemical Corporation). The band
intensities from the western blot were quantified using
densitometry and normalized to β-actin using the Adobe Photoshop
version 7.0 (Adobe Systems, Inc.).
Cell proliferation assay
Quantification of the living cells was performed
using Cell Count Reagent SF (cat. no. 07553; Nacalai Tesque, Inc.)
according to the manufacturer's protocol. The DLD-1 and SW48 cells,
which were transfected with siYY1 or siControl, were seeded at the
rate of 1,000 and 3,000 cells/well, respectively, in 96-well
plates. After pre-incubation at 37°C, the 10-µg/well of cell count
reagent was added to each well at 0, 24, 48, 72 and 96 h. After 2 h
of incubation, the absorbance at 450 nm was measured using a
microplate reader.
Gap closure assay
The DLD-1 and SW48 cells were transfected using
siYY1 and siControl 24 h before the gap closure assay. Cells of
appropriate density (2×10⁴ cells/well for DLD-1 and
15×104 cells/well for SW48) and 100% confluence in the
monolayer were seeded into each well of a culture insert (cat. no.
81176; Culture-Insert 2 Well in µ-Dish; Ibidi GmbH). After 24 h of
incubation at 37°C, the culture insert was removed and the dish was
filled with complete medium. Images of the cell-free gaps were
captured using an inverted light microscope (Axio Observer Z1; Carl
Zeiss AG). The images were captured in three fields per well at
each point in time (DLD-1, 24 h; and SW48, 96 h after removing the
culture-insert). The cell-free gaps were measured using ImageJ
software version 1.53k (National Institutes of Health) and the
percentage of cell-free gaps was compared with that at 0 h.
Transwell migration and Matrigel
invasion assay
For the Transwell migration assay, the DLD-1 and
SW48 cells were transfected with siYY1 and siControl 24 h before
the assay. Following overnight starvation, the cells of appropriate
density (1×10⁵ cells/well for DLD-1 and 3×10⁵
cells/well for SW48 in the RPMI-1640 and L-15 medium containing
0.1% FBS, respectively), were seeded in the upper chamber of the
culture inserts with an 8-µm pore-size polyester membrane (Corning,
Inc.). A total of 500 µl of RPMI-1640 or L-15 medium containing 10%
FBS was added to the lower chamber as a chemoattractant. Following
incubation at 37°C for 48 h, the non-migrating cells on the top of
the insert membrane were carefully removed and the migrating cells
on the bottom of the membrane were stained at 37°C for 10 min with
a dye solution containing 0.1% crystal violet and 20% methanol. A
total of 10 images of each membrane were captured and the migratory
cells were counted. For the Transwell invasion assay, the Cell
Biolabs CytoSelect™ 24-well cell invasion assay kit
(cat. no. CBA-110; Cell Biolabs, Inc.) utilizing basement
membrane-coated inserts was used according to the manufacturer's
protocol. The experimental procedure for the invasion assay was
similar to that described for the Transwell migration assay.
RNA preparation and microarray
analysis
Total RNA was isolated from the negative control
siRNA-transfected cells and the siRNA1-transfected cells in two
cell lines, DLD-1 and SW48, using the QIAGEN RNeasy Mini kit (cat.
no. 74104; Qiagen, Inc.). The total RNA quantity and quality were
evaluated and verified using NanoDrop 2000 (Thermo Fisher
Scientific, Inc.) and Bioanalyzer 2100 (Agilent Technologies,
Inc.). The microarray analysis was performed by Macrogen Japan
Corp. Sample labeling and microarray hybridization were performed
according to the Affymetrix Human Clariom™-S Assay
standard protocols. Briefly, cDNA was synthesized using the
GeneChip WT Amplification kit (Thermo Fisher Scientific, Inc.) as
described by the manufacturer. The sense cDNA was then fragmented
and biotin-labeled with (TdT) using the GeneChip WT Terminal
labeling kit (Thermo Fisher Scientific, Inc.). Approximately 5.5 µg
of labeled DNA target was hybridized to the Affymetrix GeneChip
Array at 45°C for 16 h. The hybridized arrays were washed and
stained on a GeneChip Fluidics Station 450 and scanned on a GCS3000
Scanner (Affymetrix; Thermo Fisher Scientific, Inc.). The probe
cell intensity data were computed using the Affymetrix®
GeneChip Command Console® software. The differentially
expressed genes (DEGs) that were upregulated and downregulated in
the siYY1 cells compared with the siControl cells were defined as a
cut-off criterion with fold change ≥1.5.
Gene annotation enrichment analysis,
protein-protein interaction (PPI) network analysis and
identification of hub genes
The gene lists of the upregulated and downregulated
DEGs were uploaded to Metascape (http://metascape.org), and enrichment for Gene
Ontology (27) (http://geneontology.org) and Kyoto Encyclopedia of
Genes and Genomes pathways (28)
(https://www.genome.jp/kegg/pathway.html) were
analyzed. Metascape is a gene annotation and analysis tool that
updates monthly information and the last update was on February 1,
2021. The PPI network analysis and identification of significant
candidate genes were performed using the Cytoscape software version
3.8.2 (http://cytoscape.org). DEGs were
imported into the STRING database (http://string-db.org), and a PPI network was
constructed. The results of the PPI network analysis were
downloaded and visualized using Cytoscape. Finally, the network
analyzer application version 4.4.6 (https://apps.cytoscape.org/apps/networkanalyzer) was
used to calculate the node degree, and the top 10 genes of degree
centrality were identified as the hub genes.
The cancer genome atlas (TCGA)
analysis
Kaplan-Meier survival analysis was performed using
R2 (http://r2platform.com/), which is a
web-based platform for genomics analysis and visualization. TCGA
dataset, including 174 colon adenocarcinoma samples, was analyzed.
The scanned cut-off value was used as the threshold to distinguish
between the high and low expression of YY1.
Identification of the ITGAV and ITGB1
promoter sequences and YY1-specific binding site
The promoter sequences of ITGAV and
ITGB1 were obtained using the database of transcriptional
start sites, DBTSS 10.1 (https://dbtss.hgc.jp). In order to identify the YY1
specific binding site in each promoter region, the sequence was
inserted into JASPAR 2020 (https://www.jaspar.jp) software, which is an open
access database for transcription factor binding sites.
Statistical analysis
The survival curves were calculated using the
Kaplan-Meier method and the significance of differences was
analyzed using the log-rank test. Cancer-specific survival (CSS)
was calculated as the duration from the date of surgery to the date
of death from CRC. Patients were censored if they succumbed from
other causes or if the patients were alive at the time of the final
observation. Disease-free survival (DFS) was calculated from the
date of surgery to the date of recurrence. The time to surgical
failure (TSF) was defined as the period between the date of surgery
and the date of appearance of unresectable recurrence. Multivariate
analysis for survival was performed using the Cox proportional
hazards model, and the odds ratio for distant metastasis was
analyzed using the logistic regression analysis. The correlation
between YY1 and ITGAV or ITGB1 expression was analyzed using the
Pearson's correlation coefficient. Each in vitro experiment
was independently performed at least thrice. The statistical
significance of the results was determined by the unpaired
Student's t-test, Chi-square test, or Fisher's exact test.
P<0.05 was considered to indicate a statistically significant
difference. Data are expressed as the median ± standard deviation
or the mean ± standard error of the mean. The statistical analyses
were performed using JMP PRO 15 software (SAS Institute, Inc.).
Results
Low YY1 expression in the primary
tumor is associated with a poor prognosis
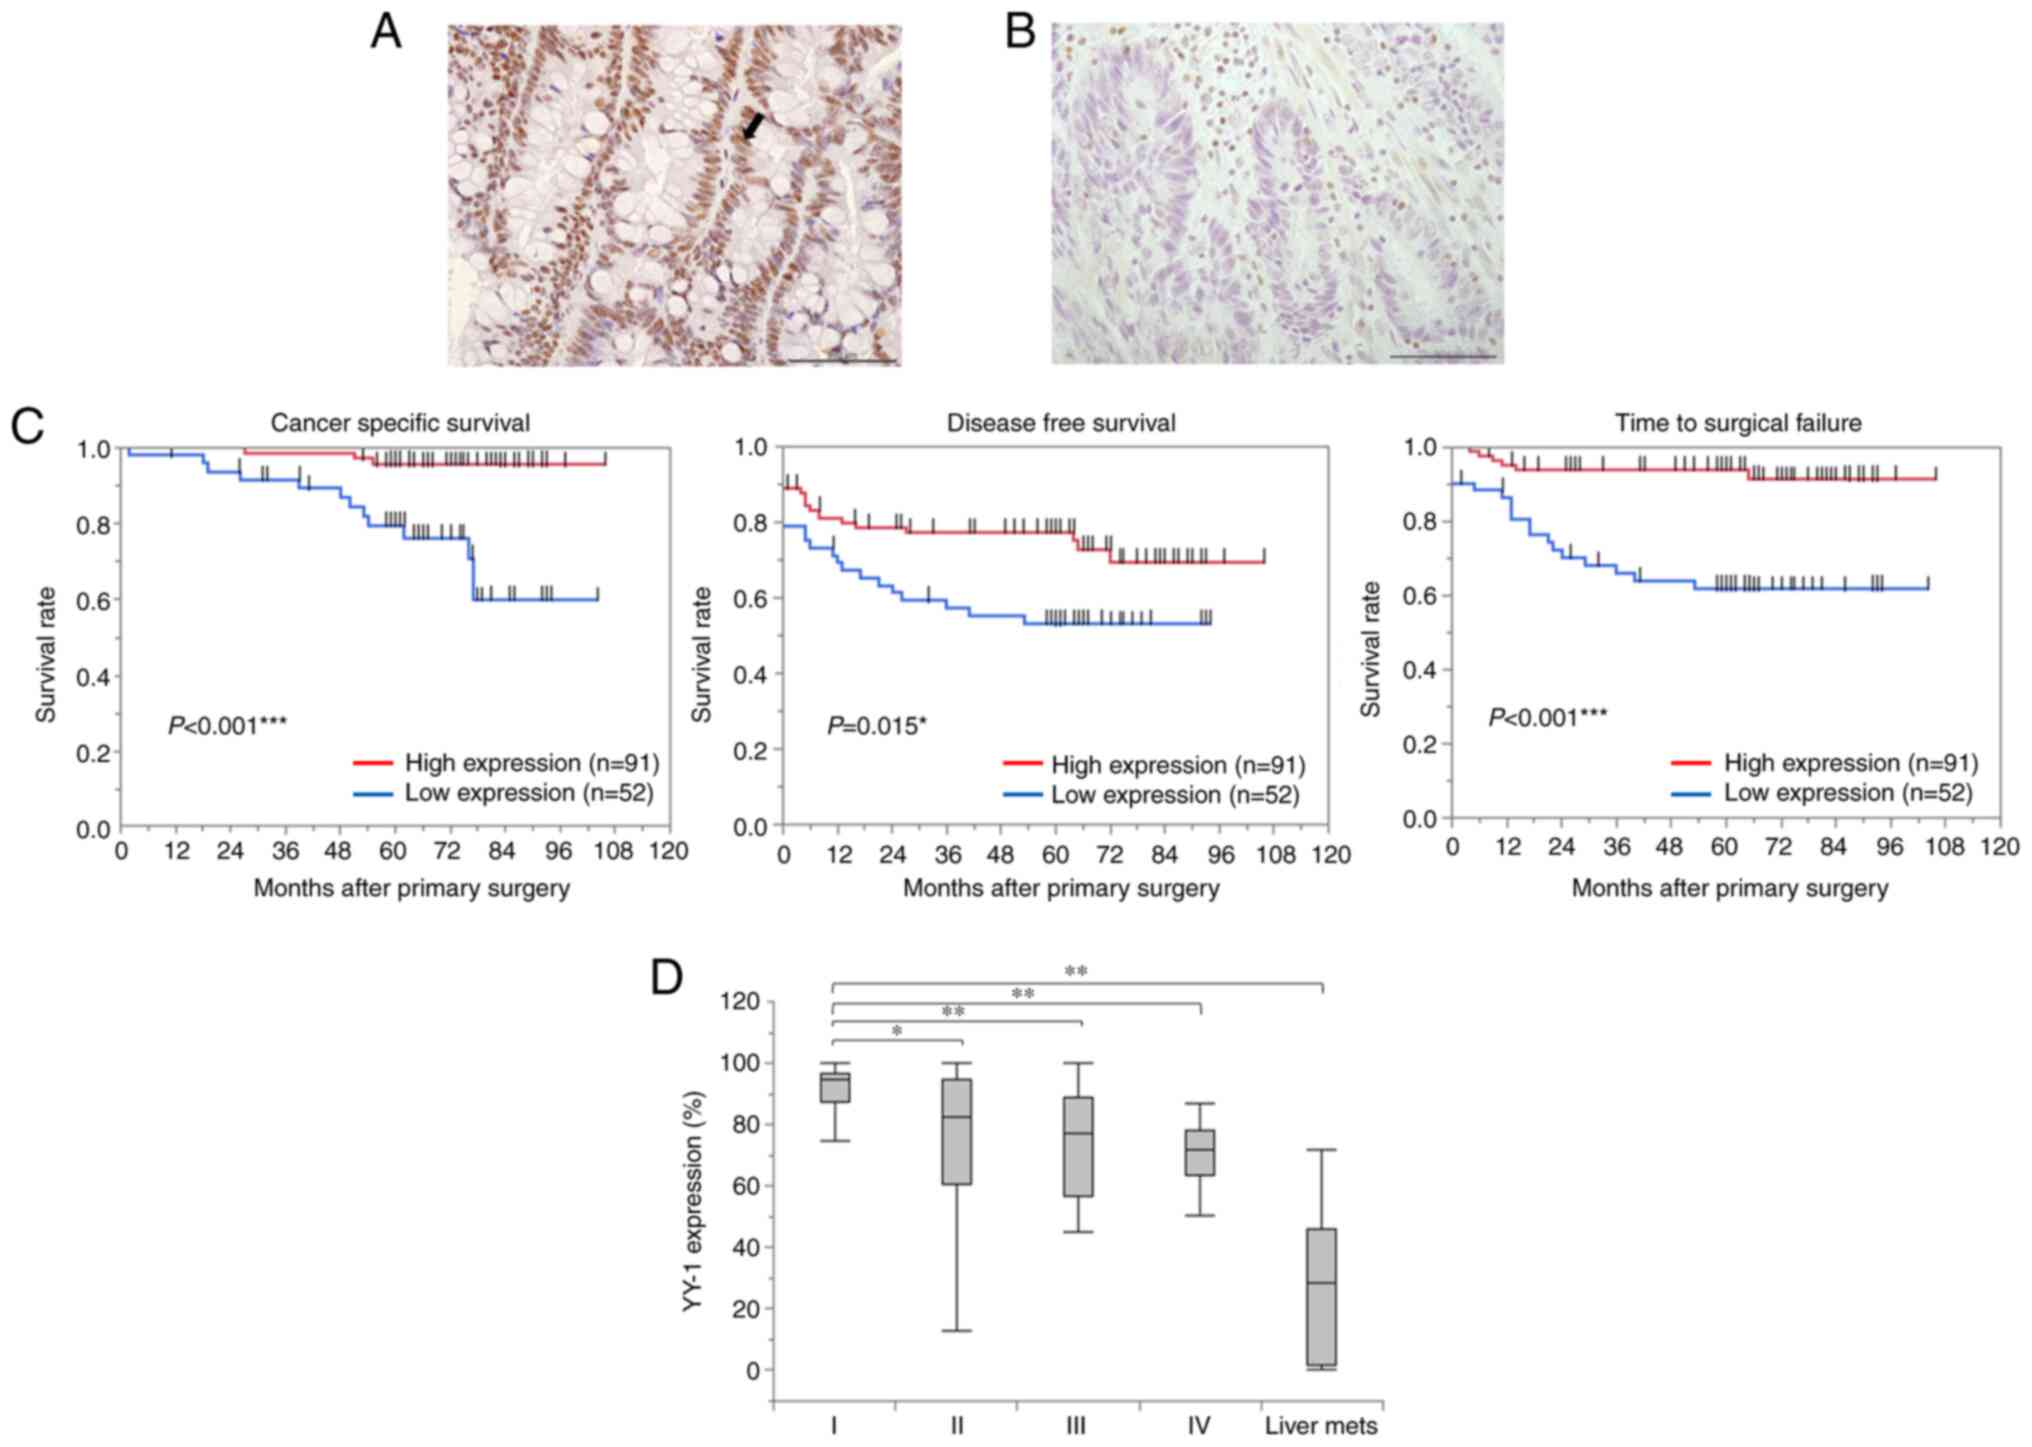
The expression of YY1 was assessed using IHC in 143
primary tumors. YY1 expression was predominantly localized in the
nucleus (Fig. 1A and B). Based on
receiver operating characteristic (ROC) analysis in accordance with
CSS, all tissues were categorized into two groups (cut-off value,
75.2%; AUC, 0.727; P=0.096). Comparison of the clinicopathological
features between the two groups (Table
I) revealed that the low YY1 expression group (<75.2%
YY1-positive cells) was significantly associated with elevated CEA
levels (P=0.048) and CA19-9 levels (P=0.018). The proportion of T4
(P=0.043), Ly 2–3 (P=0.045), V 2–3 (P=0.014), and lymph node
metastasis (P=0.013) was significantly higher in the low YY1 group.
In addition, the low YY1 group had a lower proportion of stage I
and a higher proportion of stage IV than the high YY1 group
(P=0.004). Furthermore, the distant metastases in all patients
(P<0.001) and recurrence after curative resection in patients
with Stage I–III disease (P=0.012) occurred more frequently in the
low YY1 expression group. The Kaplan-Meier analysis revealed that
patients with low YY1 expression had significantly shorter CSS
(P<0.001), DFS (P=0.015), and TSF (P<0.001) (Fig. 1C). Examining the correlation
between TNM stage and YY1 expression in primary tumors revealed
that the YY1 positive rate was significantly lower from stage I to
IV. In addition, YY1 expression in the 12 liver metastases that
occurred in 143 patients was the lowest of any of them (stage I,
89.3±4; stage II, 74±3; stage III, 72.1±3.4; stage IV, 68.5±4.7;
and liver metastasis, 27.5±6.2%) (Fig.
1D). The multivariate analyses revealed a significant
association between low YY1 expression and CSS (HR, 4.54; 95% CI,
1.22-16.88; P=0.024; Table II).
Furthermore, low YY1 expression was an independent risk factor for
distant metastases (odds ratio, 3.09; 95% CI, 1.20-7.95; P=0.020;
Table III). To validate our
data, Kaplan-Meier survival analysis was performed on TCGA 174
colon adenocarcinoma dataset using the R2 Platform. Analysis from
the TCGA dataset also revealed that the patients with low YY1
expression tended to have shorter survival (P=0.068; Fig. S1).
 | Table I.Associations between YY1 expression
and clinicopathological features of patients with colorectal
cancer. |
Table I.
Associations between YY1 expression
and clinicopathological features of patients with colorectal
cancer.
|
| Expression level of
YY-1 |
|
|---|
|
|
|
|
|---|
| Clinicopathological
feature, unit | High (n=91) | Low (n=52) | P-value |
|---|
| Age at primary
surgery, years | 70 (29–91) | 68 (27–91) | 0.309 |
| Sex |
|
| 0.717 |
|
Male | 60 | 32 |
|
|
Female | 31 | 20 |
|
| CEA, ng/ml | 10±5.4 | 27.9±7.2 | 0.048a |
| CA19-9, U/ml | 24.9±47.5 | 214.2±62.8 | 0.018a |
| Site of tumor |
|
| 0.121 |
|
Right | 5 | 7 |
|
|
Left | 86 | 45 |
|
| Neoadjuvant
therapy |
|
| 0.052 |
| + | 6 | 9 |
|
| - | 85 | 43 |
|
| Size of tumor,
mm | 38.5±2.1 | 43.9±2.8 | 0.126 |
| T
stagec |
|
| 0.043a |
|
1-3 | 74 | 34 |
|
| 4 | 17 | 18 |
|
| Degree of
differentiation |
|
| 0.135 |
| tub,
pap | 89 | 48 |
|
| por,
muc | 1 | 3 |
|
| Ly |
|
| 0.045a |
|
0-1 | 82 | 41 |
|
|
2-3 | 8 | 11 |
|
| V |
|
| 0.014a |
|
0-1 | 69 | 29 |
|
|
2-3 | 21 | 23 |
|
| Lymph node
metastasis |
|
| 0.013a |
| + | 29 | 28 |
|
| - | 62 | 24 |
|
| TNM
stagec |
|
| 0.004a |
| I | 26 | 3 |
|
| II | 33 | 19 |
|
|
III | 23 | 18 |
|
| IV | 9 | 12 |
|
| RAS mutation |
|
| >0.999 |
|
Wild | 15 | 14 |
|
|
Mutant | 9 | 8 |
|
| BRAF mutation |
|
| >0.999 |
|
Wild | 23 | 21 |
|
|
Mutant | 1 | 1 |
|
| Adjuvant
chemotherapy |
|
| 0.018a |
| + | 24 | 24 |
|
| - | 67 | 28 |
|
| Occurrence of
distant metastasis (Stage I–IV) |
|
|
<0.001b |
| + | 16 | 23 |
|
| - | 75 | 29 |
|
| Recurrence after
primary surgery (Stage I–IV) |
|
| 0.012a |
| + | 7 | 11 |
|
| - | 75 | 29 |
|
| Table II.Univariate and multivariate analysis
for cancer-specific survival in patients with colorectal
cancer. |
Table II.
Univariate and multivariate analysis
for cancer-specific survival in patients with colorectal
cancer.
|
|
| Univariate | Multivariate |
|---|
|
|
|
|
|
|---|
| Clinicopathological
feature, unit | n | 5-year survival
rate (%) | P-value | HR (95% CI) | P-value |
|---|
| Age at primary
surgery, years |
|
|
|
|
|
|
<65 | 44 | 92.3 | 0.201 |
|
|
|
≧65 | 99 | 84.3 |
|
|
|
| Sex |
|
| 0.102 |
|
|
|
Male | 93 | 84.1 |
|
|
|
|
Female | 51 | 100 |
|
|
|
| CEA, ng/ml |
|
| 0.106 |
|
|
| ≧5 | 58 | 83.9 |
|
|
|
|
<5 | 86 | 93.3 |
|
|
|
| CA19-9, U/ml |
|
| 0.094 |
|
|
|
≧37 | 26 | 74.5 |
|
|
|
|
<37 | 118 | 92.6 |
|
|
|
| Site of primary
tumor |
|
| 0.846 |
|
|
|
Left | 132 | 89.7 |
|
|
|
|
Right | 12 | 88.9 |
|
|
|
| Neoadjuvant
chemotherapy before primary surgery |
|
| 0.140 |
|
|
| + | 16 | 73.3 |
|
|
|
| - | 128 | 91.4 |
|
|
|
| T stageª |
|
| 0.354 |
|
|
| 4 | 35 | 87.5 |
|
|
|
|
1-3 | 109 | 90.2 |
|
|
|
| Degree of
differentiation |
|
| 0.049b | 3.36
(0.64-17.57) | 0.151 |
| por,
muc | 4 | 50 |
|
|
|
| tub,
pap | 137 | 90.8 |
|
|
|
| Ly |
|
|
<0.001c | 4.51
(1.31-15.53) | 0.017b |
|
2-3 | 19 | 58.4 |
|
|
|
|
0-1 | 124 | 94.6 |
|
|
|
| V |
|
| 0.044b | 1.05
(0.36-3.09) | 0.932 |
|
2-3 | 44 | 81.1 |
|
|
|
|
0-1 | 99 | 93.5 |
|
|
|
| Lymph node
metastasis |
|
|
<0.001c | 3.17
(0.58-17.33) | 0.184 |
| + | 57 | 79.5 |
|
|
|
| - | 87 | 96.8 |
|
|
|
| RAS mutation |
|
| 0.380 |
|
|
|
Mutant | 17 | 61.9 |
|
|
|
|
Wild | 29 | 74.1 |
|
|
|
| Adjuvant
chemotherapy after primary surgery |
|
| 0.002d | 1.7
(0.48-5.96) | 0.409 |
| + | 48 | 79.6 |
|
|
|
| - | 96 | 95.6 |
|
|
|
| Expression of YY-1
in primary tumors |
|
|
<0.001b | 4.54
(1.22-16.88) | 0.024b |
|
Low | 51 | 79.7 |
|
|
|
|
High | 91 | 95.6 |
|
|
|
| Table III.Univariate and multivariate analysis
for distant metastasis in patients with colorectal cancer. |
Table III.
Univariate and multivariate analysis
for distant metastasis in patients with colorectal cancer.
|
| Univariate | Multivariate |
|---|
|
|
|
|
|---|
| Clinicopathological
feature, unit | n | P-value | Odds ratio (95%
CI) | P-value |
|---|
| Age at primary
surgery, years |
| 0.075 |
|
|
|
<65 | 44 |
|
|
|
|
≧65 | 99 |
|
|
|
| Sex |
| 0.395 |
|
|
|
Male | 93 |
|
|
|
|
Female | 51 |
|
|
|
| CEA, ng/ml |
|
<0.001a | 5.29
(1.92-14.56) | 0.001b |
| ≧5 | 58 |
|
|
|
|
<5 | 86 |
|
|
|
| CA19-9, U/ml |
| 0.026b | 1.33
(0.42-4.28) | 0.629 |
|
≧37 | 26 |
|
|
|
|
<37 | 118 |
|
|
|
| Site of primary
tumor |
| 0.279 |
|
|
|
Left | 132 |
|
|
|
|
Right | 12 |
|
|
|
| Neoadjuvant
chemotherapy before primary surgery |
| 0.146 |
|
|
| + | 16 |
|
|
|
| - | 128 |
|
|
|
| T
staged |
| 0.008c | 1.63
(0.61-4.43) | 0.332 |
| 4 | 35 |
|
|
|
|
1-3 | 109 |
|
|
|
| Degree of
differentiation |
| 0.338 |
|
|
| por,
muc | 4 |
|
|
|
| tub,
pap | 137 |
|
|
|
| Ly |
|
<0.001a | 3.97
(1.1-14.35) | 0.036b |
|
2-3 | 19 |
|
|
|
|
0-1 | 124 |
|
|
|
| V |
| 0.024b | 1.55
(0.56-4.25) | 0.398 |
|
2-3 | 44 |
|
|
|
|
0-1 | 99 |
|
|
|
| Lymph node
metastasis |
|
<0.001a | 3.09
(1.15-8.33) | 0.027b |
| + | 57 |
|
|
|
| - | 87 |
|
|
|
| RAS mutation |
| 0.213 |
|
|
|
Mutant | 17 |
|
|
|
|
Wild | 29 |
|
|
|
| Adjuvant
chemotherapy after primary surgery |
| 0.069 |
|
|
| + | 48 |
|
|
|
| - | 96 |
|
|
|
| Expression of YY-1
in primary tumors |
|
<0.001a | 3.09
(1.2-7.95) | 0.020b |
|
Low | 51 |
|
|
|
|
High | 91 |
|
|
|
Low YY1 expression in the primary
tumors with liver metastases is associated with poor prognosis
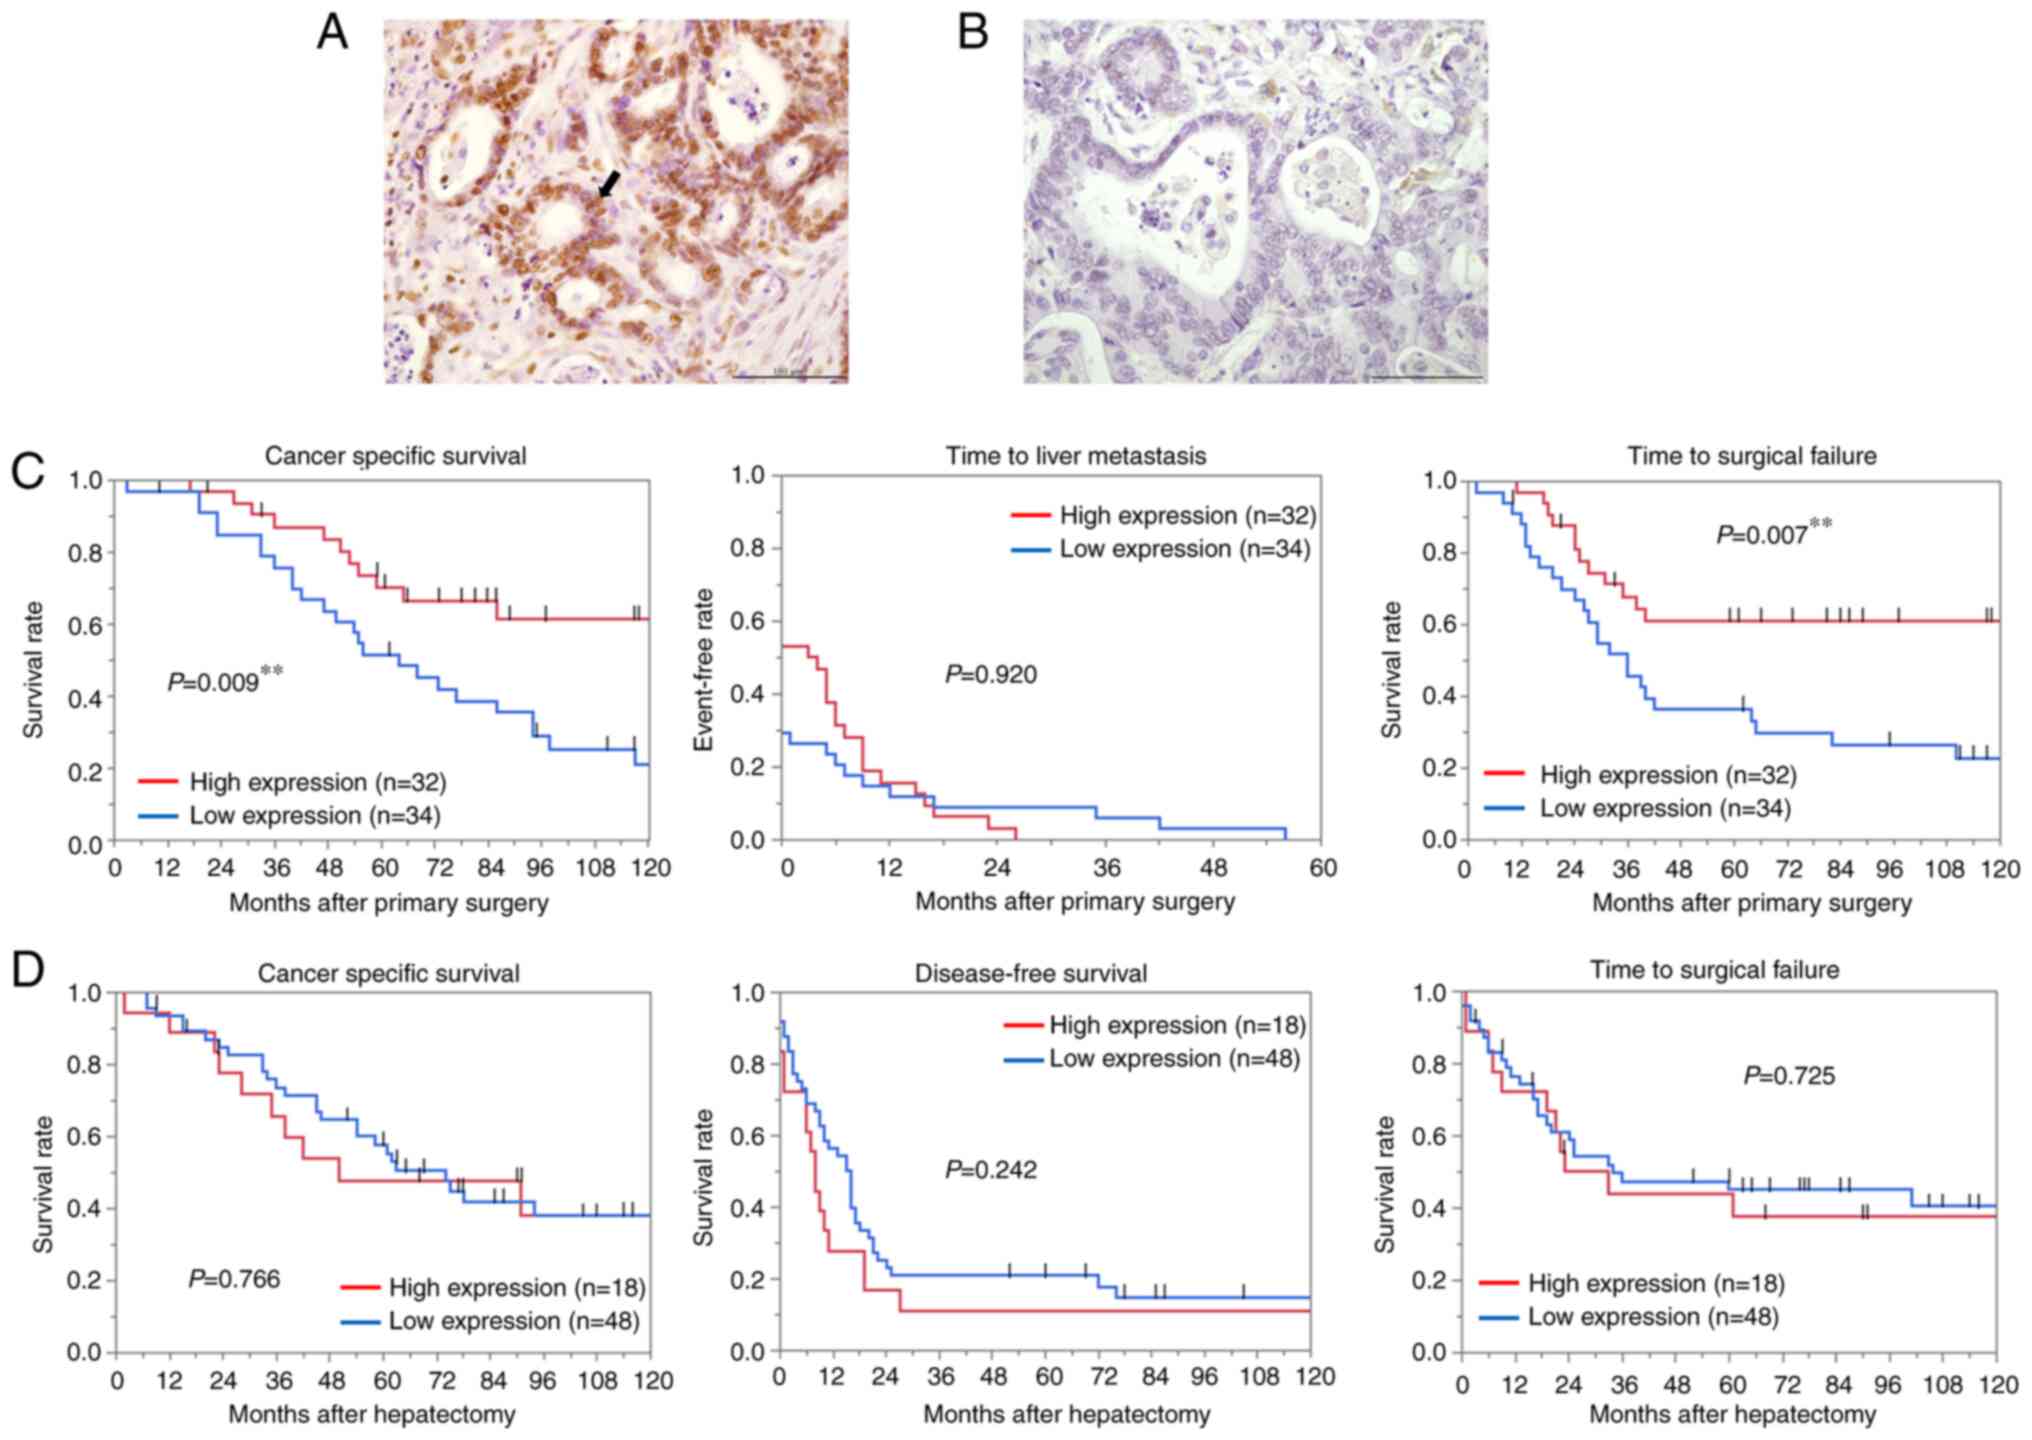
YY1 protein expression in 66 paired tissues of CRC
and liver metastases was examined by IHC. YY1 expression in liver
metastases was predominantly localized in the nucleus as well as in
primary CRC (Fig. 2A and B). The
YY1 positive rate of the nucleus was calculated using the same
protocol as aforementioned, and patients were divided into two
groups (cut-off value, 52.9%; AUC, 0.703; P=0.006). Analysis of the
association between YY1 expression in primary tumors and
clinicopathological features (Table
IV) revealed that low YY1 expression (<52.9% YY1-positive
cells) was significantly associated with elevated CEA levels
(P=0.045), multiple liver metastases (P=0.004), and major
hepatectomy (P=0.013). In addition, the rate of extrahepatic
metastases was also significantly higher in the patients with low
YY1 expression (P=0.024). Low YY1 expression was significantly
associated with shorter CSS (P=0.009) and TSF (P=0.007) (Fig. 2C). Multivariate analysis revealed
that low YY1 expression was significantly associated with CSS (HR,
2.40; 95% CI, 1.09-5.31; P=0.030; Table V). The IHC of the metastatic liver
tissues revealed no significant correlation between YY1 and the
clinicopathological features, in contrast to the results in the
primary tumors (Table VI).
Furthermore, no significant relationship was observed between YY1
expression and patient survival after hepatectomy (Fig. 2D).
| Table IV.Associations between YY1 expression
in primary tumors and clinicopathological features of patients who
developed liver metastasis. |
Table IV.
Associations between YY1 expression
in primary tumors and clinicopathological features of patients who
developed liver metastasis.
|
| Expression level of
YY-1 in primary tumor |
|
|---|
|
|
|
|
|---|
| Clinicopathological
feature, unit | High (n=32) | Low (n=34) | P-value |
|---|
| Age at primary
surgery, years | 69 (46–81) | 69 (50–82) | 0.925 |
| Sex |
|
| 0.797 |
|
Male | 22 | 22 |
|
|
Female | 10 | 12 |
|
| CEA before primary
surgery, ng/ml | 39.9±180.5 | 553.5±175.1 | 0.045a |
| CA19-9 before
primary surgery, U/ml | 51.8±394.6 | 885.5±382.8 | 0.134 |
| Site of tumor |
|
| 0.057 |
|
Right | 13 | 6 |
|
|
Left | 19 | 28 |
|
| Neoadjuvant therapy
before primary surgery |
|
| 0.493 |
| + | 0 | 2 |
|
| - | 32 | 32 |
|
| T
stagec |
|
| 0.145 |
|
1-3 | 21 | 16 |
|
| 4 | 11 | 18 |
|
| Degree of
differentiation |
|
| >0.999 |
| tub,
pap | 30 | 32 |
|
| por,
muc | 2 | 2 |
|
| Ly |
|
| 0.748 |
|
0-1 | 26 | 29 |
|
|
2-3 | 6 | 5 |
|
| V |
|
| 0.631 |
|
0-1 | 14 | 17 |
|
|
2-3 | 18 | 17 |
|
| Lymph node
metastasis |
|
| 0.624 |
| + | 20 | 19 |
|
| - | 12 | 15 |
|
| TNM
stagec |
|
| 0.146 |
| I | 1 | 0 |
|
| II | 7 | 8 |
|
|
III | 7 | 2 |
|
| IV | 17 | 24 |
|
| RAS mutation |
|
| 0.128 |
|
Wild | 7 | 11 |
|
|
Mutant | 8 | 3 |
|
| BRAF mutation |
|
| >0.999 |
|
Wild | 14 | 11 |
|
|
Mutant | 1 | 0 |
|
| Adjuvant
chemotherapy |
|
| >0.999 |
| + | 5 | 5 |
|
| - | 27 | 29 |
|
| Interval to liver
metastasis, months | 5.5±1.9 | 5.6±1.8 | 0.973 |
| Timing of
metastasis |
|
| 0.079 |
|
Synchronous | 15 | 24 |
|
|
Metachronous | 17 | 10 |
|
| Number of liver
metastatic tumors | 2.5±0.5 | 3.3±0.5 | 0.252 |
|
Solitary/Multiple | 17/15 | 6/28 | 0.004b |
| Size of largest
liver metastatic tumor, cm | 3.5±0.4 | 4±0.4 | 0.461 |
| Site of liver
metastasis |
|
| 0.145 |
|
Unilateral | 21 | 16 |
|
|
Bilateral | 11 | 18 |
|
| Hepatectomy |
|
| 0.013a |
|
Minor | 31 | 25 |
|
|
Major | 1 | 9 |
|
| H factor |
|
| 0.082 |
| H1 | 25 | 18 |
|
| H2 | 7 | 15 |
|
| H3 | 0 | 1 |
|
| Metastasis other
than liver |
|
| 0.024a |
| + | 2 | 10 |
|
| - | 30 | 24 |
|
| Table V.Univariate and multivariate analysis
for cancer-specific survival in patients with liver metastases. |
Table V.
Univariate and multivariate analysis
for cancer-specific survival in patients with liver metastases.
|
|
|
| Univariate | Multivariate |
|---|
|
|
|
|
|
|
|---|
| Clinicopathological
feature, unit | n | 5-year survival
(%) | P-value | HR (95% CI) | P-value |
|---|
| Age at primary
surgery, years |
|
|
|
|
|
|
<65 | 22 |
| 0.823 |
|
|
|
≧65 | 44 |
|
|
|
|
| Sex |
|
| 0.676 |
|
|
|
Male | 22 | 54.6 |
|
|
|
|
Female | 44 | 63.9 |
|
|
|
| CEA before primary
surgery, ng/ml |
|
| 0.242 |
|
|
| ≧5 | 48 | 58.8 |
|
|
|
|
<5 | 18 | 65.5 |
|
|
|
| CA19-9 before
primary surgery, U/ml |
|
| 0.296 |
|
|
|
≧37 | 23 | 52.6 |
|
|
|
|
<37 | 43 | 64.5 |
|
|
|
| Site of primary
tumor |
|
| 0.033a | 1.54
(0.65-3.65) | 0.332 |
|
Left | 47 | 53.5 | 0.033a | 1.54
(0.65-3.65) | 0.332 |
|
Right | 19 | 78.6 |
|
|
|
| T
stagec |
|
| 0.558 |
|
|
| 4 | 29 | 54.6 |
|
|
|
|
1-3 | 37 | 64.9 |
|
|
|
| Degree of
differentiation |
|
| 0.695 |
|
|
| tub,
pap | 62 | 59.6 |
|
|
|
| por,
muc | 4 | 75 |
|
|
|
| Ly |
|
| 0.870 |
|
|
|
2-3 | 11 | 71.6 |
|
|
|
|
0-1 | 55 | 58.6 |
|
|
|
| V |
|
| 0.120 |
|
|
|
2-3 | 35 | 50.6 |
|
|
|
|
0-1 | 31 | 71 |
|
|
|
| Lymph node
metastasis |
|
| 0.004b | 3.21
(1.4-7.35) | 0.006b |
| + | 39 | 51.3 |
|
|
|
| - | 27 | 75.4 |
|
|
|
| RAS mutation |
|
| 0.843 |
|
|
|
Mutant | 11 | 50.5 |
|
|
|
|
Wild | 18 | 55.6 |
|
|
|
| Adjuvant
chemotherapy after primary surgery |
|
| 0.240 |
|
|
| + | 10 | 50 |
|
|
|
| - | 56 | 62.5 |
|
|
|
| Timing of liver
metastasis |
|
| 0.221 |
|
|
|
Synchronous | 39 | 56.9 |
|
|
|
|
Metachronous | 27 | 65.8 |
|
|
|
| Metastasis other
than liver |
|
|
|
|
|
| + | 12 | 41.7 | 0.063 |
|
|
| - | 54 | 65 |
|
|
|
| Number of liver
metastasis |
|
| 0.225 |
|
|
|
Multiple | 43 | 54.8 |
|
|
|
|
Solitary | 23 | 71.2 |
|
|
|
| Size of largest
liver metastatic tumor, cm |
|
| 0.308 |
|
|
| ≧5 | 13 | 50.4 |
|
|
|
|
<5 | 53 | 62.9 |
|
|
|
| Hepatectomy |
|
| 0.071 |
|
|
|
Major | 10 | 44.4 |
|
|
|
|
Minor | 56 | 63.2 |
|
|
|
| Surgical margin of
liver metastasis |
|
| 0.049a | 1.20
(0.6-2.43) | 0.606 |
|
R1-2 | 31 | 52 |
|
|
|
| R0 | 35 | 67.9 |
|
|
|
| H factor |
|
| 0.023a | 1.62
(0.81-3.24) | 0.171 |
|
H2-H3 | 23 | 38.6 |
|
|
|
| H1 | 43 | 71.6 |
|
|
|
| Expression of YY-1
in primary tumors |
|
| 0.009b | 2.4
(1.09-5.31) | 0.030a |
|
| 34 | 51.6 |
|
|
|
|
| 32 | 72.3 |
|
|
|
| Table VI.Associations between YY1 expression
in liver metastasis and clinicopathological features. |
Table VI.
Associations between YY1 expression
in liver metastasis and clinicopathological features.
|
| Expression level of
YY-1 in liver metastasis |
|
|---|
|
|
|
|
|---|
| Clinicopathological
feature, unit | High (n=18) | Low (n=48) | P-value |
|---|
| Age at primary
surgery, years | 67 (46–81) | 69 (48–84) | 0.989 |
| Sex |
|
| 0.770 |
|
Male | 13 | 31 |
|
|
Female | 5 | 17 |
|
| CEA before
hepatectomy, ng/ml | 80.5±294.3 | 357±180.2 | 0.426 |
| CA19-9 before
hepatectomy, U/ml | 281.9±839.1 | 637.6±513.9 | 0.692 |
| Timing of
metastasis |
|
| 0.167 |
|
Synchronous | 8 | 31 |
|
|
Metachronous | 10 | 17 |
|
| Interval to liver
metastasis, months | 4.6±2.5 | 5.9±1.5 | 0.664 |
| Neoadjuvant
chemotherapy before hepatectomy |
|
| 0.751 |
| + | 5 | 11 |
|
| - | 13 | 1 |
|
| Number of liver
metastatic tumors | 2.6±0.6 | 3.1±0.4 | 0.499 |
|
Solitary/Multiple | 8/10 | 15/33 | 0.388 |
| Size of largest
liver metastatic tumor, cm | 3.3±0.6 | 3.9±0.4 | 0.419 |
| H factor |
|
| >0.999 |
| H1 | 12 | 31 |
|
| H2 | 6 | 16 |
|
| H3 | 0 | 1 |
|
| Metastasis other
than liver |
|
| 0.722 |
| + | 4 | 8 |
|
| - | 14 | 40 |
|
| Hepatectomy |
|
| 0.264 |
|
Minor | 17 | 39 |
|
|
Major | 1 | 9 |
|
| Resection
margin |
|
| 0.758 |
| R0 | 9 | 26 |
|
| R1 | 5 | 15 |
|
| R2 | 4 | 7 |
|
| Adjuvant
chemotherapy after hepatectomy |
|
| 0.528 |
| + | 12 | 37 |
|
| - | 6 | 11 |
|
| Recurrence after
hepatectomy (all organs) |
|
| 0.488 |
| + | 16 | 38 |
|
| - | 2 | 10 |
|
| Intrahepatic
recurrence after hepatectomy |
|
| 0.586 |
| + | 11 | 25 |
|
| - | 7 | 23 |
|
| Number of recurrent
liver tumors | 2.8±0.7 | 2.8±0.5 | 0.948 |
| Recurrence in
multiple organs |
|
| >0.999 |
| + | 2 | 6 |
|
| - | 16 | 42 |
|
| Repeat resection
(all organs) |
|
| 0.243 |
| + | 11 | 19 |
|
| - | 5 | 19 |
|
| Repeat
hepatectomy |
|
| >0.999 |
| + | 5 | 10 |
|
| - | 6 | 15 |
|
Knockdown of YY1 promotes cell
migration and invasion
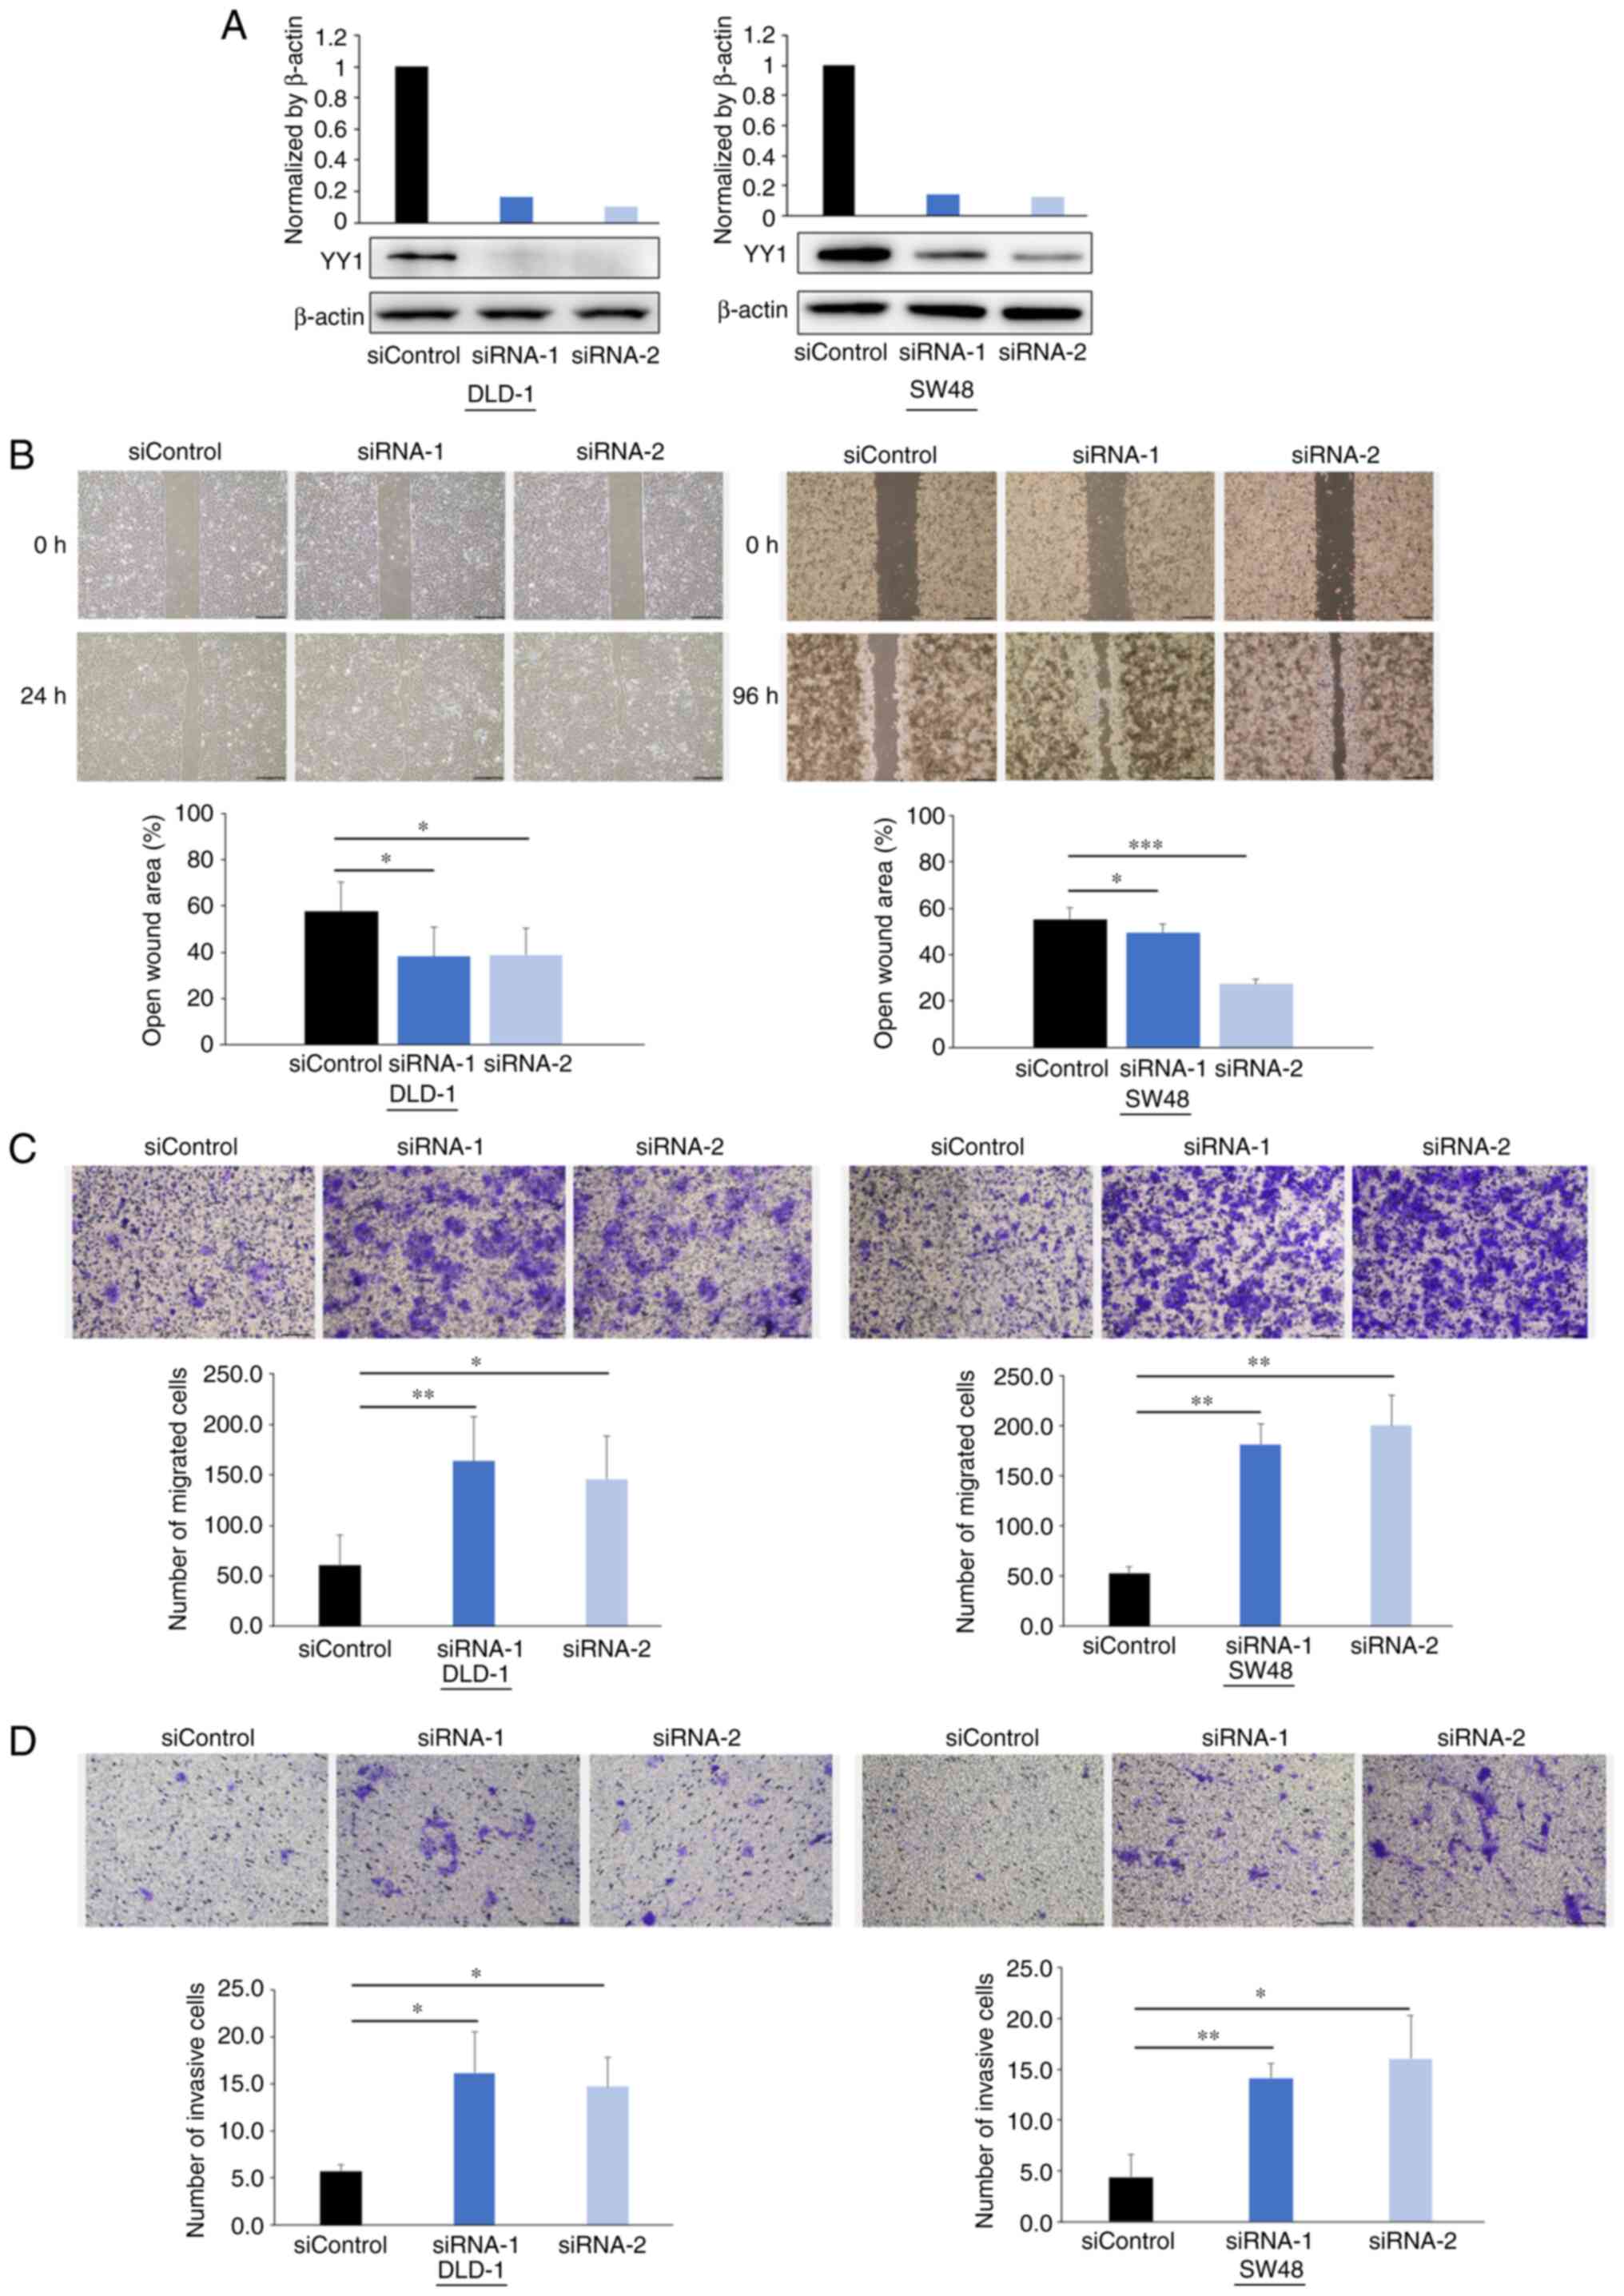
The in vitro experiments were performed to
elucidate the effect of YY1 on the migration and invasion abilities
of CRC cells since the clinical data indicated that YY1 may play a
critical role in CRC metastasis. YY1 protein expression was knocked
down using siRNAs, as revealed in Fig.
3A.
The wound healing assays demonstrated that the
cell-free gaps in the YY1-knockdown cells were significantly
reduced compared with those in the control cells (Fig. 3B). The Transwell migration assays
demonstrated that YY1 knockdown significantly increased the number
of migratory cells in both cell lines (Fig. 3C). The Matrigel invasion assays
demonstrated that YY1 knockdown significantly increased the number
of invasive cells in both cell lines (Fig. 3D).
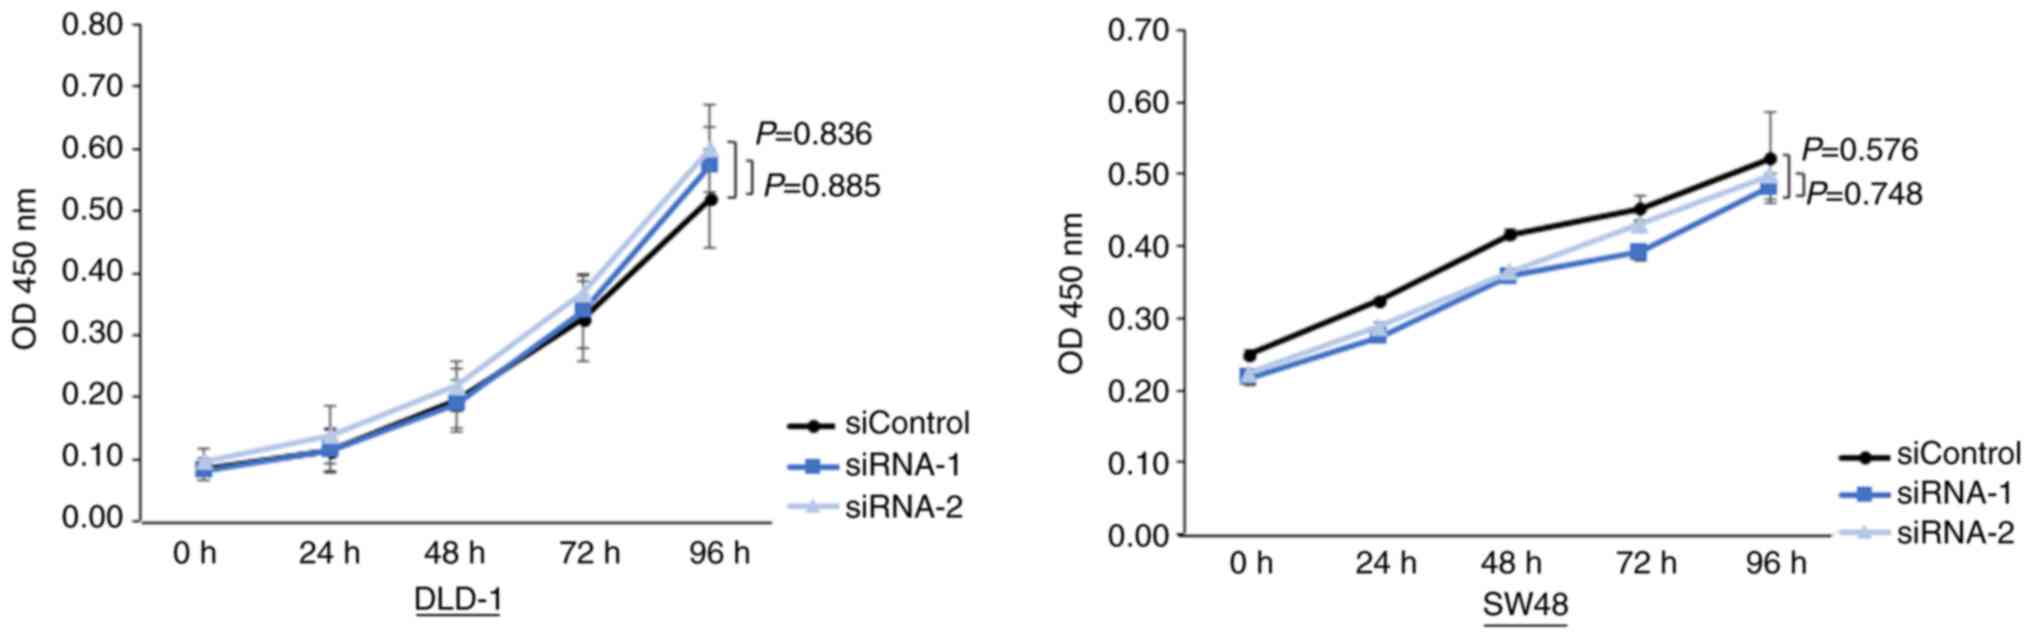
Knockdown of YY1 does not alter the
cell proliferation
Subsequently, the cell proliferation assays were
performed. The assays revealed that cell proliferation was not
different between the YY1-knockdown cells and control cells
(Fig. 4).
Gene enrichment analysis and
identification of the key downstream genes regulated by YY1
To investigate downstream genes that may be
regulated by YY1, a cDNA microarray assay was performed. DEGs
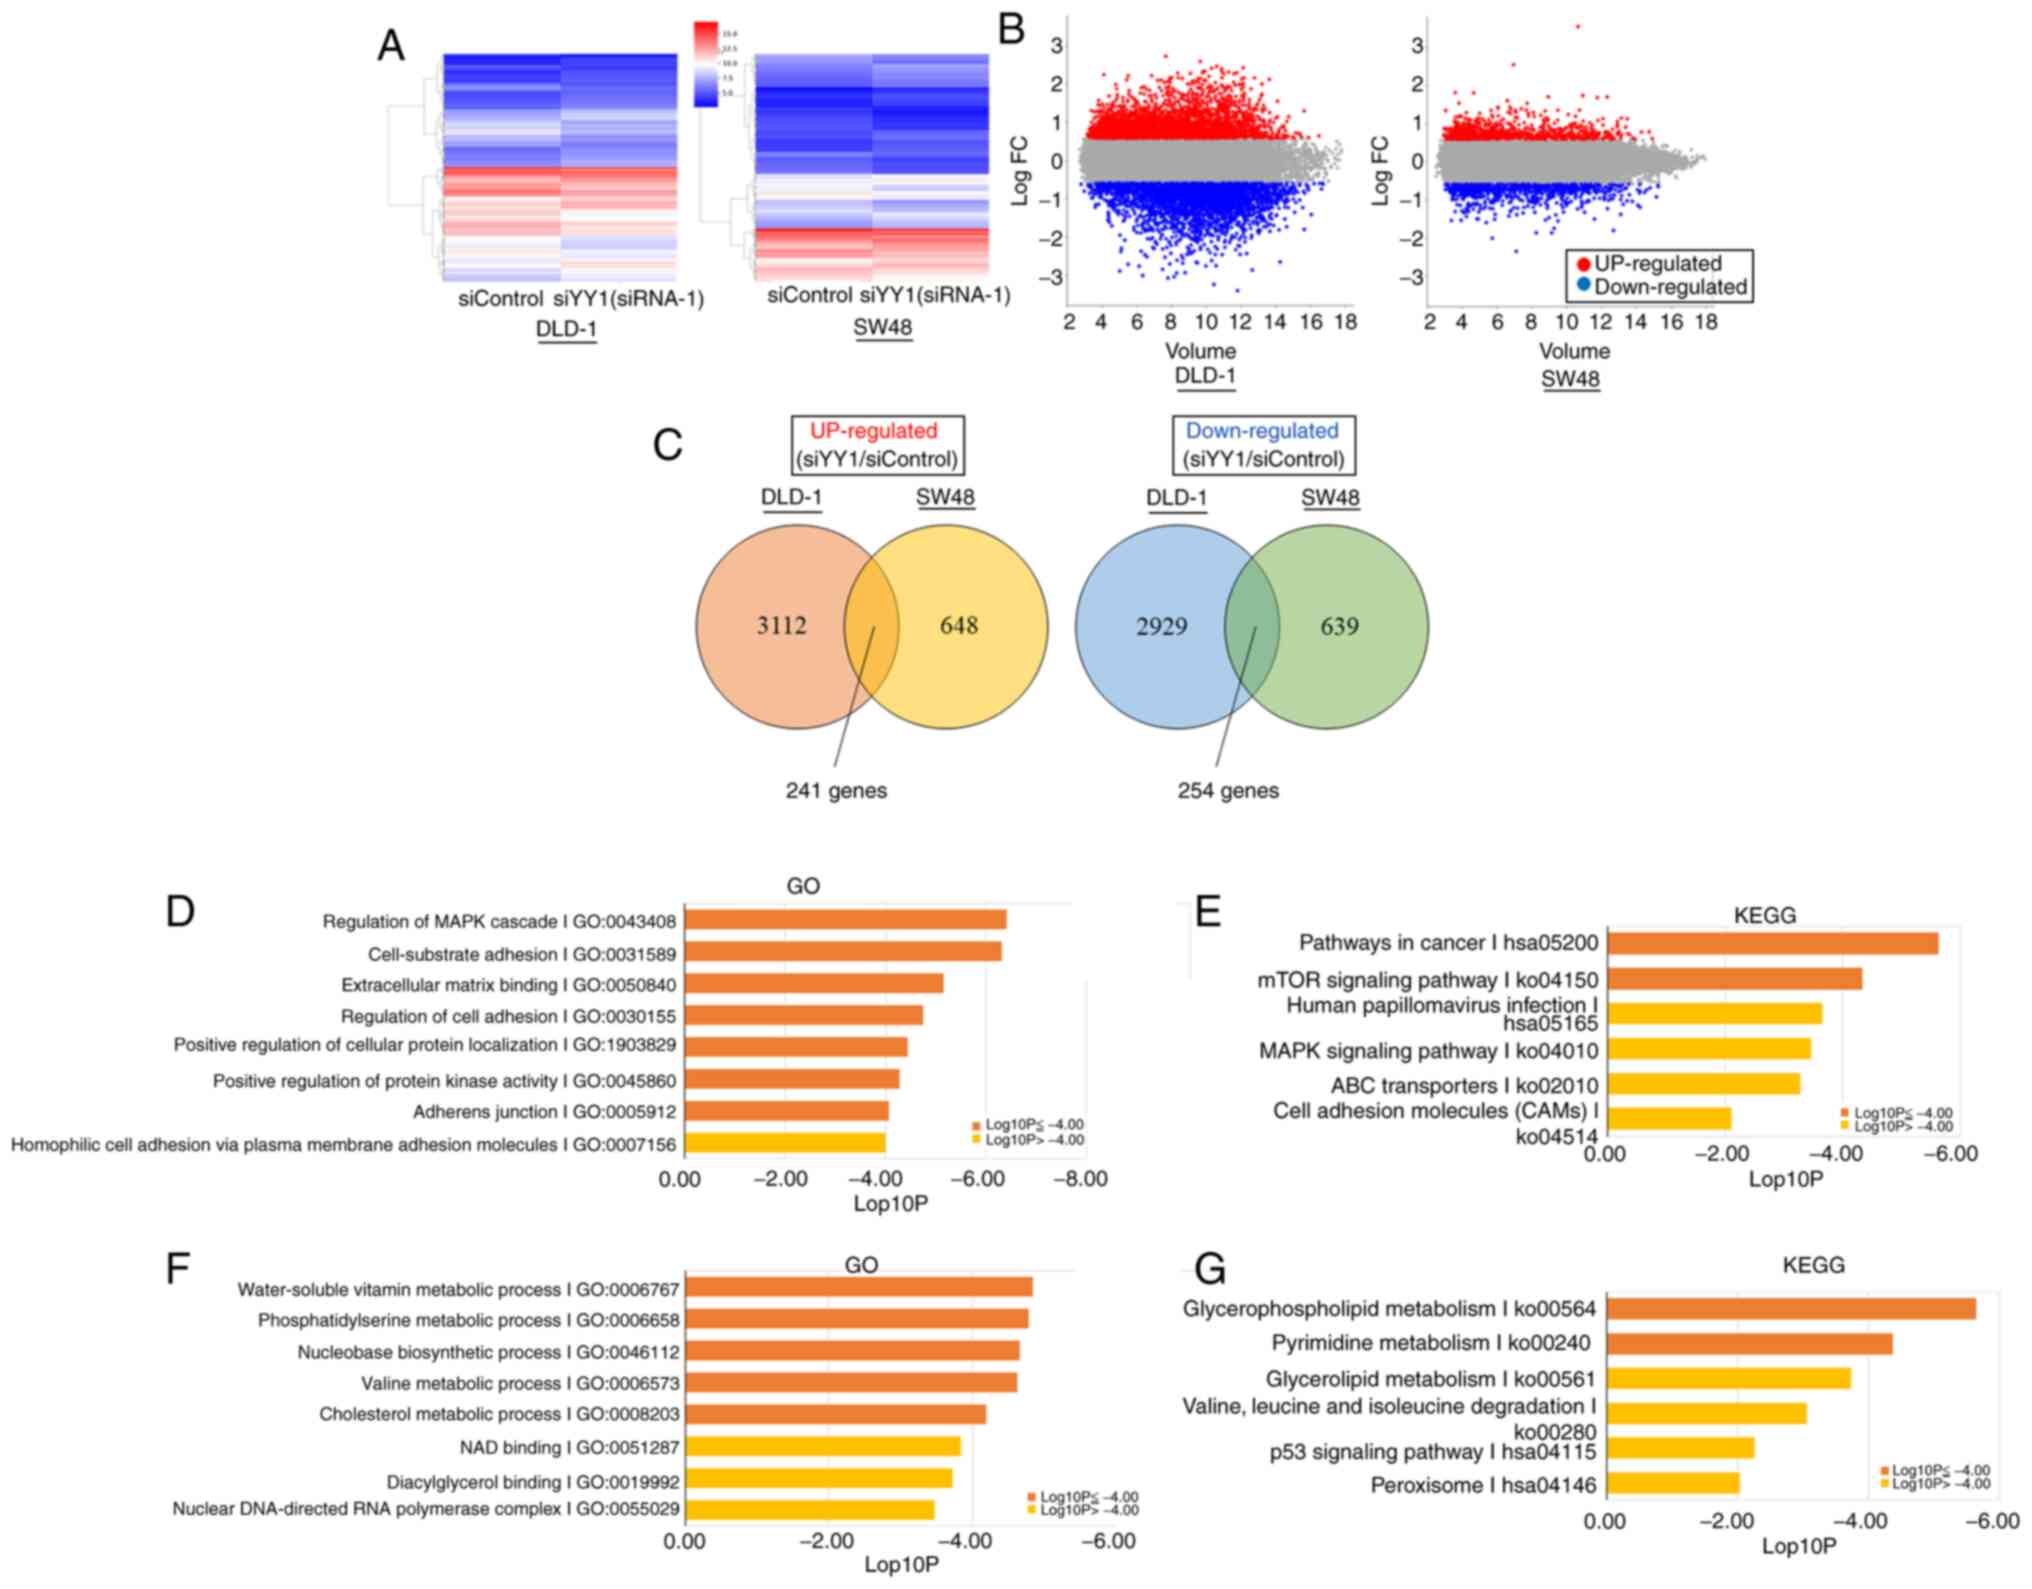
between the YY1-knockdown and control cells are shown in Fig. 5A and B. A total of 241 genes were
revealed to be commonly upregulated, and 254 genes to be commonly
downregulated in DLD-1 and SW48 cell lines (Fig. 5C).
Among the upregulated DEGs, the genes involved in
the ‘MAPK signaling pathway’, ‘cell-substrate adhesion’,
‘extracellular matrix binding’, ‘regulation of cell adhesion’,
‘positive regulation of cellular protein localization’, ‘positive
regulation of protein kinase activity’, ‘adherens junction’,
‘pathways in cancer’ and the ‘mTOR signaling pathway’ were
significantly enriched (Fig. 5D and
E). In downregulated DEGs, genes involved in the ‘nucleobase
biosynthetic process’, the ‘metabolic processes of water-soluble
vitamins’, ‘phosphatidylserine’, ‘valine’, ‘cholesterol’,
‘glycerophospholipids’ and ‘pyrimidine’ were significantly enriched
(Fig. 5F and G). The list of genes
contained in each term is presented in Tables SI and SII.
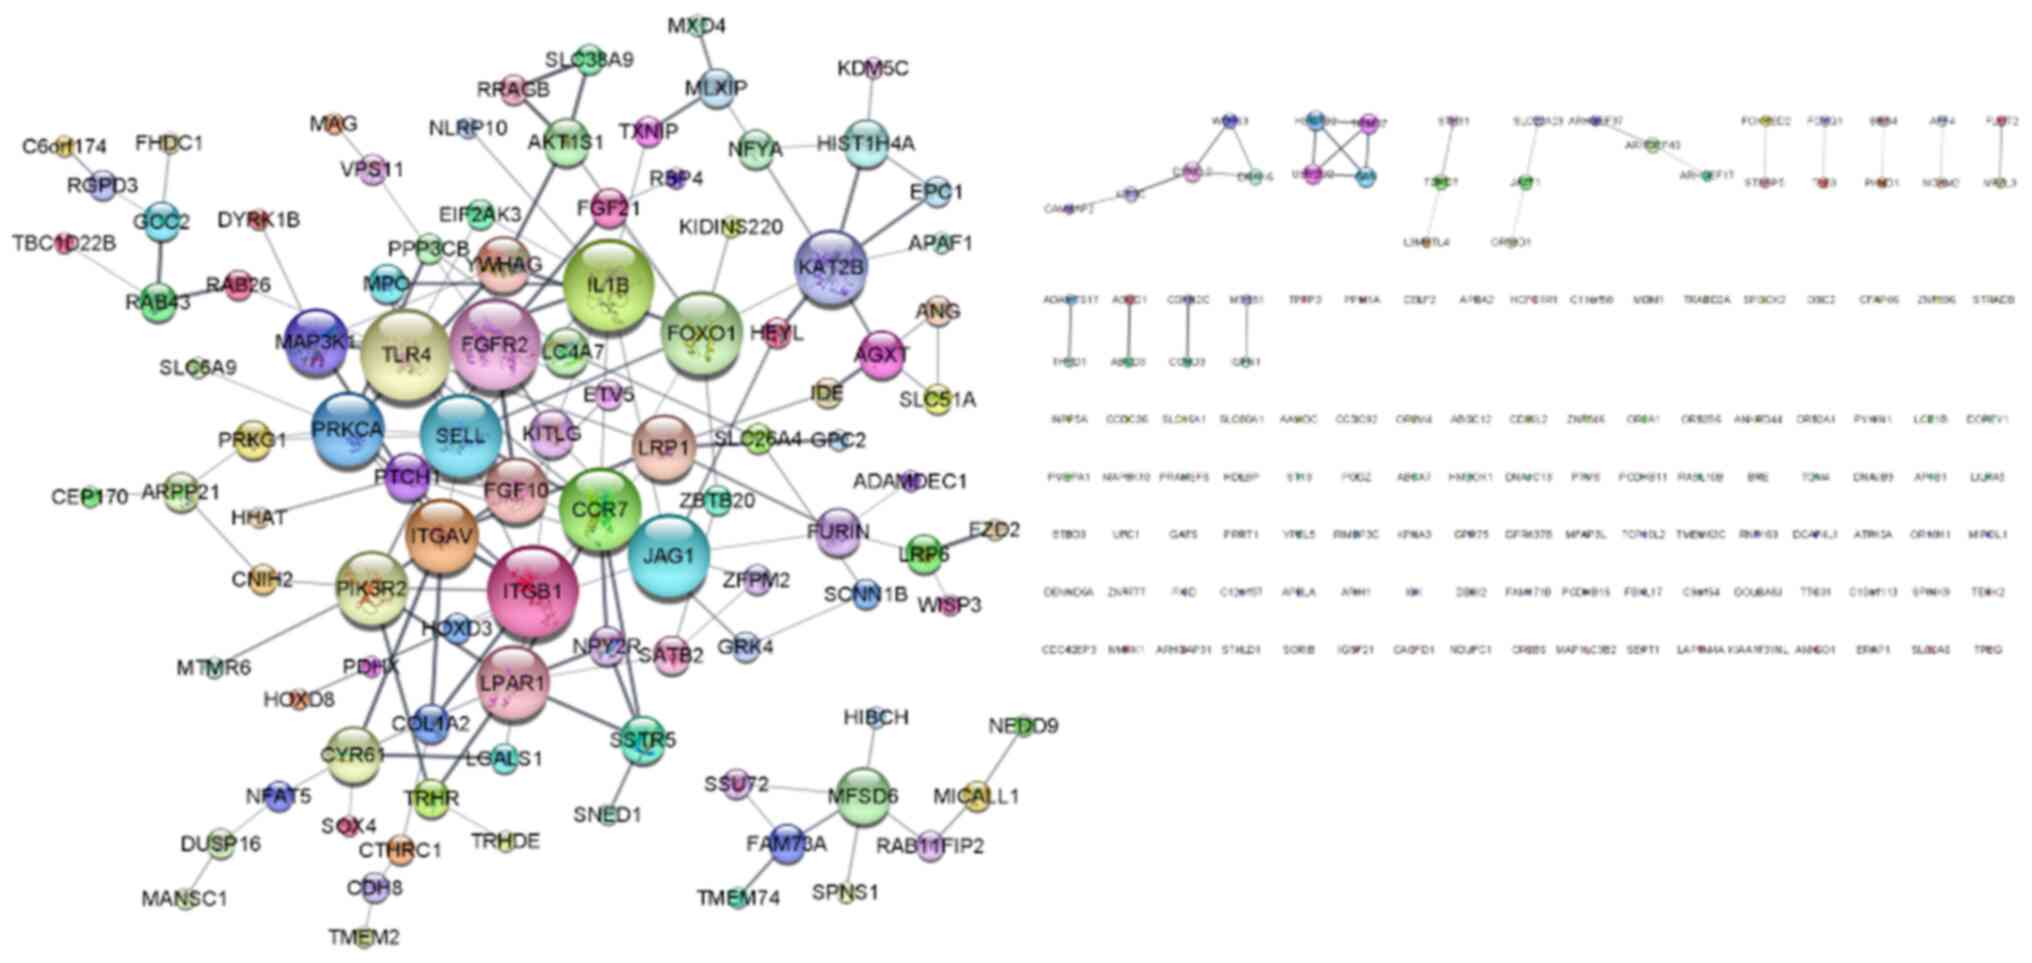
The upregulated DEGs in the siYY1 cells were
investigated since they were expected to be more relevant to the
results of the in vitro experiments than the downregulated
DEGs. A PPI network of upregulated DEGs was created using the
STRING App and they were visualized using Cytoscape. As revealed in
Fig. 6, the PPI network contained
234 nodes and 175 edges. The top 10 genes of degree centrality
calculated by the network analyzer were identified as the hub
genes: TLR4, IL1B, FGFR2, ITGB1, CCR7, FOXO1, JAG1, SELL,
ITGAV and PIK3R2. Among these genes, focus was addressed
on the integrin family genes ITGAV and ITGB1, which
are strongly associated with cell adhesion (29), migration (30) and invasion (31).
ITGAV and ITGB1 expression is
negatively correlated with YY1 expression in the CRC cell lines and
primary CRC tumors
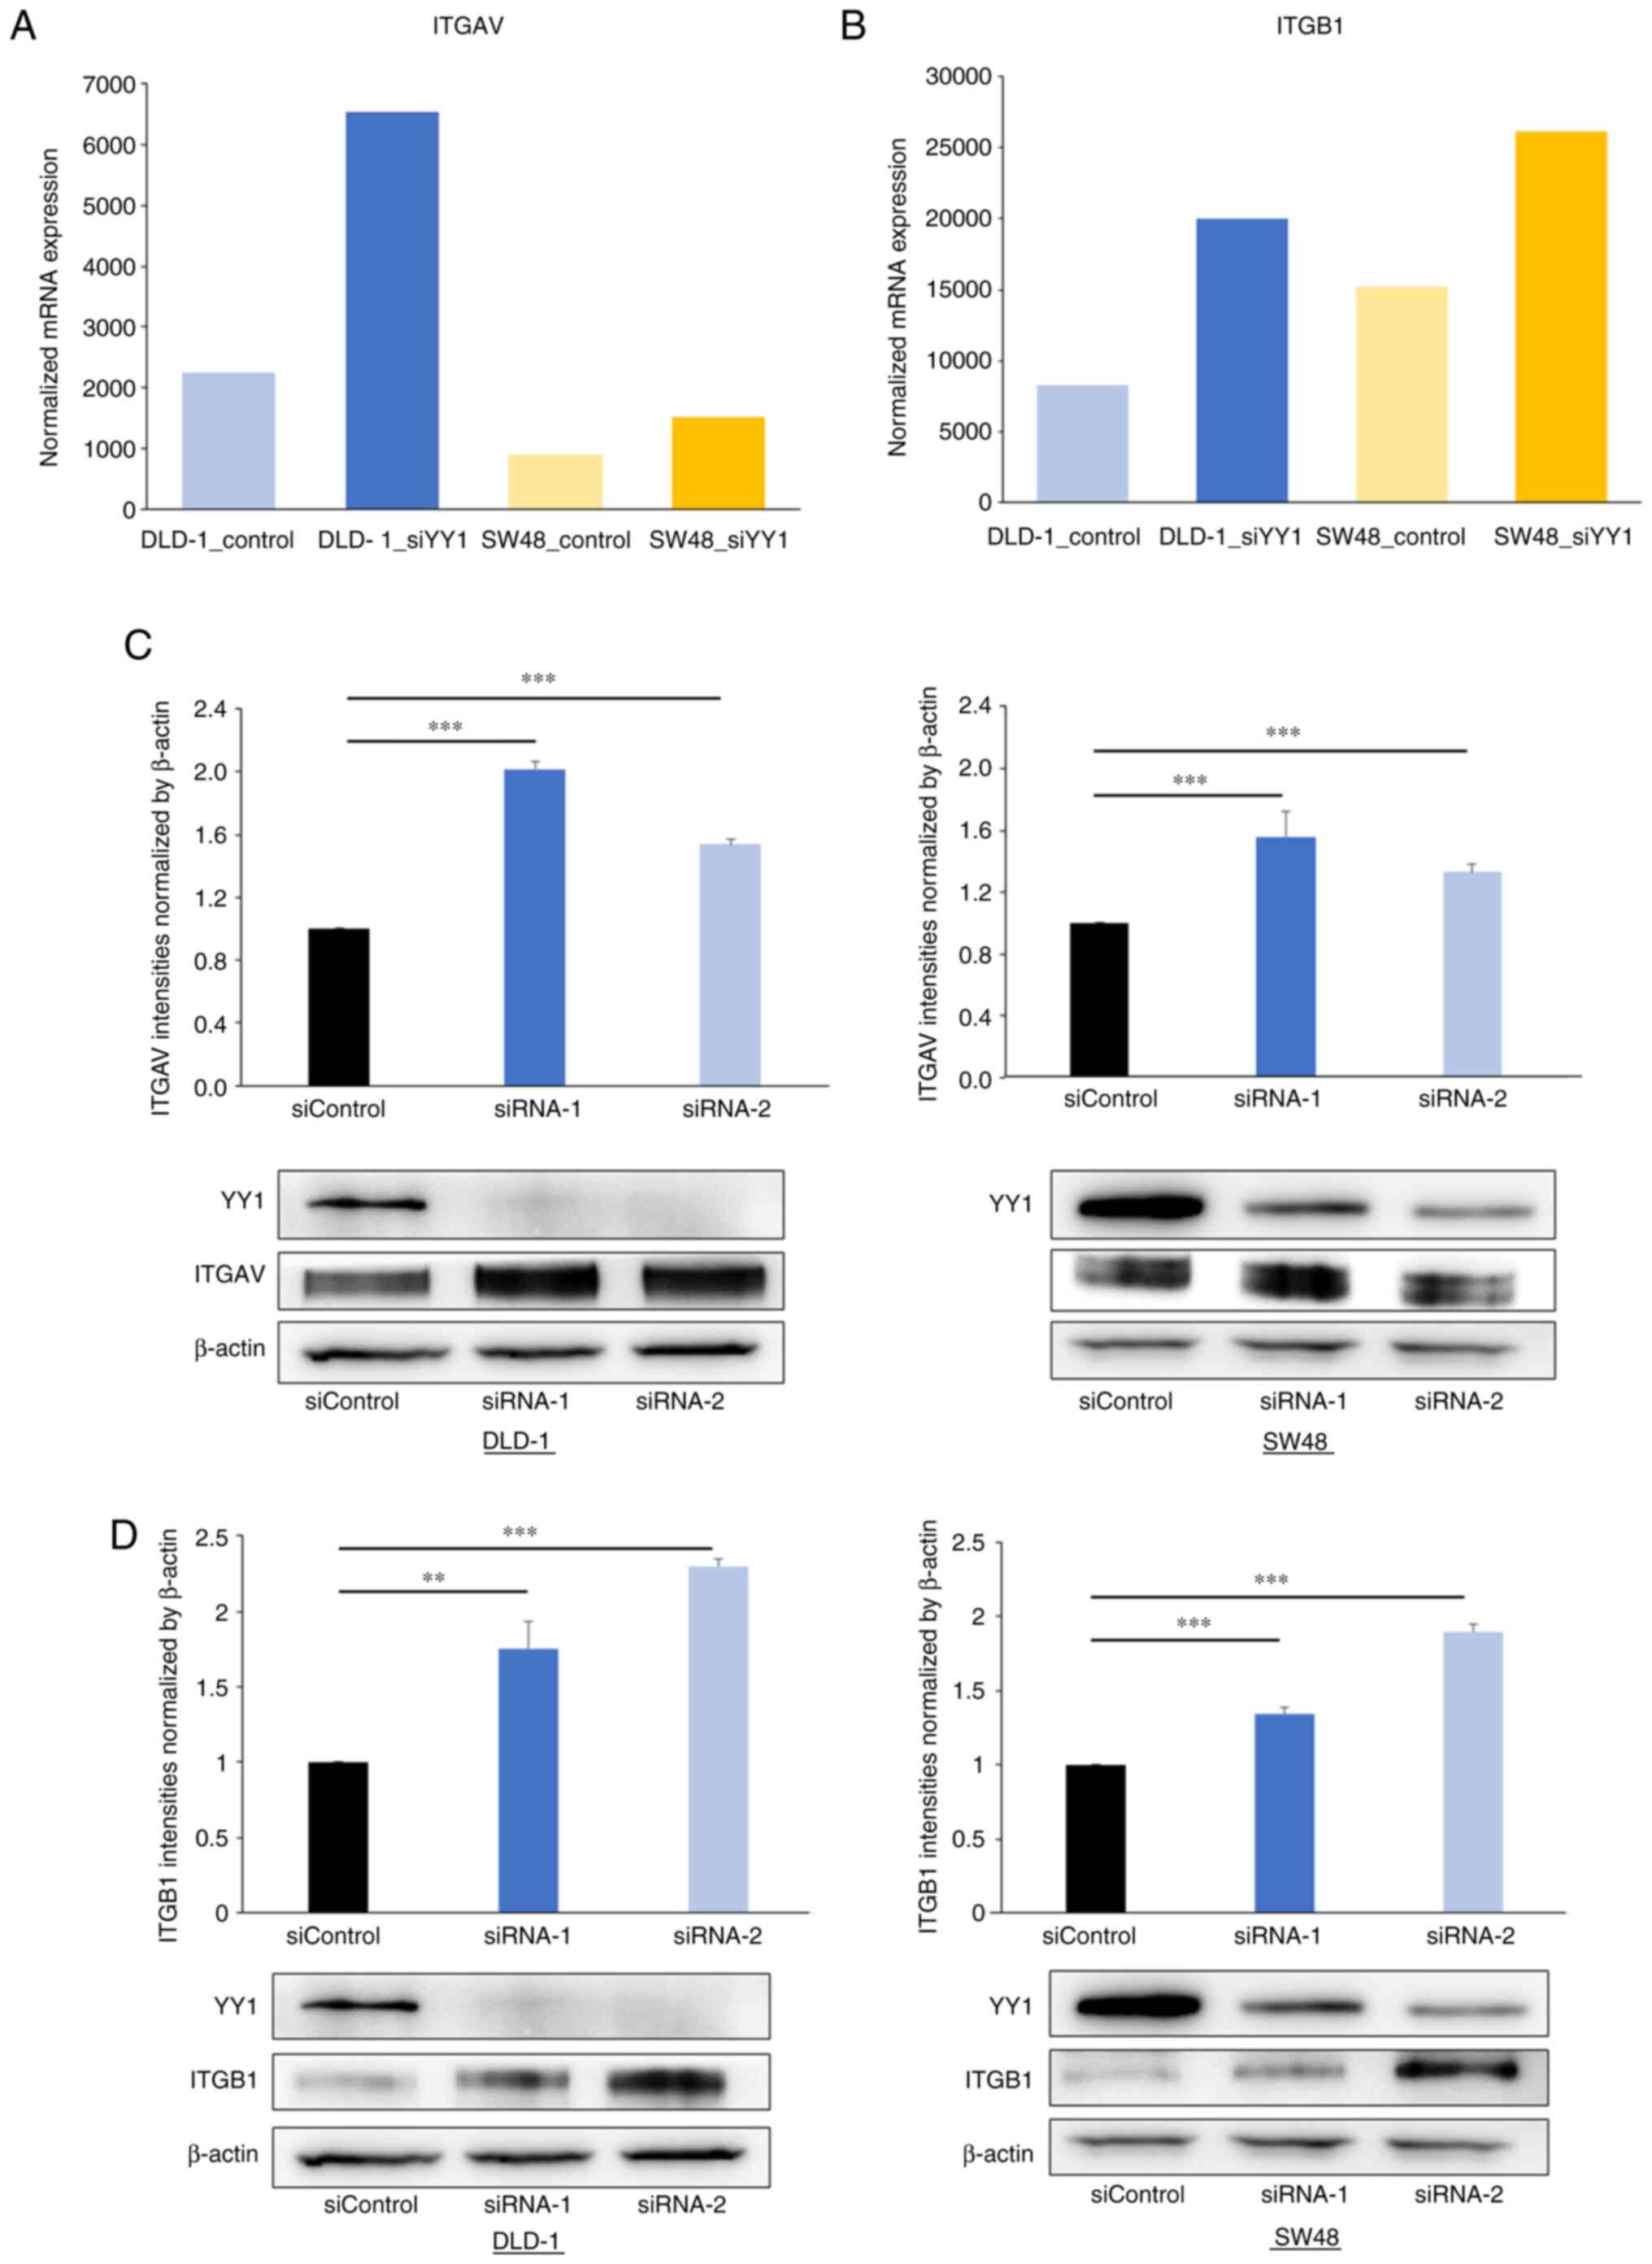
To verify the association between the YY1 knockdown
and the expression of ITGAV and ITGB1, western blot and IHC
analyses were performed. The western blot analysis revealed that
ITGAV and ITGB1 expression was significantly increased in the
YY1-knockdown cell lines (Fig. 7).
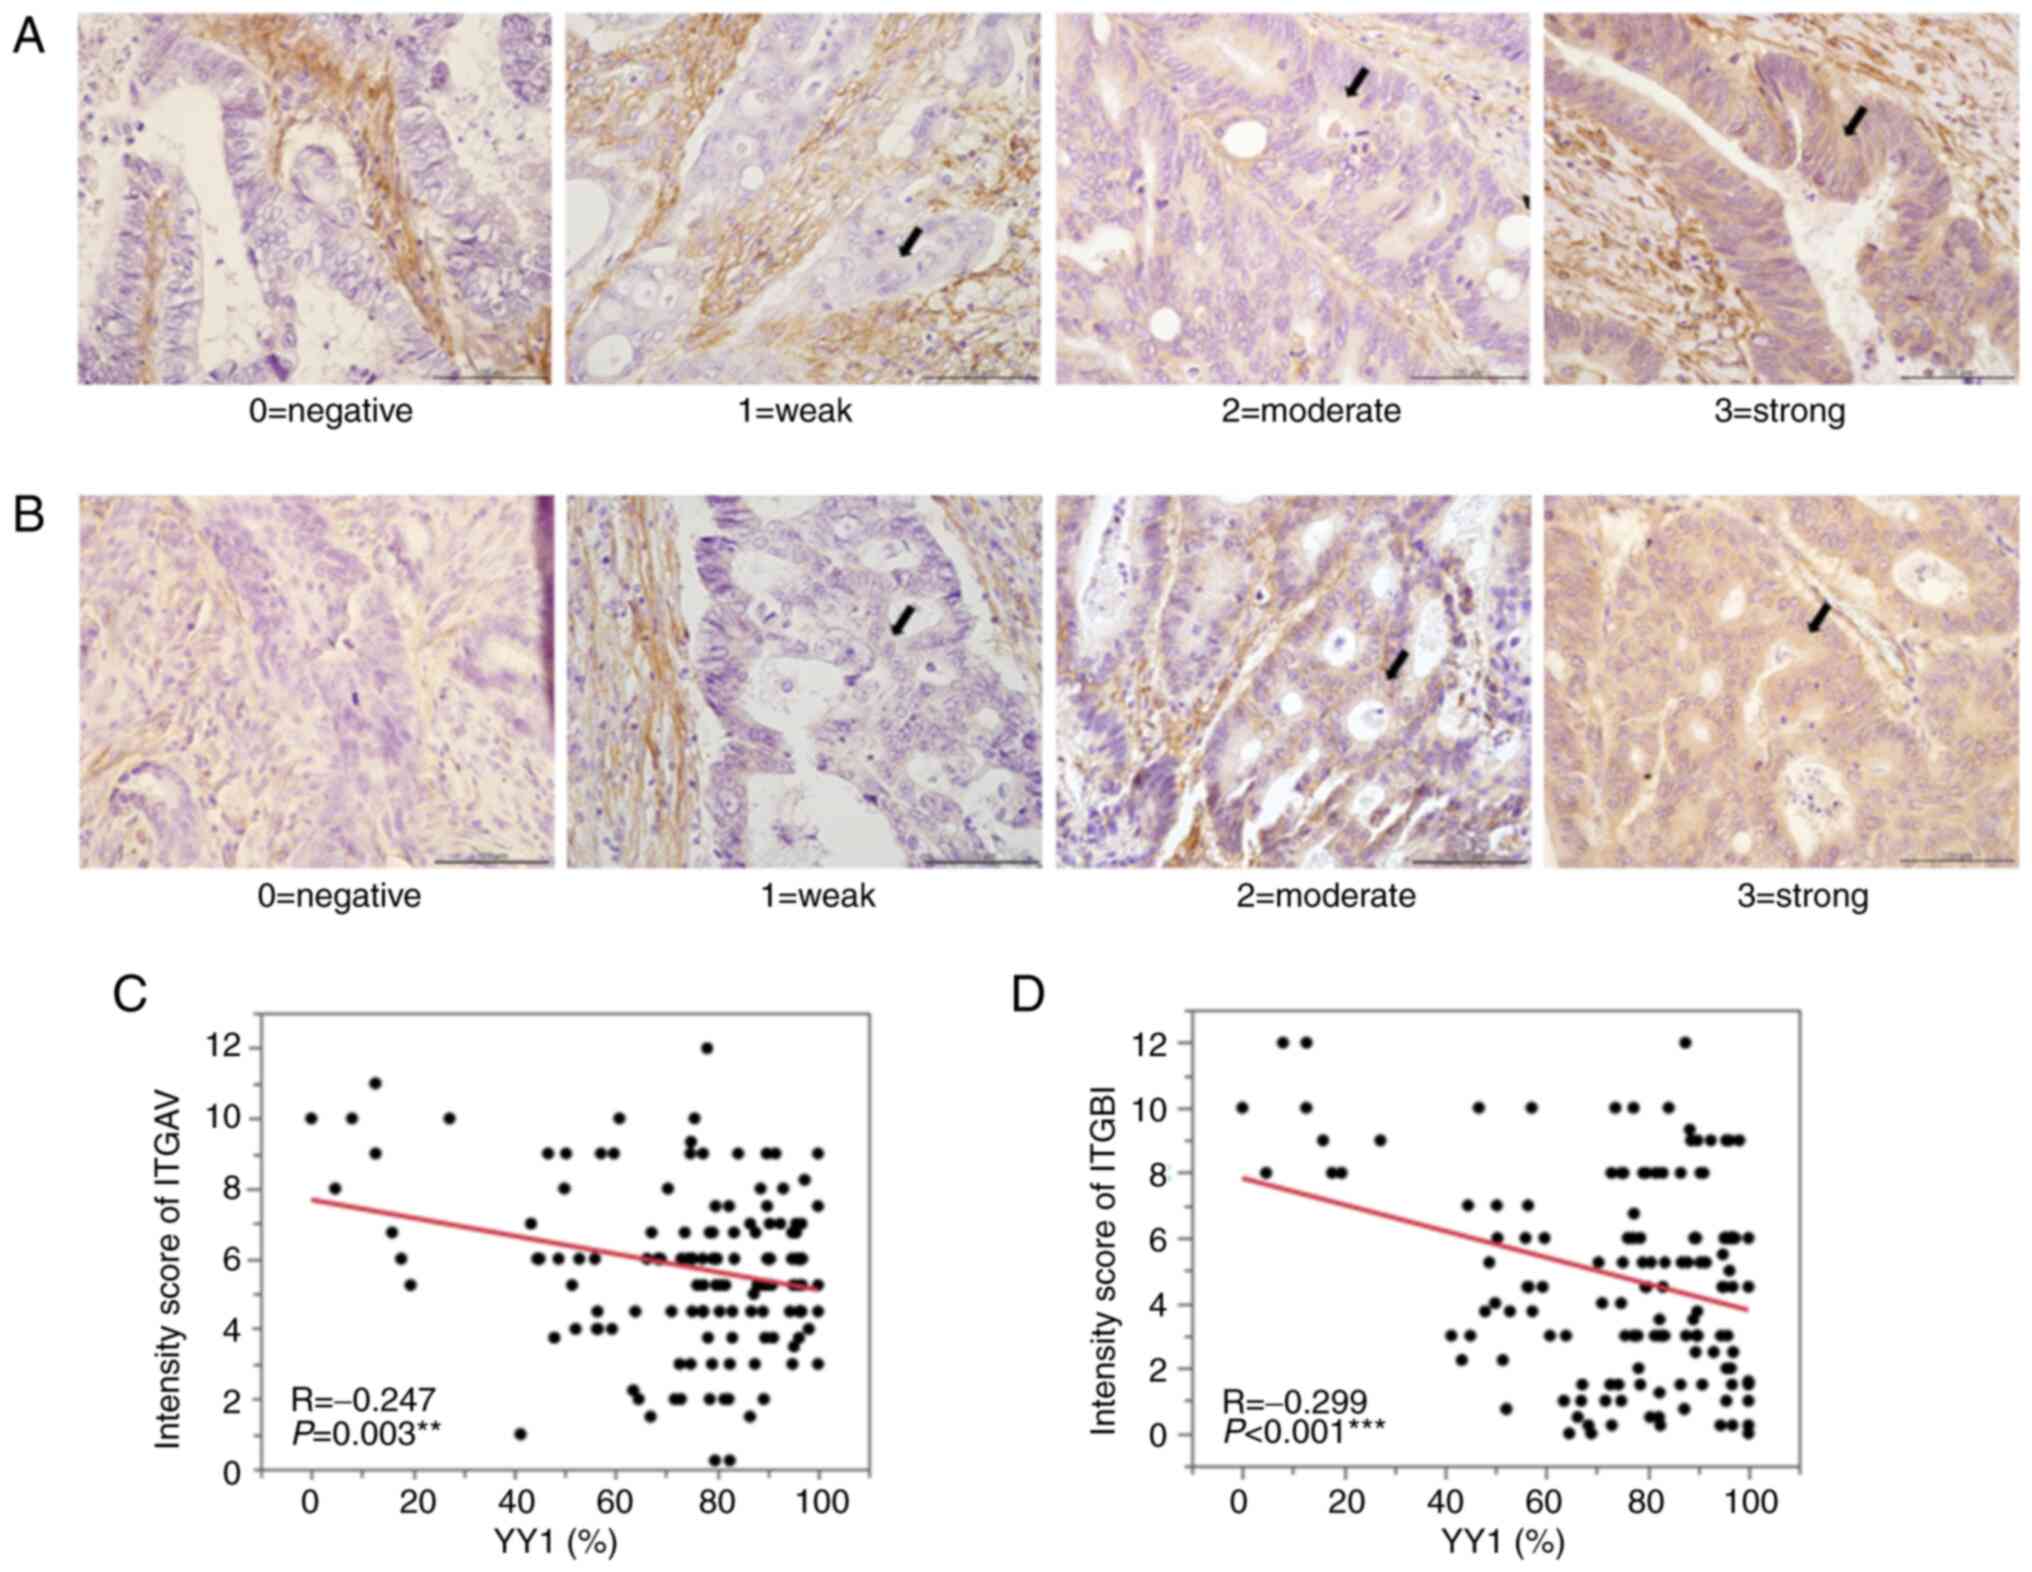
IHC in 143 primary tumors demonstrated that YY1 expression in the
primary CRC tumors was negatively correlated with both ITGAV
(R=−0.247; P=0.003) and ITGB1 expression (R=−0.299; P<0.001;
Fig. 8).
The promoters of ITGAV and ITGB1 have
a YY1-specific binding site
The sequences of the transcription factor binding
sites of ITGAV and ITGB1 were examined to investigate the
possibility that YY1 binds directly to the respective promoters.
The promoter sequences of ITGAV and ITGB1 obtained
using DBTSS were inserted into JASPAR 2020 software to identify the
binding site. The analysis identified one YY1-specific putative
binding site on each of the promoter sequences (ITGAV,
CAAGAGGGCTGA; ITGB1, CATGATGGCTCT; Fig. S2).
Discussion
The present study revealed that low YY1 expression
in primary CRC tumors was significantly associated with a poor
prognosis. Our in vitro experiments demonstrated that YY1
suppressed CRC cellular migration and invasion. Furthermore, the
microarray analysis revealed that YY1 may play an important role as
a tumor suppressor by regulating the members of the integrin
family, ITGAV and ITGB1.
There has been conflicting evidence regarding the
role of YY1 in CRC biology. Chinnappan et al (32) reported that low YY1 expression
levels in colon cancer tended to be associated with shorter
survival. It was suggested that YY1 may be inactivated and could be
a candidate as a tumor suppressor gene in colon cancer. The
aforementioned study supported the present data in demonstrating
the tumor-suppressive role of YY1. Whereas, Zhang et al
(33) revealed that YY1 promotes
colon cancer growth by inhibiting p53 and promoting the Wnt
signaling pathways, leading to poor clinical outcomes. Similarly,
certain reports suggested that YY1 plays a tumor promoting role
(8,34–36).
This discrepancy may be due to the different stages of cancer
progression being explored indicating that the function of YY1 is
context-dependent. To better understand the diversity of YY1
function by carcinogenic stage, YY1 expression was compared between
normal mucosa and CRC primary tumors in 143 tissues. YY1 expression
was significantly higher in tumors than in normal mucosa (positive
rate, 44.4±2% and 75.8±1.9%; P<0.001, data not shown). A similar
result was demonstrated in a previous study investigating the
function of YY1 in pancreatic cancer (11). The aforementioned study
demonstrated the tumor-suppressive role of YY1, revealing that YY1
expression was high in PDAC tissues but low in normal pancreatic
tissues. It was theorized that YY1 is not involved in
carcinogenesis but plays a tumor-suppressive role once cancer has
developed. Collectively, it is considered that YY1 plays a
tumor-suppressive role in inhibiting cancer progression that leads
to favorable prognosis of CRC patients but cannot suppress
carcinogenesis.
The present data demonstrated that low YY1
expression in primary tumors was significantly associated with
lymphatic and vascular invasion, lymph node metastasis, distant
metastasis, advanced TNM stage and postoperative recurrence. Since
distant metastasis and postoperative recurrence are known to be the
main causes of death in colon cancer (37,38),
patients with low YY1 expression may have shorter survival due to
these factors. Based on these findings in our clinical data, it was
hypothesized that YY1 plays a tumor-suppressive role in the
metastatic process. To verify this hypothesis, in vitro
experiments were conducted and the molecular mechanisms underlying
our clinical data were investigated.
In in vitro experiments, YY1 knockdown
promoted cell migration and invasion but did not alter cell
proliferation, which was consistent with the clinical data showing
a significant association between YY1 expression and T stage
defined by the depth of tumor invasion, and no association between
YY1 expression and tumor size of the primary tumors and liver
metastases. Although the association between YY1 function and cell
migration and invasion properties has been reported in pancreatic
cancer (11,13,39),
gastric cancer (40) and CRC
(34,36), it remains elusive as to whether YY1
promotes or suppresses these abilities. Particularly in CRC, a
previous study revealed that YY1 promotes cell migration and
invasion and miR-215 regulates these properties through YY1
(36). Another study showed that
YY1 forms a positive feedback loop with LINC 01578 and NF-κB, which
promotes the proliferation, migration, and invasion of CRC cells
(34). This discrepancy between
our data and these previous studies may be due to the diversity of
YY1 functions and also due to different experimental conditions and
cell lines. To clarify the molecular mechanism underlying our
results and identify the key genes that work downstream of YY1, a
microarray analysis was conducted.
The microarray analysis demonstrated that YY1 may
play a tumor-suppressive role through the downregulation of ITGAV
and ITGB1. Integrins are known to act as major cell surface
adhesion receptors (29) as well
as signaling molecules (41) and
have been reported to affect nearly every stage of cancer
progression from primary tumor development to metastasis (42,43).
Integrins are heterodimer proteins composed of the alpha and beta
subunits. To date, 24 integrins with a combination of 18 alpha
subunits and 8 beta subunits have been identified in mammals
(41). ITGAV and ITGB1 are the
members of each subunit. ITGAV forms five types of dimers, αVβ1,
αVβ3, αVβ5, αVβ6, and αVβ8 (41),
and are known to facilitate tumor cell adhesion to the
extracellular matrix (ECM) (44).
ITGB1 forms 12 types of dimers with alpha subunits (41). ITGB1 interacts with the ECM
structural components, such as laminin, fibronectin, vitronectin,
and collagen, and is considered to be strongly involved in the
attachment of cancer cells to the basement membrane (45). Although the effects of ITGAV and
ITGB1 on CRC have not been directly verified in the present study,
several studies have suggested that integrins promote CRC
progression. ITGAV is an important adhesion molecule for the
peritoneal metastasis of CRC cells (44), and cancer-associated fibroblasts
promote CRC cell invasion by depositing fibronectin in an αvβ3
integrin-dependent manner (46).
In addition, the inside-out activation of ITGB1 promotes CRC cell
extravasation and colonization (47) and the integrin subunits αV, α6, and
β1 are involved in early events in colon cancer metastasis to the
liver (48). Furthermore, there is
clinical evidence that ITGAV expression is significantly associated
with aggressive clinicopathological features of CRC (49) and ITGB1 expression has been
significantly associated with the poor prognosis in CRC patients
(50,51). Given these findings and our data,
it was theorized that YY1 acts as a tumor suppressor in CRC by
regulating the expression of ITGAV and ITGB1, inducing CRC cell
migration and invasion. To date, the control mechanisms of
integrins by YY1 remain unknown and need to be elucidated in future
studies.
The present study revealed that YY1 knockdown
promoted migration and invasion. This means that the lower the YY1
expression, the deeper the cancer cells infiltrate and the more the
tumor metastasizes. Therefore, YY1 expression in primary tumors
decreased as TNM stage progressed. Furthermore, the difference in
cut-off values between 143 primary lesions and 66 primary lesions
with liver metastasis may be due to the fact that the 66-lesion
group includes numerous stage IV cases. Whereas, YY1 expression in
primary tumors was significantly associated with aggressive
metastatic behavior, YY1 expression in liver metastatic tumors was
not associated with prognosis. The reason for these data may be
explained by the difference in the rate of YY1 expression. The mean
rate of YY1 expression in liver metastases was lower than that in
the primary tumors. Therefore, it may be difficult to identify
significant differences in the liver metastases. In addition, YY1
may contribute to the establishment of metastasis of CRC, but once
metastasis is established, YY1 may not affect the progression of
the metastatic tumor.
The present study has certain limitations. First,
there may have been selection bias in the background data of the
patients since all the data were collected retrospectively. Second,
all the in vitro experiments were performed in a
loss-of-function manner using siRNA transfection. Ideally,
gain-of-function experiments and in vivo experiments should
be performed to verify our data and elucidate the role of YY1 in
the progression of CRC.
Collectively, low YY1 expression was significantly
associated with the poor prognosis in patients with primary CRC and
aggressive behavior of the corresponding liver metastases. YY1
suppressed the expression of ITGAV and ITGB1, which are members of
integrins playing an important role in CRC progression. This
transcriptional regulation may lead to the suppression of CRC cell
migration and invasion and eventually lead to the suppression of
CRC cell metastasis. Overall, YY1 acted as a tumor suppressor and
contributed to the survival of patients with CRC. Investigating the
molecular mechanisms of YY1 in CRC metastasis may serve as a
potential prognostic biomarker and therapeutic target in CRC.
Supplementary Material
Supporting Data
Supporting Data
Acknowledgements
Not applicable.
Funding
The present study was supported (grant no. JP20K17640) by the
Japan Society for the Promotion of Science KAKENHI.
Availability of data and materials
The datasets used and/or analyzed during the current
study are available from the corresponding author on reasonable
request.
Authors' contributions
NaS and NoS designed and performed the experiments.
KF, TT and GO collected the data. MO and HM confirmed the
authenticity of all the raw data. KF, ST and SK performed data
analysis. NaS wrote and NoS revised the paper. All authors read and
approved the final manuscript.
Ethics approval and consent to
participate
The present study was approved (approval no. 2405)
by the Ethics Committee of the Department of General Surgery of
Chiba University Hospital (Chiba, Japan). Written informed consent
was provided by all participants.
Patient consent for publication
Written informed consent for publication of their
clinical details and/or clinical images was obtained from the
patient/parent/guardian/relative of the patient. A copy of the
consent form is available for review by the Editor of this
journal.
Competing interests
The authors declare that they have no competing
interests.
Glossary
Abbreviations
Abbreviations:
|
CA19-9
|
carbohydrate antigen 19-9
|
|
CEA
|
carcinoembryonic antigen
|
|
CRC
|
colorectal cancer
|
|
CSS
|
cancer-specific survival
|
|
DFS
|
disease-free survival
|
|
IHC
|
immunohistochemistry
|
|
ITGAV
|
integrin alpha V
|
|
ITGB1
|
integrin beta 1
|
|
TSF
|
time to surgical failure
|
|
YY1
|
Yin Yang 1
|
References
|
1
|
Sung H, Ferlay J, Siegel RL, Laversanne M,
Soerjomataram I, Jemal A and Bray F: Global cancer statistics 2020:
GLOBOCAN estimates of incidence and mortality worldwide for 36
cancers in 185 countries. CA Cancer J Clin. 71:209–249. 2021.
View Article : Google Scholar : PubMed/NCBI
|
|
2
|
Zacharakis M, Xynos ID, Lazaris A, Smaro
T, Kosmas C, Dokou A, Felekouras E, Antoniou E, Polyzos A,
Sarantonis J, et al: Predictors of survival in stage IV metastatic
colorectal cancer. Anticancer Res. 30:653–660. 2010.PubMed/NCBI
|
|
3
|
Field K and Lipton L: Metastatic
colorectal cancer-past, progress and future. World J Gastroenterol.
13:3806–3815. 2007. View Article : Google Scholar : PubMed/NCBI
|
|
4
|
Shi Y, Lee JS and Galvin KM: Everything
you have ever wanted to know about Yin Yang 1. Biochim Biophys
Acta. 1332:F49–F66. 1997.PubMed/NCBI
|
|
5
|
Khachigian LM: The Yin and Yang of YY1 in
tumor growth and suppression. Int J Cancer. 143:460–465. 2018.
View Article : Google Scholar : PubMed/NCBI
|
|
6
|
Zhang Q, Wan M, Shi J, Horita DA, Miller
LD, Kute TE, Kridel SJ, Kulik G and Sui G: Yin Yang 1 promotes
mTORC2-mediated AKT phosphorylation. J Mol Cell Biol. 8:232–243.
2016. View Article : Google Scholar : PubMed/NCBI
|
|
7
|
Liu D, Zhang J, Wu Y, Shi G, Yuan H, Lu Z,
Zhu Q, Wu P, Lu C, Guo F, et al: YY1 suppresses proliferation and
migration of pancreatic ductal adenocarcinoma by regulating the
CDKN3/MdM2/P53/P21 signaling pathway. Int J Cancer. 142:1392–1404.
2018. View Article : Google Scholar : PubMed/NCBI
|
|
8
|
Wu S, Wang H, Li Y, Xie Y, Huang C, Zhao
H, Miyagishi M and Kasim V: Transcription factor YY1 promotes cell
proliferation by directly activating the pentose phosphate pathway.
Cancer Res. 78:4549–4562. 2018. View Article : Google Scholar : PubMed/NCBI
|
|
9
|
Lee MH, Lahusen T, Wang RH, Xiao C, Xu X,
Hwang YS, He WW, Shi Y and Deng CX: Yin Yang 1 positively regulates
BRCA1 and inhibits mammary cancer formation. Oncogene. 31:116–127.
2012. View Article : Google Scholar : PubMed/NCBI
|
|
10
|
Zhang JJ, Zhu Y, Yang C, Liu X, Peng YP,
Jiang KR, Miao Y and Xu ZK: Yin Yang-1 increases apoptosis through
bax activation in pancreatic cancer cells. Oncotarget.
7:28498–28509. 2016. View Article : Google Scholar : PubMed/NCBI
|
|
11
|
Zhang JJ, Zhu Y, Xie KL, Peng YP, Tao JQ,
Tang J, Li Z, Xu ZK, Dai CC, Qian ZY, et al: Yin Yang-1 suppresses
invasion and metastasis of pancreatic ductal adenocarcinoma by
downregulating MMP10 in a MUC4/ErbB2/p38/MEF2C-dependent mechanism.
Mol Cancer. 13:1302014. View Article : Google Scholar : PubMed/NCBI
|
|
12
|
Wang CC, Tsai MF, Hong TM, Chang GC, Chen
CY, Yang WM, Chen JJ and Yang PC: The transcriptional factor YY1
upregulates the novel invasion suppressor HLJ1 expression and
inhibits cancer cell invasion. Oncogene. 24:4081–4093. 2005.
View Article : Google Scholar : PubMed/NCBI
|
|
13
|
Chen Q, Zhang JJ, Ge WL, Chen L, Yuan H,
Meng LD, Huang XM, Shen P, Miao Y and Jiang KR: YY1 inhibits the
migration and invasion of pancreatic ductal adenocarcinoma by
downregulating the FER/STAT3/MMP2 signaling pathway. Cancer Lett.
463:37–49. 2019. View Article : Google Scholar : PubMed/NCBI
|
|
14
|
Antonio-Andrés G, Rangel-Santiago J,
Tirado-Rodríguez B, Martinez-Ruiz GU, Klunder-Klunder M, Vega MI,
Lopez-Martinez B, Jiménez-Hernández E, Torres Nava J, Medina-Sanson
A and Huerta-Yepez S: Role of Yin Yang-1 (YY1) in the transcription
regulation of the multi-drug resistance (MDR1) gene. Leuk Lymphoma.
59:2628–2638. 2018. View Article : Google Scholar : PubMed/NCBI
|
|
15
|
Wottrich S, Kaufhold S, Chrysos E, Zoras
O, Baritaki S and Bonavida B: Inverse correlation between the
metastasis suppressor RKIP and the metastasis inducer YY1:
Contrasting roles in the regulation of chemo/immuno-resistance in
cancer. Drug Resist Updat. 30:28–38. 2017. View Article : Google Scholar : PubMed/NCBI
|
|
16
|
Vega MI, Valencia-Hipolito A,
Hernandez-Atenogenes M, Vega GG, Mayani H, Mendez-Tenorio A,
Martinez-Maza O, Huerta-Yepez S and Bonavida B: High expression of
Kruppel-Like Factor 4 (KLF4) and its regulation by Yin Yang 1 (YY1)
in non-Hodgkin's B-cell lymphomas: Clinical implication. Cancer
Res. 73 (Suppl 8):S54502013.
|
|
17
|
Cho AA and Bonavida B: Targeting the
overexpressed YY1 in cancer inhibits EMT and metastasis. Crit Rev
Oncog. 22:49–61. 2017. View Article : Google Scholar : PubMed/NCBI
|
|
18
|
Palmer MB, Majumder P, Cooper JC, Yoon H,
Wade PA and Boss JM: Yin yang 1 regulates the expression of snail
through a distal enhancer. Mol Cancer Res. 7:221–229. 2009.
View Article : Google Scholar : PubMed/NCBI
|
|
19
|
Matsumura N, Huang Z, Baba T, Lee PS,
Barnett JC, Mori S, Chang JT, Kuo WL, Gusberg AH, Whitaker RS, et
al: Yin yang 1 modulates taxane response in epithelial ovarian
cancer. Mol Cancer Res. 7:210–220. 2009. View Article : Google Scholar : PubMed/NCBI
|
|
20
|
Naidoo K, Clay V, Hoyland JA, Swindell R,
Linton K, Illidge T, Radford JA and Byers RJ: YY1 expression
predicts favourable outcome in follicular lymphoma. J Clin Pathol.
64:125–129. 2011. View Article : Google Scholar : PubMed/NCBI
|
|
21
|
de Nigris F, Botti C, de Chiara A,
Rossiello R, Apice G, Fazioli F, Fiorito C, Sica V and Napoli C:
Expression of transcription factor Yin Yang 1 in human
osteosarcomas. Eur J Cancer. 42:2420–2424. 2006. View Article : Google Scholar : PubMed/NCBI
|
|
22
|
Wang W, Yue Z, Tian Z, Xie Y, Zhang J, She
Y, Yang B, Ye Y and Yang Y: Expression of Yin Yang 1 in cervical
cancer and its correlation with E-cadherin expression and HPV16 E6.
PLoS One. 13:e01933402018. View Article : Google Scholar : PubMed/NCBI
|
|
23
|
Xu W, Banerji S, Davie JR, Kassie F, Yee D
and Kratzke R: Yin Yang gene expression ratio signature for lung
cancer prognosis. PLoS One. 8:e687422013. View Article : Google Scholar : PubMed/NCBI
|
|
24
|
Seligson D, Horvath S, Huerta-Yepez S,
Hanna S, Garban H, Roberts A, Shi T, Liu X, Chia D, Goodglick L and
Bonavida B: Expression of transcription factor Yin Yang 1 in
prostate cancer. Int J Oncol. 27:131–141. 2005.PubMed/NCBI
|
|
25
|
Kang W, Tong JH, Chan AW, Zhao J, Dong Y,
Wang S, Yang W, Sin FM, Ng SS, Yu J, et al: Yin Yang 1 contributes
to gastric carcinogenesis and its nuclear expression correlates
with shorter survival in patients with early stage gastric
adenocarcinoma. J Transl Med. 12:802014. View Article : Google Scholar : PubMed/NCBI
|
|
26
|
Sanchez-Carbayo M, Socci ND, Lozano J,
Saint F and Cordon-Cardo C: Defining molecular profiles of poor
outcome in patients with invasive bladder cancer using
oligonucleotide microarrays. J Clin Oncol. 24:778–789. 2006.
View Article : Google Scholar : PubMed/NCBI
|
|
27
|
Ashburner M, Ball CA, Blake JA, Botstein
D, Butler H, Cherry JM, Davis AP, Dolinski K, Dwight SS, Eppig JT,
et al: Gene ontology: Tool for the unification of biology. The gene
ontology consortium. Nat Genet. 25:25–29. 2000. View Article : Google Scholar : PubMed/NCBI
|
|
28
|
Ogata H, Goto S, Sato K, Fujibuchi W, Bono
H and Kanehisa M: KEGG: Kyoto encyclopedia of genes and genomes.
Nucleic Acids Res. 27:29–34. 1999. View Article : Google Scholar : PubMed/NCBI
|
|
29
|
Berrier AL and Yamada KM: Cell-matrix
adhesion. J Cell Physiol. 213:565–573. 2007. View Article : Google Scholar : PubMed/NCBI
|
|
30
|
Caswell PT and Norman JC: Integrin
trafficking and the control of cell migration. Traffic. 7:14–21.
2006. View Article : Google Scholar : PubMed/NCBI
|
|
31
|
Missan DS and DiPersio M: Integrin control
of tumor invasion. Crit Rev Eukaryot Gene Expr. 22:309–324. 2012.
View Article : Google Scholar : PubMed/NCBI
|
|
32
|
Chinnappan D, Xiao D, Ratnasari A, Andry
C, King TC and Weber HC: Transcription factor YY1 expression in
human gastrointestinal cancer cells. Int J Oncol. 34:1417–1423.
2009.PubMed/NCBI
|
|
33
|
Zhang N, Li X, Wu CW, Dong Y, Cai M, Mok
MT, Wang H, Chen J, Ng SS, Chen M, et al: microRNA-7 is a novel
inhibitor of YY1 contributing to colorectal tumorigenesis.
Oncogene. 32:5078–5088. 2013. View Article : Google Scholar : PubMed/NCBI
|
|
34
|
Liu J, Zhan Y, Wang J, Wang J, Guo J and
Kong D: Long noncoding RNA LINC01578 drives colon cancer metastasis
through a positive feedback loop with the NF-κB/YY1 axis. Mol
Oncol. 14:3211–3233. 2020. View Article : Google Scholar : PubMed/NCBI
|
|
35
|
Yokoyama NN, Pate KT, Sprowl S and
Waterman ML: A role for YY1 in repression of dominant negative
LEF-1 expression in colon cancer. Nucleic Acids Res. 38:6375–6388.
2010. View Article : Google Scholar : PubMed/NCBI
|
|
36
|
Chen Z, Han S, Huang W, Wu J, Liu Y, Cai
S, He Y, Wu S and Song W: MicroRNA-215 suppresses cell
proliferation, migration and invasion of colon cancer by repressing
Yin-Yang 1. Biochem Biophys Res Commun. 479:482–488. 2016.
View Article : Google Scholar : PubMed/NCBI
|
|
37
|
Tauriello DV, Calon A, Lonardo E and
Batlle E: Determinants of metastatic competency in colorectal
cancer. Mol Oncol. 11:97–119. 2017. View Article : Google Scholar : PubMed/NCBI
|
|
38
|
Dmello RS, To SQ and Chand AL: Therapeutic
targeting of the tumour microenvironment in metastatic colorectal
cancer. Int J Mol Sci. 22:20672021. View Article : Google Scholar : PubMed/NCBI
|
|
39
|
Chen Q, Yang C, Chen L, Zhang JJ, Ge WL,
Yuan H, Meng LD, Huang XM, Shen P, Miao Y and Jiang KR: YY1 targets
tubulin polymerisation-promoting protein to inhibit migration,
invasion and angiogenesis in pancreatic cancer via p38/MAPK and
PI3K/AKT pathways. Br J Cancer. 121:912–921. 2019. View Article : Google Scholar : PubMed/NCBI
|
|
40
|
Zheng L, Chen Y, Ye L, Jiao W, Song H, Mei
H, Li D, Yang F, Li H, Huang K and Tong Q: miRNA-584-3p inhibits
gastric cancer progression by repressing Yin Yang 1-facilitated
MMP-14 expression. Sci Rep. 7:89672017. View Article : Google Scholar : PubMed/NCBI
|
|
41
|
Hynes RO: Integrins: Bidirectional,
allosteric signaling machines. Cell. 110:673–687. 2002. View Article : Google Scholar : PubMed/NCBI
|
|
42
|
Hamidi H and Ivaska J: Every step of the
way: Integrins in cancer progression and metastasis. Nat Rev
Cancer. 18:533–548. 2018. View Article : Google Scholar : PubMed/NCBI
|
|
43
|
Seguin L, Desgrosellier JS, Weis SM and
Cheresh DA: Integrins and cancer: Regulators of cancer stemness,
metastasis, and drug resistance. Trends Cell Biol. 25:234–240.
2015. View Article : Google Scholar : PubMed/NCBI
|
|
44
|
Lepsenyi M, Algethami N, Al-Haidari AA,
Algaber A, Syk I, Rahman M and Thorlacius H: CXCL2-CXCR2 axis
mediates αV integrin-dependent peritoneal metastasis of colon
cancer cells. Clin Exp Metastasis. 38:401–410. 2021. View Article : Google Scholar : PubMed/NCBI
|
|
45
|
Brakebusch C and Fässler R: Beta 1
integrin function in vivo: Adhesion, migration and more. Cancer
Metastasis Rev. 24:403–411. 2005. View Article : Google Scholar : PubMed/NCBI
|
|
46
|
Attieh Y, Clark AG, Grass C, Richon S,
Pocard M, Mariani P, Elkhatib N, Betz T, Gurchenkov B and Vignjevic
DM: Cancer-associated fibroblasts lead tumor invasion through
integrin-β3-dependent fibronectin assembly. J Cell Biol.
216:3509–3520. 2017. View Article : Google Scholar : PubMed/NCBI
|
|
47
|
Kato H, Liao Z, Mitsios JV, Wang H-Y,
Deryugina EI, Varner JA, Quigley JP and Shattil SJ: The primacy of
β1 integrin activation in the metastatic cascade. PLoS One.
7:e465762012. View Article : Google Scholar : PubMed/NCBI
|
|
48
|
Mook OR, van Marle J, Jonges R,
Vreeling-Sindelárová H, Frederiks WM and Van Noorden CJ:
Interactions between colon cancer cells and hepatocytes in rats in
relation to metastasis. J Cell Mol Med. 12:2052–2061. 2008.
View Article : Google Scholar : PubMed/NCBI
|
|
49
|
Waisberg J, De Souza Viana L, Affonso
Junior RJ, Silva SR, Denadai MV, Margeotto FB, De Souza CS and
Matos D: Overexpression of the ITGAV gene is associated with
progression and spread of colorectal cancer. Anticancer Res.
34:5599–5607. 2014.PubMed/NCBI
|
|
50
|
Liu QZ, Gao XH, Chang WJ, Gong HF, Fu CG,
Zhang W and Cao GW: Expression of ITGB1 predicts prognosis in
colorectal cancer: A large prospective study based on tissue
microarray. Int J Clin Exp Pathol. 8:12802–12810. 2015.PubMed/NCBI
|
|
51
|
Zhang J, Liu K, Peng P, Li S, Ye Z, Su Y,
Liu S, Qin M and Huang J: Upregulation of nectin-4 is associated
with ITGB1 and vasculogenic mimicry and may serve as a predictor of
poor prognosis in colorectal cancer. Oncol Lett. 18:1163–1170.
2019.PubMed/NCBI
|