Introduction
Gastric cancer (GC) is one among the foremost common
malignant neoplasms within the digestive tract and is the fourth
common malignancy and the third leading cause of cancer-related
death worldwide (1,2). GC patients tend to be diagnosed at
advanced stages, and the 5-year survival rate is no more than 40%
in China (3). Although
Helicobacter pylori has been reported as the most
significant risk factor for GC (4), the exact etiology of GC is still
unclear, and a detailed investigation of molecular mechanisms of GC
is urgently needed to identify novel therapeutic and diagnostic
targets. Cancer cells harbor a number of dysregulations in gene
expression due to multiple aberrations in both transcription and
splicing machinery and, at the same time, cancers are considered to
rely on such abnormal homeostasis of gene expression networks for
their survival. Thus, the importance of the clarification of
spectrums of gene expression and alternative splicing in cancer
cells, as well as the identification of potential master regulators
of such transcriptional networks are warranted (5).
The DEK proto-oncogene (DEK) protein was identified
as a fusion gene with nucleoporin 214 in a subset of patients with
acute myeloid leukemia (6,7). Literature findings suggest that
chromosomal aberrations at the DEK locus are also associated with
the occurrence of human solid tumors (8,9). DEK
has two DNA binding modules, one of which is an SAP box, a domain
that DEK shares with some other chromatin proteins. DEK plays a key
role in various cellular processes and is involved in multiple
genomic pathways, for example, global heterochromatin integrity
(10), transcriptional regulation
(11), mRNA splicing (12,13),
DNA binding (14), DNA replication
(15), DNA damage response, and
repair (16). It has no apparent
affinity to specific DNA sequences, but preferentially binds to
superhelical and cruciform DNA, and induces positive supercoils
into closed circular DNA; meanwhile, DEK participates in the
selection of splicing sites during mRNA processing (17). Alternative splicing is one of the
key molecular mechanisms which contribute to the biologically
functional complexity of the human genome (18). It was reported that transcripts
from ~95% of multiexon genes had alternatively spliced variants and
in major human tissues (19).
Noncanonical and cancer-specific mRNA transcripts produced by
aberrant splicing can lead to loss of function of tumor suppressors
or gain of function of oncogenes (20); thus, alternative splicing events
play a pivotal role in carcinogenesis. According to a report, in
addition to the regulation of splicing events, DEK is a candidate
factor that also controls post-splicing steps in gene expression
(12). The involvement of DEK in
splicing has been reported. DEK is a factor that interacts in
vitro and in vivo with SR proteins involved in pre-mRNA
splicing and forms a splicing-dependent interaction with
exon-product complexes (12);
intron removal requires proofreading of the U2AF/3′splice site
recognition by DEK (13); and DEK
also acts on the proofreading of the 3′splice site (21). In view of the biological function,
DEK is known to suppress cellular senescence, apoptosis, and
differentiation, and thus promotes cell growth and survival
(22). Importantly, DEK is also
known to play a role in chronic inflammation and subsequent
tumorigenesis by affecting nuclear factor (NF)-κB signaling
(23). High expression of DEK in
GC has been reported; furthermore, such overexpression of DEK was
found to be related to a worse prognosis of GC patients (24–26);
thus, DEK may be able to be used as a potential diagnostic marker
for GC. In GC cell lines, DEK can promote cell migration and
invasion (27–29), although the precise molecular
mechanisms remain elusive. Taken together, DEK is considered an
important oncogene in gastric carcinogenesis; however, its
molecular function, more specifically its oncogenic function, as a
regulator of gene expression and splicing events has not been
investigated on a whole-genome scale to date. Therefore, it is
urgent to clarify the effects of DEK on the overall gene
transcription and post-transcriptional splicing in GC cells. The
present study reveals a global picture of gene expression and
splicing profiles as well as functional pathways that are regulated
by DEK in a GC cell line and shows that DEK can transcriptionally
affect multiple cancer-related signaling pathways.
Materials and methods
Cell culture and transfections
Human GC cell line AGS (Procell Life Science &
Technology Co., Ltd., China) was cultured at 37°C with 5%
CO2 in Ham's F-12 with 100 µg/ml streptomycin, 100 U/ml
penicillin, and 10% fetal bovine serum (FBS). Human GC cell lines
MKN1 and NUGC4 derived from well-differentiated and poorly
differentiated GCs were cultured in RPMI-1640 medium [FUJIFILM Wako
Pure Chemical Corp. (FUJIFILM), Japan] supplemented with 10% FBS
(Sigma-Adrich; Merck KGaA), 1% sodium pyruvate (Thermo Fisher
Scientific, Inc.), 1% glutamine and 1% penicillin/streptomycin
(both from FUJIFILM). 2.0 µg/ml puromycin (Invitrogen; Thermo
Fisher Scientific, Inc.) was used for the selection of
shRNA-infected cells. All siRNA duplexes were purchased from Gemma
(Suzhou, China): non-targeting control siRNA (siCtrl):
5′-UUCUCCGAACGUGUCACGUTT-3′ (sense), and siRNA targeting DEK
(siDEK): 5′-GUCAGAUGAAUCUAGUAGUTT-3′ (sense). The siRNA
transfection into AGS cells was performed using Lipofectamine 2000
(Invitrogen; Thermo Fisher Scientific, Inc.) according to the
manufacturer's protocol. Cells were harvested after 48 h of siRNA
transfection and applied to subsequent RNA-seq. The above-mentioned
siRNA sequence and another DEK shRNA were constructed as lentiviral
shRNAs: shDEK_1, 5′-GTCAGATGAATCTAGTAGT-3′ and shDEK_2,
5′-GAGAGATCAGGTGTAAATAGT-3′. The shRNA-treated cells were harvested
after 48 h of puromycin selection for RT-qPCR, immunoblot, and
apoptosis assay.
Real-time quantitative polymerase
chain reaction (RT-qPCR)
An RNeasy Mini Kit (Qiagen GmbH) was used to extract
RNA from the GC cell lines. RT-qPCR was performed using the SYBR
Green PCR Kit (Toyobo Life Science) on a PicoReal Real-Time PCR
system (Thermo Fisher Scientific, Inc.). Glyceraldehyde-3-phosphate
dehydrogenase (GAPDH) was used as an internal control. The
information in regards to the primers is presented in Table SI. The concentration of each
transcript was then normalized to GAPDH mRNA level using the
2−ΔΔCq method (30). We
used GraphPad Prism 5 software (GraphPad Software, Inc.) to conduct
Student's t-tests.
RNA extraction and high-throughput
sequencing
For the RNA-seq, total RNA of the siRNA-treated
cells was extracted with Trizol (Ambion; Thermo Fisher Scientific,
Inc.) and purified with phenol-chloroform treatments twice. The
purified total RNA was treated with RQ1 DNase (RNase-free) (Promega
Corp.) to remove the contaminated DNA, and the absorbance at
260/280 nm (A260/A280) was measured using SmartSpec Plus (Bio-Rad
Laboratories, Inc.) to determine its quality and quantity. Then,
1.5% agarose gel electrophoresis was used to verify the integrity
of the RNA.
For each sample, we used 1.0 µg of total RNA for
RNA-seq library preparation by KAPA Stranded mRNA-Seq Kit for
Illumina® Platforms (#KK8544; Roche Sequencing and Life
Science, USA). Initially, VAHTS mRNA capture beads (N401-01, Vazyme
Biotech Co., Ltd.) were used to purify the polyadenylated mRNA.
Then, mRNAs were fragmented and converted into double-strand cDNA
using KAPA RNA HyperPrep KK8544 (Roche Sequencing and Life Science,
USA.). Following end-repair and A tailing, the DNAs were ligated to
the Roche Adaptor (KK8726; Roche Sequencing and Life Science,
USA.). After purification, these ligated products corresponding to
300–500 bp were amplified, purified, quantified, and stored at
−80°C before sequencing. The strand marked with dUTP (the 2nd cDNA
strand) was not amplified, allowing strand-specific sequencing. We
used the Illumina Novaseq 6000 system (Illumina, Inc.) to collect
data from the 150-nt paired-end sequencing (ABlife Inc.).
RNA-Seq analytical pipeline
First, raw sequencing reads containing more than 2
N-bases were discarded. Then, we used the FASTX-Toolkit (version
0.0.13) (http://hannonlab.cshl.edu/fastx_toolkit) to trim the
adaptors and low-quality bases from the raw sequencing reads, and
we dropped short reads which were less than 16 nt. After this, the
remained sequencing reads were aligned to the GRch38 genome by
tophat2 (31) allowing four
mismatches. Uniquely mapped reads were used for counting the gene
reads, and the FPKM (fragments per kilobase of transcript per
million fragments mapped) value was used as an expression level of
each gene (32). We obtained all
the original sequencing data through our experiment.
Differentially expressed gene (DEG)
analysis
We used FPKM to evaluate the gene expression levels,
and the R Bioconductor package edgeR (33) was utilized with raw read counts to
identify DEGs between the siCtrl and siDEK groups with a critical
cut-off at P-value <0.01 and fold changes >1.5 or
<2/3.
Alternative splicing analysis
The alternative splicing events (ASEs) and regulated
alternative splicing events (RASEs) were defined and quantified by
using the ABLas pipeline as described previously (34,35).
In brief, ABLas can detect 10 types of ASEs based on splice
junction reads, including exon skipping (ES), alternative 5′splice
site (A5SS), alternative 3′splice site (A3SS), intron retention
(IR), mutually exclusive exons (MXEs), mutually exclusive 5′UTRs
(5pMXEs), mutually exclusive 3′UTRs (3pMXEs), cassette exon,
A3SS&ES, and A5SS&ES. From the multiple annotated
transcripts of each gene, we selected one as the gene model, namely
the reference transcript, according to the annotation order, and
then analyzed the alternative spliced transcripts relative to the
gene model. If one gene splicing site was detected, then multiple
transcripts will be detected, and the annotated transcript
appearing in the first detection will be used as the model. To
assess RASEs, Student's t-test was performed to evaluate the
significance of the differences of AS event frequencies between
groups. Those events which were significant at a false discovery
rate (FDR) cutoff of 5% were considered as RASEs. For the
identification of wider ranges of possible ASE candidates, we used
simple t-test and P<0.05 was considered as significant.
Functional enrichment analysis
To identify significantly enriched functional
categories of DEGs, enrichment of Gene Ontology (GO) terms and
Kyoto Encyclopedia of Genes and Genomes (KEGG) pathways were
compared between groups using KOBAS 2.0 server (36). In the KOBAS 2.0 platform,
transcript length bias (37) was
not considered. The enrichment of each pathway (corrected P-value
<0.05) was defined using the hypergeometric test and
Benjamini-Hochberg FDR correction procedures.
Real time qPCR validation of DEGs and
AS events
To elucidate the validity of the RNA-seq data,
RT-qPCR was performed for selected DEGs as described above. The PCR
conditions consisted of denaturing at 95°C for 10 min, 40 cycles of
denaturing at 95°C for 15 sec, annealing and extension at 60°C for
1 min. PCR amplifications were performed in triplicate for each
sample. Primers for the qPCR analysis are listed in Table SII.
Immunoblot analysis
Total protein was obtained by RIPA buffer on ice
which was separated using 10% SDS-PAGE and blotted onto a PVDF
membrane (MilliporeSigma). After blocking using 5% skim milk
(FUJIFILM)/0.01% Tween (MP Biomedicals)-TBS, the membranes were
incubated with primary antibodies, anti-DEK (1:1,000 dilution;
ab166624, Abcam), anti-tubulin (1:2,000 dilution; #62204,
Invitrogen; Thermo Fisher Scientific, Inc.) at 4°C overnight. Then,
the membranes were incubated with HRP-conjugated secondary
antibodies (anti-mouse IgG; and anti-rabbit IgG, #8460, MBL
International Co.) at 1:1,000 dilution for 1 h at room temperature.
Signals were developed using Western HRP Substrate (MilliporeSigma)
and captured by the ChemiDoc Touch (Bio-Rad Laboratories,
Inc.).
Cell apoptosis assay
Cell apoptosis was detected using the Annexin V-FITC
Apoptosis Detection Kit (MBL International Co.) according to the
manufacturer's protocol. Harvested cells were washed twice with
cold PBS and resuspended gently in 85 µl binding buffer, and
incubated with 10 µl of Annexin V-FITC and 5 µl propidium iodide
(PI) at room temperature for 15 min in the dark. Then, the signals
were detected using NovoCyte flow cytometer (ACEA Biosciences).
Statistical analysis
The GraphPad Prism 5 software (GraphPad Software,
Inc.) was used to carry out statistical analysis. Each value was
acquired from at least three independent experiments. Data are
presented as the mean ± SD. A two-tailed unpaired Student's t-test
was used to analyze statistical differences between two groups.
P<0.05 and <0.01, where appropriate, were considered
statistically significant. Where appropriate (Figs. 2A, 3C
and D; 4F and G; and 6A-C), one-way ANOVA with Newman-Keuls
multiple comparisons test was used to test the statistical
significance between multiple groups, and P<0.05 was considered
statistically significant.
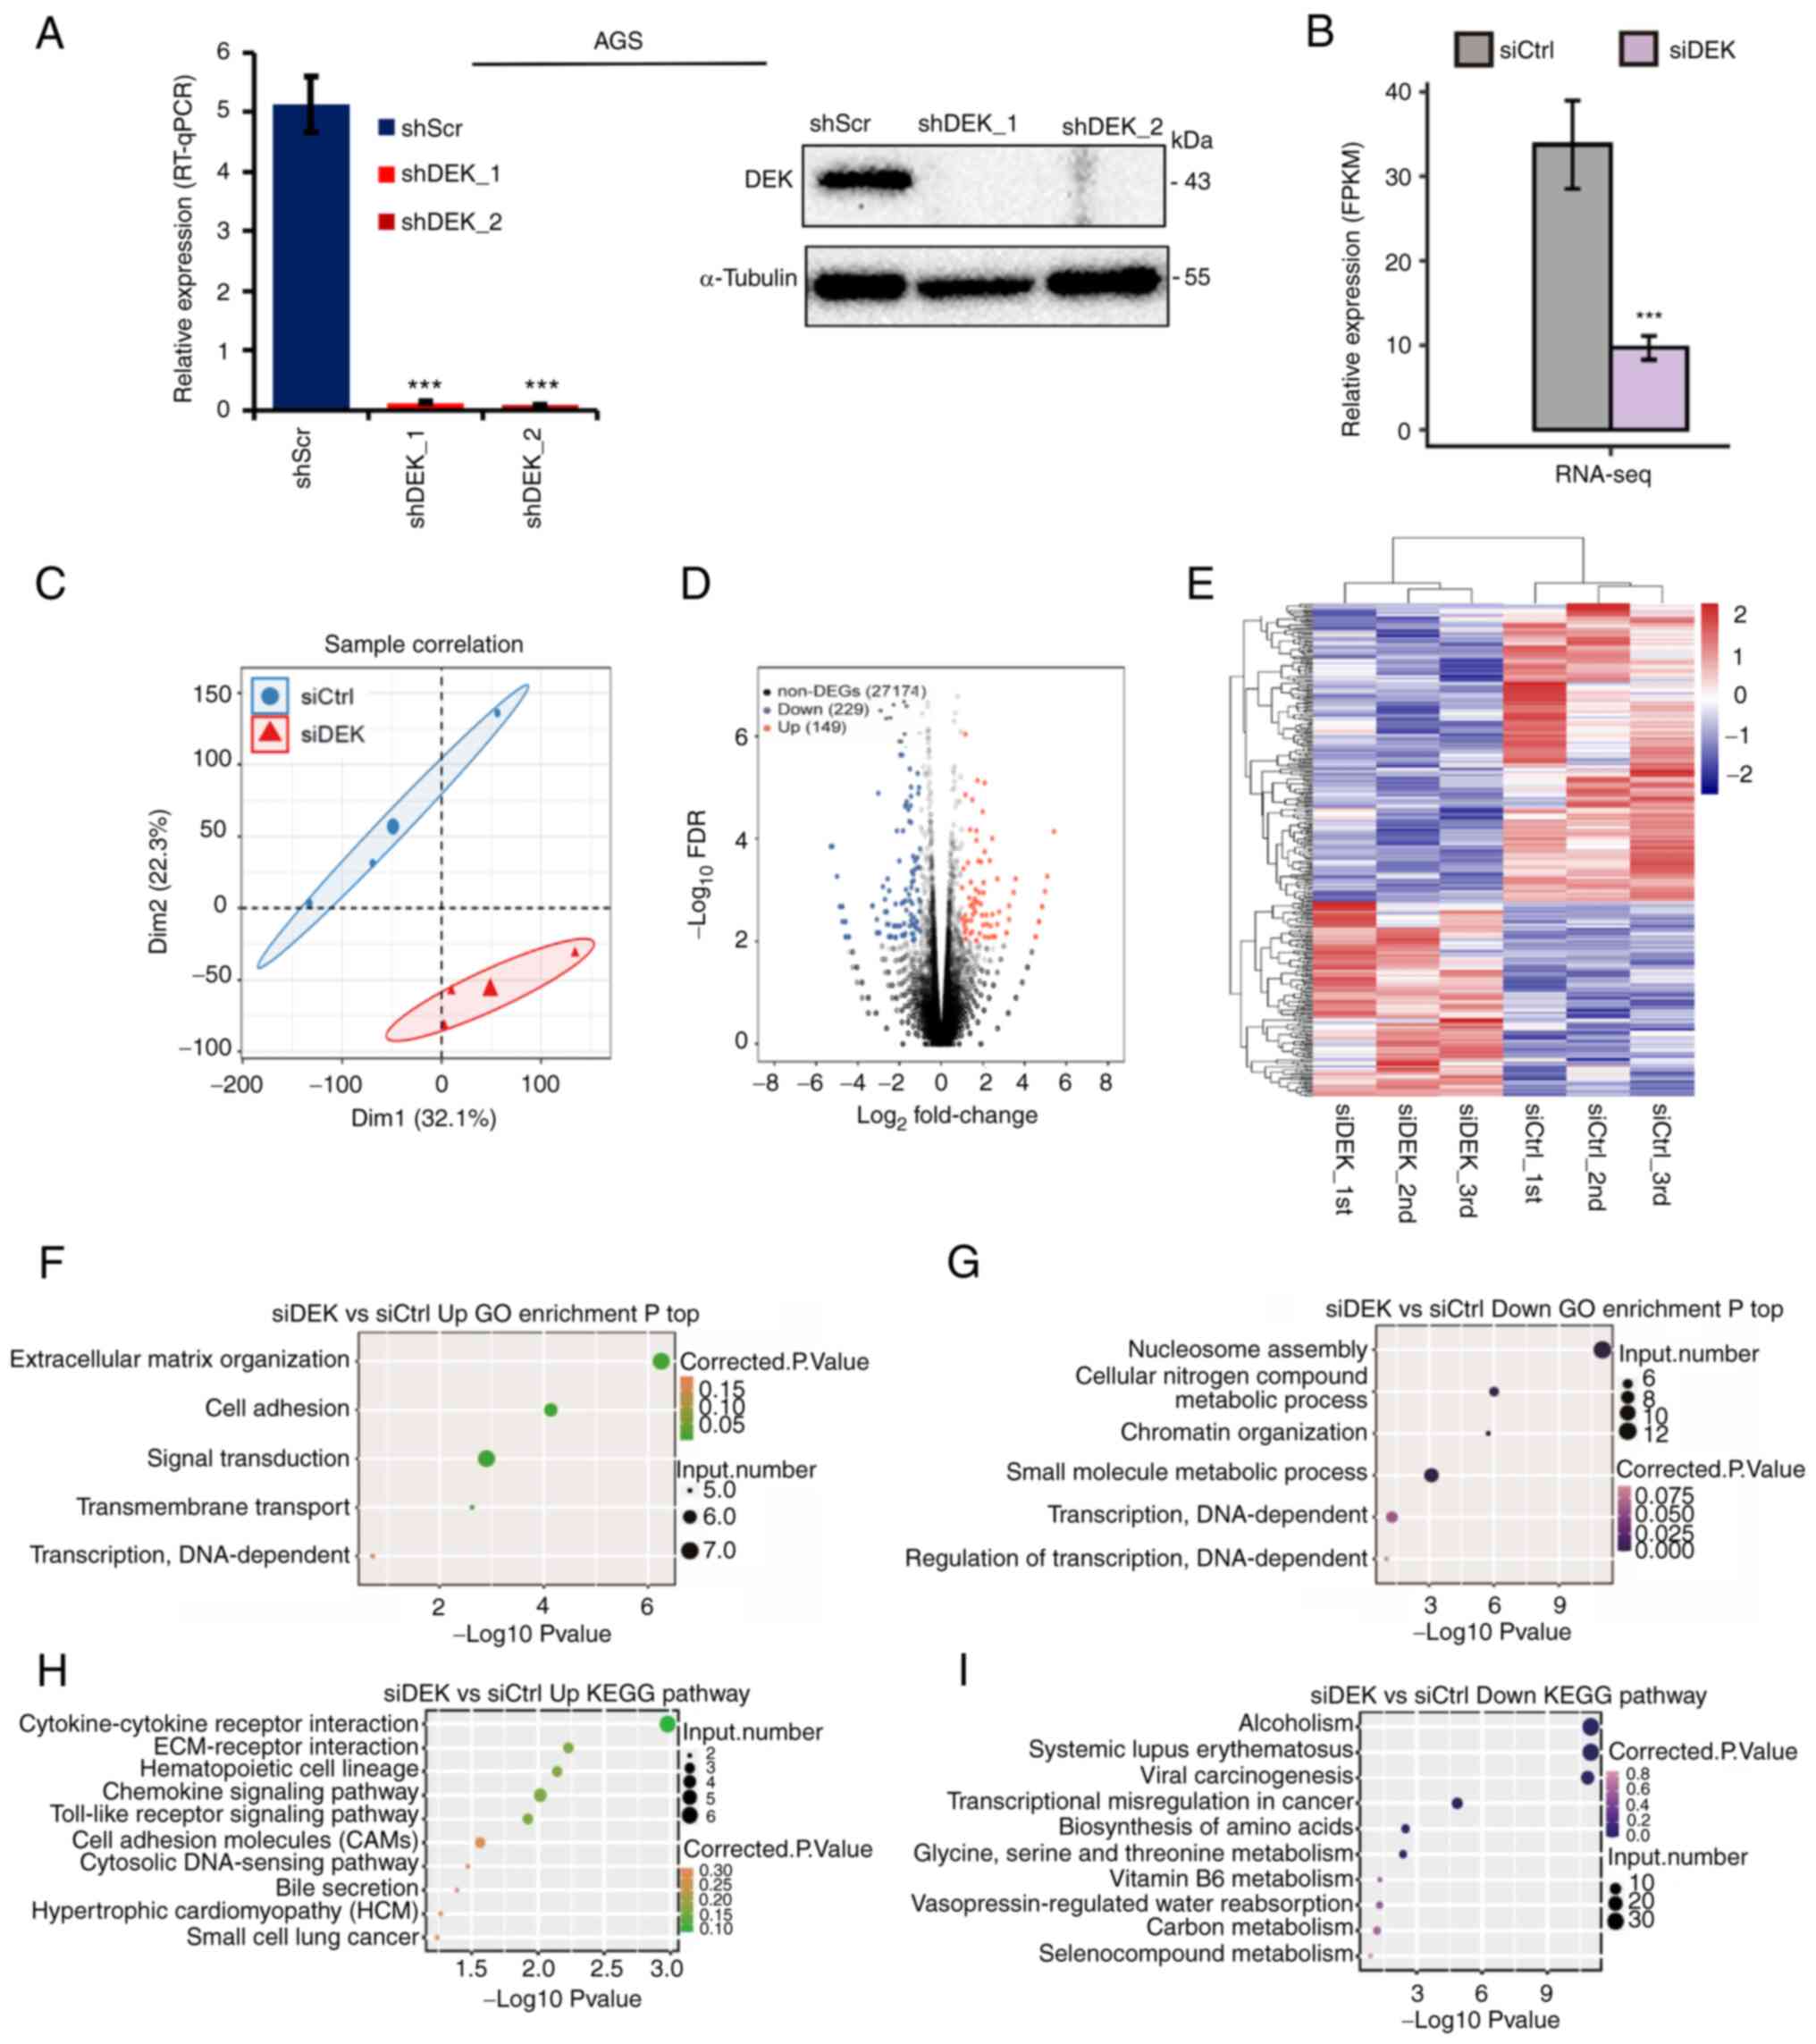 | Figure 2.Global picture of the DEK-regulated
transcriptome in a human GC cell line AGS. (A) Relative mRNA
expression levels of DEK (% of GAPDH) in shRNA-infected
cells as assessed by RT-qPCR are shown in the left panel.
Statistical differences between groups (shScr and either shDEK_1 or
shDEK_2) were tested using one-way ANOVA with Newman-Keuls multiple
comparisons test, and P<0.05 was considered statistically
significant. Bars and error bars represent the mean ± SD,
respectively (n=3), ***P<0.001. Protein levels of DEK and
α-tubulin in shRNA-infected cells as assessed by immunoblots are
shown with their molecular sizes (kDa) in the right panel. (B) DEK
expression (FPKM value) was quantified by RNA-seq. Error bars
represent mean ± SEM, ***P<0.001. (C) Principal component
analysis of the six samples consisting of the biological
triplicates of siCtrl- and siDEK-treated cells based
on the normalized gene expression levels. The abscissa represents
dimension 1, the ordinate represents dimension 2; the three small
dots in the blue ellipse represent the three samples of the
siCtrl group, and the large dot in the middle is the
normalization of the siCtrl group again. The three small
triangles in the red ellipse represent the three samples of the
siDEK group, and the large triangle in the middle is the
normalization of the siDEK group again. (D) A volcano plot
for the identification of DEK-regulated genes. Significantly
upregulated and downregulated genes are labeled in red and blue,
respectively. (E) Hierarchical clustering of the DEGs in the
siCtrl- and siDEK-treated AGC cells. FPKM values are
log2-transformed and then median-centered by each gene. Expression
values are indicated as gradient blue-to-red colors as indicated at
the right side of the figure. (F and G) The five and six GO
biological processes of the upregulated and downregulated genes,
respectively. Corrected P-values and annotated gene numbers in each
category are indicated as colors and sizes of the dots,
respectively, as indicated at the right sides of each figure. (H
and I) The top 10 representatives KEGG pathway of the upregulated
and downregulated genes, respectively. Corrected P-values and
annotated gene numbers in each category are indicated as colors and
sizes of the dots, respectively, as indicated at the right sides of
each figure. GC, gastric cancer; FPKM, fragments per kilobase of
transcript per million fragments mapped; DEGs, differentially
expressed genes; GO, Gene Ontology; KEGG, Kyoto Encyclopedia of
Genes and Genomes. |
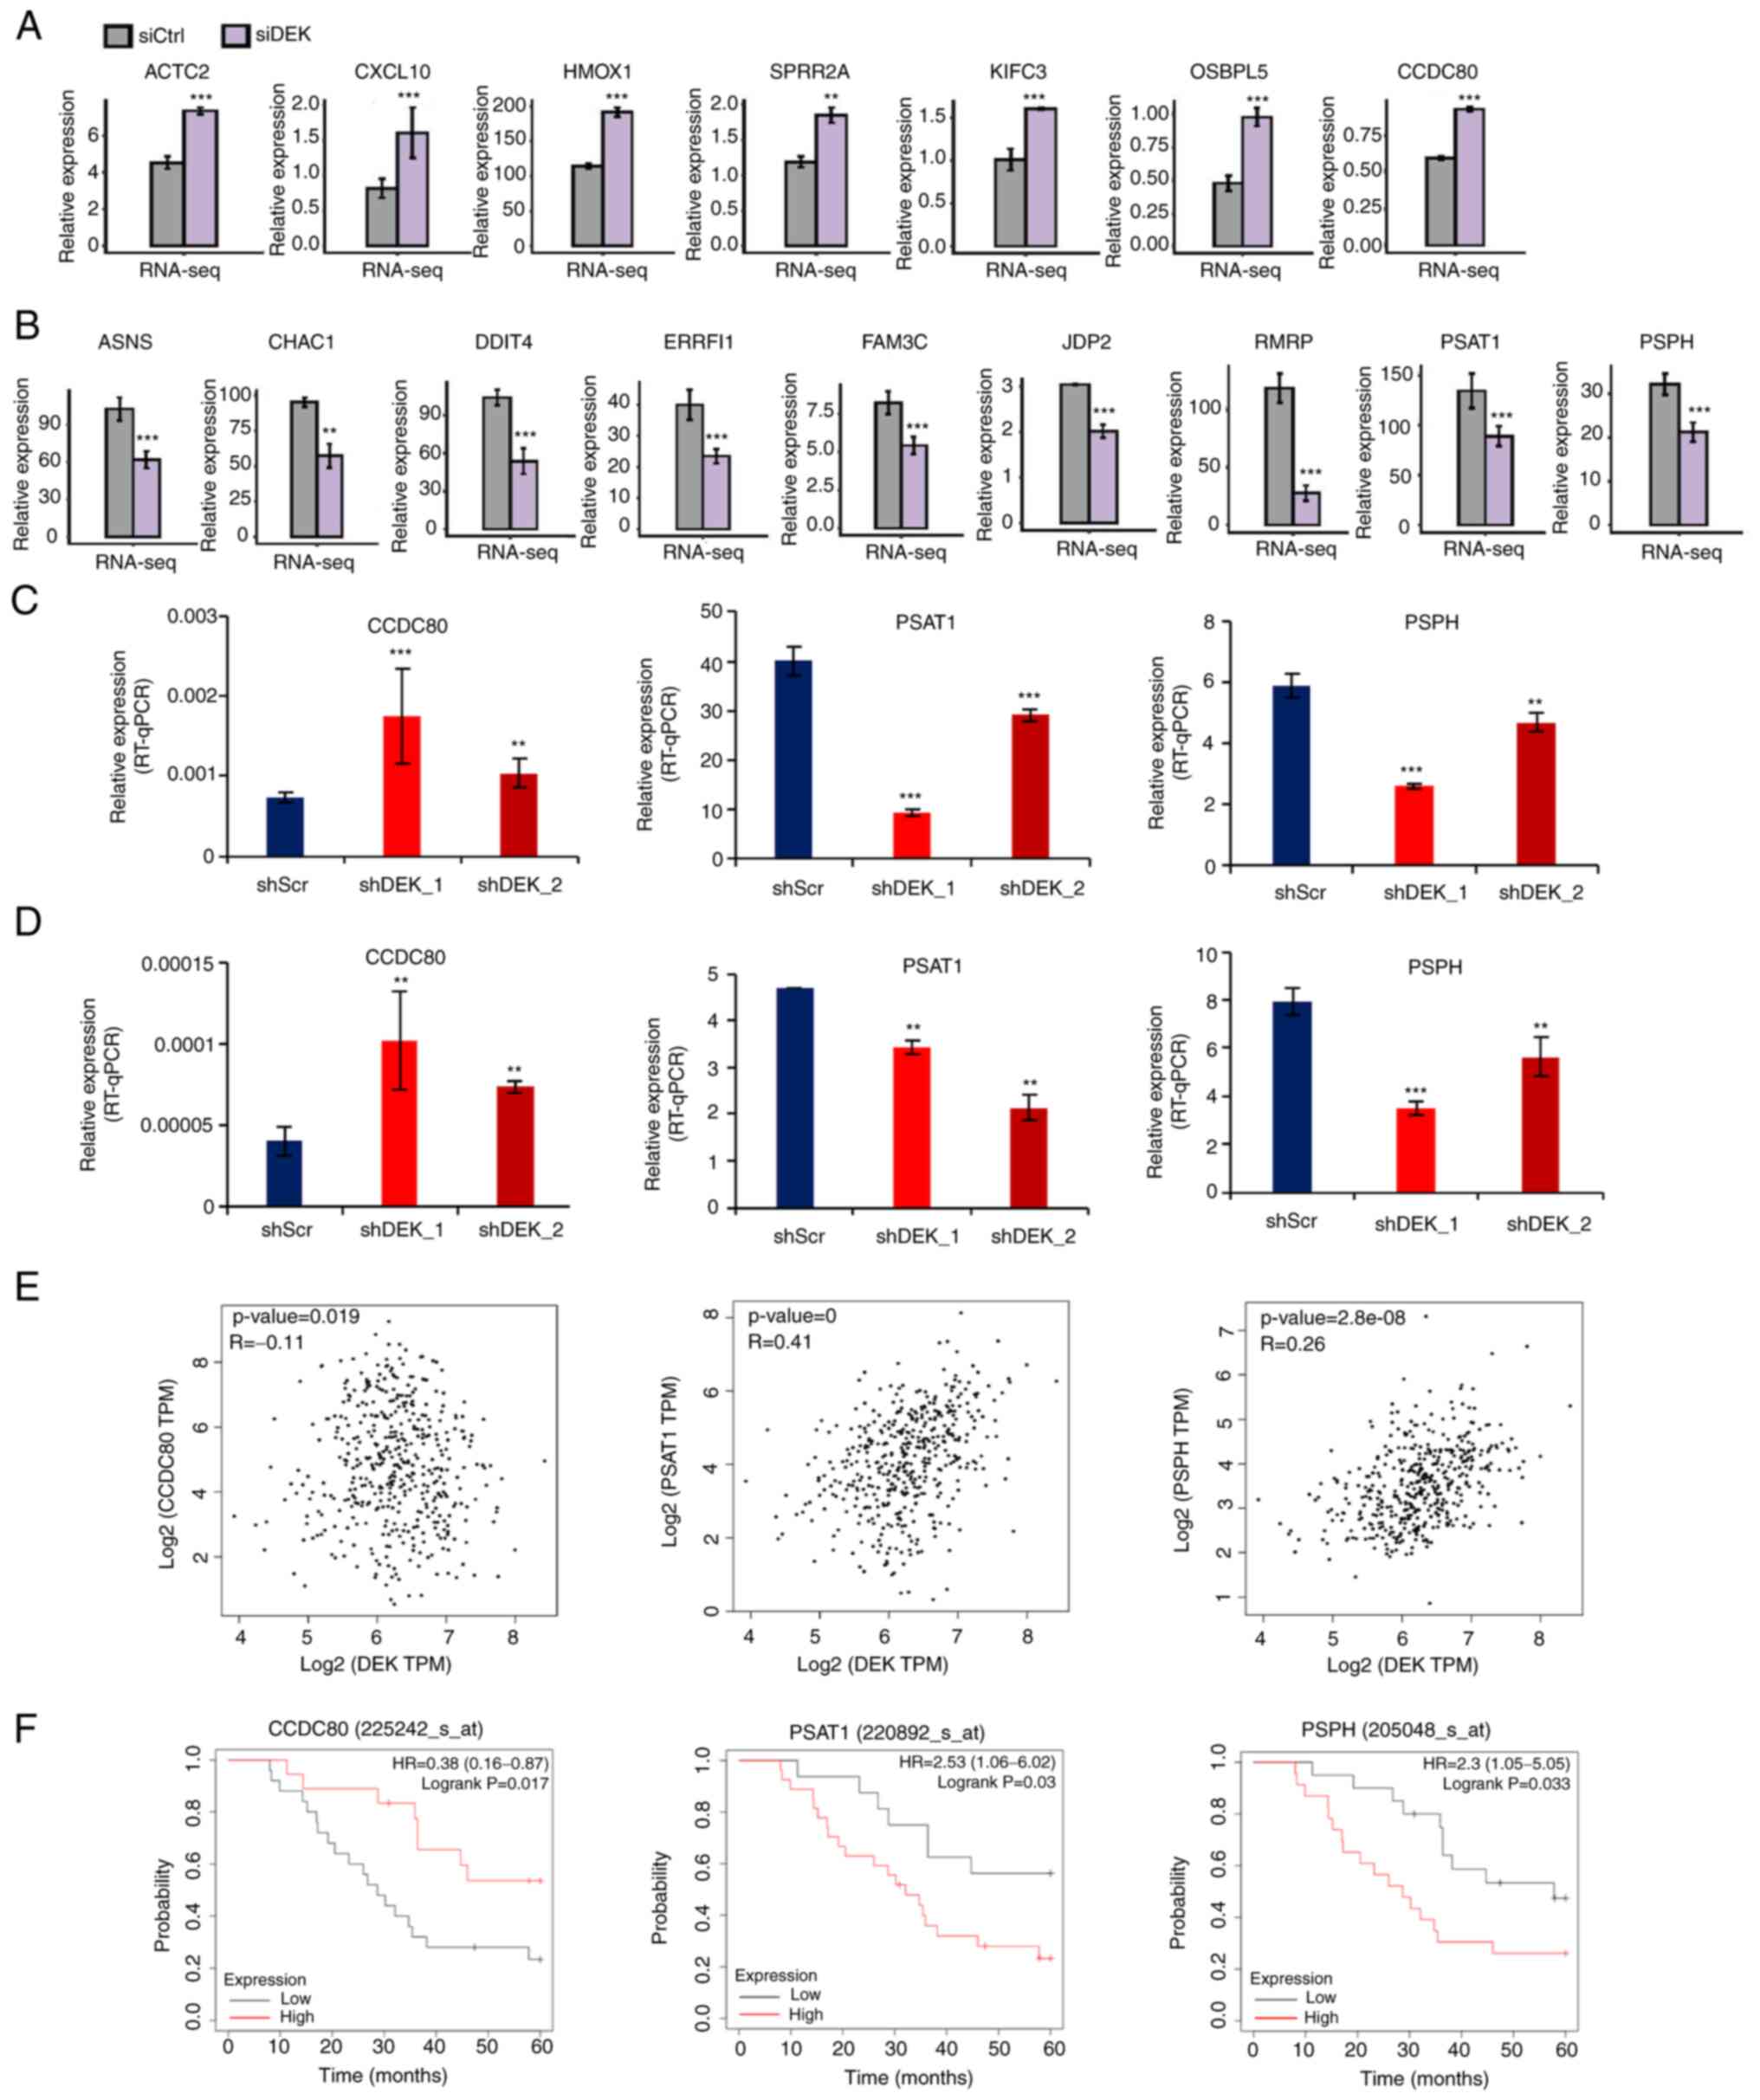 | Figure 3.Representative genes whose expression
is potentially regulated by DEK. (A and B) FPKM values of
representative DEGs that were significantly upregulated or
downregulated in the siDEK condition in a human GC cell line
AGS are shown as bar plots. Gray and purple bars show the FPKM
values of the siCtrl- and siDEK-treated AGS cells,
respectively. Bars and error bars represent means and SEMs,
respectively. **P<0.01, ***P<0.001. (C and D) Relative
expression levels of DEGs (% of GAPDH) in shRNA-infected cells in
AGS and NUGC4 cell lines were validated by RT-qPCR assay,
respectively. Statistical differences between groups (shScr and
either shDEK_1 or shDEK_2) were tested using one-way ANOVA with
Newman-Keuls multiple comparisons test, and P<0.05 was
considered statistically significant. Bars and error bars represent
the mean ± SD, respectively (n=3). **P<0.01, ***P<0.001. (E)
Correlation of gene expression levels between DEK and
CCDC80, PSAT1 and PSPH from public datasets are shown
as dot plots. Each dot represents a single GC case. All the data
were derived from the GEPIA2 database (http://gepia2.cancer-pku.cn/#correlation). (F)
Kaplan-Meier curves of GC patients as stratified with high and low
expression levels of CCDC80, PSAT1 and PSPH. All of the data were
obtained from the GSE22377 (N=43) dataset. (http://kmplot.com/analysis/index.php?p=service&cancer=gastric).
P-values were calculated by log-rank test. GC, gastric cancer;
FPKM, fragments per kilobase of transcript per million fragments
mapped; DEGs, differentially expressed genes; ACTA2, alpha smooth
muscle actin; CXCL10, chemokine (C-X-C motif) ligand 10; HMOX1,
heme oxygenase-1; SPRR2A, small proline-rich protein 2A; KIFC3,
kinesin family member C3; OSBPL5, oxysterol binding protein like 5;
CCDC80, coiled-coil domain containing 80; ASNS, asparagine
synthetase; CHAC1, cation transport regulator 1; DDIT4, DNA
damage-inducible transcript 4; ERRFI1, ERBB receptor feedback
inhibitor 1; FAM3C, FAM3 metabolism regulating signaling molecule
C; JDP2, Jun dimerization protein 2; RMRP, RNA component of
mitochondrial RNA processing; PSAT1, phosphoserine aminotransferase
1; PSPH, phosphoserine phosphatase. |
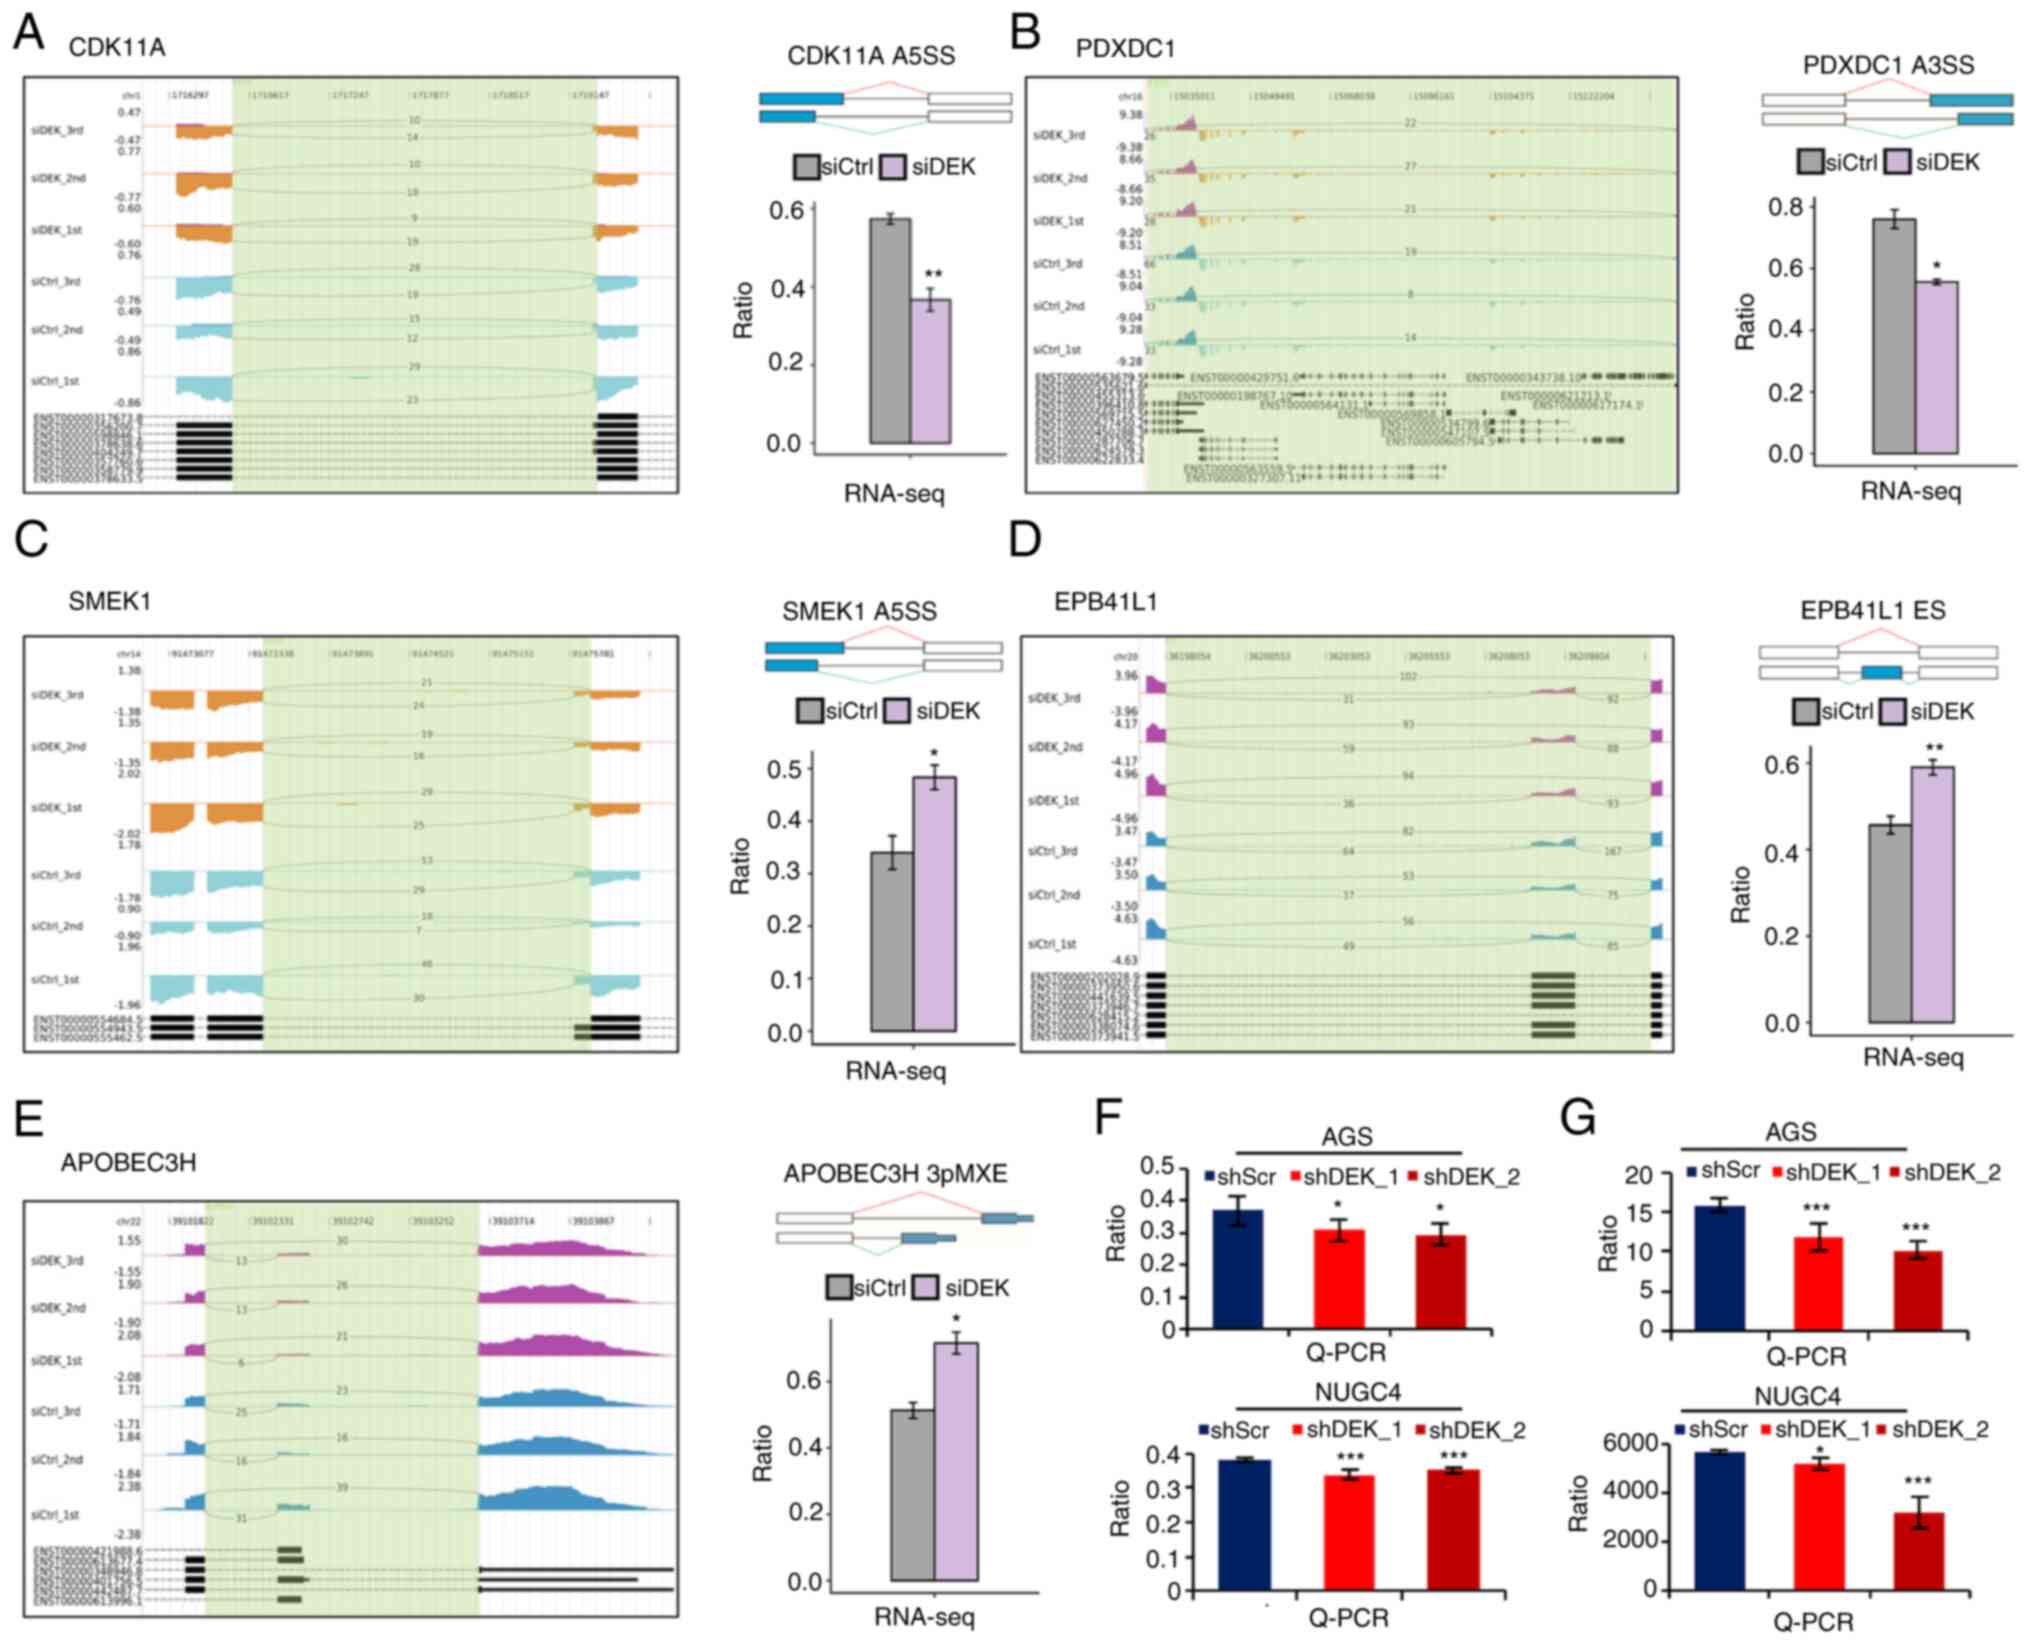 | Figure 4.DEK-regulated ASEs of the different
gene transcripts. (A-E) IGV-sashimi plots show the AS changes in
the siDEK conditions compared to the siCtrl. The
y-axis represents the corresponding sequence reads; the larger the
area, the more abundant the corresponding transcript is. Read
distributions were mapped either from 5′→3′ (positive values) or
from 3′→5′ (negative values) according to the corresponding
sequences of the human genome. The bottom of each figure exhibits
the annotated exons of the gene. The schematic diagram at the right
upper panel of each figure depicts the structure of ASE, AS1 (shown
in green) and AS2 (shown in red). The exons and introns are denoted
as boxes and lines, respectively, while the alternatively spliced
exons are shown as blue boxes. RNA-seq quantification of the ASEs
is shown as a bar graph. The y-axis represents the altered ratio of
ASEs calculated by the following formula: (alternative splice
junction reads/total sequence reads of the splice junction).
Student's t-test was performed to compare the values between the
siDEK and siCtrl conditions. *P<0.05, **P<0.01.
(F and G) RT-qPCR validation of representative DEK-regulated
alternative splicing events in CDK11A and PDXDC1 transcripts shown
in A and B. Validating RT-qPCRs were performed in AGS and NUGC4
cell lines. The y-axis represents the altered ratio of ASEs
calculated by the following formula: (AS1 transcripts level/AS2
transcripts level). Statistical differences between groups (shScr
and either shDEK_1 or shDEK_2) were tested using one-way ANOVA with
Newman-Keuls multiple comparisons test, and P<0.05 was
considered statistically significant. Bars and error bars represent
the mean ± SD, respectively (n=3). *P<0.05, ***P<0.001. ASEs,
alternative splicing events; CDK11A, cyclin-dependent kinase 11A;
PDXDC1, pyridoxal-dependent decarboxylase domain-containing 1;
SMEK1, SMEK homolog 1; EPB41L1, erythrocyte membrane protein band
4.1 like 1; APOBEC3H, apolipoprotein B mRNA editing enzyme
catalytic subunit 3H. |
Results
Expression of DEK is upregulated in
GC
In order to confirm that the expression of DEK is
upregulated in GC, we used TNMplot web tool (38) to browse available microarray data
in the Gene Expression Omnibus (GEO) database (https://www.tnmplot.com/), which included 1,221 and
360 unpaired samples from gastric cancer and normal gastric
mucosae, accordingly. The data displayed significantly higher
expression in GC tissues in the GEO dataset. Comparison between the
normal and tumor samples was performed using Mann-Whitney U test
(P=1.9×10⁻²⁸) (Fig.
1A). We also used TNMplot web tool (Bartha and Győrffy, 2021)
to browse available RNA-seq data in the The Cancer Genome Atlas
(TCGA) database and GTEx database (https://www.tnmplot.com/), which included 375 and 294
unpaired samples from gastric cancer and normal gastric mucosae,
accordingly. The data also displayed significantly higher
expression in GC tissues. Comparison between the normal and tumor
samples was performed using Mann-Whitney U test
(P=9.66×10−56) (Fig.
1B). Moreover, higher expression of DEK was also revealed to be
a significant indicator of worse prognosis of GC patients, as
revealed by the data from the Kaplan-Meier Plotter (http://kmplot.com/analysis/) (39) (Fig.
1C).
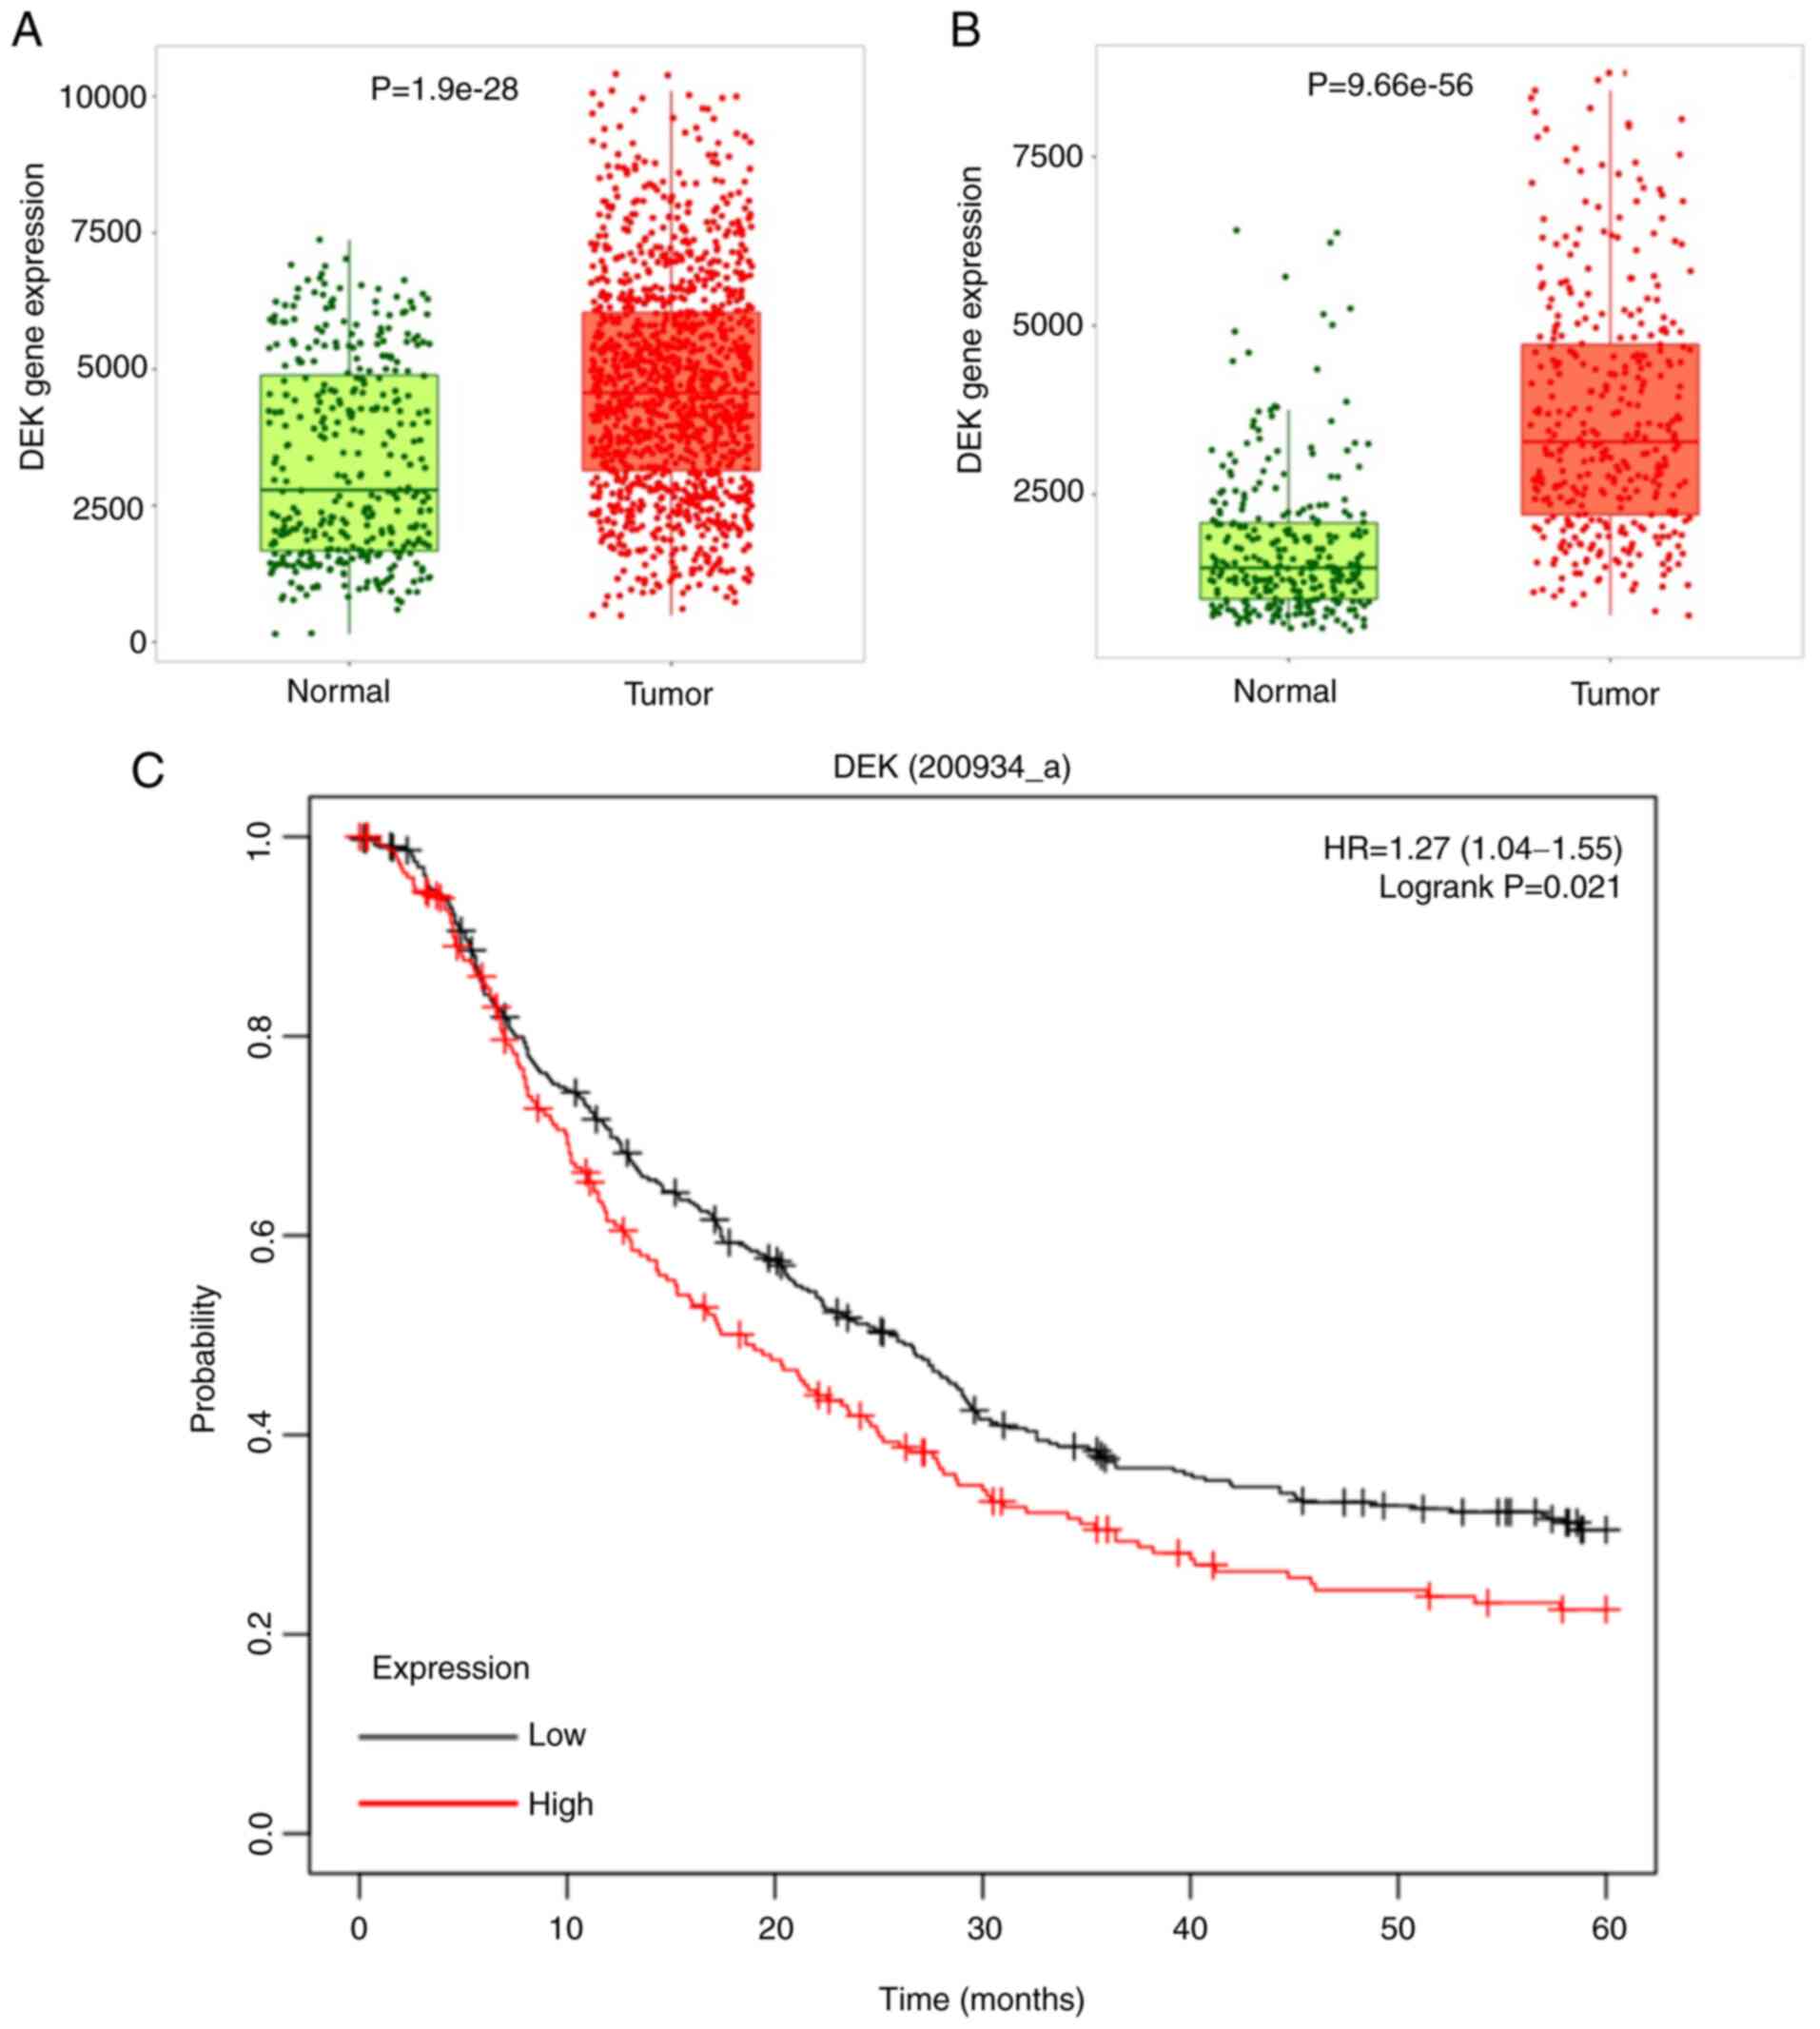 | Figure 1.Analysis of DEK expression levels in
GC and normal gastric tissues from the GEO, TCGA, and GTEx
database. (A) Expression of DEK in 360 normal and 1,221 GC
samples was plotted as a box-and-whisker plot. The boxplot shows
the difference in expression levels between normal and tumor
tissues verified by the Wilcox test, and there was a statistically
significant difference between the two (P=1.9×10⁻²⁸). In
the boxplot, green and red dots represent the corresponding
DEK gene expression levels of normal samples and tumor
samples, respectively. In the box, the upper line of the box
represents the upper quartile of DEK gene expression, and
the lower line represents the lower quartile of DEK gene
expression. Between the upper line and lower line of the box, the
amount of DEK expressed in 50% of the normal and tumor samples is
represented. The thick lines in the middle of the green and red
boxes indicate the median expression of the DEK gene in
normal and tumor samples, respectively. (B) The expression of
DEK in 294 normal and 375 GC samples was plotted as a
box-and-whisker plot as in A, and there was a statistically
significant difference between the two (P=9.66×10−56).
Statistical analysis was performed by Student's t-test; P<0.001.
(C) Kaplan-Meier curve of GC patients stratified by high or low
expression of DEK. Data were obtained from the following datasets.
Expression levels of DEK (200934_at) from GSE14210 (N=145),
GSE15459 (N=200), GSE22377 (N=43), GSE29272 (N=268), and GSE51105
(N=94). The difference was statistically tested using the log-rank
test, P<0.05. GC, gastric cancer; GEO, Gene Expression Omnibus;
TCGA, The Cancer Genome Atlas. |
Global gene expression profiles that
are regulated by DEK
To investigate DEK-mediated regulation of gene
expression, RNA-seq experiments were carried out to compare global
gene expression profiles between siCtrl- and
siDEK-treated human GC cell line AGS. We used two different
knockdown sequences; namely, shDEK_1 and shDEK_2, both of which
showed significant knockdown of DEK as shown by RT-qPCR and
Immunoblot analysis (Fig. 2A). We
used the siRNA containing shDEK_1 sequence for the initial RNA-seq
analysis. The cDNA libraries of the siRNA-treated cells (three
biological replicates) were constructed which were then sequenced
on a next-generation sequencer. Gene expression levels as
determined by FPKM values were calculated by an in-house pipeline
(see Materials and methods). The effective knockdown of DEK was
further confirmed in our RNA-seq analysis (Fig. 2B). FPKM values for all 60,498 gene
transcripts were used to calculate a correlation matrix based on
Pearson's correlation coefficient (Table SIII), and principal component
analysis (PCA) was used to display sample patterns (Fig. 2C). We used logarithmic
transformation of expression values for the PCA plot. The PCA
showed clearly different distributions between groups; thus, DEK
was revealed to affect global and defined gene expression patterns
in AGS cells.
Then, we explored gene transcripts whose expression
was potentially regulated by DEK. Differentially expressed genes
(DEGs) between siCtrl- and siDEK-treated AGS cells
were identified with cutoff values at fold change (FC) >1.5 or
<2/3 to identify upregulated and downregulated genes,
respectively. The DEGs related to siDEK are displayed in a
volcano plot in which genes marked in red and blue represent
significantly upregulated and downregulated genes by siDEK,
respectively (Fig. 2D). A heatmap
of the expression patterns of the DEGs showed a high consistency of
the siDEK-induced transcription in the biologically triplicated
data sets (Fig. 2E). In total, 149
and 229 genes were identified as upregulated and downregulated,
respectively, in the DEK-knockdown cells (Table SIV). Differentially expressed
genes (DEGs) between the siCtrl- and siDEK-treated
AGS cells were identified with cutoff values at fold change (FC)
>3 or <1/3 to identify upregulated and downregulated genes,
respectively (Table SV).
Differentially expressed genes (DEGs) between siCtrl- and
siDEK-treated AGS cells were identified with cutoff values
at fold change (FC) >4 or <1/4 to identify upregulated and
downregulated genes, respectively (Table SVI).
To investigate the potential biological roles of
DEK, all the identified DEGs in the siDEK-treated AGS cells
were subjected to pathway enrichment analyses based on the
annotations of GO terms and KEGG pathways. The upregulated and
downregulated genes in the siDEK-treated cells were enriched
in 5 and 6 GO terms, respectively, consisting of 30 and 44 genes
including duplicates, respectively (Tables SVII and SVIII). Among the terms of biological
processes, the upregulated genes were mainly enriched in
‘extracellular matrix organization’, ‘cell adhesion’, ‘signal
transduction’, and ‘transmembrane transport’ (Fig. 2F). The downregulated genes were
largely related to ‘nucleosome assembly’, ‘cellular nitrogen
compound metabolism’, ‘chromatin organization’, and ‘small molecule
metabolism’ (Fig. 2G). Among the
terms of the KEGG pathways, the upregulated genes were mainly
related to ‘cytokine-cytokine receptor interaction’, ‘EMC-receptor
interaction’, ‘hematopoietic cell lineage’, and ‘chemokine
signaling’ pathways (Fig. 2H). The
downregulated genes were largely related to ‘alcoholism’, ‘systemic
lupus erythematosus’, ‘viral carcinogenesis’, and ‘transcriptional
misregulation in cancer’ pathways (Fig. 2I).
DEK globally regulates the expression
of multiple cancer-related genes
The 149 upregulated and 229 downregulated genes were
identified in the siDEK condition (Table SIV). Among them, RNA-seq data of a
representatively selected 7 upregulated genes, ACTA2, CXCL10,
HMOX1, SPRR2A, KIFC3, OSBPL5, and CCDC80, and 9
downregulated genes, ASNS, CHAC1, DDIT4, ERRFI1, FAM3C, JDP2,
PSAT1, PSPH, and RMRP are shown in Fig. 3A and B. These genes were
significantly upregulated or downregulated in the siDEK
condition as well as identified in the categories of significantly
enriched GO biological processes in our analysis and have also been
known to be linked to cancer development with respect to apoptosis,
invasion, proliferation, or migration of cancer cells (40–55).
In order to verify the RNA-seq results, we conducted RT-qPCR
analysis. The shRNAs containing scramble control, shDEK_1, and
shDEK_2 were infected into AGS and NUGC4 cells. A representative
upregulated DEG and two representative downregulated DEGs,
including CCDC80, PSAT1, and PSPH, were subjected to
RT-qPCR analysis. The results of this experiment are presented in
Fig. 3C and D. RNA-seq results
were confirmed in all the candidate genes investigated in both AGS
and NUGC4 cells treated with two different shRNA sequences
(Fig. 3C and D). Based on public
datasets of gene expression profiles of GC cases, it was revealed
that some, if not all, of the representative upregulated and
downregulated genes identified in this study, were negatively and
positively correlated with DEK expression, respectively, in
clinical GC samples (Fig. 3E).
Furthermore, these representative genes were also significantly
associated with better and worse prognoses of GC patients,
respectively, in some, if not all, of the independent public
datasets (Fig. 3F). These results
conclude that DEK globally regulates the expression of multiple
oncogenes and tumor-suppressor genes. These statistical
correlations were only modest and more precise investigation with
larger cohorts will be necessary in future research.
DEK globally regulates alternative
splicing of multiple cancer-related genes
To gain further insights into the role of DEK on
alternative splicing regulation, we analyzed RNA-seq data to
explore the DEK-mediated alternative splicing events (ASEs) in the
human GC cell line AGS. We detected 62.48% (229,508 out of 367,321)
of the annotated exons, confirmed a total of 149,370 known splicing
sites, and found 132,858 novel splicing sites (Tables SIX and X). We then analyzed the ASEs and
detected a total of 16,536 known ASEs in reference genes and 42,229
novel ASEs, excluding intron retention (IR) (Table SXI).
In order to further analyze the differences in
frequencies of the alternative splicing that were probably
regulated by DEK [named regulated ASEs (RASEs)], we statistically
compared the ASE profiles of siCtrl and siDEK conditions using a
t-test with a criterion of P-value ≤0.05. RASEs with t-values >0
and <0 were marked as AS-up and -down, respectively. In total,
we identified 1,036 RASEs (Table
SXII), which consisted of 218 IR RASEs (including 51 known
RASEs) and 818 non-IR (NIR) RASEs.
ASEs are mainly classified into various subtypes
such as alternative 5′splice site (A5SS), mutually exclusive exon
(MXE), mutually exclusive 5′UTR (5PMXE), exon skipping (ES),
alternative 3′splice site (A3SS), intron resist (IntronR), mutually
exclusive 3′UTRS (3PMXE), A3SS&ES, cassette exon, and
A5SS&ES (56). Representative
schemas of the ASEs in CDK11A (A5SS), SMEK1 (A5SS),
EPB41L1 (ES), PDXDC1 (A3SS), and APOBEC3H
(3PMXE) transcripts are displayed in Fig. 4A-E, where significant differences
in the frequency of ASEs between siDEK and siCtrl
conditions are shown. These representative genes have been reported
to be associated with multiple molecular mechanisms related to
carcinogenesis (57–61). To validate DEK-regulated
alternative splicing events identified from the RNA-seq data in
this study, we performed RT-qPCR to quantify the frequencies of
candidate splicing events, using two different cell lines, AGS and
NUGC4, treated with two independent shRNA sequences, shDEK_1 and
shDEK_2 (Fig. 4F and G). PCR
primer pairs are listed in Table
SII, which were designed to specifically amplify either longer
or shorter splicing isoforms. Candidate alternative splicing events
in CDK11A and PDXDC1 genes were clearly validated by
RT-qPCR in agreement with the RNA-seq results (Fig. 4F and G). Due to the technical
difficulties such as in designing primers which specifically
amplify designated splicing isoforms, further validation of other
splicing events identified in the RNA-seq remains to be conducted
in the next research plan.
Among the various subtypes of ASEs, the majority of
the RASEs identified in this study were A5SS (231 events), A3SS
(209 events), and ES (142 events) (Fig. 5A). These data clearly indicated
that DEK globally regulates ASEs in the human GC cell line AGS. To
investigate whether or not DEK simultaneously regulates gene
expression and alternative splicing on the same set of target
genes, we explored the overlaps of the RASEs and DEGs identified in
our analyses. It was revealed that only 10 genes commonly exhibited
significant differences in both expression levels and splicing
events (Fig. 5B and Table SXIII), suggesting that DEK
regulates gene expression and alternative splicing in different
mechanisms. A heat map analysis of the frequencies of RASEs in
affected genes clearly showed substantially high consistencies of
the siDEK-induced ASEs in the biologically triplicated cells
(Fig. 5C). Pathway enrichment
analyses were further conducted to identify possible biological
impacts of these DEK-mediated RASGs (regulated alternative splicing
genes) in a global manner, revealing that the RASGs in the siDEK
condition were highly enriched for genes related to ‘mitotic cell
cycle’, ‘gene expression’, and ‘apoptotic process’ pathways among
others based on the GO biological process terms (Fig. 5D and Table SXIV). In regards to the KEGG
pathways, RASEs were likely enriched in ‘p53 signaling’, although
statistically not significant (Fig.
5E and Table SXV).
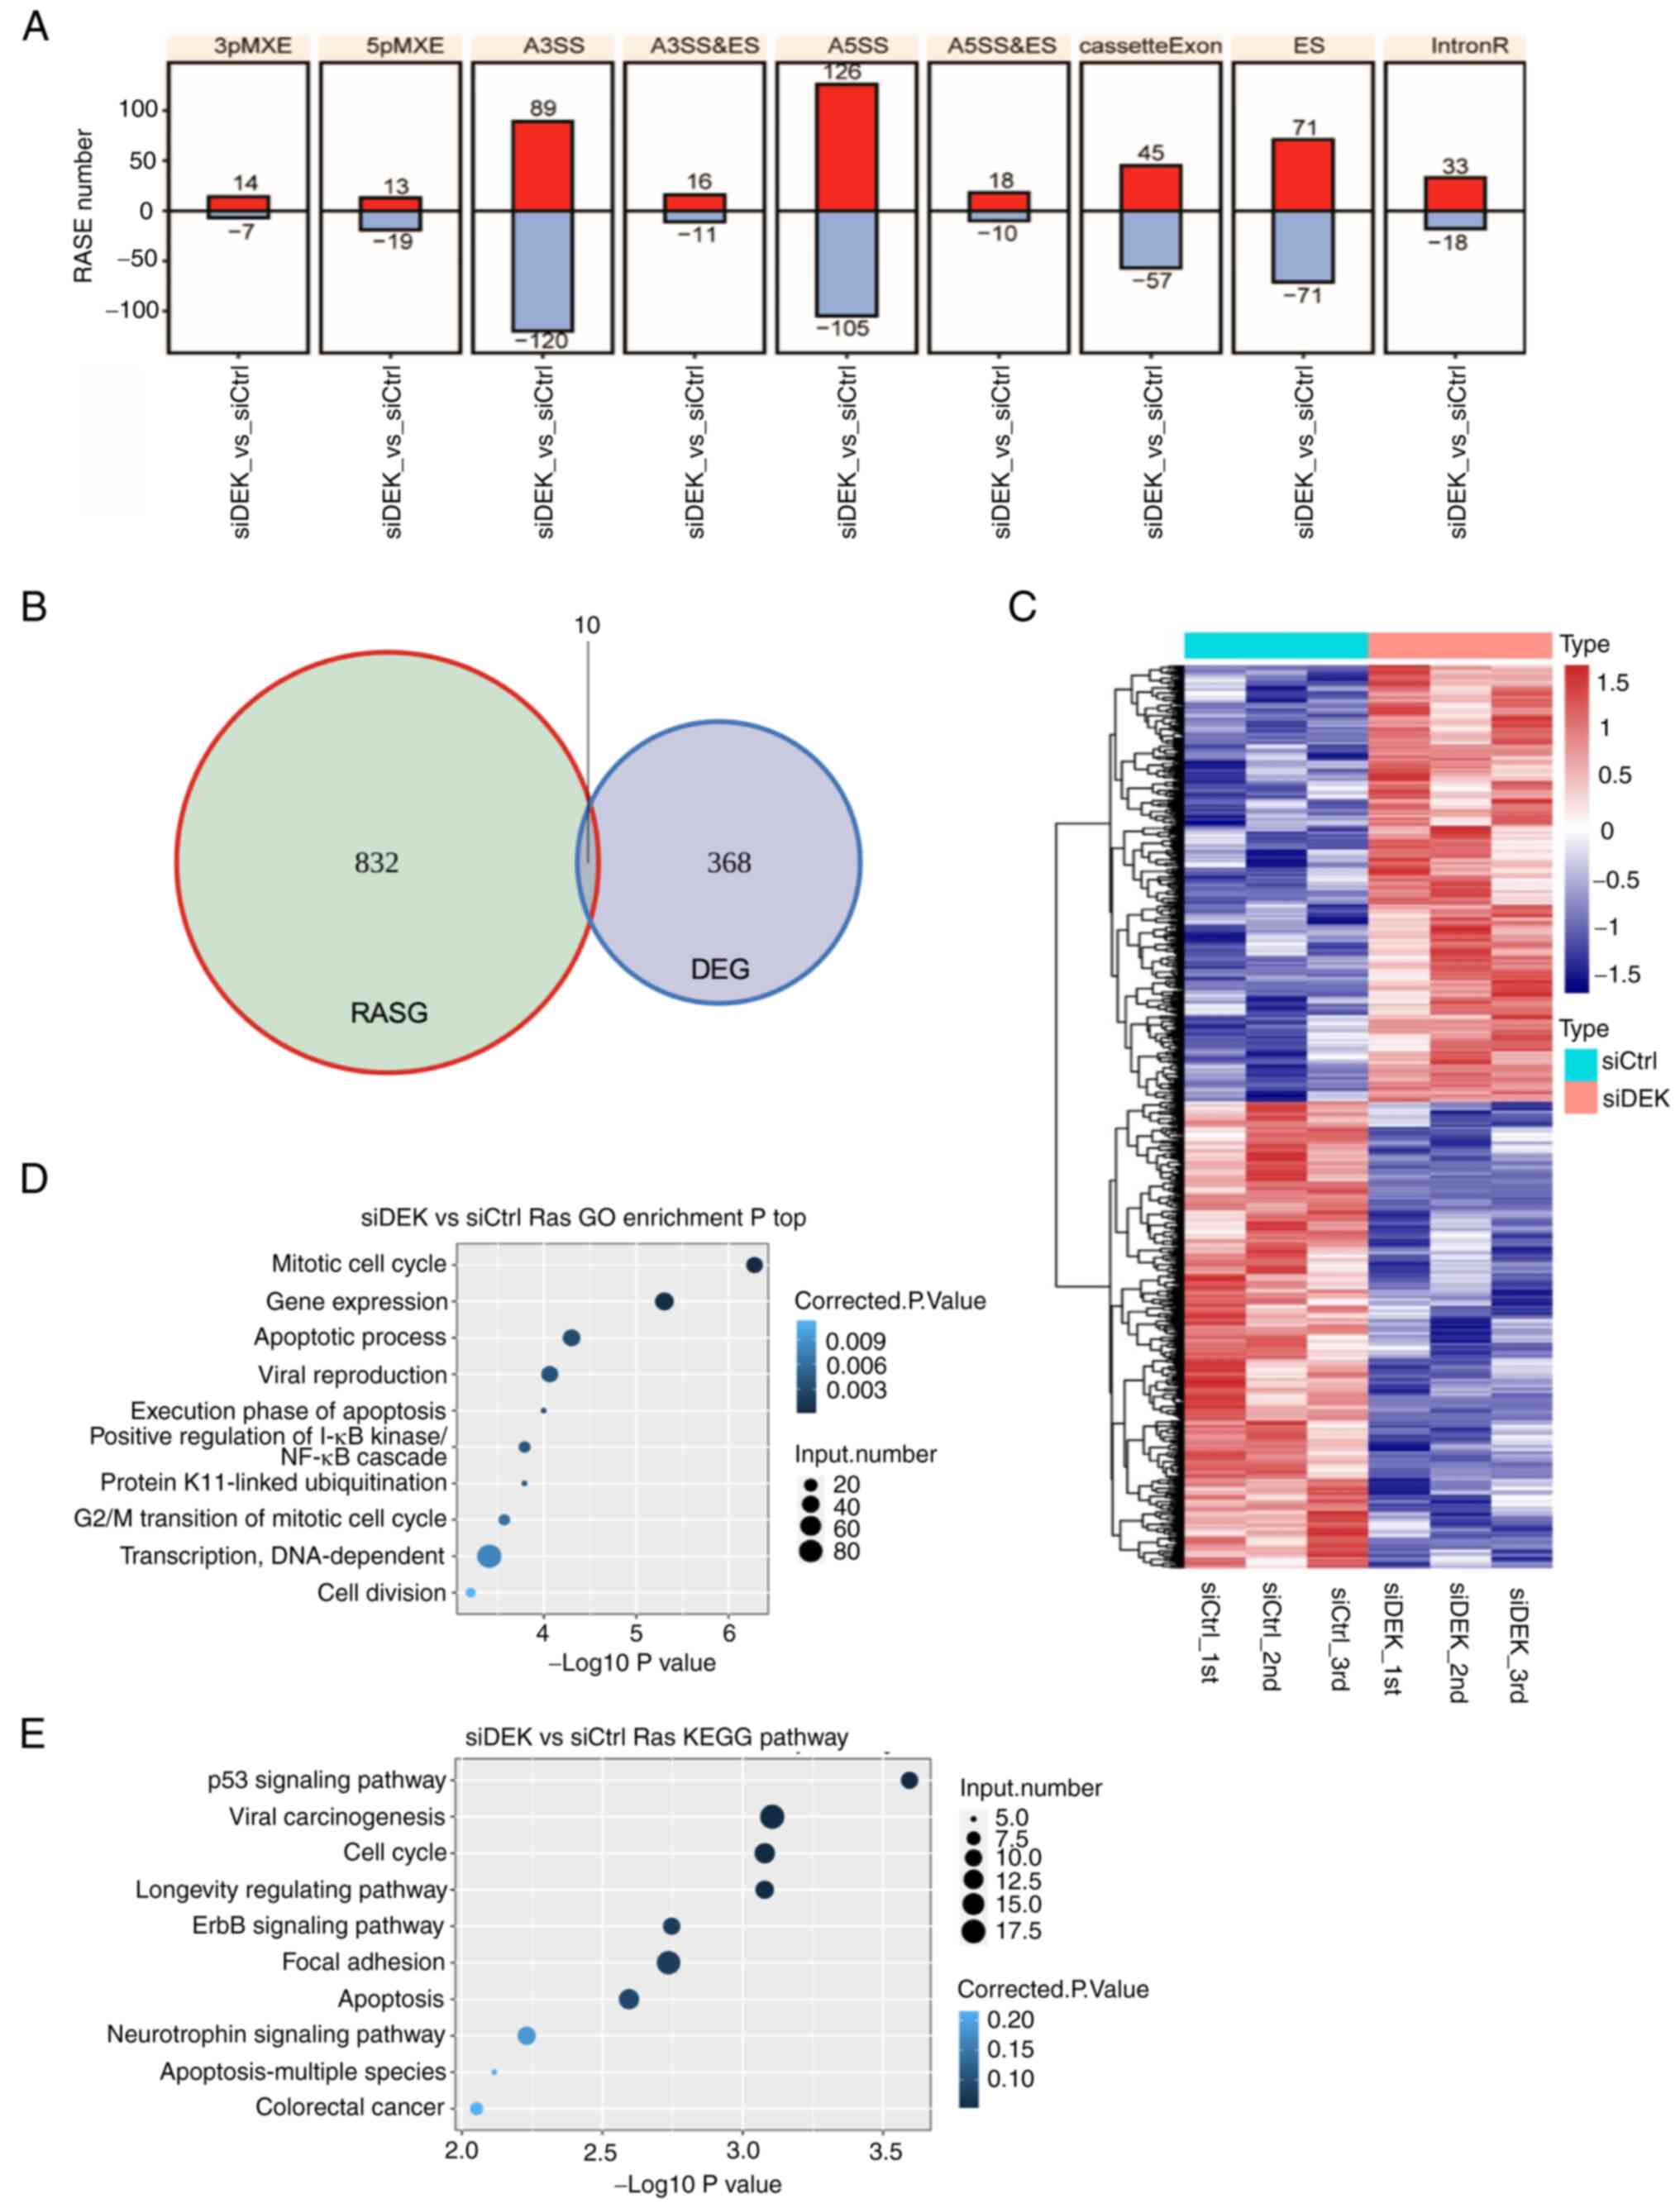 | Figure 5.Global picture of the RASEs that are
regulated by DEK. (A) Frequency distributions of different types of
DEK-regulated ASEs. Red and blue bars represent the increase and
decrease in the numbers of RASEs in the siDEK condition,
respectively. The y-axis represents the number of genes. (B) The
overlap between DEGs and DEK-regulated ASEs is shown as a Venn
diagram. Numbers represent gene numbers in each category. (C)
Hierarchical clustering of the frequencies of ASEs in genes in the
siCtrl and siDEK conditions. Frequencies of the ASEs
are shown as gradient colors of blue and red, as indicated at the
right side of the figure. (D and E) The top 10 most enriched
pathways of GO biological processes and KEGG pathways among the
RASGs. The corrected P-values and number of genes in each category
are indicated as colors and sizes of dots, as indicated at the
right sides of the figures. RASEs, regulated alternative splicing
events; DEGs, differentially expressed genes; RASGs, regulated
alternative splicing genes; GO, Gene Ontology; KEGG, Kyoto
Encyclopedia of Genes and Genomes; A3SS&ES, alternative
3′splice site and exon skipping; A5SS&ES, alternative 5′splice
site and exon skipping MXEs mutually exclusive exon. |
The whole genomic profiling of the RASGs by the
RNA-seq of a human GC cell line AGS with or without DEK knockdown
revealed that DEK globally regulates not only gene expression but
also alternative splicing in multiple important cancer-related
genes and pathways. Thus, DEK possibly plays important role in
gastric tumorigenesis.
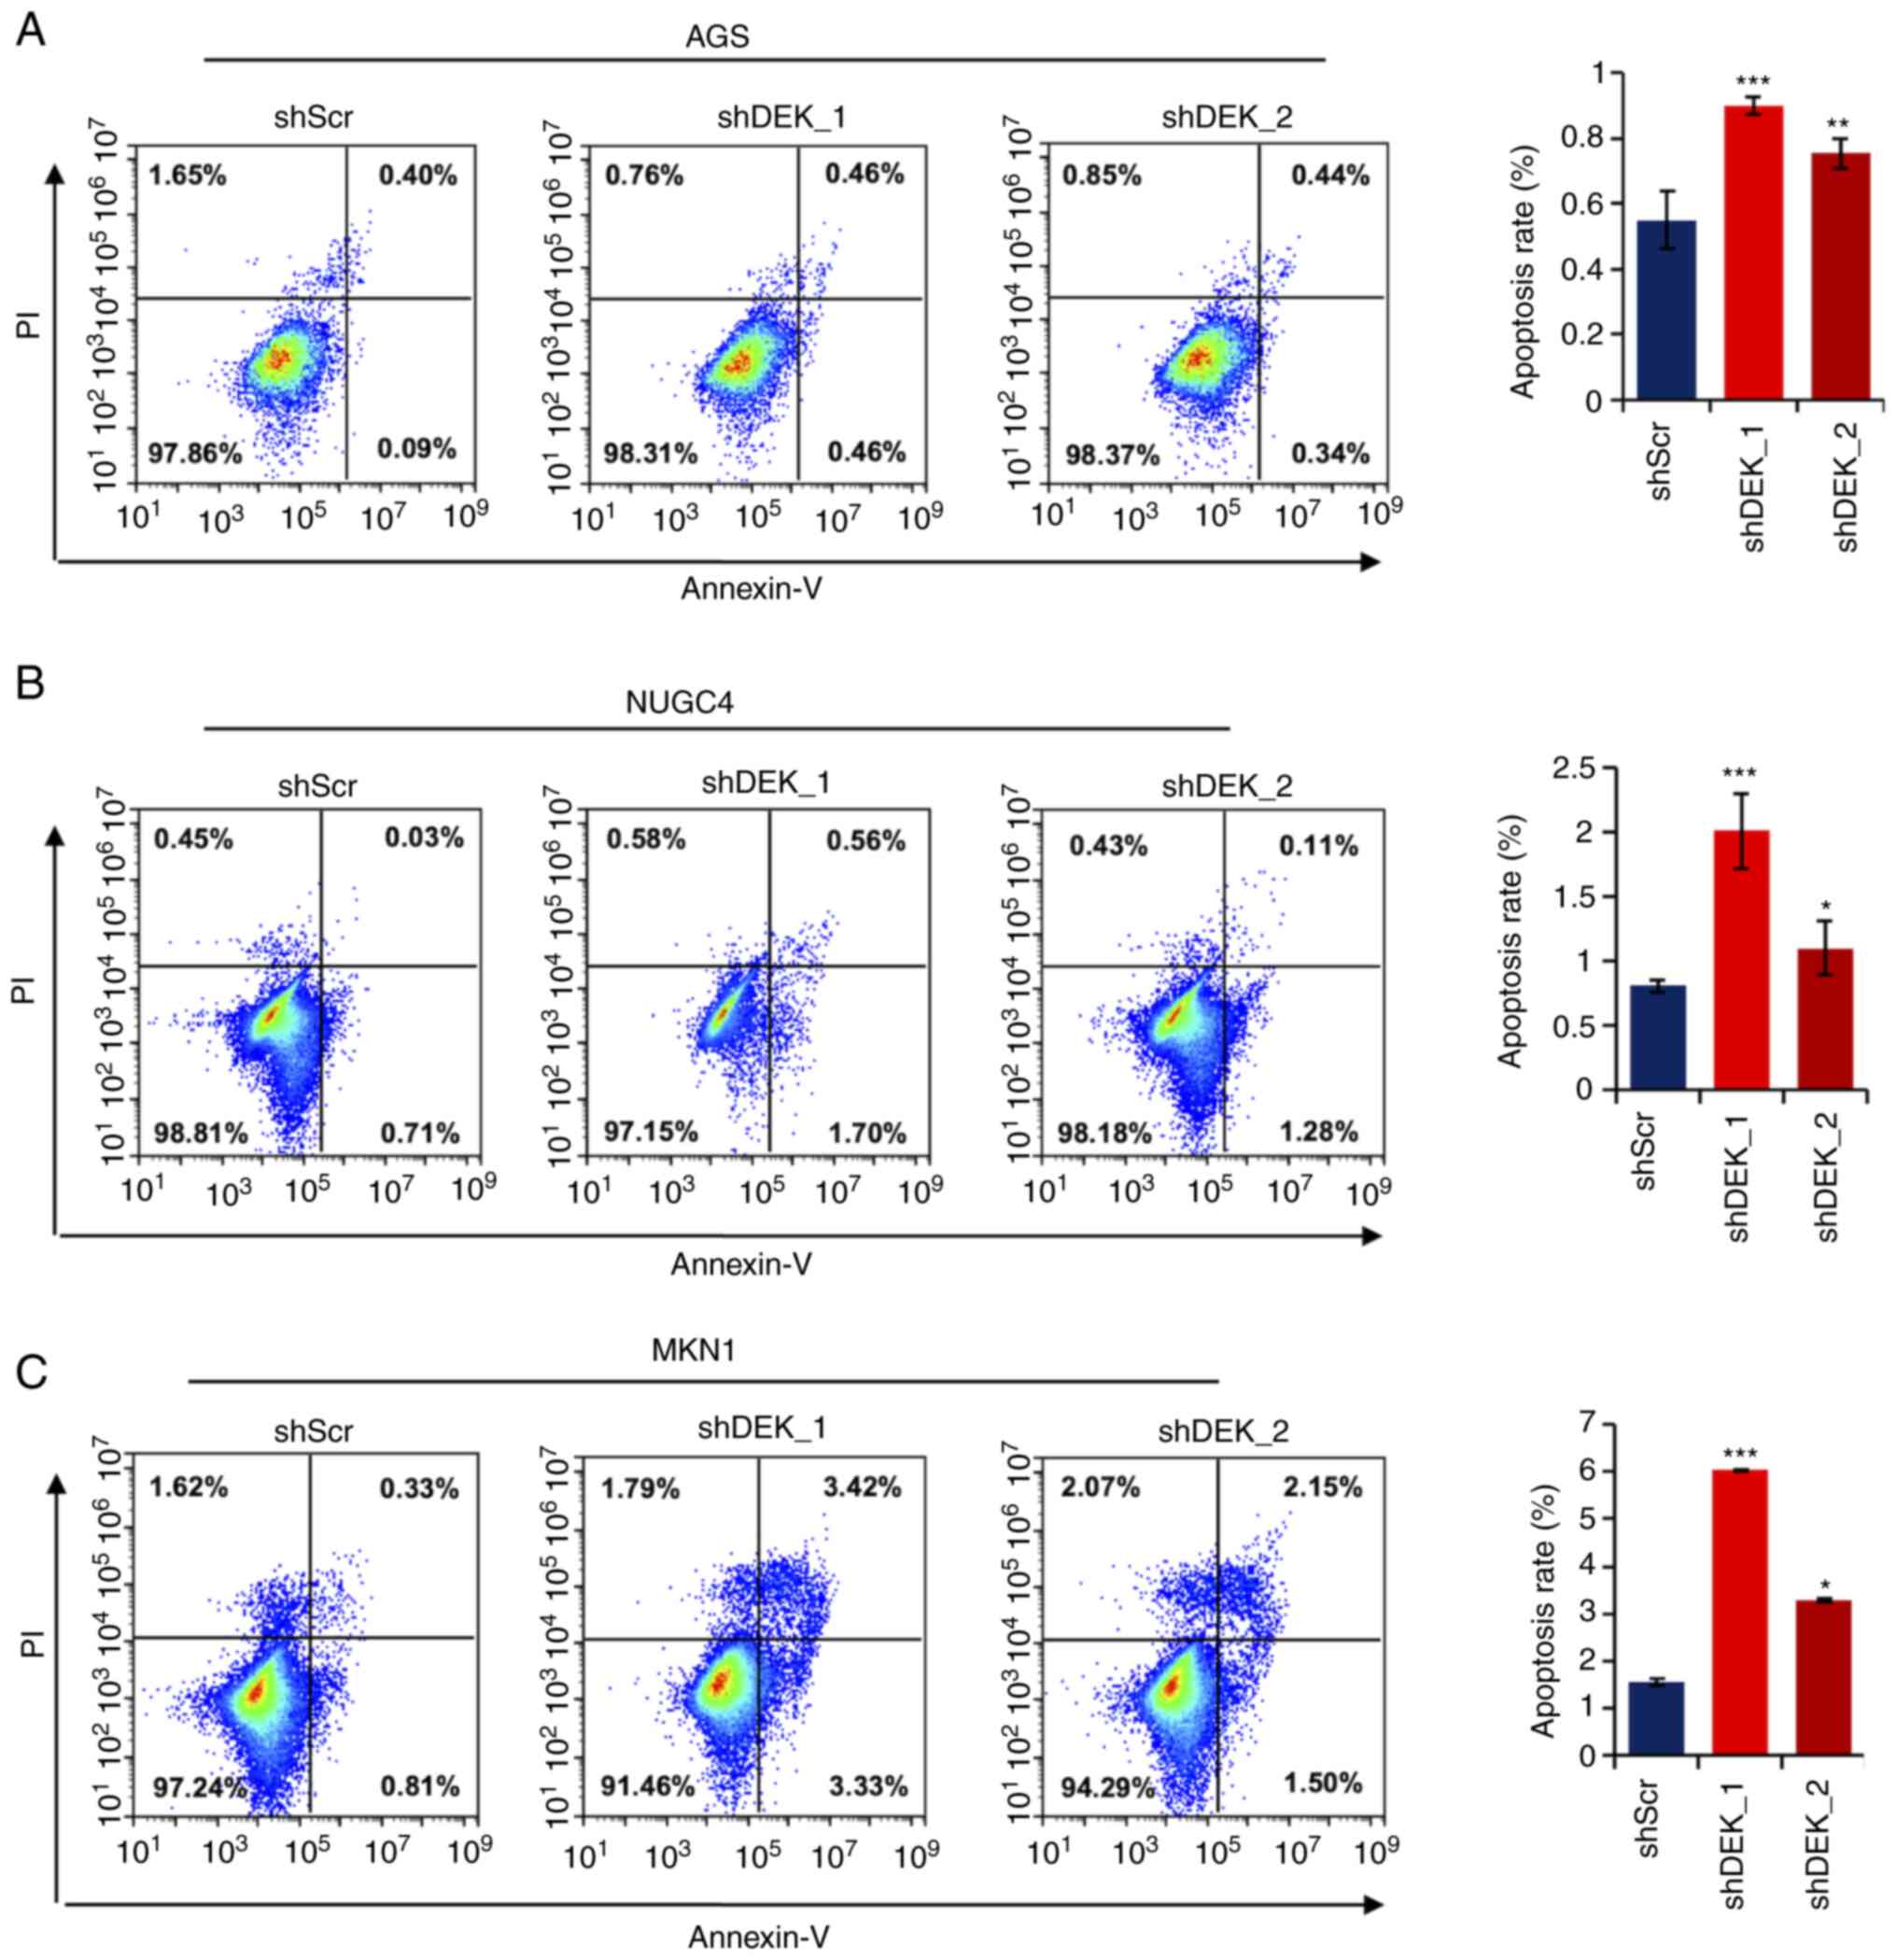
DEK knockdown induces apoptosis in
gastric cancer cells
To examine whether DEK knockdown affects apoptotic
pathways as revealed by the GO analysis above, we examined
frequencies of apoptosis in cells treated with shRNAs for DEK. As
shown in Fig. 6A, in all the
gastric cancer cell lines investigated, AGS, NUGC4, and MKN1, the
frequencies of apoptotic cells were significantly increased in both
the shDEK_1-treated and shDEK_2-treated cells (Fig. 6A-C). These data robustly reveal
that DEK knockdown significantly induces apoptosis in GC
cells.
Discussion
The present study, for the first time, clarified
whole-genomic images of DEK-mediated gene regulations both from
transcription and alternative splicing levels in a human GC cell
line. Although DEK has been thought to play oncogenic roles in
various malignancies (6,7,27,62–64),
its precise mechanisms of gene regulation remain elusive. This
study confirmed previous knowledge that DEK is overexpressed in GC
as well as is a prognostic marker for GC patients; moreover, our
results showed that DEK simultaneously affects a number of genes in
important cancer-related pathways, supporting its oncogenic roles
in gastric carcinogenesis.
Focusing on important cancer-related genes which we
found are positively regulated by DEK, expression of phosphoserine
aminotransferase 1 (PSAT1) and phosphoserine phosphatase
(PSPH), for instance, also showed mild but significant
positive correlations with DEK expression among GC samples in
public datasets; moreover, higher expression of those genes
indicated significantly worse prognoses of GC patients. These
observations are consistent with the molecular functions of these
genes. In that, PSAT1 overexpression has been observed in multiple
tumor types and is associated with poorer clinical outcomes,
related to EGFR activation (65),
and PSAT1 contributes to lung cancer cell migration in part by
promoting nuclear PKM2 translocation (65). PSPH promotes melanoma growth and
metastasis by metabolic deregulation-mediated transcriptional
activation of NR4A1 (54). On the
other hand, among genes that we discovered to be negatively
regulated by DEK, negative correlations of expression with DEK and
prognostic significance of coiled-coil domain containing 80
(CCDC80) were confirmed in public datasets of GC cases.
CCDC80 is known to be a pro-apoptotic molecule and its
expression is positively correlated with that of E-cadherin in
thyroid carcinoma and is also identified as a strong suppressor for
colitis and colorectal carcinogenesis (40,66).
Therefore, it can be concluded that DEK regulates the expression
levels of important oncogenes and tumor-suppressor genes.
However, since DEK simultaneously regulates a
substantially wide variety of target genes at a time, functional
inconsistencies were also identified; such that DEK could
positively and negatively regulate the expression of tumor
suppressors and oncogenes, respectively. For example, and not
limited to, KIFC3 and OSBPL5 which were negatively
regulated by DEK, where siDEK upregulated their expression,
are well-known oncogenes (44,46,67).
DEK has been reported to inhibit cell differentiation, senescence,
and apoptosis, and to promote cell survival and proliferation in
cancer cells (22). Based on the
finding in this study, it is considered that these oncogenic
phenotypes exerted by DEK are the consequences of the combinations
of the global gene regulatory network of DEK that can work
providing both oncogenic and tumor-suppressive potential. Further
investigations focusing on not only molecular functions of each
target gene but also the context-dependent interactions of
DEK-mediated global modifications of signaling pathways will be
required to fully clarify the oncogenic function of DEK.
Our study is the first one where DEK-mediated
alternative splicing events were investigated in a whole-genomic
manner, revealing that DEK affected substantially large numbers of
alternative splicing in a GC cell line. In the present study, it
was revealed that at least 832 transcripts were significantly
regulated by DEK in a GC cell line. Many of the DEK-mediated
alternative splicing events (ASEs) were identified as A5SS and
A3SS, which is consistent with the function of DEK in which DEK
enforces discriminations by U2AF between 3′splicing cites AG and CG
(13). Importantly, we found that
many ASEs were found in transcripts of important oncogenes and
tumor-suppressor genes, including CDK11A, SMEK1, EPB41L1,
PDXDC1, and APOBEC3H. SMEK homolog 1 (SMEK1) was
reported to exert its antitumor role by inhibiting the
phosphorylation of Akt/mTOR in ovarian cancers (58). Erythrocyte membrane protein band
4.1 like 1 (EPB41L1) plays a tumor-suppressive role by
affecting Wnt/β-catenin signaling in non-small cell lung cancers
(59). On the other hand, among
such RASEs of DEK, cyclin-dependent kinase 11A (CDK11A) is a
well-known oncogene (57).
Pyridoxal-dependent decarboxylase domain-containing 1
(PDXDC1) is reported to be somatically mutated in renal cell
cancers (60), although its
cancer-related function has not been established. Apolipoprotein B
mRNA editing enzyme catalytic subunit 3H (APOBEC3H) is known
to regulate the integrity of the genome (61). Importantly, functional consequences
of the alternative splicing in genes are biologically difficult to
predict. If the alternative splice site events (e.g., A5SS and A3SS
which we found frequently in our dataset) result in frameshifts of
the affected transcripts, it would be considered to result in
loss-of-function of the gene. However, if alternative splicing
created in-frame variants of genes, their molecular functions are
not easily assumed and require extensive biological investigations
of the affected transcript. Thus, although we could identify a
global catalog of ASEs that were regulated by DEK, their molecular
consequences should be investigated further to fully clarify the
molecular functions of affected genes as well as the
context-dependent regulatory networks of those DEK-mediated ASEs in
view of global signaling pathways in cancer cells.
The sequence organization and DNA-binding and
RNA-binding properties of DEK suggest that it could have dual
functions in the mRNA synthesis at the transcriptional and
post-transcriptional levels. An intriguing question is whether or
not DEK regulates both gene expression and alternative splicing on
the overlapped targets. In the present study, it was revealed that
the overlaps between the DEK-mediated regulations of gene
expression and those of ASEs are almost negligible, indicating that
the molecular mechanisms of DEK-mediated transcription regulation
and post-transcriptional splicing modification should be exerted in
different types of machinery. It would be a scientifically
important issue to identify various subsets of protein-protein
complexes of DEK-related machinery and reveal their molecular
function in either transcriptional and post-transcriptional
regulations.
In the present study, we successfully applied
RNA-seq technology to investigate the role of DEK in a human GC
cell line, demonstrating that DEK regulates both transcription and
alternative splicing in a number of genes some of which are
significantly enriched in important cancer-related pathways. DEK
has been reported to play pivotal oncogenic roles in various
malignancies, and our study at least in part shed light on its
molecular mechanisms. Further molecular investigations of the
target genes of DEK that our RNA-seq pointed out would further help
develop DEK as a diagnostic and therapeutic target for GC.
Supplementary Material
Supporting Data
Supporting Data
Supporting Data
Supporting Data
Supporting Data
Supporting Data
Supporting Data
Supporting Data
Supporting Data
Supporting Data
Supporting Data
Supporting Data
Supporting Data
Supporting Data
Supporting Data
Acknowledgements
We are very grateful to Dr Shumpei Ishikawa and Dr
Hiroto Katoh for their thoughtful discussion of this study.
Funding
This research was partly supported by grants from the China
Scholarship Council (no. 202006170206) to B.L. This research was
supported by the Natural Science Foundation of Jilin Province,
China (no. 20200201168JC) to J.S.
Availability of data and materials
The datasets analyzed during the current study are
available in SRA (https://www.ncbi.nlm.nih.gov/sra, PRJNA743794).
Authors' contributions
BL performed the experiments, contributed to
analysis and interpretation of the data, and was a major
contributor in writing the manuscript. YS and JS performed the
experiments, and contributed to the drafting and revision of the
manuscript. YZ, JS and YX contributed to the conception and design
of the study, the data analysis and interpretation, and the writing
and revision of the manuscript. All authors read and approved the
manuscript and agree to be accountable for all aspects of the
research in ensuring that the accuracy or integrity of any part of
the work (in particular the provided data) are appropriately
investigated and resolved.
Ethics approval and consent to
participate
Not applicable.
Patient consent for publication
Not applicable.
Competing interests
The authors declare that they have no competing
interests.
Glossary
Abbreviations
Abbreviations:
|
A3SS & ES
|
alternative 3′splice site and exon
skipping
|
|
A5SS & ES
|
alternative 5′splice site and exon
skipping
|
|
ACTA2
|
alpha smooth muscle actin
|
|
APOBEC3H
|
apolipoprotein B mRNA editing enzyme
catalytic subunit 3H
|
|
AS
|
alternative splicing
|
|
ASEs
|
alternative splicing events
|
|
ASNS
|
asparagine synthetase
|
|
CCDC80
|
coiled-coil domain containing 80
|
|
CDK11A
|
cyclin-dependent kinase 11A
|
|
CHAC1
|
cation transport regulator 1
|
|
CXCL10
|
chemokine (C-X-C motif) ligand 10
|
|
DDIT4
|
DNA damage-inducible transcript 4
|
|
DEG
|
differentially expressed gene
|
|
EPB41L1
|
erythrocyte membrane protein band 4.1
like 1
|
|
ERRFI1
|
ERBB receptor feedback inhibitor
1
|
|
FAM3C
|
FAM3 metabolism regulating signaling
molecule C
|
|
FC
|
fold change
|
|
FDR
|
false discovery rate
|
|
GEO
|
Gene Expression Omnibus
|
|
GO
|
Gene Ontology
|
|
HMOX1
|
heme oxygenase-1
|
|
JDP2
|
Jun dimerization protein 2
|
|
KD
|
knockdown
|
|
KEGG
|
Kyoto Encyclopedia of Genes and
Genomes
|
|
KIFC3
|
kinesin family member C3
|
|
MXEs
|
mutually exclusive exons
|
|
OSBPL5
|
oxysterol binding protein like 5
|
|
PDXDC1
|
pyridoxal-dependent decarboxylase
domain-containing 1
|
|
PSAT1
|
phosphoserine aminotransferase 1
|
|
PSPH
|
phosphoserine phosphatase
|
|
RASEs
|
regulated alternative splicing
events
|
|
RMRP
|
RNA component of mitochondrial RNA
processing
|
|
RNA-Seq
|
RNA sequencing
|
|
RT-qPCR
|
quantitative reverse
transcription-polymerase chain reaction
|
|
SAP, SAF-A/B
|
acinus and PIAS
|
|
SMEK1
|
SMEK homolog 1
|
|
SPRR2A
|
small proline-rich protein 2A
|
|
siCtrl
|
small interfering control
|
|
siDEK
|
small interfering DEK
|
|
siRNA
|
small interfering RNA
|
|
TCGA
|
The Cancer Genome Atlas
|
References
|
1
|
Khan SA, Amnekar R, Khade B, Barreto SG,
Ramadwar M, Shrikhande SV and Gupta S: p38-MAPK/MSK1-mediated
overexpression of histone H3 serine 10 phosphorylation defines
distance-dependent prognostic value of negative resection margin in
gastric cancer. Clin Epigenetics. 8:882016. View Article : Google Scholar : PubMed/NCBI
|
|
2
|
Matsusaka K, Ushiku T, Urabe M, Fukuyo M,
Abe H, Ishikawa S, Seto Y, Aburatani H, Hamakubo T, Kaneda A and
Fukayama M: Coupling CDH17 and CLDN18 markers for comprehensive
membrane-targeted detection of human gastric cancer. Oncotarget.
7:64168–64181. 2016. View Article : Google Scholar : PubMed/NCBI
|
|
3
|
Wang YY, Jiang WL, Zhang PF, Li GF, Dong
JH and Wang XS: Oct-4 is associated with gastric cancer progression
and prognosis. OncoTargets Ther. 9:517–522. 2016. View Article : Google Scholar : PubMed/NCBI
|
|
4
|
Ford AC, Yuan Y and Moayyedi P:
Helicobacter pylori eradication therapy to prevent gastric
cancer: Systematic review and meta-analysis. Gut. 69:2113–2121.
2020. View Article : Google Scholar : PubMed/NCBI
|
|
5
|
Yang X, Takano Y and Zheng HC: The
pathobiological features of gastrointestinal cancers (Review).
Oncol Lett. 3:961–969. 2012. View Article : Google Scholar : PubMed/NCBI
|
|
6
|
von Lindern M, Fornerod M, van Baal S,
Jaegle M, de Wit T, Buijs A and Grosveld G: The translocation
(6;9), associated with a specific subtype of acute myeloid
leukemia, results in the fusion of two genes, dek and can, and the
expression of a chimeric, leukemia-specific dek-can mRNA. Mol Cell
Biol. 12:1687–1697. 1992. View Article : Google Scholar : PubMed/NCBI
|
|
7
|
Wise-Draper TM, Allen HV, Jones EE, Habash
KB, Matsuo H and Wells SI: Apoptosis inhibition by the human DEK
oncoprotein involves interference with p53 functions. Mol Cell
Biol. 26:7506–7519. 2006. View Article : Google Scholar : PubMed/NCBI
|
|
8
|
Carro MS, Spiga FM, Quarto M, Ninni VD,
Volorio S, Alcalay M and Müller H: DEK expression is controlled by
E2F and deregulated in diverse tumor type. Cell Cycle. 5:1202–1207.
2006. View Article : Google Scholar : PubMed/NCBI
|
|
9
|
Liu G, Xiong D, Zeng J, Xu G, Xiao R, Chen
B and Huang Z: Prognostic role of DEK in human solid tumors: A
meta-analysis. Oncotarget. 8:98985–98992. 2017. View Article : Google Scholar : PubMed/NCBI
|
|
10
|
Kappes F, Waldmann T, Mathew V, Yu J,
Zhang L, Khodadoust MS, Chinnaiyan AM, Luger K, Erhardt S,
Schneider R and Markovitz DM: The DEK oncoprotein is a Su(var) that
is essential to heterochromatin integrity. Genes Dev. 25:673–678.
2011. View Article : Google Scholar : PubMed/NCBI
|
|
11
|
Fu GK, Grosveld G and Markovitz DM: DEK,
an autoantigen involved in a chromosomal translocation in acute
myelogenous leukemia, binds to the HIV-2 enhancer. Proc Natl Acad
Sci. 94:1811–1815. 1997. View Article : Google Scholar : PubMed/NCBI
|
|
12
|
McGarvey T, Rosonina E, McCracken S, Li Q,
Arnaout R, Mientjes E, Nickerson JA, Awrey D, Greenblatt J,
Grosveld G and Blencowe BJ: The acute myeloid leukemia-associated
protein, DEK, forms a splicing-dependent interaction with
exon-product complexes. J Cell Biol. 150:309–320. 2000. View Article : Google Scholar : PubMed/NCBI
|
|
13
|
Soares LMM, Zanier K, Mackereth C, Sattler
M and Valcárcel J: Intron removal requires proofreading of
U2AF/3′splice site recognition by DEK. Science. 312:1961–1965.
2006. View Article : Google Scholar : PubMed/NCBI
|
|
14
|
Waldmann T: Structure-specific binding of
the proto-oncogene protein DEK to DNA. Nucleic Acids Res.
31:7003–7010. 2003. View Article : Google Scholar : PubMed/NCBI
|
|
15
|
Alexiadis V, Waldmann T, Andersen J, Mann
M, Knippers R and Gruss C: The protein encoded by the
proto-oncogene DEK changes the topology of chromatin and reduces
the efficiency of DNA replication in a chromatin-specific manner.
Genes Dev. 14:1308–1312. 2000. View Article : Google Scholar : PubMed/NCBI
|
|
16
|
Kavanaugh GM, Wise-Draper TM, Morreale RJ,
Morrison MA, Gole B, Schwemberger S, Tichy ED, Lu L, Babcock GF,
Wells JM, et al: The human DEK oncogene regulates DNA damage
response signaling and repair. Nucleic Acids Res. 39:7465–7476.
2011. View Article : Google Scholar : PubMed/NCBI
|
|
17
|
Waldmann T, Scholten I, Kappes F, Hu HG
and Knippers R: The DEK protein-an abundant and ubiquitous
constituent of mammalian chromatin. Gene. 343:1–9. 2004. View Article : Google Scholar : PubMed/NCBI
|
|
18
|
Modrek B and Lee C: A genomic view of
alternative splicing. Nat Genet. 30:13–19. 2002. View Article : Google Scholar : PubMed/NCBI
|
|
19
|
Pan Q, Shai O, Lee LJ, Frey BJ and
Blencowe BJ: Deep surveying of alternative splicing complexity in
the human transcriptome by high-throughput sequencing. Nat Genet.
40:1413–1415. 2008. View
Article : Google Scholar : PubMed/NCBI
|
|
20
|
Chen J and Weiss WA: Alternative splicing
in cancer: Implications for biology and therapy. Oncogene. 34:1–14.
2015. View Article : Google Scholar : PubMed/NCBI
|
|
21
|
Kress TL and Guthrie C: Accurate RNA
siting and splicing gets help from a DEK-Hand. Science.
312:1886–1887. 2006. View Article : Google Scholar : PubMed/NCBI
|
|
22
|
Wise-Draper TM, Mintz-Cole RA, Morris TA,
Simpson DS, Wikenheiser-Brokamp KA, Currier MA, Cripe TP, Grosveld
GC and Wells SI: Overexpression of the Cellular DEK protein
promotes epithelial transformation in vitro and in vivo. Cancer
Res. 69:1792–1799. 2009. View Article : Google Scholar : PubMed/NCBI
|
|
23
|
Pease NA, Wise-Draper T and Privette
Vinnedge L: Dissecting the potential interplay of DEK functions in
inflammation and cancer. J Oncol. 2015:1065172015. View Article : Google Scholar : PubMed/NCBI
|
|
24
|
Piao J, Shang Y, Liu S, Piao Y, Cui X, Li
Y and Lin Z: High expression of DEK predicts poor prognosis of
gastric adenocarcinoma. Diagn Pathol. 9:672014. View Article : Google Scholar : PubMed/NCBI
|
|
25
|
Ou Y, Xia R, Kong F, Zhang X, Yu S, Jiang
L and Zheng L: Overexpression of DEK is an indicator of poor
prognosis in patients with gastric adenocarcinoma. Oncol Lett.
11:1823–1828. 2016. View Article : Google Scholar : PubMed/NCBI
|
|
26
|
Lin KH and Tsai CY: Overexpression of DEK
in human gastric carcinoma and its clinicopathological
significance. J Clin Oncol. 33:75. 2015. View Article : Google Scholar
|
|
27
|
Wang J, Wen T, Li Z, Che X, Gong L, Jiao
Z, Qu X and Liu Y: CD36 upregulates DEK transcription and promotes
cell migration and invasion via GSK-3β/β-catenin-mediated
epithelial-to-mesenchymal transition in gastric cancer. Aging
(Albany NY). 13:1883–1897. 2020. View Article : Google Scholar : PubMed/NCBI
|
|
28
|
Hui W, Ma X, Zan Y, Song L, Zhang S and
Dong L: MicroRNA-1292-5p inhibits cell growth, migration and
invasion of gastric carcinoma by targeting DEK. Am J Cancer Res.
8:1228–1238. 2018.PubMed/NCBI
|
|
29
|
Zhang W, Liao K and Liu D: MiR-138-5p
inhibits the proliferation of gastric cancer cells by targeting
DEK. Cancer Manag Res. 12:8137–8147. 2020. View Article : Google Scholar : PubMed/NCBI
|
|
30
|
Livak KJ and Schmittgen TD: Analysis of
relative gene expression data using real-time quantitative PCR and
the 2(−Delta Delta C(T)) method. Methods. 25:402–408. 2001.
View Article : Google Scholar : PubMed/NCBI
|
|
31
|
Kim D, Pertea G, Trapnell C, Pimentel H,
Kelley R and Salzberg SL: TopHat2: Accurate alignment of
transcriptomes in the presence of insertions, deletions and gene
fusions. Genome Biol. 14:R362013. View Article : Google Scholar : PubMed/NCBI
|
|
32
|
Trapnell C, Williams BA, Pertea G,
Mortazavi A, Kwan G, van Baren MJ, Salzberg SL, Wold BJ and Pachter
L: Transcript assembly and quantification by RNA-Seq reveals
unannotated transcripts and isoform switching during cell
differentiation. Nat Biotechnol. 28:511–515. 2010. View Article : Google Scholar : PubMed/NCBI
|
|
33
|
Robinson MD, McCarthy DJ and Smyth GK:
edgeR: A Bioconductor package for differential expression analysis
of digital gene expression data. Bioinformatics. 26:139–140. 2010.
View Article : Google Scholar : PubMed/NCBI
|
|
34
|
Jin L, Li G, Yu D, Huang W, Cheng C, Liao
S, Wu Q and Zhang Y: Transcriptome analysis reveals the complexity
of alternative splicing regulation in the fungus Verticillium
dahliae. BMC Genomics. 18:1302017. View Article : Google Scholar : PubMed/NCBI
|
|
35
|
Xia H, Chen D, Wu Q, Wu G, Zhou Y, Zhang Y
and Zhang L: CELF1 preferentially binds to exon-intron boundary and
regulates alternative splicing in HeLa cells. Biochim Biophys Acta
Gene Regul Mech. 1860:911–921. 2017. View Article : Google Scholar : PubMed/NCBI
|
|
36
|
Xie C, Mao X, Huang J, Ding Y, Wu J, Dong
S, Kong L, Gao G, Li CY and Wei L: KOBAS 2.0: A web server for
annotation and identification of enriched pathways and diseases.
Nucleic Acids Res. 39:W316–W322. 2011. View Article : Google Scholar : PubMed/NCBI
|
|
37
|
Young MD, Wakefield MJ, Smyth GK and
Oshlack A: Gene ontology analysis for RNA-seq: Accounting for
selection bias. Genome Biol. 11:R142010. View Article : Google Scholar : PubMed/NCBI
|
|
38
|
Bartha Á and Győrffy B: TNMplot.com: A web
tool for the comparison of gene expression in normal, tumor and
metastatic tissues. Int J Mol Sci. 22:26222021. View Article : Google Scholar : PubMed/NCBI
|
|
39
|
Szász AM, Lánczky A, Nagy Á, Förster S,
Hark K, Green JE, Boussioutas A, Busuttil R, Szabó A and Győrffy B:
Cross-validation of survival associated biomarkers in gastric
cancer using transcriptomic data of 1,065 patients. Oncotarget.
7:49322–49333. 2016. View Article : Google Scholar : PubMed/NCBI
|
|
40
|
Grill JI, Neumann J, Ofner A, Marschall
MK, Zierahn H, Herbst A, Wolf E and Kolligs FT: Dro1/Ccdc80
inactivation promotes AOM/DSS-induced colorectal carcinogenesis and
aggravates colitis by DSS in mice. Carcinogenesis. 39:1176–1184.
2018. View Article : Google Scholar : PubMed/NCBI
|
|
41
|
Liu M, Guo S and Stiles JK: The emerging
role of CXCL10 in cancer (Review). Oncol Lett. 2:583–589. 2011.
View Article : Google Scholar : PubMed/NCBI
|
|
42
|
Chen LH, Liao CY, Lai LC, Tsai MH and
Chuang EY: Semaphorin 6A attenuates the migration capability of
lung cancer cells via the NRF2/HMOX1 Axis. Sci Rep. 9:133022019.
View Article : Google Scholar : PubMed/NCBI
|
|
43
|
Mizuguchi Y, Specht S, Lunz JG, Isse K,
Corbitt N, Takizawa T and Demetris AJ: SPRR2A enhances p53
deacetylation through HDAC1 and down regulates p21 promoter
activity. BMC Mol Biol. 13:202012. View Article : Google Scholar : PubMed/NCBI
|
|
44
|
Li TF, Zeng HJ, Shan Z, Ye RY, Cheang TY,
Zhang YJ, Lu SH, Zhang Q, Shao N and Lin Y: Overexpression of
kinesin superfamily members as prognostic biomarkers of breast
cancer. Cancer Cell Int. 20:1232020. View Article : Google Scholar : PubMed/NCBI
|
|
45
|
Lee HW, Park YM, Lee SJ, Cho HJ, Kim DH,
Lee JI, Kang MS, Seol HJ, Shim YM, Nam DH, et al: Alpha-smooth
muscle actin (ACTA2) is required for metastatic potential of human
lung adenocarcinoma. Clin Cancer Res. 19:5879–5889. 2013.
View Article : Google Scholar : PubMed/NCBI
|
|
46
|
Nagano K, Imai S, Zhao X, Yamashita T,
Yoshioka Y, Abe Y, Mukai Y, Kamada H, Nakagawa S, Tsutsumi Y and
Tsunoda S: Identification and evaluation of metastasis-related
proteins, oxysterol binding protein-like 5 and calumenin, in lung
tumors. Int J Oncol. 47:195–203. 2015. View Article : Google Scholar : PubMed/NCBI
|
|
47
|
Mansour MR, He S, Li Z, Lobbardi R,
Abraham BJ, Hug C, Rahman S, Leon TE, Kuang YY, Zimmerman MW, et
al: JDP2: An oncogenic bZIP transcription factor in T cell acute
lymphoblastic leukemia. J Exp Med. 215:1929–1945. 2018. View Article : Google Scholar : PubMed/NCBI
|
|
48
|
Cairns J, Fridley BL, Jenkins GD, Zhuang
Y, Yu J and Wang L: Differential roles of ERRFI1 in EGFR and AKT
pathway regulation affect cancer proliferation. EMBO Rep.
19:e447672018. View Article : Google Scholar : PubMed/NCBI
|
|
49
|
Li D, Liu S, Xu J, Chen L, Xu C, Chen F,
Xu Z, Zhang Y, Xia S, Shao Y and Wang Y: Ferroptosis-related gene
CHAC1 is a valid indicator for the poor prognosis of kidney renal
clear cell carcinoma. J Cell Mol Med. 25:3610–3621. 2021.
View Article : Google Scholar : PubMed/NCBI
|
|
50
|
Chiu M, Taurino G, Bianchi MG, Kilberg MS
and Bussolati O: Asparagine synthetase in cancer: Beyond acute
lymphoblastic leukemia. Front Oncol. 9:14802019. View Article : Google Scholar : PubMed/NCBI
|
|
51
|
Du F, Sun L, Chu Y, Li T, Lei C, Wang X,
Jiang M, Min Y, Lu Y, Zhao X, et al: DDIT4 promotes gastric cancer
proliferation and tumorigenesis through the p53 and MAPK pathways.
Cancer Commun (Lond). 38:452018. View Article : Google Scholar : PubMed/NCBI
|
|
52
|
Yin S, Chen F, Ye P and Yang G:
Overexpression of FAM3C protein as a novel biomarker for
epithelial-mesenchymal transition and poor outcome in gastric
cancer. Int J Clin Exp Pathol. 11:4247–4256. 2018.PubMed/NCBI
|
|
53
|
Chan YC, Chang YC, Chuang HH, Yang YC, Lin
YF, Huang MS, Hsiao M, Yang CJ and Hua KT: Overexpression of PSAT1
promotes metastasis of lung adenocarcinoma by suppressing the
IRF1-IFNγ axis. Oncogene. 39:2509–2522. 2020. View Article : Google Scholar : PubMed/NCBI
|
|
54
|
Rawat V, Malvi P, Della Manna D, Yang ES,
Bugide S, Zhang X, Gupta R and Wajapeyee N: PSPH promotes melanoma
growth and metastasis by metabolic deregulation-mediated
transcriptional activation of NR4A1. Oncogene. 40:2448–2462. 2021.
View Article : Google Scholar : PubMed/NCBI
|
|
55
|
Meng Q, Ren M, Li Y and Song X:
LncRNA-RMRP Acts as an oncogene in lung cancer. PLoS One.
11:e01648452016. View Article : Google Scholar : PubMed/NCBI
|
|
56
|
Wang ET, Sandberg R, Luo S, Khrebtukova I,
Zhang L, Mayr C, Kingsmore SF, Schroth GP and Burge CB: Alternative
isoform regulation in human tissue transcriptomes. Nature.
456:470–476. 2008. View Article : Google Scholar : PubMed/NCBI
|
|
57
|
Duan Z, Zhang J, Choy E, Harmon D, Liu X,
Nielsen P, Mankin H, Gray NS and Hornicek FJ: Systematic kinome
shRNA screening identifies CDK11 (PITSLRE) kinase expression is
critical for osteosarcoma cell growth and proliferation. Clin
Cancer Res. 18:4580–4588. 2012. View Article : Google Scholar : PubMed/NCBI
|
|
58
|
Byun HJ, Kim BR, Yoo R, Park SY and Rho
SB: sMEK1 enhances gemcitabine anti-cancer activity through
inhibition of phosphorylation of Akt/mTOR. Apoptosis. 17:1095–1103.
2012. View Article : Google Scholar : PubMed/NCBI
|
|
59
|
Yang Q, Zhu M, Wang Z, Li H, Zhou W, Xiao
X, Zhang B, Hu W and Liu J: 4.1N is involved in a
flotillin-1/β-catenin/Wnt pathway and suppresses cell proliferation
and migration in non-small cell lung cancer cell lines. Tumour
Biol. 37:12713–12723. 2016. View Article : Google Scholar : PubMed/NCBI
|
|
60
|
Durinck S, Stawiski EW, Pavía-Jiménez A,
Modrusan Z, Kapur P, Jaiswal BS, Zhang N, Toffessi-Tcheuyap V,
Nguyen TT, Pahuja KB, et al: Spectrum of diverse genomic
alterations Define non-clear cell renal carcinoma subtypes. Nat
Genet. 47:13–21. 2015. View Article : Google Scholar : PubMed/NCBI
|
|
61
|
Starrett GJ, Luengas EM, McCann JL,
Ebrahimi D, Temiz NA, Love RP, Feng Y, Adolph MB, Chelico L, Law
EK, et al: The DNA cytosine deaminase APOBEC3H haplotype I likely
contributes to breast and lung cancer mutagenesis. Nat Commun.
7:129182016. View Article : Google Scholar : PubMed/NCBI
|
|
62
|
Lin D, Dong X, Wang K, Wyatt AW, Crea F,
Xue H, Wang Y, Wu R, Bell RH, Haegert A, et al: Identification of
DEK as a potential therapeutic target for neuroendocrine prostate
cancer. Oncotarget. 6:1806–1820. 2015. View Article : Google Scholar : PubMed/NCBI
|
|
63
|
Datta A, Adelson ME, Mogilevkin Y,
Mordechai E, Sidi AA and Trama JP: Oncoprotein DEK as a tissue and
urinary biomarker for bladder cancer. BMC Cancer. 11:2342011.
View Article : Google Scholar : PubMed/NCBI
|
|
64
|
Wise-Draper T, Sendilnathan A,
Palackdharry S, Pease N, Qualtieri J, Butler R, Sadraei NH, Morris
JC, Patil Y, Wilson K, et al: Decreased plasma DEK oncogene levels
correlate with p16-Negative disease and advanced tumor stage in a
case-control study of patients with head and neck squamous cell
carcinoma. Transl Oncol. 11:168–174. 2018. View Article : Google Scholar : PubMed/NCBI
|
|
65
|
Biyik-Sit R, Kruer T, Dougherty S, Bradley
JA, Wilkey DW, Merchant ML, Trent JO and Clem BF: Nuclear pyruvate
kinase M2 (PKM2) contributes to phosphoserine aminotransferase 1
(PSAT1)-mediated cell migration in EGFR-activated lung cancer
cells. Cancers (Basel). 13:39382021. View Article : Google Scholar : PubMed/NCBI
|
|
66
|
Ferraro A, Schepis F, Leone V, Federico A,
Borbone E, Pallante P, Berlingieri MT, Chiappetta G, Monaco M,
Palmieri D, et al: Tumor suppressor role of the CL2/DRO1/CCDC80
gene in thyroid carcinogenesis. J Clin Endocrinol Metab.
98:2834–2843. 2013. View Article : Google Scholar : PubMed/NCBI
|
|
67
|
De S, Cipriano R, Jackson MW and Stark GR:
Overexpression of kinesins mediates docetaxel resistance in breast
cancer cells. Cancer Res. 69:8035–8042. 2009. View Article : Google Scholar : PubMed/NCBI
|