Introduction
Lung cancer is associated with high morbidity and
mortality worldwide, with 1.8 million estimated deaths due to lung
cancer as a primary condition in 2020 (1). Current treatments for lung cancer
include resection of the tumor site, radiation therapy, and for
treating advanced cancers, platinum-based chemotherapy and
multi-drug combinations such as immune checkpoint inhibitors are
used. However, the five-year survival rate has been reported to be
approximately 19%, and lung cancer remains one of the most
intractable cancers (2).
Therefore, despite the implementation of these therapies,
sufficient therapeutic efficacy has yet to be achieved, suggesting
that the underlying mechanisms of lung cancer treatment remain to
be elucidated. Determining the mechanisms that differ from those of
conventional therapeutic target molecules will enable us to develop
novel therapeutic strategies for patients with lung cancer who do
not respond to current therapies.
Recently, the use of rare sugars that are defined as
monosaccharides and their rare derivatives has attracted attention
for their various physiological functions. Among these sugars,
D-allose has a sweetness of 80% compared to that of sugar (3), is not readily used as an energy
source (4), and is safe for
consumption by mammals (5).
D-allose was reported to protect against post-ischemic reperfusion
injury in a gerbil and rat model (6), and it arrests the cell cycle from the
G1 to S phase via stabilization of cyclin-dependent kinase
inhibitor 1 B (also called p27kip1) (7). Notably, D-allose increases
thioredoxin-interacting protein (TXNIP) levels, a negative
regulator of glucose transporter 1 (GLUT1), and inhibits tumor cell
growth via inhibition of glucose uptake (8,9). The
antitumor efficacy of D-allose has been observed in combination
with chemotherapy or radiation therapy in a carcinoma mouse model
(10). However, the tumor was not
completely removed after treatment with D-allose alone or in
combination with chemotherapy or radiation therapy (8–10),
implying the generation of D-allose-resistant tumor cells.
Tumor cells have acquired numerous functions to
enable their survival under hypoxic and hypotrophic conditions in
the microenvironment. For example, under hypoxic conditions, tumor
cells adapt to the microenvironment by increasing the expression of
hypoxia-inducible factor-1 (HIF-1) (11). Under hypotrophic conditions, tumor
cells induce autophagy to survive during nutrient starvation
involving glucose deprivation, via the induction of mTOR (12–16).
Therefore, a strategy for cancer treatment that targets glucose
metabolism alone is not sufficient; it is important to
simultaneously regulate the accompanying evasion mechanisms such as
autophagy.
In the present study, we found that although
D-allose killed most of the tumor cells, a few cells induced
autophagy to survive. Furthermore, we showed that a combined
treatment with D-allose and the autophagy inhibitor
hydroxychloroquine (HCQ) significantly suppressed tumor cell growth
without any side effects in a mouse tumor model.
Materials and methods
Chemicals
The monosaccharides used in this study are listed in
Table I. D-glucose was purchased
from Nacalai Tesque, and D-mannose, D-allose, D-psicose,
D-tagatose, D-sorbose, L-psicose, D-arabinose, L-arabinose, and
L-fucose were obtained from Matsutani Chemical Industry Co., Ltd.
Hydroxychloroquine (HCQ) sulfate was purchased from
Sigma-Aldrich/Merck KGaA (catalog no. H0915).
 | Table I.Monosaccharides used in this
study. |
Table I.
Monosaccharides used in this
study.
|
Monosaccharides | Category | Molecular
weight |
|---|
| D-glucose | Aldohexose | 180.16 |
| D-mannose | Aldohexose | 180.16 |
| D-allose | Aldohexose | 180.16 |
| D-psicose | Ketohexose | 180.16 |
| D-tagatose | Ketohexose | 180.16 |
| D-sorbose | Ketohexose | 180.16 |
| L-psicose | Ketohexose | 180.16 |
| D-arabinose | Aldopentose | 150.13 |
| L-arabinose | Aldopentose | 150.13 |
| L-fucose | Deoxy sugar | 164.16 |
Cell culture
Mouse Lewis lung carcinoma (LLC) cells were
purchased from Riken BioResource Center (catalog no. RCB0558, RRID:
CVCL_4358) and mouse skin melanoma (B16F10) cells were obtained
from the American Type Culture Collection (ATCC) (catalog no.
CRL-6475). The MDA-MB-231 human breast adenocarcinoma cell line was
purchased from the Japanese Cancer Research Resources Bank (catalog
no. JCRB1559). LLC, B16F10, and MDA-MB-231 cells were maintained in
RPMI-1640 or low-glucose DMEM (Fujifilm Wako Pure Chemical, Ltd.)
supplemented with 10% FBS (Thermo Fisher Scientific, Inc.) and
penicillin (100 units/ml)-streptomycin (0.1 mg/ml) (Life
Technologies/Thermo Fisher Scientific, Inc.).
The cells were given fresh culture media twice per
week and were subcultured to confluency after detaching the cells
with 0.25% trypsin +0.02% EDTA at a weekly split ratio of ~1:2.
Cultures from passages 10 to 25 were used in all experiments. The
cells were screened periodically for mycoplasma contamination using
a Mycoplasma Detection kit (MycoAlert™; Lonza Group, Ltd.).
For the cell viability assay, cells
(1×10⁵/well) were seeded in 6-well plates and cultured
for 24 h at 37°C in 5% CO2. Monosaccharides dissolved in
PBS were added to form a final concentration of 25 or 50 mM. Stocks
of monosaccharides (500 mM) were prepared in RPMI-1640 medium and
sterilized via filtration through a 0.2-µm pore filter. For the
control conditions, the same volume of PBS was added. The viable
cells were enumerated via 0.5% trypan blue staining (Nacalai
Tesque).
Establishment of D-allose-resistant
LLC cells
D-allose-resistant LLC cells were established using
the following procedure: Untreated LLC cells were seeded at a
density of 2×10⁴ cells/ml in a 100-mm dish. D-allose (25
mM) dissolved in the RPMI-1640 medium was added. After 72 h, cells
were harvested and enumerated via 0.5% trypan blue staining,
adjusted to a density of 2×10⁴ cells/ml, and reseeded in
the presence of 25 mM D-allose. The first cell count was denoted to
be passage 1, and after counts until passage 10 when the cell ratio
of the control LLC cells and D-allose-resistant LLC cells exceeded
100%, the population was considered to comprise D-allose-resistant
cells. Furthermore, we confirmed that D-allose-resistant LLC cells
were stably resistant at least until passage 10 after
establishment.
Western blot analysis
The collected cells and tumor tissues were
homogenized for 1 min at 4°C using an ultrasonic homogenizer in 9
volumes of 50 mM Tris-HCl (pH 6.8) containing 1% sodium dihydrogen
phosphate, 1% protease inhibitor cocktail (Nacalai Tesque), and 1%
EDTA-free phosphatase inhibitor cocktail (Nacalai Tesque). The
homogenized samples were centrifuged at 15,000 × g for 10 min at
4°C. The supernatant was collected as a sample extract. The protein
concentration in the sample extract was measured using a
bicinchoninic acid protein assay kit (Takara). The protein for
loading was prepared by adding bromophenol blue/2-mercaptoethanol
corresponding to 0.1 volumes of the final sample volume. The amount
of protein loaded per lane was 0.5–40 µg (0.5 µg for Akt, p-Akt,
and Beclin1, 5 µg for LC3 and p62, 40 µg for mTOR and p-mTOR). The
protein samples were separated via 7.5–15% gels (7.5% for p62,
mTOR, and p-mTOR, 10% for Akt, p-Akt, and Beclin1, 15% for LC3).
Proteins were separated via SDS-PAGE and transferred onto PVDF
membranes. The membranes were blocked with 5% skimmed milk (for
LC3, p62, Akt, Beclin1, and β-actin) or 5% PhosphoBLOCKER Blocking
Reagent (for mTOR, p-Akt, and p-mTOR; Cell Biolabs Inc.), diluted
in TBS-T for 1 h at 25°C, and then incubated with a primary
antibody. The following antibodies were used at a dilution of
1:1,000: anti-LC3A/B (catalog no. #12741; Cell Signaling
Technology, Inc.), anti-SQSTM1/p62 (catalog no. #5114; Cell
Signaling Technology, Inc.), anti-mTOR (catalog no. #2972; Cell
Signaling Technology, Inc.), anti-phospho-mTOR (catalog no. #5536;
Cell Signaling Technology, Inc.), anti-Beclin1 (catalog no. #3738;
Cell Signaling Technology, Inc.), anti-Akt (catalog no. #4691; Cell
Signaling Technology, Inc.), anti-phospho-Akt (catalog no. #4060;
Cell Signaling Technology, Inc.), and anti-β-actin (catalog no.
A5441; Sigma-Aldrich/Merck KGaA) and were incubated overnight at
4°C. The membranes were subsequently washed and incubated for 1 h
with a secondary HRP-conjugated antibody (1:10,000; catalog no.
115-035-144; Jackson ImmunoResearch Inc.). Immunolabeling was
performed using an enhanced chemiluminescence detection system (GE
Healthcare). The band intensities of the detected proteins (or the
phosphorylated proteins) were analyzed via densitometry using the
ImageJ software v1.53q (National Institutes of Health) and
normalized to those of β-actin. To re-probe the PVDF membranes, the
antibodies bound to the membranes were removed by washing twice (15
min each) with a commercial stripping solution and twice (15 min
each) with TBS-T, and then the blotted membranes were re-blocked
with BSA and re-probed with anti-β-actin antibody.
Immunofluorescence staining
Cells were fixed with 100% methanol for 20 min and
then permeabilized using 0.1% Triton X-100 for an additional 30
min. After incubation in blocking solution (1% BSA in 0.1% Tween
20/PBS) for 1 h, anti-LC3 A/B (1:100; catalog no. #12741; Cell
Signaling Technology) and anti-β-actin (1:1,000; catalog no.
#A5441; Sigma-Aldrich/Merck KGaA) antibodies diluted in blocking
solution were applied and incubated for 1 h at 25°C. After washing
in PBS, the cells were incubated with secondary antibodies
(1:1,000; Alexa 568- conjugated anti-rabbit IgG, catalog no.
#A31628; and Alexa 488-conjugated anti-mouse IgG, catalog no.
A10037; Invitrogen/Thermo Fisher Scientific, Inc.) for 1 h at 25°C.
Nuclei were stained with DAPI (1:1,000; Dojindo Laboratories, Inc.)
for 5 min. Immunofluorescence signals were observed using a Keyence
BZ-9000 fluorescence microscope (magnification, ×600; Keyence
Corp.).
Transmission electron microscopy
Cells were fixed with 4% paraformaldehyde and 0.1%
glutaraldehyde in 0.1 M phosphate buffer (PB; pH 7.4) for 16 h at
4°C, and then rinsed three times with 0.1 M PB. Post-fixation was
performed with 1% osmium tetroxide/PB for 1 h on ice, and the cells
were dehydrated in graded ethanol on ice and embedded in EPON 812
epoxy resin (TAAB) at 60°C for 72 h. Ultrathin sections (80–100 nm)
were cut with an ultramicrotome (EM UC7, Leica Microsystems GmbH)
and collected on copper grids. The ultrathin sections were
double-stained with uranyl acetate and lead citrate and were
subsequently observed on a transmission electron microscope
(JEM1400-Flash, JEOL, Ltd.).
RNA extraction and real-time
quantitative PCR
Total RNA was extracted from LLC cells using the
FastGene™ RNA Basic Kit (Nippon Genetics Co. Ltd.), and the RNA
concentration was determined spectrophotometrically (NanoDrop One,
Thermo Fisher Scientific, Inc.) at 260 nm. The RNA (500 ng) was
then used for first-strand synthesis of cDNA using ReverTra Ace
qPCR RT Master Mix (Toyobo Life Science). The following PCR primers
were used in this study: mTOR, sense,
5′-CTCGCTGATCCAGATGACAA-3′ and antisense,
5′-GTCAAGTACACGGGGCAAGT-3′; 18S rRNA, sense,
5′-GGATTGACAGATTGATAGC-3′ and antisense,
5′-TATCGGAATTAACCAGACAA-3′. The mRNA expression levels of
mTOR and 18S rRNA were quantified via qPCR using a 7900HT
Fast Real-Time system (Applied Biosystems/Thermo Fisher Scientific,
Inc.). PCR amplification was performed using Sso Advanced SYBR
Green Supermix (Bio-Rad Laboratories, Inc.) and data were analyzed
using 7900HT software (version 2.3; Applied Biosystems/Thermo
Fisher Scientific, Inc.).
Mice
Seven-week-old male C57BL/6J mice (weighing
18.0-22.0 g) were purchased from Charles River Laboratories
(Yokohama, Japan). Fifty mice were used in this experiment. Mice
were housed in plastic cages (five mice/cage) under controlled
conditions of light (12-h light/dark cycle), temperature (23±2°C),
and humidity (55%), and had free access to food and water. The
protocols for all animal experiments were approved by the Animal
Experimentation Committee of Fujita Health University (approval no.
AP19053). Procedures involving mice and their care conformed to
international guidelines, as described in the Principles of
Laboratory Animal Care (National Institutes of Health publication
85–23, revised 1985 (https://grants.nih.gov/grants/guide/historical/1985_06_25_Vol_14_No_08.pdf).
Tumor xenograft study
C57BL/6J mice were acclimated for one week in a
rearing environment. Logarithmic growth phase LLC cells
(5×10⁵ cells/100 µl) were subcutaneously injected into
the right posterior flank of each mouse. When the tumor volume
reached approximately 50 mm3, the mice were randomly
assigned to four groups. D-allose was orally administered daily at
9 g/kg (D-allose group, n=10) for two weeks as previously described
(4), HCQ was intraperitoneally
administered at 60 mg/kg every other day (HCQ group, n=10) for two
weeks (seven days per two weeks) as described previously (17), and a combination group was also
prepared (D-allose + HCQ group, n=10). An untreated group was used
as the control (n=9). Tumor volume was measured daily and
calculated as 0.5 × length × width2. All mice that
reached the study endpoint were euthanized by cervical dislocation
under 2–3% isoflurane anesthesia. The humane endpoints were
determined as the time where the xenograft tumor diameter was
>20 mm, xenograft tumor reached >20% of the animal body
weight, body weight loss >20% occurred due to tumor growth, and
signs of immobility, inability to eat, ulceration, infection, or
necrosis were observed. Death was verified by observation of pupil
dilation as well as cessation of breath and heartbeat. Tumor
tissues and serum collected from the inferior vena cava were
further analyzed.
Measurement of serum D-allose
levels
Serum D-allose content in samples was analyzed via
HPLC. Briefly, serum samples were mixed (1:1) in 0.6 M perchloric
acid. The resulting supernatant (20 µl) was subjected to HPLC
analysis. Jusco Finepak GEL SA-121 column (6×100 mm) maintained at
80°C was used as the anion exchange column. Elution was performed
using a gradient of solvent A (0.25 M sodium borate buffer; pH
7.5), and solvent B (0.6 M sodium borate buffer; pH 7.5) at a flow
rate of 0.40 ml/min. The gradient changed from 70% A/30% B to 50%
A/50% B for 20 min, 50% A/50% B to 0% A/100% B for 1 min; the
gradient was maintained at 0% A/100% B for 17 min; and then the
gradient changed from 0% A/100% B to 70% A/30% B for 2 min. The
eluate from the column was admixed with guanidine-acetonitrile (pH
11.0) at a flow rate of 0.60 ml/min. The resultant effluent was
passed through a reaction coil maintained at 160°C and fluorescence
was recorded using excitation and emission wavelengths of 310 and
415 nm, respectively.
Histopathology
Tumor tissues were fixed in 10% formalin in PBS
overnight. The specimens were embedded in paraffin. Sections that
were 4-µm thick were used for hematoxylin and eosin (H&E)
staining and immunofluorescence analysis. For immunofluorescence
staining sections were incubated in 0.1 M citrate buffer (pH 6.0)
for 15 min and heated up to 121°C using an autoclave. After washing
with PBS, sections were incubated in 0.3% hydrogen peroxide and
methanol for 30 min to inactivate the endogenous peroxidase.
Nonspecific antibody-binding sites were blocked in 2.5% normal
horse serum for 30 min. The sections were subsequently incubated
with rabbit anti-LC3 A/B antibody (1:1,000; catalog no. #12741;
Cell Signaling Technology, Inc.) in PBS and incubated for 1 h at
25°C. After primary antibody incubation, the sections were rinsed
with PBS and incubated with secondary antibody solution (ImmPRESS
Reagent, Vector Laboratories, Inc.) for 30 min at 25°C, followed by
the addition of 3,3′-diaminobenzidine tetrahydrochloride
(Dako/Agilent Technologies, Inc.). The sections were counterstained
with hematoxylin.
Biochemical analysis
Mouse serum glucose (GLU), alanine aminotransferase
(ALT), triglyceride (TG), total protein (TP), creatinine (CRE), and
blood urea nitrogen (BUN) levels were measured using an automated
chemistry analyzer (BioMajesty JCA-BM9130; Jeol Ltd.).
Statistical analysis
All results are expressed as mean ± standard error
of the mean (SEM). Significant differences between three or four
groups were determined using one-way ANOVA or two-way ANOVA,
followed by Tukey's multiple comparison test, and those between two
groups were determined using the Student's t-test. A value of P<
0.05 was considered significant. All statistical analyses were
performed using GraphPad Prism v6.07 (GraphPad Software, Inc.).
Results
D-allose treatment suppresses cell
proliferation and promotes autophagy in LLC cells
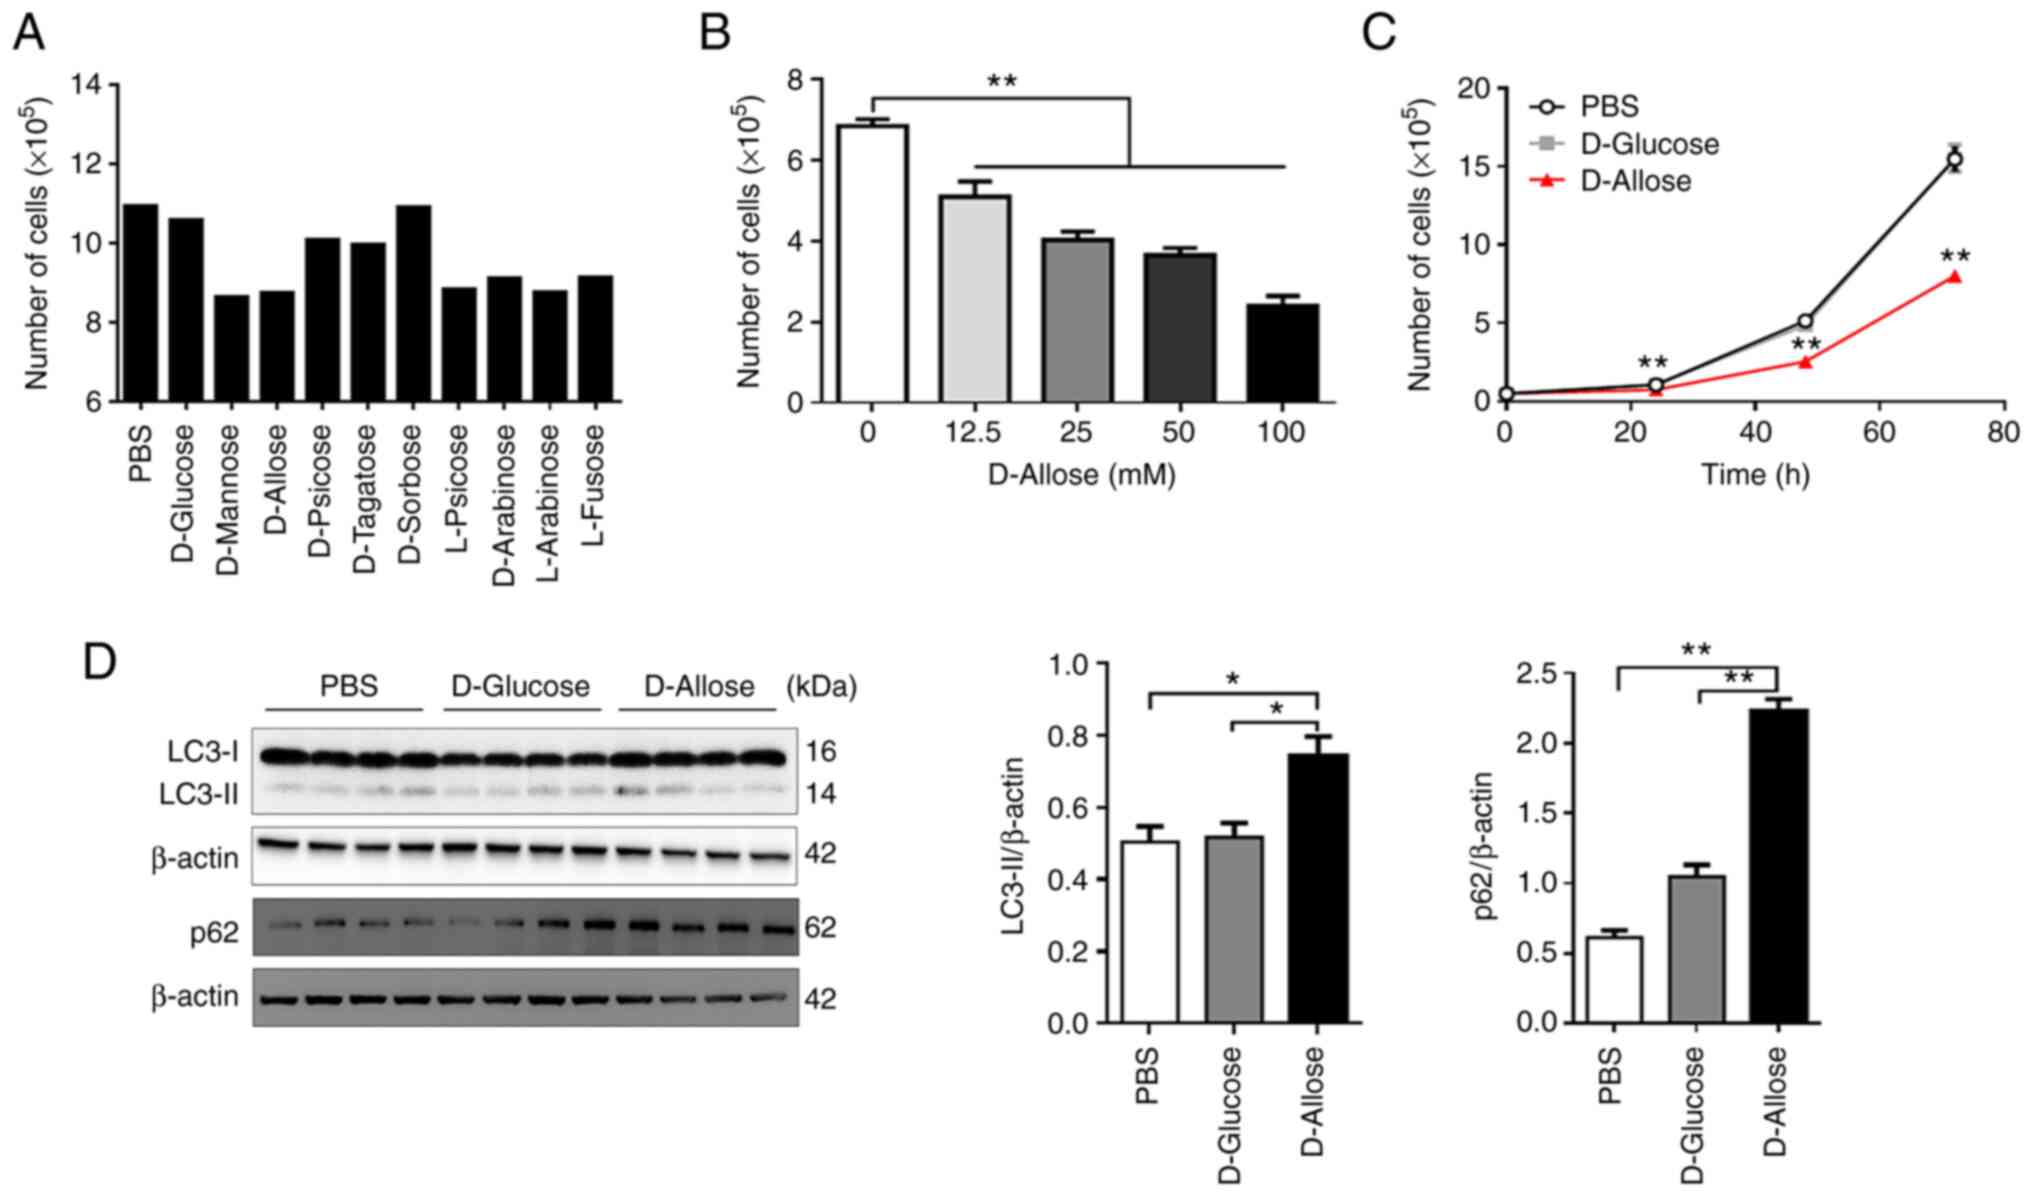
To evaluate the effect of rare sugars on tumor
growth, we cultured LLC cells in the presence of various rare
sugars with D-glucose as a control. D-mannose, D-allose, L-psicose,
D-arabinose, L-arabinose, and L-fucose suppressed cell growth
compared to growth in the presence of PBS or D-glucose (Fig. 1A). D-allose also inhibited the
growth of B16F10 mouse melanoma cells (Fig. S1), suggesting that it may suppress
the growth of various tumor cells. Therefore, we focused on
D-allose in subsequent experiments.
D-allose treatment inhibited LLC cell growth in a
significantly dose-dependent manner, and the effect persisted for
at least 72 h after treatment (Fig. 1B
and C). Notably, a few tumor cells survived in the presence of
D-allose (Fig. 1C). It is known
that autophagy promotes the survival or resistance of tumor cells
to antitumor drugs (18).
Therefore, we next examined the expression of LC3-II and p62, both
of which are autophagy markers, in D-allose-resistant surviving
cells. The expression levels of LC3-II and p62 in surviving LLC
cells were significantly increased within 48 h after D-allose
treatment (Fig. 1D). Since
D-allose has been reported to inhibit the growth of human breast
cancer cells (MDA-MB-231) (8), we
determined whether autophagy is also involved in the survival of
these cells. As expected, D-allose significantly inhibited cell
growth and significantly enhanced the expression of LC3-II in the
surviving cells (Fig. S2A and
B).
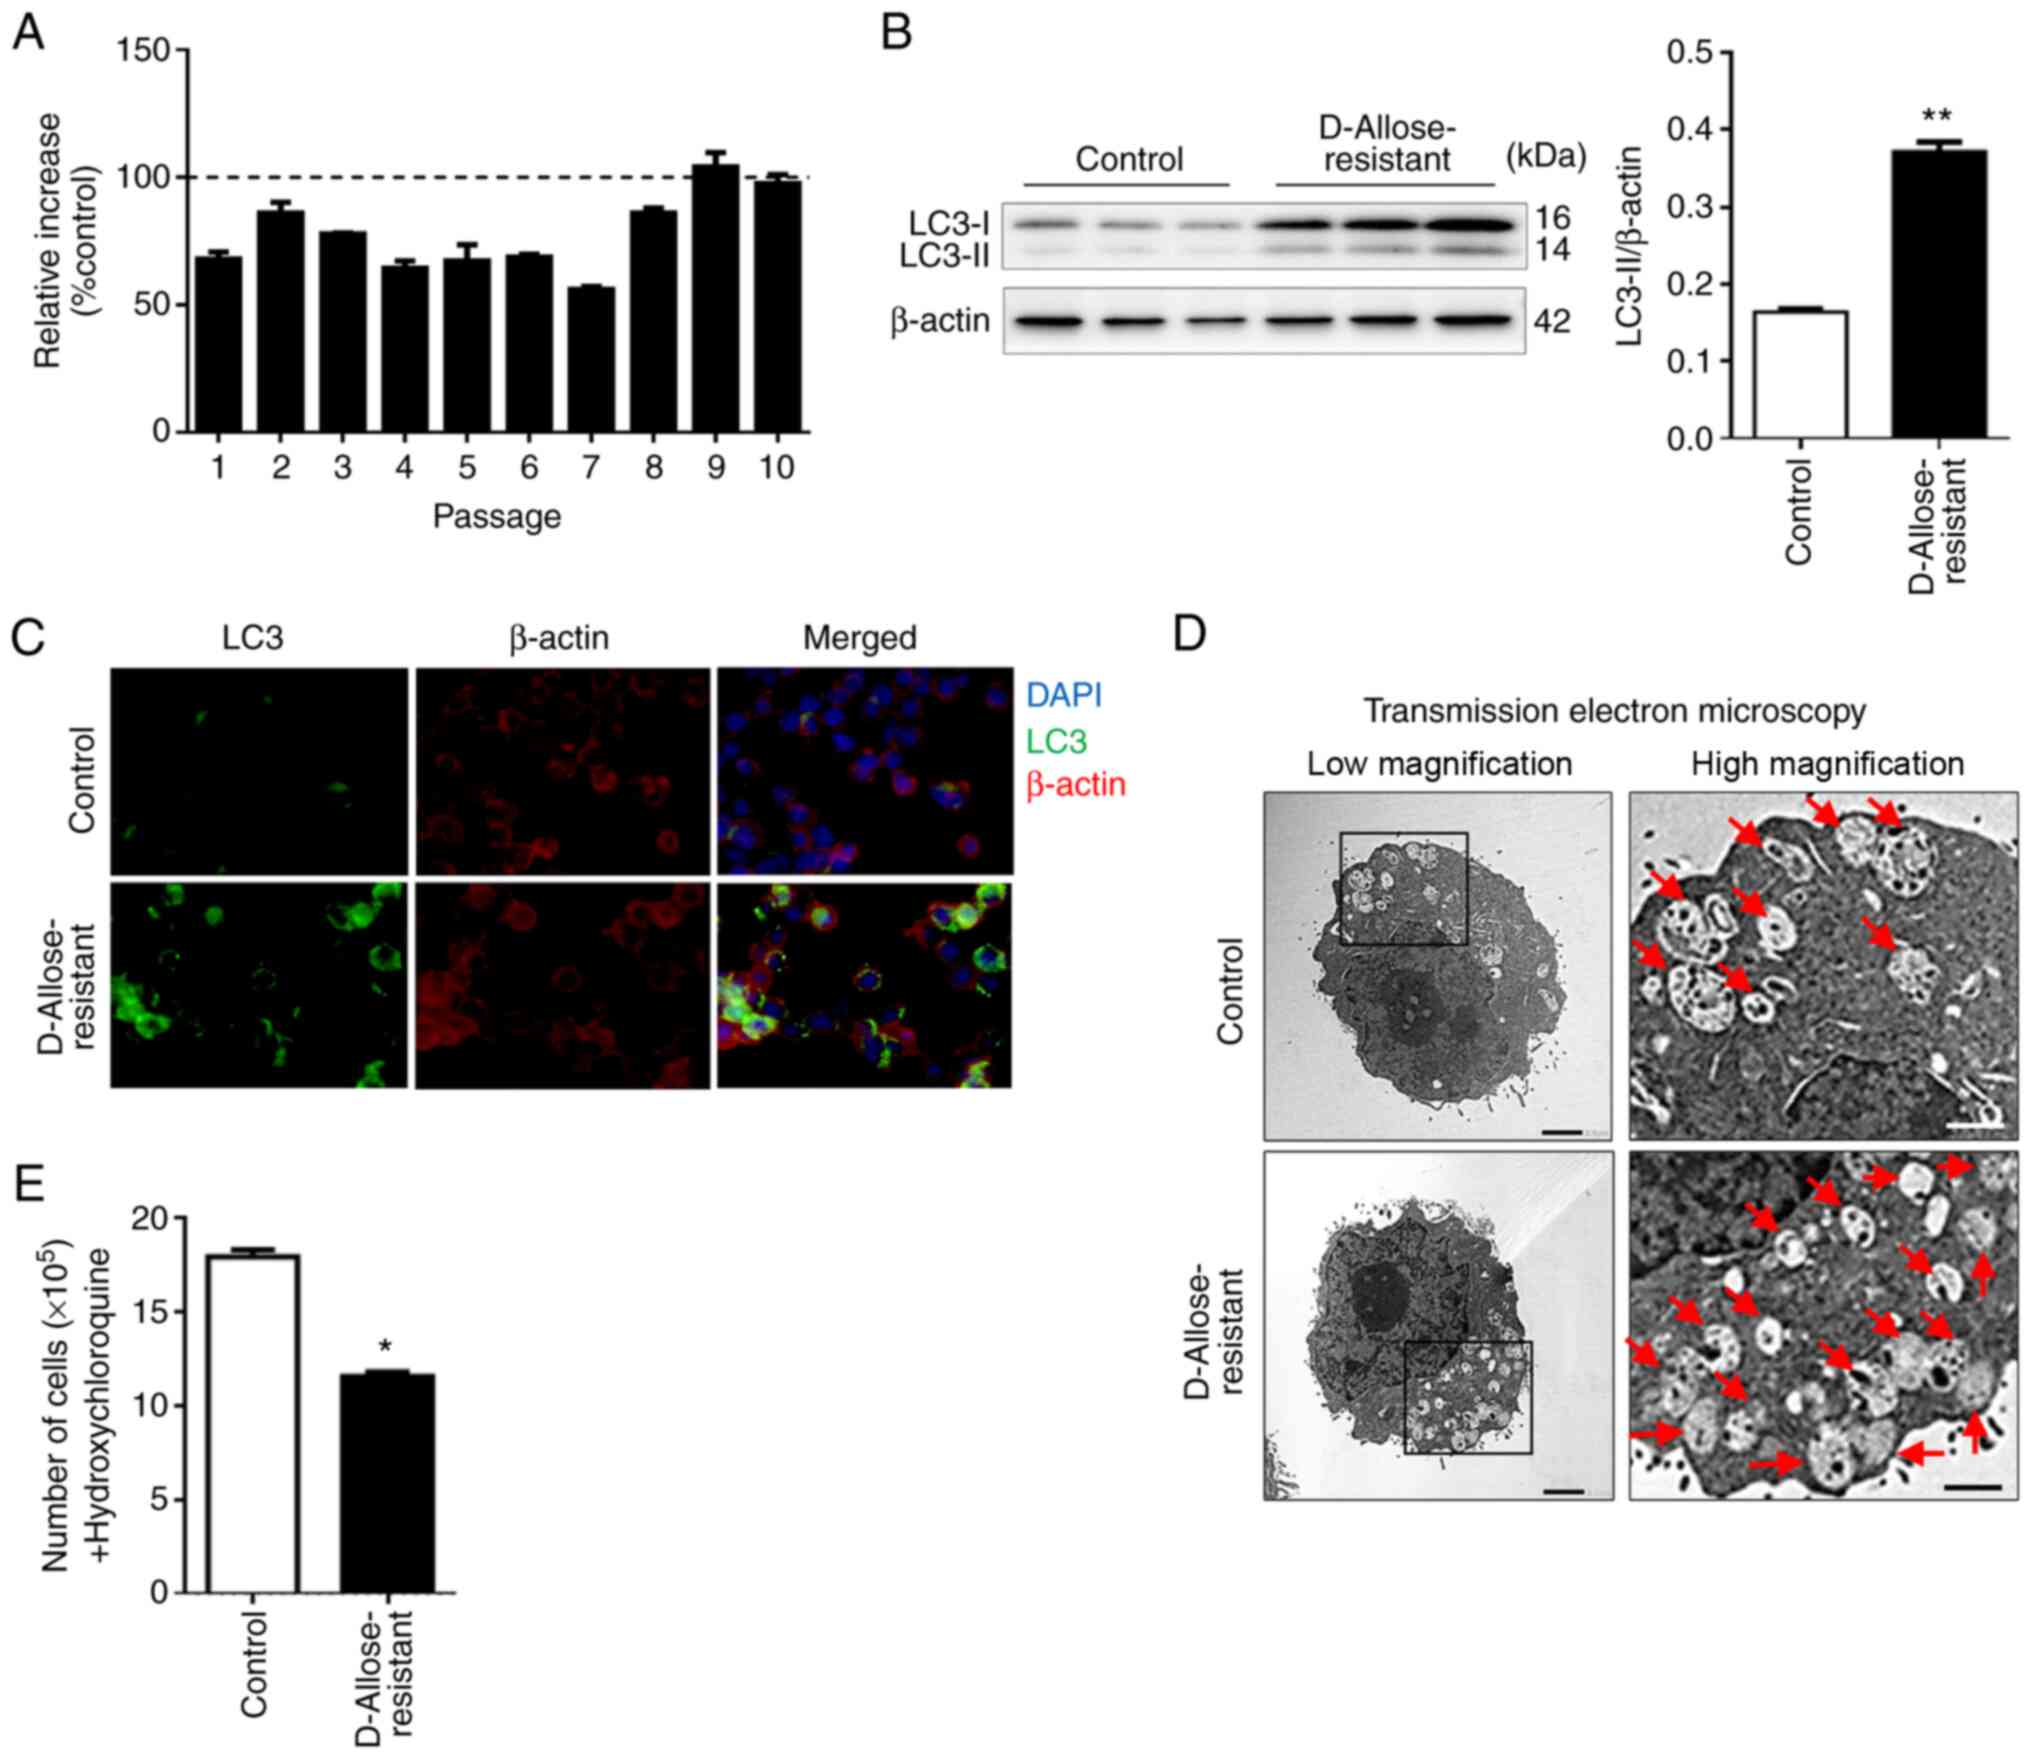
D-allose-resistant LLC cells show
enhanced autophagy and susceptibility to autophagy inhibitor
HCQ
To investigate whether D-allose-induced autophagy is
essential for tumor cell survival, we established
D-allose-resistant LLC cell lines by selecting only LLC cells that
survived in the long-term D-allose cultures. Compared to the
untreated control cells, when the proportion of the
D-allose-treated LLC cells exceeded 100%, the cells were determined
to be D-allose-resistant LLC cells (Fig. 2A). The level of LC3-II in the
D-allose-resistant LLC cells was significantly higher than that in
the control cells (0.164±0.004 in the control; 0.372±0.012 in the
D-allose-resistant LLC cells) (Fig.
2B). Similar results were obtained in the immunohistological
analysis (Fig. 2C). Transmission
electron microscopic analysis showed increased autolysosomes or
autophagosomes (red arrows) in the D-allose-resistant LLC cells
(Fig. 2D). Collectively, these
results suggest that continuous long-term treatment of LLC cells
with D-allose may promote autophagy, leading to tumor survival.
HCQ, an autophagy inhibitor, is currently studied in
phase I and II clinical trials, and more than 20 trials involving
HCQ have recruited patients with cancer worldwide. Several studies
have shown evidence of preliminary antitumor activity (19,20).
Based on clinical reports, we hypothesized that the
D-allose-resistant LLC cells may be susceptible to HCQ as an
antitumor drug. Upon treatment with HCQ, the viability of
D-allose-resistant cells was considerably decreased compared to
that of untreated control cells (Fig.
2E). These results suggest that autophagy may be constitutively
induced in D-allose-resistant tumor cell lines, thereby enhancing
susceptibility to antitumor drugs such as HCQ.
D-allose suppresses the mTOR signaling
pathway in LLC cells
Several studies indicate that the mTOR-dependent
pathway is a key regulator of autophagy (21,22).
Therefore, we investigated the involvement of mTOR in the induction
of autophagy in D-allose-resistant LLC cells. The expression of
total mTOR and phosphorylated-mTOR (p-mTOR) was detected in the
control LLC cells, but was negligible or absent in the
D-allose-resistant LLC cells (Fig. 3A
and B). The expression of mTOR mRNA was not affected
(Fig. 3C), implying that D-allose
may regulate the expression of mTOR at a post-translational level
or induce the proteolytic degradation of mTOR. We also determined
the expression of Akt and Beclin1, the upstream and downstream
molecules of mTOR, respectively. Although the expression of total
Akt and p-Akt was not affected, the expression of Beclin1 was
significantly increased in the D-allose-resistant LLC cells
(Fig. 3A and B). These results
suggest that D-allose-induced autophagy may be mediated by mTOR
regulation.
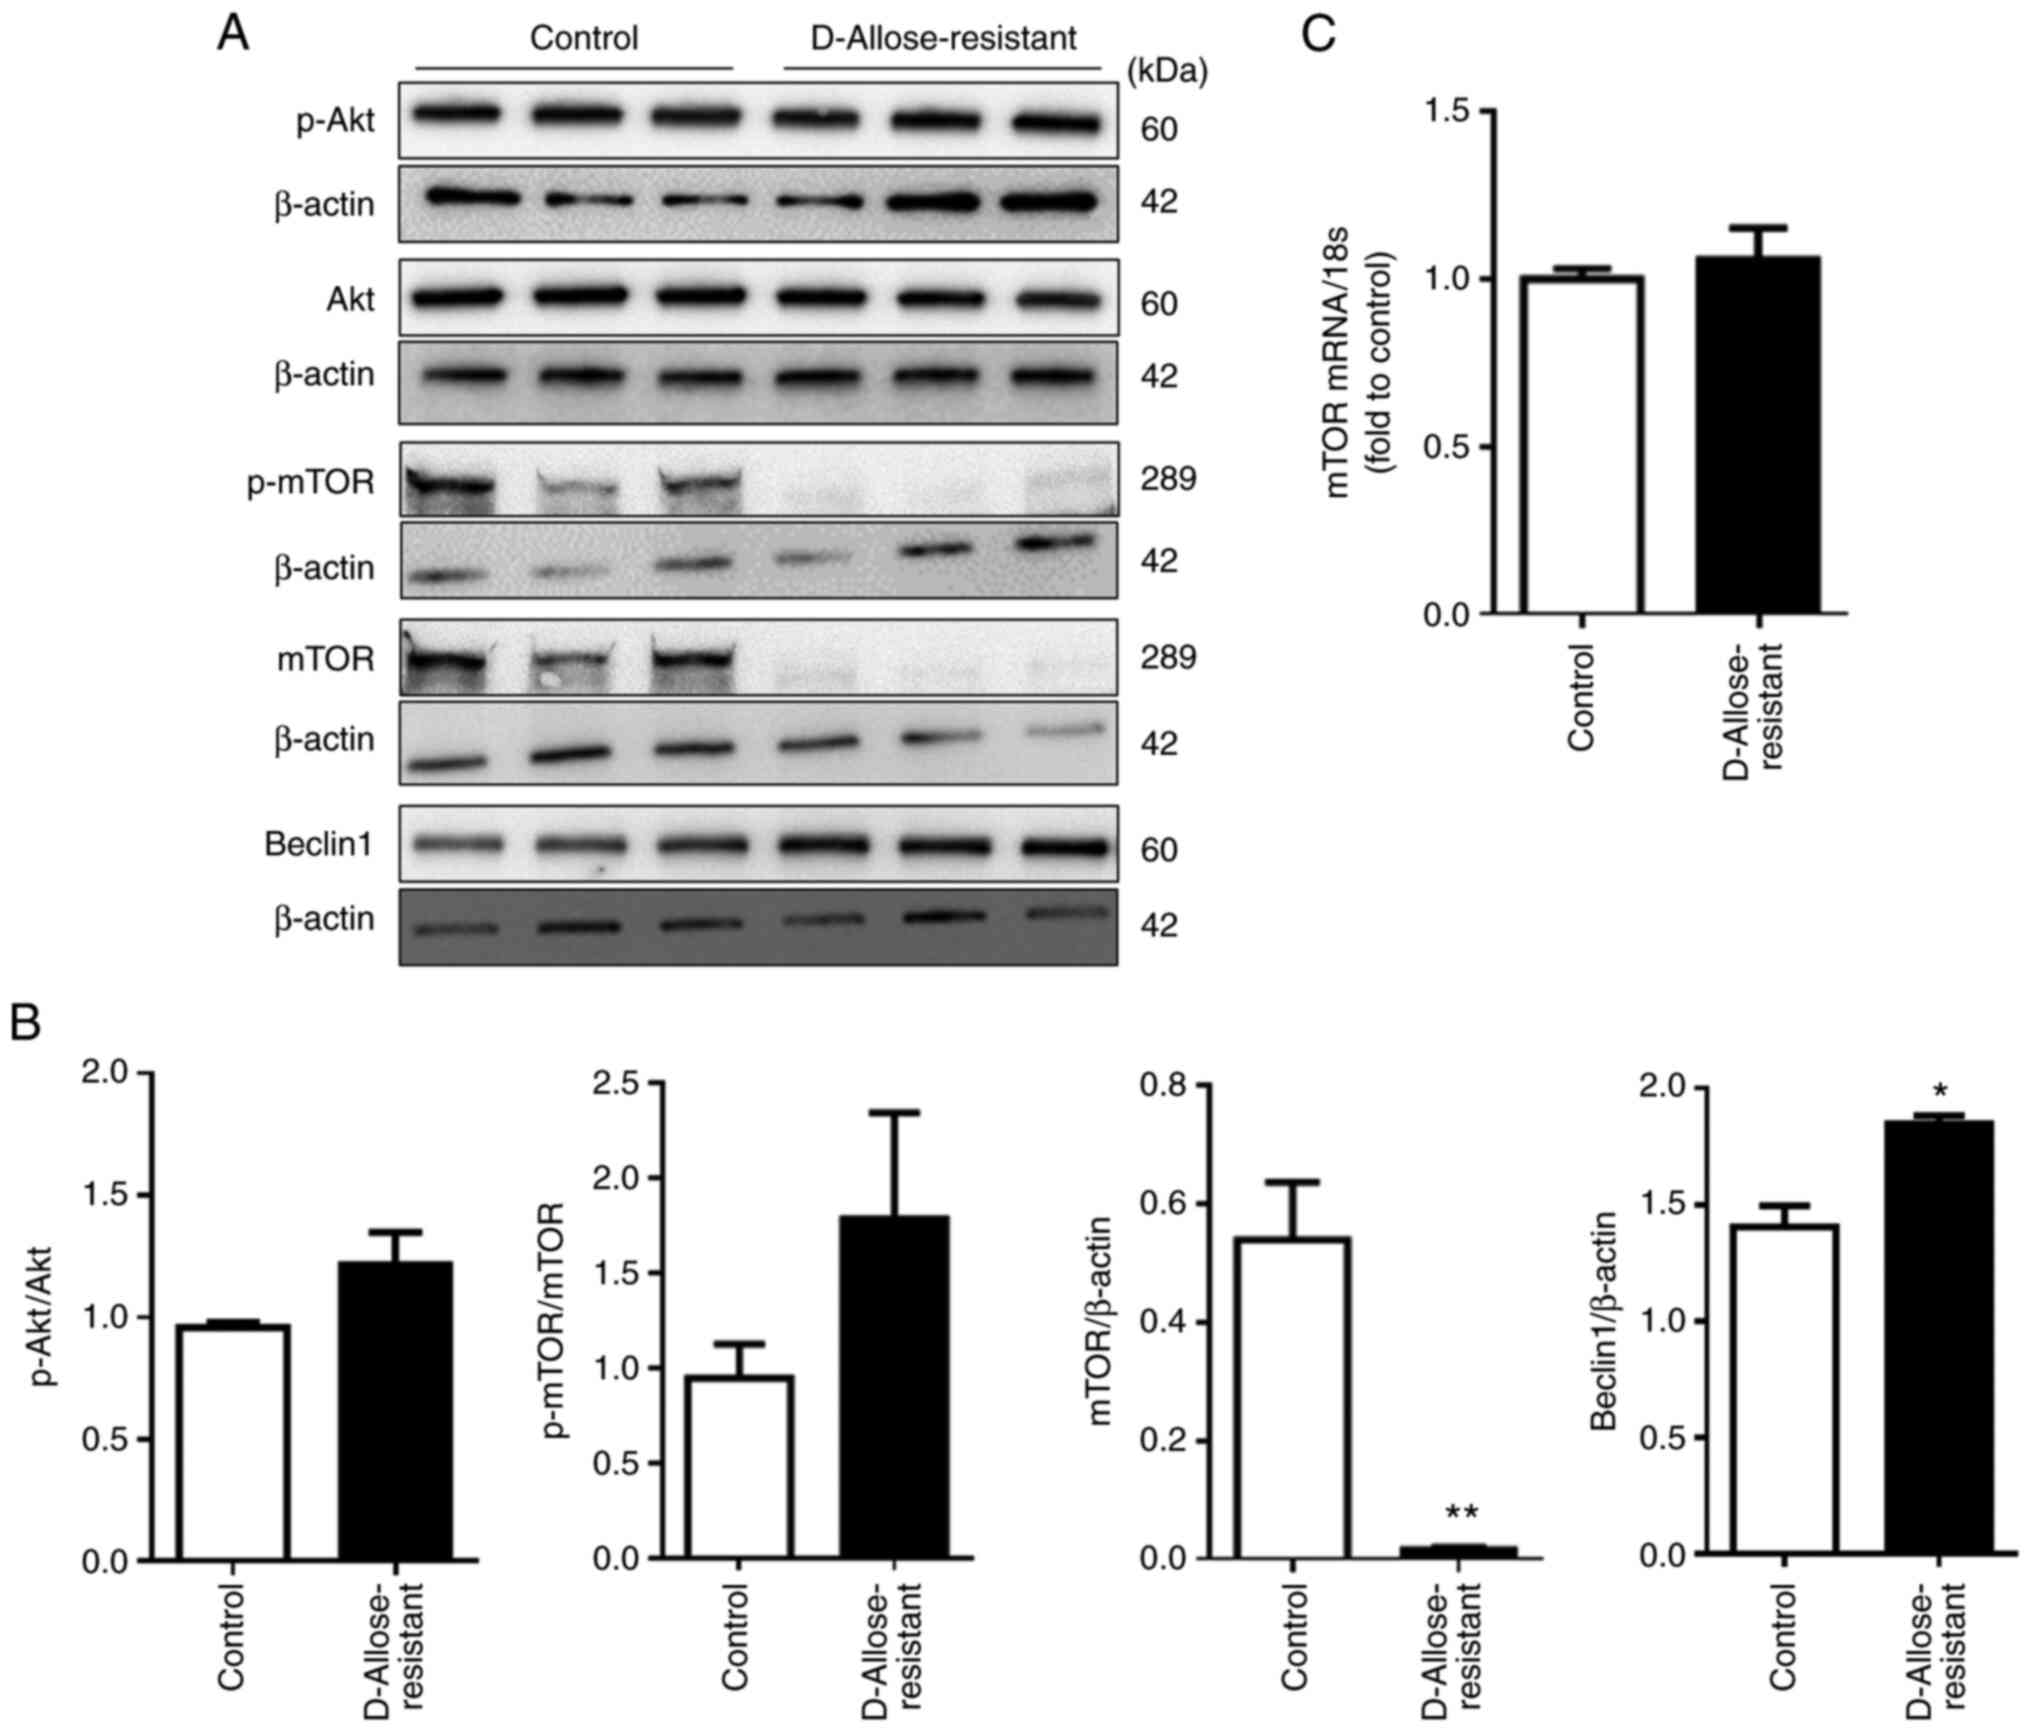 | Figure 3.D-allose-resistant LLC cells contain
reduced mTOR levels. (A) Protein extracts from LLC cells (control)
and D-allose-resistant LLC cells were analyzed by sodium dodecyl
sulphate polyacrylamide gel electrophoresis, and immunoblotting was
performed using anti-Akt, -p-Akt, -mTOR, -p-mTOR, -Beclin1 and
-β-actin antibodies. The results are shown as representative data.
(B) The relative densitometric intensity of Akt, p-Akt, mTOR,
p-mTOR, and Beclin1 was determined for each protein band and
normalized to that of β-actin. (C) The levels of mTOR mRNA
in LLC cells and D-allose-resistant cells were determined by
quantitative polymerase chain reaction. Data are presented as the
mean ± SEM (n=3). Statistical analysis was performed using paired
two-tailed Student's t-test. *P<0.05, **P<0.01 vs. the
control group. mTOR, mechanistic target of rapamycin; LLC, Lewis
lung carcinoma cells. |
Combination therapy of D-allose and
HCQ reduces tumor growth in mice
To determine whether a combination therapy of
D-allose and HCQ shows enhanced antitumor activity in vivo,
we administered D-allose with or without HCQ into LLC-implanted
mice for 14 consecutive days. The levels of GLU, ALT, TG, TP, CRE,
and BUN in the sera were found to be normal (Table II), and weight loss was not
observed in any group (Fig. 4A),
indicating that there were no side effects of the combination
therapy of D-allose and HCQ for at least 14 days. Tumor volume and
gross findings in D-allose + HCQ-treated mice were significantly
reduced compared to that in the untreated control, D-allose-, or
HCQ-treated mice (Fig. 4B and C).
Similar results were obtained in an in vitro culture system
(Fig. S3). We found significantly
increased D-allose levels in the sera and LC3-II expression at the
tumor site in D-allose-treated mice implanted with LLC cells
(Fig. 4D-G). These results suggest
that established D-allose-resistant LLC cells constitutively induce
autophagy, thereby enhancing the sensitivity to autophagy
inhibitors.
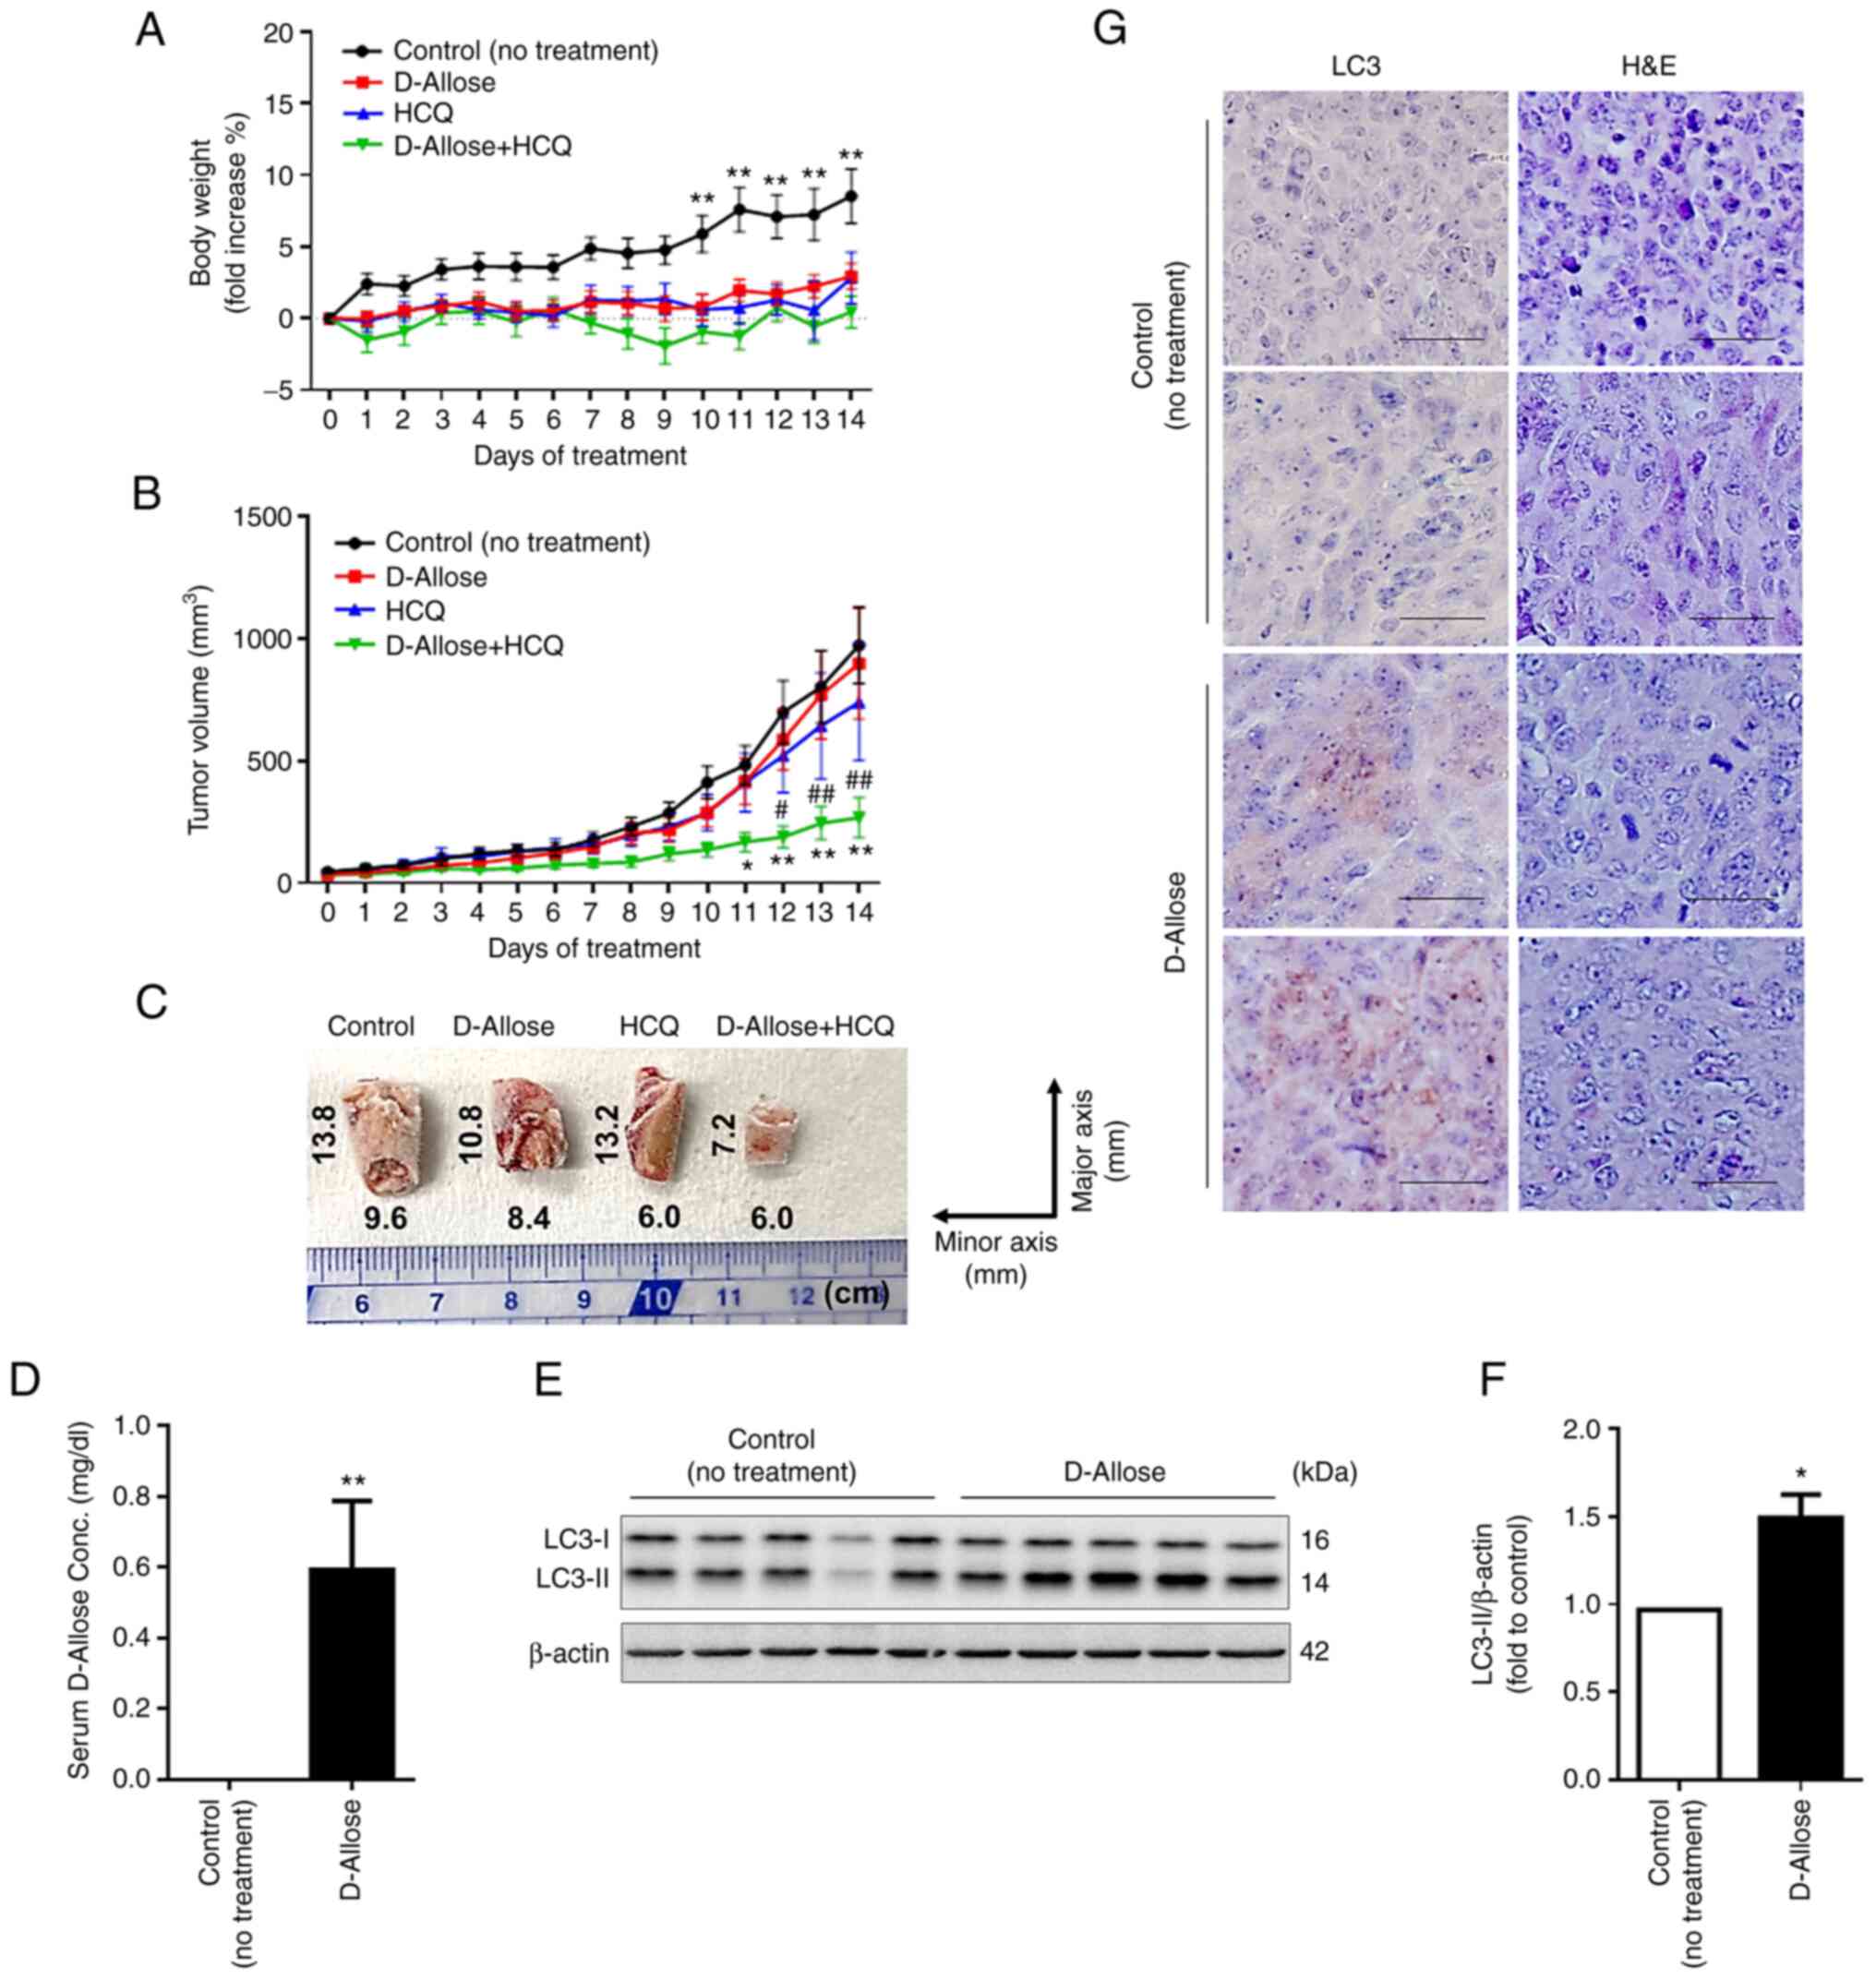 | Figure 4.Combination therapy of D-allose and
hydroxychloroquine (HCQ) reduces LLC cell growth in mice. Changes
in (A) body weight and (B) tumor growth curves in LLC xenograft
mice following initiation of treatment without (control, n=9) or
with D-allose (9 g/kg, n=10), HCQ (60 mg/kg, n=10), and a
combination of D-allose (9 g/kg) and HCQ (60 mg/kg) (n=10). Data
are presented as the mean ± SEM. Statistical analysis was performed
using two-way ANOVA with Tukey's multiple comparison test.
*P<0.05, **P<0.01 vs. the control, #P<0.05,
##P<0.01 vs. HCQ treatment. (C) Representative images
of frozen tumor tissues (cut in the half size) of indicated mice 14
days after treatment are shown. (D) Serum D-allose levels in
control and D-allose-treated mice 14 days after treatment were
measured by high-performance liquid chromatography. **P<0.01 vs.
the control. (E and F) Expression levels of LC3-II in the tumor
tissues of control and D-allose-treated mice 14 days after
treatment. The results are presented as representative data (left).
The relative densitometric intensity of LC3-II was determined for
each protein band and normalized to that of β-actin (right). Data
are presented as the mean ± SEM. Statistical analysis was performed
using a paired two-tailed Student's t-test. *P<0.05 vs. the
control. (G) LC-3 in tumor sites of control and D-allose-treated
mice 14 days after treatment was detected using
immunohistochemistry staining. Hematoxylin and eosin (H&E)
staining results are shown in the right column. HCQ,
hydroxychloroquine; LLC, Lewis lung carcinoma. |
| Table II.Nutritional status, liver function,
and renal function in mice after 14 days of treatment. |
Table II.
Nutritional status, liver function,
and renal function in mice after 14 days of treatment.
|
| Control (No
treatment) n=9 | D-allose n=10 | HCQ n=10 | D-allose + HCQ
n=10 |
|---|
| GLU (mg/dl) | 170.0±7.82 | 174.5±12.44 | 181.5±11.94 | 193.5±6.71 |
| ALT (U/l) | 10.0±1.57 | 14.0±2.43 | 15.5±1.80 | 17.5±3.69 |
| TG (mg/dl) | 183.9±53.57 | 212.5±32.33 | 131.5±31.50 | 217.5±56.90 |
| TP (g/dl) | 5.11±0.19 | 5.30±0.14 | 5.65±0.17 | 5.53±0.05 |
| CRE (mg/dl) | 0.14±0.01 | 0.15±0.01 | 0.15±0.00 | 0.14±0.01 |
| BUN (mg/dl) | 33.06±1.93 | 32.05±2.14 | 32.25±1.79 | 30.05±1.27 |
Discussion
In the present study, we found that D-allose
inhibited the growth of various tumor cells including mouse- and
human-derived tumor cells and induced autophagy in the surviving
cells. Furthermore, the enhanced autophagy in the established
D-allose-resistant tumor cells was associated with increased
sensitivity to hydroxychloroquine (HCQ), leading to the induction
of autophagic cell death. These results indicate that the
combination of D-allose and HCQ can significantly inhibit tumor
growth in a mouse tumor-bearing model without causing significant
side effects.
Autophagy is induced by several pathways via mTOR
signaling, including the PI3K/AKT (23), p53 (24), amino acid, Rag GTPase-mediated
(25,26), and MAPK/ERK (27) signaling pathways. Glucose
deprivation induces growth inhibition and death of tumor cells in a
mTOR-mediated autophagy-dependent manner (15,28).
Paradoxically, it has been reported that exposure to high glucose
downregulates glucose transporter 1 (GLUT1) expression, leading to
growth inhibition of tumor cells (29). Interestingly, under high glucose
conditions, thioredoxin-interacting protein (TXNIP) expression was
found to be enhanced in a retinal muller cell line, which induced
mTOR-mediated autophagy (30),
suggesting that the induction of autophagy is dependent on abnormal
glucose microenvironments. Importantly, D-allose was found to
reduce the expression of GLUT1 via upregulation of TXNIP in tumor
cells, thereby inhibiting tumor growth through impaired glucose
uptake (8,9). However, D-allose-driven inhibition of
glucose uptake cannot completely kill tumor cells in vitro
and in vivo (10). Based on
these findings, we speculated that, upon stimulation with D-allose,
a small number of tumor cells can survive in a glucose-independent
manner through the induction of autophagy, and we found that
D-allose induces mTOR-mediated autophagy in surviving tumor cells.
Therefore, our findings shed new light on the role of
D-allose-induced autophagy in tumor cell survival, which obviously
differs from recent reports that D-allose induces tumor cell death
(8–10). Collectively, D-allose-resistant
tumor cells, which presumably exhibit impaired TXNIP-mediated GLUT1
expression, may survive using intracellular glucose produced
through the autophagic processing of cellular components. Here, we
found that mTOR protein levels were decreased in D-allose-resistant
LLC cells without any change in mTOR mRNA levels. There are
two possible mechanisms that explain the selective downregulation
of mTOR at the protein level: i) the post-transcriptional
modification of mTOR is impaired, or ii) mTOR protein is
proteolytically processed. Regarding the latter mechanism,
gephyrin, a neuronal receptor assembly protein, reduces the level
of protein, but not mRNA, of mTOR in lung squamous cell carcinoma
by promoting ubiquitin-dependent degradation (31). In addition, in mouse liver tumor
cells, mTOR signaling in CD133+ cancer stem cells was
found to be less active than that in CD133− non-stem
cancer cells (32). These findings
suggest that D-allose kills mTOR+ tumor cells, thereby
permitting the survival of mTOR− tumor cells, which may
explain our findings that mTOR protein selectively disappeared in
D-allose-resistant cells. Although we could not determine the
mechanism by which D-allose induces the downregulation of mTOR
protein, few studies indicate that the mTOR signaling pathways are
abnormally regulated in most human cancers (33,34).
We showed that the D-allose-induced downregulation
of mTOR protein is positively correlated with the upregulation of
LC-II and Beclin1 as well as the increased number of autophagosomes
in the resistant Lewis lung carcinoma (LLC) cells, and the
sensitivity to HCQ in the resistant LLC cells was enhanced,
indicating that D-allose-induced autophagy not only is essential
for their survival but is also a promising therapeutic target. Our
findings raise a question regarding which cells acquire resistance
against D-allose via the induction of autophagy. Based on this
aspect, it is known that autophagy is induced constitutively and
predominantly in cancer stem cells to maintain their survival and
pluripotency (35). These findings
suggest that D-allose kills cancer cells, which are presumably
non-stem cells, via inhibition of glucose uptake and selectively
supports cancer stem cells via the induction of autophagy. However,
the relationship between D-allose and mTOR signaling in the
induction of autophagy remains unclear. Further studies are
required to elucidate this relationship.
We also found that LLC cell proliferation was
considerably inhibited in the D-allose and HCQ co-treatment group
compared to that in the control and HCQ groups. Based on our
findings, we propose that D-allose kills non-stem cancer cells and
sensitizes surviving cancer stem cells to HCQ chemotherapy, leading
to the suppression of tumor growth. Candidate autophagy inhibitors
for cancer treatment include bafilomycin A1, 3-methyladenine,
chloroquine (CQ), and HCQ, among which HCQ is currently undergoing
phase II clinical trials (19).
Indeed, autophagy induced by gefitinib and paclitaxel, both of
which are antitumor drugs for non-small cell lung cancer, increases
cytotoxicity when these drugs are combined with CQ and HCQ
treatments (36,37) and the combination of HCQ and
ixabepilone, an antitumor drug, showed improved therapeutic
efficacy against breast cancer (38). Rapamycin, an mTOR inhibitor, has
been reported to suppress the growth of tumor cells by inducing
autophagy (39). In contrast, the
combination of CQ and cisplatin, a chemotherapeutic drug, has been
reported to induce damage in healthy kidneys, suggesting that
autophagy plays a protective role in normal renal cells (40). Therefore, D-allose-induced
autophagy may possess both tumoricidal activity against various
cancer cells and protective activity against normal cells, and the
combined use of D-allose and autophagy inhibitors may be safer and
more selective than that of D-allose and chemoradiotherapy in the
induction of antitumor activity (10).
This study provides a new therapeutic strategy that
targets autophagy induced in tumor cells by D-allose
administration. Notably, D-allose, which has various physiological
functions, can be mass-produced industrially; however, there are no
studies focusing on autophagy in tumor cells. Therefore, the new
information on D-allose found in this study will contribute to
improving the therapeutic response in combination with clinically
applied autophagy inhibitors.
Supplementary Material
Supporting Data
Acknowledgements
Not appliable.
Funding
This study was funded by Matsutani Chemical Industry Co.,
Ltd.
Availability of data and materials
The datasets used and/or analyzed during the current
study are available from the corresponding author upon reasonable
request.
Authors' contributions
MHo and KS planned the experiments. KY, MHo, HT, NM,
MHi, SY, and FS performed the experiments. KY, MHo, and HT were
responsible for data integrity and data analysis. KY, MHo, HT, NM,
MHi, FS, SY, and KS discussed the results. KY, MHo, and HT wrote
the manuscript. KY, MHo, HT, NM, MHi, FS, SY, and KS conducted the
research. KY and MHo confirm the authenticity of all the raw data.
KS had primary responsibility for the final content. All authors
read and approved the final manuscript for publication.
Ethics approval and consent to
participate
The protocols for all animal experiments were
approved by the Animal Experimentation Committee of Fujita Health
University (approval no. AP19053).
Patient consent for publication
Not applicable.
Competing interests
Kyoka Yamazaki is an employee of Matsutani Chemical
Industry Co., Ltd. Kuniaki Saito was funded by A&T Corporation,
Nisshin Seifun Group, Marukome Corporation, and Tsuji-seiyu
Corporation and belongs to an endowed chair funded by Fujifilm Wako
Pure Chemical Corporation and A&T Corporation. The other
authors have no financial competing interests.
References
|
1
|
Sung H, Ferlay J, Siegel RL, Laversanne M,
Soerjomataram I, Jemal A and Bray F: Global cancer statistics 2020:
GLOBOCAN estimates of incidence and mortality worldwide for 36
cancers in 185 countries. CA Cancer J Clin. 71:209–249. 2021.
View Article : Google Scholar : PubMed/NCBI
|
|
2
|
Siegel RL, Miller KD and Jemal A: Cancer
statistics, 2020. CA Cancer J Clin. 70:7–30. 2020. View Article : Google Scholar : PubMed/NCBI
|
|
3
|
Mooradian AD, Smith M and Tokuda M: The
role of artificial and natural sweeteners in reducing the
consumption of table sugar: A narrative review. Clin Nutr ESPEN.
18:1–8. 2017. View Article : Google Scholar : PubMed/NCBI
|
|
4
|
Iga Y, Nakamichi K, Shirai Y and Matsuo T:
Acute and sub-chronic toxicity of D-allose in rats. Biosci
Biotechnol Biochem. 74:1476–1478. 2010. View Article : Google Scholar : PubMed/NCBI
|
|
5
|
Yamada T, Iida T, Takamine S, Hayashi N
and Okuma K: Safety evaluation of rare sugar syrup: Single-dose
oral toxicity in rats, reverse mutation assay, chromosome
aberration assay, and acute non-effect level for diarrhea of a
single dose in humans. Shokuhin Eiseigaku Zasshi. 56:211–216.
2015.(In Japanese). View Article : Google Scholar
|
|
6
|
Liu Y, Nakamura T, Toyoshima T, Shinomiya
A, Tamiya T, Tokuda M, Keep RF and Itano T: The effects of D-allose
on transient ischemic neuronal death and analysis of its mechanism.
Brain Res Bull. 109:127–131. 2014. View Article : Google Scholar
|
|
7
|
Yamaguchi F, Takata M, Kamitori K, Nonaka
M, Dong Y, Sui L and Tokuda M: Rare sugar D-allose induces specific
up-regulation of TXNIP and subsequent G1 cell cycle arrest in
hepatocellular carcinoma cells by stabilization of p27kip1. Int J
Oncol. 32:377–385. 2008.
|
|
8
|
Noguchi C, Kamitori K, Hossain A,
Hoshikawa H, Katagi A, Dong Y, Sui L, Tokuda M and Yamaguchi F:
D-allose inhibits cancer cell growth by reducing GLUT1 expression.
Tohoku J Exp Med. 238:131–141. 2016. View Article : Google Scholar : PubMed/NCBI
|
|
9
|
Hoshikawa H, Mori T and Mori N: In vitro
and in vivo effects of D-allose: Up-regulation of
thioredoxin-interacting protein in head and neck cancer cells. Ann
Otol Rhinol Laryngol. 119:567–571. 2010. View Article : Google Scholar
|
|
10
|
Hoshikawa H, Kamitori K, Indo K, Mori T,
Kamata M, Takahashi T and Tokuda M: Combined treatment with
D-allose, docetaxel and radiation inhibits the tumor growth in an
in vivo model of head and neck cancer. Oncol Lett. 15:3422–3428.
2018.
|
|
11
|
Balamurugan K: HIF-1 at the crossroads of
hypoxia, inflammation, and cancer. Int J Cancer. 138:1058–1066.
2016. View Article : Google Scholar : PubMed/NCBI
|
|
12
|
Rabinowitz JD and White E: Autophagy and
metabolism. Science. 330:1344–1348. 2010. View Article : Google Scholar : PubMed/NCBI
|
|
13
|
Heitman J, Movva NR and Hall MN: Targets
for cell cycle arrest by the immunosuppressant rapamycin in yeast.
Science. 253:905–909. 1991. View Article : Google Scholar : PubMed/NCBI
|
|
14
|
Noda T and Ohsumi Y: Tor, a
phosphatidylinositol kinase homologue, controls autophagy in yeast.
J Biol Chem. 273:3963–3966. 1998. View Article : Google Scholar : PubMed/NCBI
|
|
15
|
Kim J, Kundu M, Viollet B and Guan KL:
AMPK and mTOR regulate autophagy through direct phosphorylation of
Ulk1. Nat Cell Biol. 13:132–141. 2011. View
Article : Google Scholar
|
|
16
|
Mathew R, Karantza-Wadsworth V and White
E: Role of autophagy in cancer. Nat Rev Cancer. 7:961–967. 2007.
View Article : Google Scholar : PubMed/NCBI
|
|
17
|
Gao L, Wang Z, Lu D, Huang J, Liu J and
Hong L: Paeonol induces cytoprotective autophagy via blocking the
Akt/mTOR pathway in ovarian cancer cells. Cell Death Dis.
10:6092019. View Article : Google Scholar : PubMed/NCBI
|
|
18
|
Sui X, Chen R, Wang Z, Huang Z, Kong N,
Zhang M, Han W, Lou F, Yang J, Zhang Q, et al: Autophagy and
chemotherapy resistance: A promising therapeutic target for cancer
treatment. Cell Death Dis. 4:e8382013. View Article : Google Scholar : PubMed/NCBI
|
|
19
|
Chude CI and Amaravadi RK: Targeting
autophagy in cancer: Update on clinical trials and novel
inhibitors. Int J Mol Sci. 18:1272017. View Article : Google Scholar
|
|
20
|
Amaravadi RK, Lippincott-Schwartz J, Yin
XM, Weiss WA, Takebe N, Timmer W, DiPaola RS, Lotze MT and White E:
Principles and current strategies for targeting autophagy for
cancer treatment. Clin Cancer Res. 17:654–666. 2011. View Article : Google Scholar : PubMed/NCBI
|
|
21
|
Nicklin P, Bergman P, Zhang B,
Triantafellow E, Wang H, Nyfeler B, Yang H, Hild M, Kung C, Wilson
C, et al: Bidirectional transport of amino acids regulates mTOR and
autophagy. Cell. 136:521–534. 2009. View Article : Google Scholar
|
|
22
|
Yu L, McPhee CK, Zheng L, Mardones GA,
Rong Y, Peng J, Mi N, Zhao Y, Liu Z, Wan F, et al: Termination of
autophagy and reformation of lysosomes regulated by mTOR. Nature.
465:942–946. 2010. View Article : Google Scholar : PubMed/NCBI
|
|
23
|
Kim YC and Guan KL: mTOR: A pharmacologic
target for autophagy regulation. J Clin Invest. 125:25–32. 2015.
View Article : Google Scholar
|
|
24
|
Mrakovcic M and Frohlich LF: p53-mediated
molecular control of autophagy in tumor cells. Biomolecules.
8:142018. View Article : Google Scholar
|
|
25
|
Kim E, Goraksha-Hicks P, Li L, Neufeld TP
and Guan KL: Regulation of TORC1 by Rag GTPases in nutrient
response. Nat Cell Biol. 10:935–945. 2008. View Article : Google Scholar
|
|
26
|
Sancak Y, Bar-Peled L, Zoncu R, Markhard
AL, Nada S and Sabatini DM: Ragulator-Rag complex targets mTORC1 to
the lysosomal surface and is necessary for its activation by amino
acids. Cell. 141:290–303. 2010. View Article : Google Scholar
|
|
27
|
Corcelle E, Djerbi N, Mari M, Nebout M,
Fiorini C, Fenichel P, Hofman P, Poujeol P and Mograbi B: Control
of the autophagy maturation step by the MAPK ERK and p38: Lessons
from environmental carcinogens. Autophagy. 3:57–59. 2007.
View Article : Google Scholar : PubMed/NCBI
|
|
28
|
Matsui Y, Takagi H, Qu X, Abdellatif M,
Sakoda H, Asano T, Levine B and Sadoshima J: Distinct roles of
autophagy in the heart during ischemia and reperfusion: roles of
AMP-activated protein kinase and Beclin 1 in mediating autophagy.
Circ Res. 100:914–922. 2007. View Article : Google Scholar : PubMed/NCBI
|
|
29
|
Jozwiak P, Krzeslak A, Bryś M and Lipinska
A: Glucose-dependent glucose transporter 1 expression and its
impact on viability of thyroid cancer cells. Oncol Rep. 33:913–920.
2015. View Article : Google Scholar : PubMed/NCBI
|
|
30
|
Ao H, Li H, Zhao X, Liu B and Lu L: TXNIP
positively regulates the autophagy and apoptosis in the rat muller
cell of diabetic retinopathy. Life Sci. 267:1189882021. View Article : Google Scholar
|
|
31
|
Zhang X, Cheng D, Liu Y, Wu Y and He Z:
Gephyrin suppresses lung squamous cell carcinoma development by
reducing mTOR pathway activation. Cancer Manag Res. 11:5333–5341.
2019. View Article : Google Scholar : PubMed/NCBI
|
|
32
|
Yang Z, Zhang L, Ma A, Liu L, Li J, Gu J
and Liu Y: Transient mTOR inhibition facilitates continuous growth
of liver tumors by modulating the maintenance of CD133+ cell
populations. PLoS One. 6:e284052011. View Article : Google Scholar : PubMed/NCBI
|
|
33
|
Kenerson HL, Aicher LD, True LD and Yeung
RS: Activated mammalian target of rapamycin pathway in the
pathogenesis of tuberous sclerosis complex renal tumors. Cancer
Res. 62:5645–5650. 2002.PubMed/NCBI
|
|
34
|
Inoki K, Corradetti MN and Guan KL:
Dysregulation of the TSC-mTOR pathway in human disease. Nat Genet.
37:19–24. 2005. View
Article : Google Scholar
|
|
35
|
Nazio F, Bordi M, Cianfanelli V, Locatelli
F and Cecconi F: Autophagy and cancer stem cells: Molecular
mechanisms and therapeutic applications. Cell Death Differ.
26:690–702. 2019. View Article : Google Scholar : PubMed/NCBI
|
|
36
|
Han W, Pan H, Chen Y, Sun J, Wang Y, Li J,
Ge W, Feng L, Lin X, Wang X, et al: EGFR tyrosine kinase inhibitors
activate autophagy as a cytoprotective response in human lung
cancer cells. PLoS One. 6:e186912011. View Article : Google Scholar : PubMed/NCBI
|
|
37
|
Chen K and Shi W: Autophagy regulates
resistance of non-small cell lung cancer cells to paclitaxel.
Tumour Biol. 37:10539–10544. 2016. View Article : Google Scholar
|
|
38
|
Ojha R, Bhattacharyya S and Singh SK:
Autophagy in cancer stem cells: A potential link between
chemoresistance, recurrence, and metastasis. Biores Open Access.
4:97–108. 2015. View Article : Google Scholar : PubMed/NCBI
|
|
39
|
Chi KH, Ko HL, Yang KL, Lee CY, Chi MS and
Kao SJ: Addition of rapamycin and hydroxychloroquine to metronomic
chemotherapy as a second line treatment results in high salvage
rates for refractory metastatic solid tumors: A pilot safety and
effectiveness analysis in a small patient cohort. Oncotarget.
6:16735–16745. 2015. View Article : Google Scholar
|
|
40
|
Kimura T, Takabatake Y, Takahashi A and
Isaka Y: Chloroquine in cancer therapy: A double-edged sword of
autophagy. Cancer Res. 73:3–7. 2013. View Article : Google Scholar : PubMed/NCBI
|