Introduction
Pituitary tumors are the third most commonly
diagnosed intracranial tumor after meningioma and glioma,
accounting for 10–15% of all brain tumors (1). Of these, adenoma comprises most
cases, with only <1% of cases developing cancer. However, due to
the position and function of the pituitary gland, pituitary tumors
affect patient quality of life (2). Although patients with pituitary
tumors usually demonstrate a good prognosis, there is a lack of
knowledge surrounding the underlying molecular mechanism of this
disease.
Genetic mutations are frequently reported in
patients with pituitary tumors and include mutations in GNAS
complex locus, protein kinase C, PI3K, Harvey rat sarcoma virus and
ubiquitin specific peptidase 8, which are known regulators of the
signaling pathways that control cell proliferation, survival and
motility (3). These genes are
upstream of cellular signals, meaning that they produce heavily
toxic effects when they are inhibited (4). The most well-known differentiated
expressed gene between normal pituitary tissue and pituitary tumor
tissue is pituitary tumor-transforming gene 1 (PTTG1) (5). Its expression was first determined in
the GH4 rat pituitary tumor cell line, but not in the normal
pituitary gland (6). A functional
study indicated that PTTG1 overexpression drives pituitary adenoma
formation in mice (7), while its
knockout significantly inhibits pituitary tumor formation in
retinoblastoma-deficient animals (8). The results of these studies
demonstrate that PTTG1 is targetable in pituitary tumors.
Sirtuin 1 (SIRT1) is a protein deacetylation enzyme
that removes acetyl moiety from proteins (9). The activity of this enzyme is
regulated by nicotinamide adenosine dinucleotide (NAD+),
the level of which represents low energy availability in cells
(10). SIRT1 is reported to be a
key bridge that links metabolism with age (11). As metabolism remodeling plays a
prominent role in tumor cells, SIRT1 has gained tremendous
attention in cancer research. However, the function of SIRT1 in
cancer is controversial due to different cancer types and the
heterogeneity of cancer tissues. To the best of our knowledge, few
studies have reported the function and mechanism of SIRT1 in
pituitary tumors.
The present study revealed that SIRT1 was
downregulated in pituitary tumor tissues, and that SIRT1 expression
inhibited tumor growth. The results also revealed that SIRT1
downregulated PTTG1 through the deacetylation of histone (H)3
lysine (K)9ac. More importantly, resveratrol, which activates SIRT1
enzymatic activity, inhibited pituitary tumor cell growth. The
results of the present study concluded that targeting the
SIRT1/PTTG1 axis may be a potential treatment option for patients
with pituitary tumors.
Materials and methods
Clinical samples
Clinical samples of pituitary tumors tissues and
paired normal tissues from patients at Shanghai Changzheng Hospital
(Shanghai, China) were collected after surgery with written
informed consents from all patients and in compliance with the
Medical Ethics Committee of Shanghai Changzheng Hospital under the
approval no. 2021SLYS5. A total of 20 patients with a median age of
38.3 years were included in the present study. Patients without any
treatment prior to surgery were enrolled, and samples were obtained
from January 2018 to December 2019.
Cell culture
AtT-20 (cat. no. TCM 1) and 293T (Cat. no. GNHu17)
were purchased from the Cell Bank of Chinese Academy of Sciences,
Shanghai, China. GT1-1 (cat. no. 1101MOU-PUMC000009) was purchased
from the National Infrastructure of Cell Line Resource. AtT-20 was
cultured in RPMI-1640 medium (cat. no. L210KJ; Shanghai BasalMedia
Technologies Co., Ltd.) supplemented with 10% fetal bovine serum
(FBS) (product code 04-001-1ACS; Wolcavi Biotech), while 293T and
GT1-1 were cultured in Dulbecco's modified Eagle's medium (DMEM)
(cat. no. L110KJ; Shanghai BasalMedia Technologies Co., Ltd.)
supplemented with 10% FBS. All culture medium contained penicillin
and streptomycin (both were 100 U/ml; cat. no. P1400; Beijing
Solarbio Science & Technology Co., Ltd.), and was conditioned
at 37°C with 5% CO2 in an incubator (STERI-CYCLE i160;
Thermo Fisher Scientific, Inc.).
Drugs and treatment
Unless otherwise stated, all drugs were obtained
from MedChemExpress, and incubations were performed with full
medium in the incubator for 24 h. Nicotinamide (cat. no. HY-B0150)
was used at 5 mM, resveratrol (cat. no. HY-16561) was used at 10
µM, PJ34 (cat. no. HY-13688A) and DPQ (cat. no. T19849; TargetMol
Chemicals, Inc.) were used at 10 µM, and JQ1 (cat. no. HY-112789)
was used at 0.5 µM. Insulin (cat. no. 11038-HNAY; SinoBiological,
Inc.) was used at 20 ng/ml and IGF-1 (cat. no. 50437-MNAY;
SinoBiological Inc.) was used at 100 ng/ml; both growth factors
were incubated with cells for 1 h in the incubator.
Reverse transcription-quantitative PCR
(RT-qPCR)
Total RNA was extracted from pituitary tumor and
adjacent normal tissues by TRIzol reagent (Invitrogen; Thermo
Fisher Scientific, Inc.), and quantified by NanoDrop 2000c (Thermo
Fisher Scientific, Inc.). A total of 2 µg RNA was reverse
transcribed according to the manufacturer's instructions using
Reverse Transcription System (cat. no. A3500; Promega Corporation).
For real-time PCR, 2X SYBR Premix Taq system (Yeasen Biotechnology
Co., Ltd.) was used and for detection on PikoReal Real-Time PCR
system (Thermo Fisher Scientific, Inc.) was used. Thermocycling
conditions were as follows: Initial denaturation at 95°C for 2 min,
followed by 40 cycles of denaturation at 95°C for 10 sec, annealing
at 60°C for 20 sec, extension at 72°C for 20 sec. The method of
quantification used was 2−ΔΔCq (12). Primers used to detect SIRT1 were as
follows: Forward primer, 5′-GGCGGCTTGATGGTAATCAG-3′ and reverse
primer, 5′-AGTCCCAAATCCAGCTCCTC-3′. Primers used to detect GAPDH
were as follows: Forward primer, 5′-CCATGGGGAAGGTGAAGGTC-3′ and
reverse primer, 5′-GGGATCTCGCTCCTGGAAGA-3′.
Immunohistochemistry
Immunostaining of SIRT1 (cat. no. 13161-1-AP;
diluted 1:100) and interleukin (IL)-6 (cat. no. 21865-1-AP; diluted
1:100; both from ProteinTech Group, Inc.) was performed with
paraffin-embedded pituitary tumor sections [first fixed in 4%
paraformaldehyde (cat. no. P1110; Beijing Solarbio Science &
Technology Co., Ltd.) for 24 h in a cold room] of 5-µm thickness.
Essentially, sections were first deparaffinized at 65°C for 30 min,
and incubated with antibodies overnight in a cold room (4–8°C),
followed by incubation with an HRP-conjugated secondary antibody at
room temperature for 1 h (product no. 7074; diluted 1:200; Cell
Signaling Technology, Inc.). The signal was obtained with DAB
Substrate Kit (product no. 8059; Cell Signaling Technology). Images
were obtained at ×40 and ×200 magnifications with a light
microscope (BX61; Olympus Corporation).
Western blotting
Western blotting was performed traditionally with
slight modifications. Briefly, cells were seeded at
3×10⁵ cells/well of a 6-well plate, and were harvested
48 h later, followed by lysing in RIPA buffer (cat. no. R0010;
Beijing Solarbio Science & Technology Co., Ltd.) supplied with
protease inhibitor (cat. no. B14002; Bimake.cn). Protein
concentration was determined with Bradford reagent (Bio-Rad
Laboratories, Inc.). Unless otherwise stated 30 µg protein samples
were added per lane of 10% SDS-PAGE gel. A total of 5% BSA
dissolved in TBST was used to block the PVDF membrane at room
temperature for 1 h, and to dilute primary and secondary
antibodies. Incubation of the primary antibodies was performed in a
cold room overnight, and secondary antibody incubation at room
temperature for 1.5 h. ECL (cat. no. sb-wb012; http://www.share-bio.com/) was used to detect HRP
signal intensity. Chemiluminescent signals were recorded by CCD
camera (Tanon system; Tanon Science & Technology Co., Ltd.).
Primary antibodies used in this experiment included (unless
otherwise specified all antibodies were purchased from Affinity
Biosciences): anti-SIRT1 (cat. no. DF6033), anti-β-actin (cat. no.
AF7018), anti-CD38 (cat. no. DF6551), anti-PTTG1 (cat. no. AF0354),
pan-AKT (cat. no. AF6261), phosphorylated (p)-AKT (Thr308) (cat.
no. AF3262), anti-GCN5L2 (cat. no. DF3383). The secondary antibody
used was goat anti-rabbit (H + L) linked with HRP (cat. no. S0001;
Affinity Biosciences).
Stable cell line construction
Stable cell lines were constructed via
lentivirus-mediated gene delivery. pEF1a-MCS-IRES-GFP and
pLKO.1-TRC were used to overexpress and knockdown target genes
respectively. SIRT1 H363Y mutation was obtained by site-directed
mutagenesis, and primers used were as follows: Forward primer,
5′-aggataattcagtgttatggttcct-3′ and reverse primer,
5′-gttgcaaaggaaccataacactga-3′. To produce lentiviruses, 293T cells
were transfected with the aforementioned core plasmids, along with
the packaging plasmids psPAX2 and pMD2.G (cat. no. 12260 and 12259,
respectively; Addgene, Inc.) at a ratio of 12:8:4 µg and
Lipofectamine® 2000 transfection reagent (used according
to the manufacturer's instructions; refreshing the medium 6 h
post-transfection; Thermo Fisher Scientific, Inc.). Viruses were
harvested at 72-h post-transfection (the medium was refreshed every
24 h). Transfection of GT1-1 and AtT20 cells was performed in
6-well plates with polybrene at a final concentration of 2.5 µg/ml
for 24 h and at an MOI of 0.5. Cells were sorted for GFP signals by
FACS using FACSAria (Beckman Coulter, Inc.) or selected with
puromycin at 4 µg/ml for 3 days or longer. Overexpression and
knockdown efficacies were demonstrated by western blot analysis.
Short hairpin (sh)RNA primers used were as follows: shSIRT1-1
forward primer,
5′-CCGGAGTGAGACCAGTAGCACTAATCTCGAGATTAGTGCTACTGGTCTCACTTTTTTG-3′
and reverse primer:
5′-AATTCAAAAAAGTGAGACCAGTAGCACTAATCTCGAGATTAGTGCTACTGGTCTCACT-3′;
shSIRT1-2 forward primer,
5′-CCGGCCTCGAACAATTCTTAAAGATCTCGAGATCTTTAAGAATTGTTCGAGGTTTTTG-3′
and reverse primer,
5′-AATTCAAAAACCTCGAACAATTCTTAAAGATCTCGAGATCTTTAAGAATTGTTCGAGG-3′;
shGCN5 forward primer,
5′-CCGGGCTACCTACAAAGTCAATTATCTCGAGATAATTGACTTTGTAGGTAGCTTTTTG-3′
and reverse primer,
5′-AATTCAAAAAGCTACCTACAAAGTCAATTATCTCGAGATAATTGACTTTGTAGGTAGC-3′;
shBRD4-1 forward primer,
5′-CCGGTGAACCTCCCTGATTACTATACTCGAGTATAGTAATCAGGGAGGTTCATTTTTG-3′
and reverse primer,
5′-AATTCAAAAATGAACCTCCCTGATTACTATACTCGAGTATAGTAATCAGGGAGGTTCA-3′;
shBRD4-2 forward primer,
5′-CCGGGCGGCAGCTAAGTCTAGATATCTCGAGATATCTAGACTTAGCTGCCGCTTTTTG-3′
and reverse primer,
5′-AATTCAAAAAGCGGCAGCTAAGTCTAGATATCTCGAGATATCTAGACTTAGCTGCCGC-3′.
MTT assay
MTT assays were performed to determine the cell
proliferation rate. GT1-1 cells were dissociated from a 10-cm
plate, AtT-20 cells were pelleted down, and the cell concentration
was determined by autonomous cell counter. Cells (1×10³)
were added into each well of a 96-well plate. After 24 h of seeding
in the incubator, MTT was added into the 96-well plate for 4 h,
followed by aspiration to remove the media. DMSO was then used to
dissolve cellular debris and the OD570 was measured and recorded.
These steps were repeated for the next 4 days. All data was
combined and analyzed using GraphPad Prism 6.0 software (GraphPad
Software, Inc.).
Cell viability
Cell viability was determined by Cell Counting Kit-8
(CCK-8) assay. Cells were seeded at 1×10⁴ cells/well of
a 96-well plate. After 24 h of seeding, drugs indicated in the
specific assays were added. After another 24 h, 20 µl CCK-8 was
added, and incubated for 3 h. Following incubation, the absorbance
at 450 nm was determined using a microplate reader (PerkinElmer
Enspire; PerkinElmer, Inc.). Data was processed using GraphPad
Prism 6.0 software.
Invasion assay
The invasion assay was performed using a Transwell
chamber (8 µM pore size; product no. 3422; Corning, Inc.). A total
of 1×10⁶ cells resuspended in 200 µl DMEM or RPMI-1640
medium were seeded into each Transwell with 50 µl Matrigel
(precoated at 37°C for 30 min and diluted 1:2) while 700 µl full
medium was added to the lower compartment. Following incubation for
48 h in the incubator, cells on the outer membrane were stained at
room temperature with 0.05% crystal violet containing 20% methanol
for 10 min. Images were obtained with a light microscope
(RVL-100-G; ECHO).
Chromatin immunoprecipitation
(ChIP)
ChIP-qPCR assays were used to determine the binding
of SIRT1 and H3K9ac to PTTG1 promoter. Cells were first
cross-linked with 1% formaldehyde, followed by scraping into
ice-cold PBS with protease inhibitors. Then cells were resuspended
in lysis buffer (20 mM HEPES, pH=7.9, 420 mM NaCl, 0.2 mM EDTA,
0.5% NP-40, 25% glycerol and 1.5 mM MgCl2), followed by
several brief periods of sonication. One-third of the cell extract
was kept as the input sample, and two-thirds of the cell extract
was used as the substrate for immunoprecipitation with anti-SIRT1
and anti-H3K9ac antibodies. A total of 5 M NaCl was used to reverse
the cross-linking after which the eluted DNA was extracted for PCR
analysis. The primer sequences for the PTTG1 promoter are listed as
follows: forward primer, 5′-ttcgtgaaagagtaatatgg3′ and reverse
primer, 5′-atcctcaatacttcaggctaag-3′.
Statistical analysis
All data analyzed is presented as the mean ±
standard deviation (SD), and was performed using GraphPad Prism 6.
Paired Student's t-test was used to compare variants in two groups.
For each Student's t-test, each group contained more than 3
replicates. P<0.05 was considered to indicate a statistically
significant difference.
Results
SIRT1 expression reduces pituitary
tumor cell growth and invasion
The expression pattern of SIRT1 was assessed in 20
pairs of clinical pituitary tumors by RT-qPCR. The results
demonstrated that SIRT1 expression was lower in tumor tissue
compared with paired normal tissue in 15 (75% of total samples
examined) patients (Fig. 1A).
Consistently, immunohistochemical staining of SIRT1 also revealed
that SIRT1 expression was decreased in tumors compared with normal
tissue (Fig. 1B). To determine the
function of SIRT1 in pituitary tumors, the endogenous expression of
SIRT1 was knocked down in AtT20 cells (a mouse pituitary tumor cell
line) (Fig. 1C). Subsequently,
cellular growth rate and invasion were assessed. The results
revealed that the growth rate of tumor cells was accelerated, while
AtT20 cell invasion was also increased, as a result of SIRT1
knockdown (KD) (Fig. 1C and D).
The aforementioned results were also observed in the GT1-1 cell
line (Fig. 1E and F). Furthermore,
SIRT1 was exogenously expressed in both AtT20 and GT1-1 cells
(Fig. 1G and I). To this end,
SIRT1 overexpression in both cell lines inhibited cell growth and
invasion (Fig. 1G-J).
Collectively, SIRT1 was downregulated in pituitary tumors and its
expression reduced pituitary tumor cell growth and invasion.
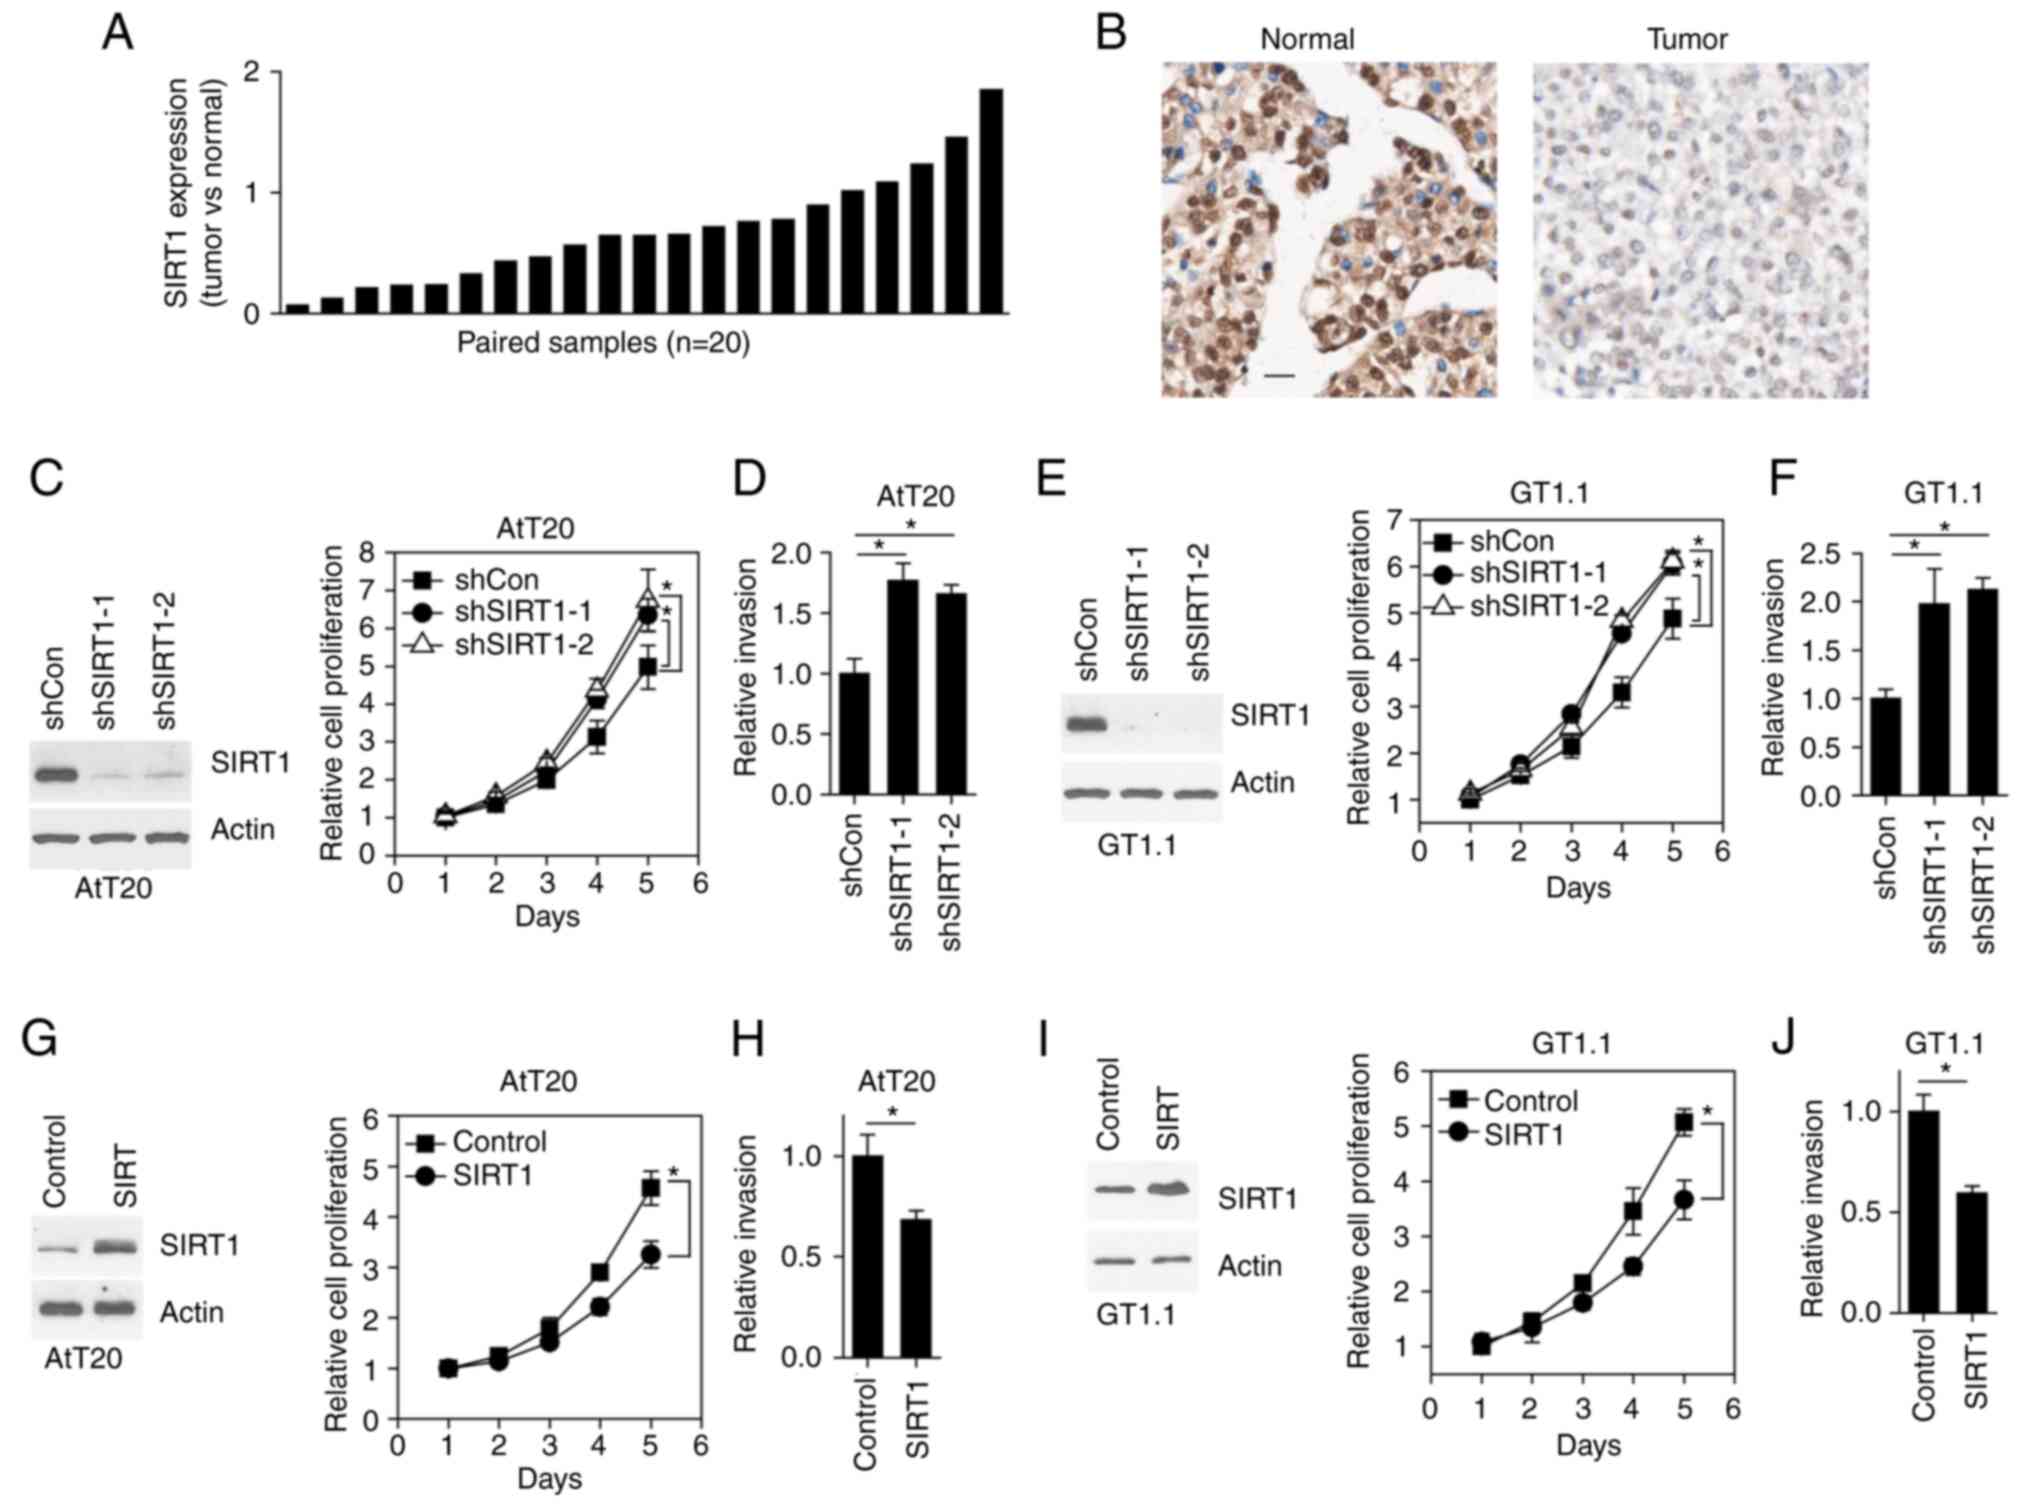 | Figure 1.SIRT1 expression decreases pituitary
tumor cell growth and invasion. (A) Reverse
transcription-quantitative PCR results revealing SIRT1 expression
in human pituitary tumor tissues. (B) Immunohistochemical staining
of SIRT1 in human pituitary sections. Scale bar, 50 µm. (C) Western
blotting results revealing the protein expression in cells (left
panel). Line plot of the cell proliferation rate (right panel).
*P<0.05, determined by paired Student's t-test. (D) Bar plot
revealing the number of invasive cells. *P<0.05, determined by
paired Student's t-test. (E) Western blotting results revealing the
protein expression in cells (left panel). Line plot of the cell
proliferation rate (right panel). *P<0.05, determined by paired
Student's t-test. (F) Bar plot showing the number of invasive
cells. *P<0.05, determined by paired Student's t-test. (G)
Western blotting results revealing the protein expression in cells
(left panel). Line plot of the cell proliferation rate (right
panel). *P<0.05, determined by paired Student's t-test. (H) Bar
plot revealing the number of invasive cells. *P<0.05, determined
by paired Student's t-test. (I) Western blotting results revealing
the protein expression in cells (left panel). Line plot of the cell
proliferation rate (right panel). *P<0.05, determined by paired
Student's t-test. (J) Bar plot revealing the number of invasive
cells. *P<0.05, determined by paired Student's t-test. SIRT1,
sirtuin 1. |
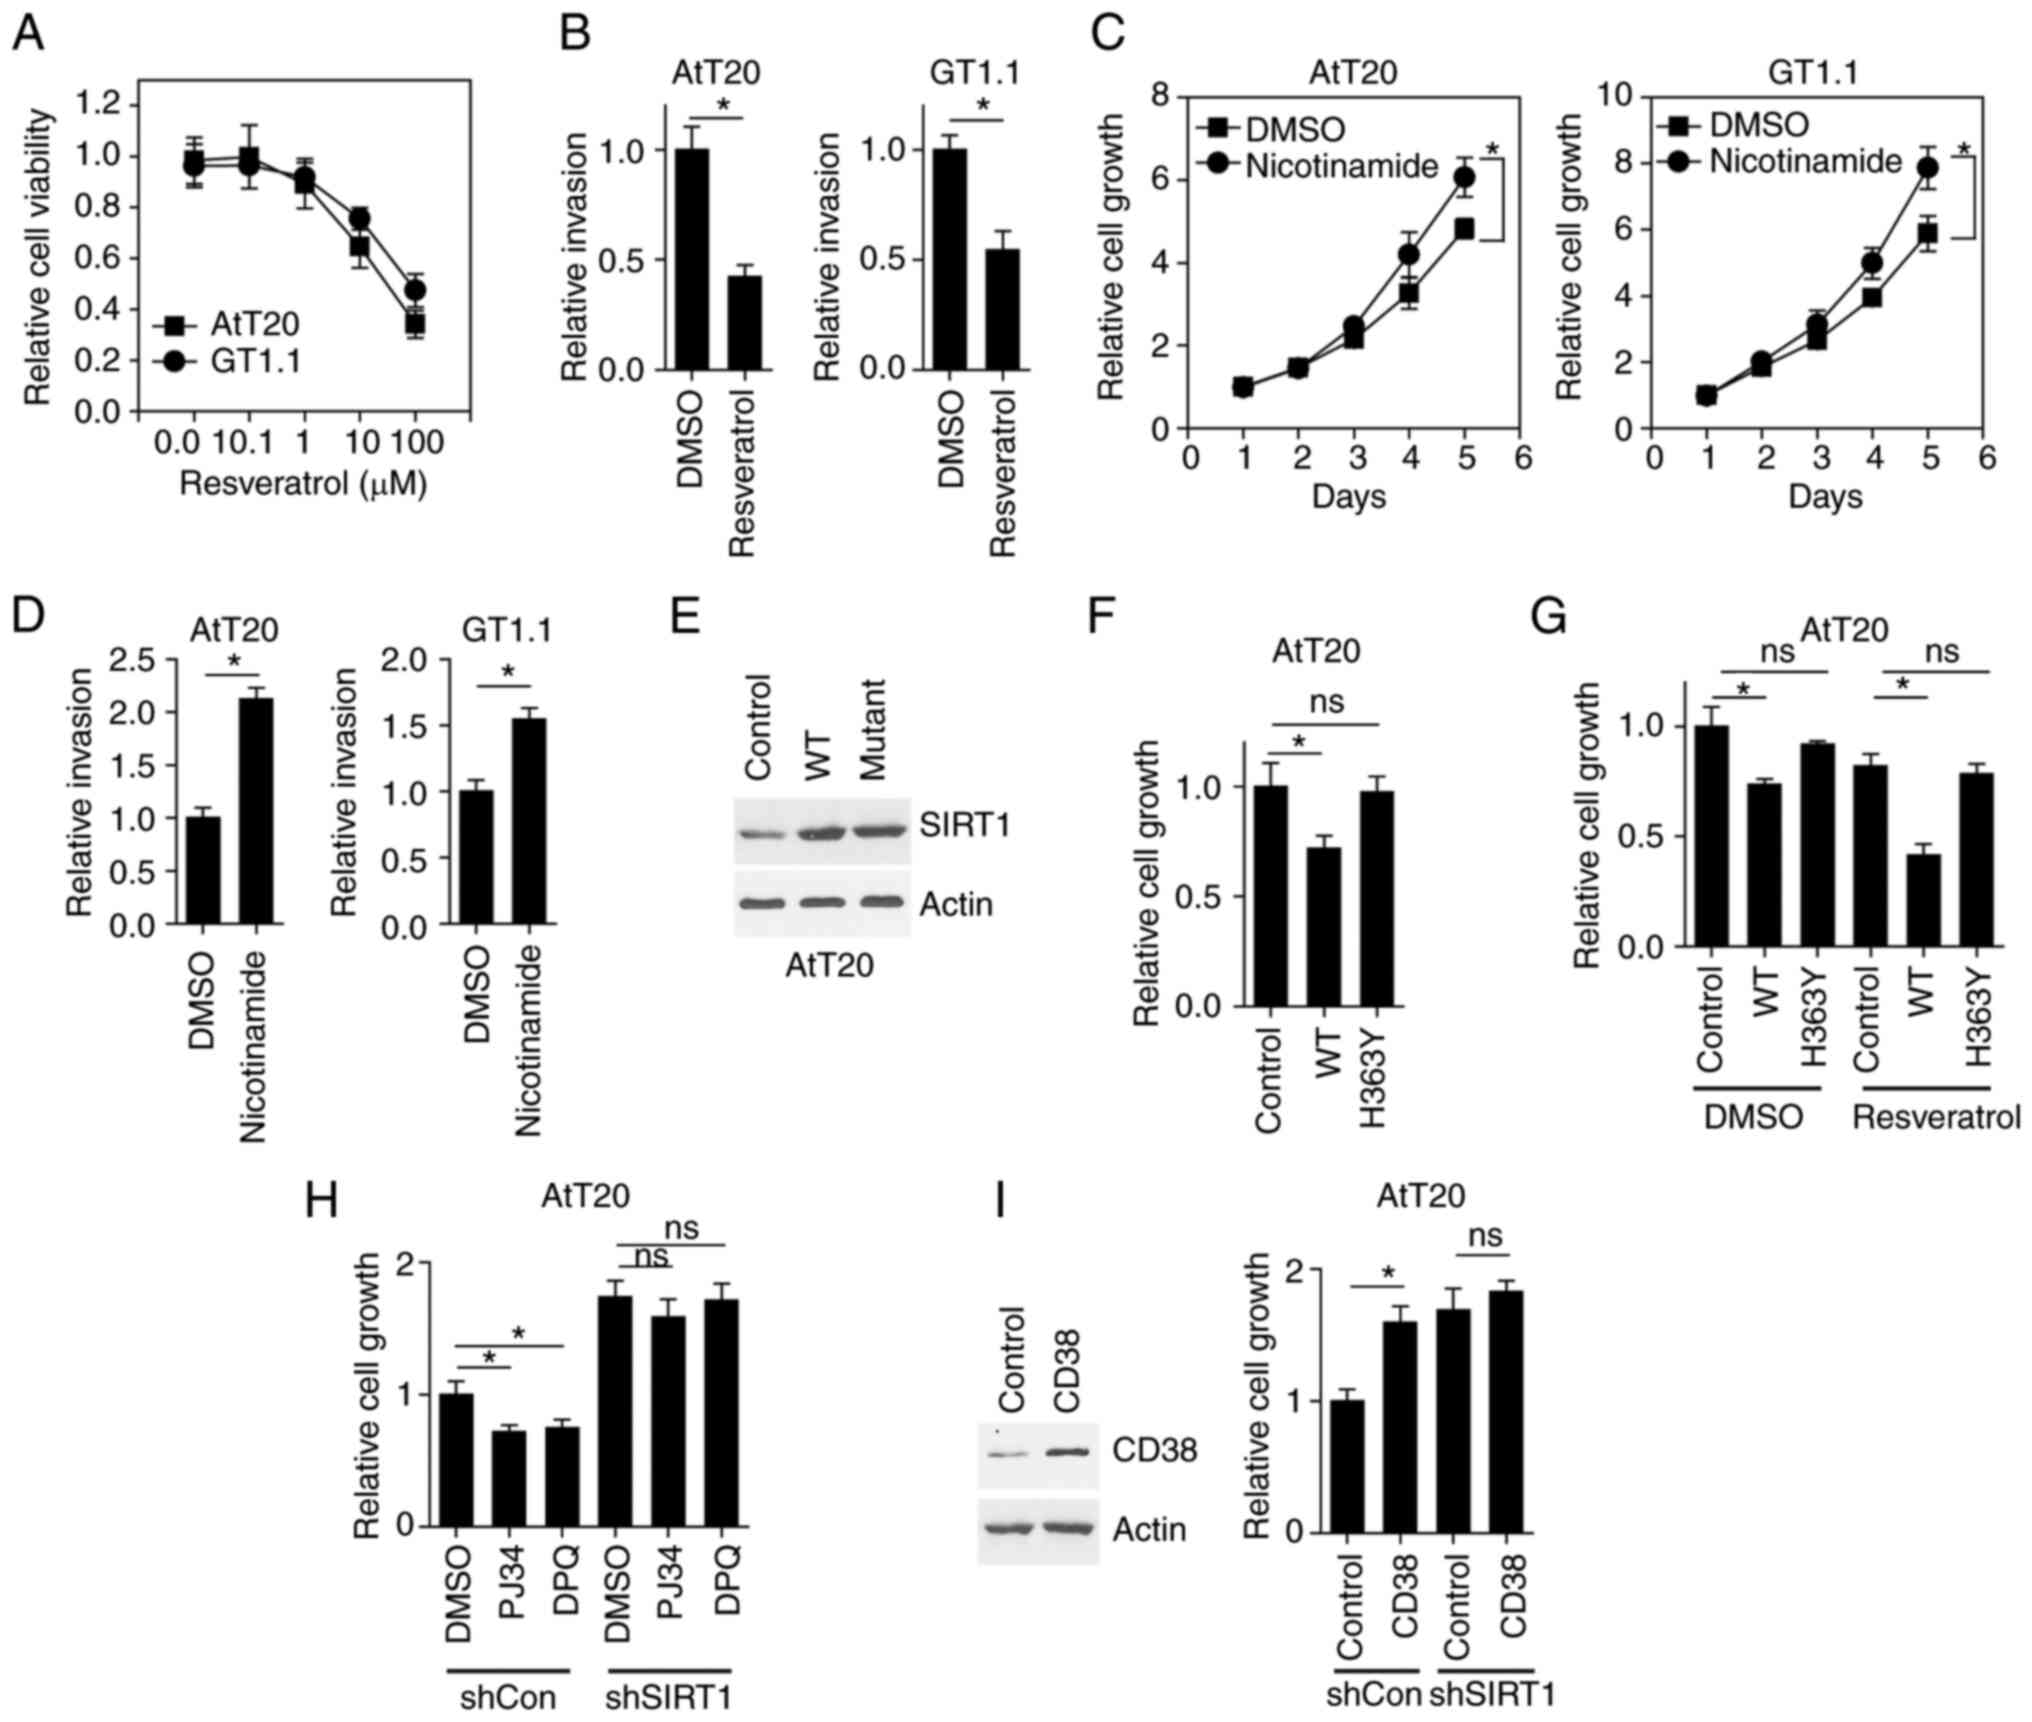
SIRT1 activity regulates pituitary
tumor cell growth and invasion
Due to the fact that resveratrol is an activator of
SIRT1 (10), the present study
aimed to determine whether resveratrol mimicked the tumor
suppressive effect of SIRT1 overexpression in pituitary tumor
cells. The results revealed that resveratrol induced AtT20 and
GT1-1 cell death in a concentration-dependent manner (Fig. 2A). The invasion of AtT20 and GT1-1
cells was also inhibited (Fig.
2B). While these results indicated that the promotion of SIRT1
activity inhibited pituitary tumor cell growth and invasion,
whether SIRT1 inhibition could increase tumor cell growth and
invasion required further elucidation. As nicotinamide is a known
antagonist of SIRT1 (10), the
present study treated pituitary cells with nicotinamide. The
results demonstrated that nicotinamide promoted cell growth
(Fig. 2C) and invasion (Fig. 2D).
It has been demonstrated that a mutation of
histidine to tyrosine in the SIRT1 protein at position 363
abrogates the enzymatic activity of SIRT1 (13). To further verify that SIRT1
activity regulated pituitary tumor cell growth and invasion,
wild-type (WT) SIRT1 and H363Y mutant SIRT1 was expressed in AtT20
cells (Fig. 2E). While WT SIRT1
inhibited cell growth, H363Y mutant SIRT1 exerted no effect
(Fig. 2F). Further treatment with
resveratrol induced the robust inhibition of cell growth in AtT20
cells expressing WT SIRT1; however, this effect was not observed in
H363Y SIRT1-expressed cells (Fig.
2G). The endogenous activity of SIRT1 is mainly regulated by
NAD+ levels, indicating that upregulating cellular
NAD+ levels may promote SIRT1 activity. PJ34 and DPQ are
two chemical compounds that are known to inhibit PARP function and
upregulate cellular NAD+ levels (14). In the present study, treatment of
control AtT20 cells with PJ34 and DPQ inhibited cell growth, while
SIRT1 KD abolished this effect (Fig.
2H). To decrease cellular NAD+ levels, CD38 was
overexpressed, as it is an NADase enzyme. In AtT20 cells, the cell
growth assay revealed that CD38 overexpression promoted cell
growth, while SIRT1 KD inhibited this effect (Fig. 2I). Thus, the enzymatic activity of
SIRT1 regulated pituitary tumor cell growth and invasion.
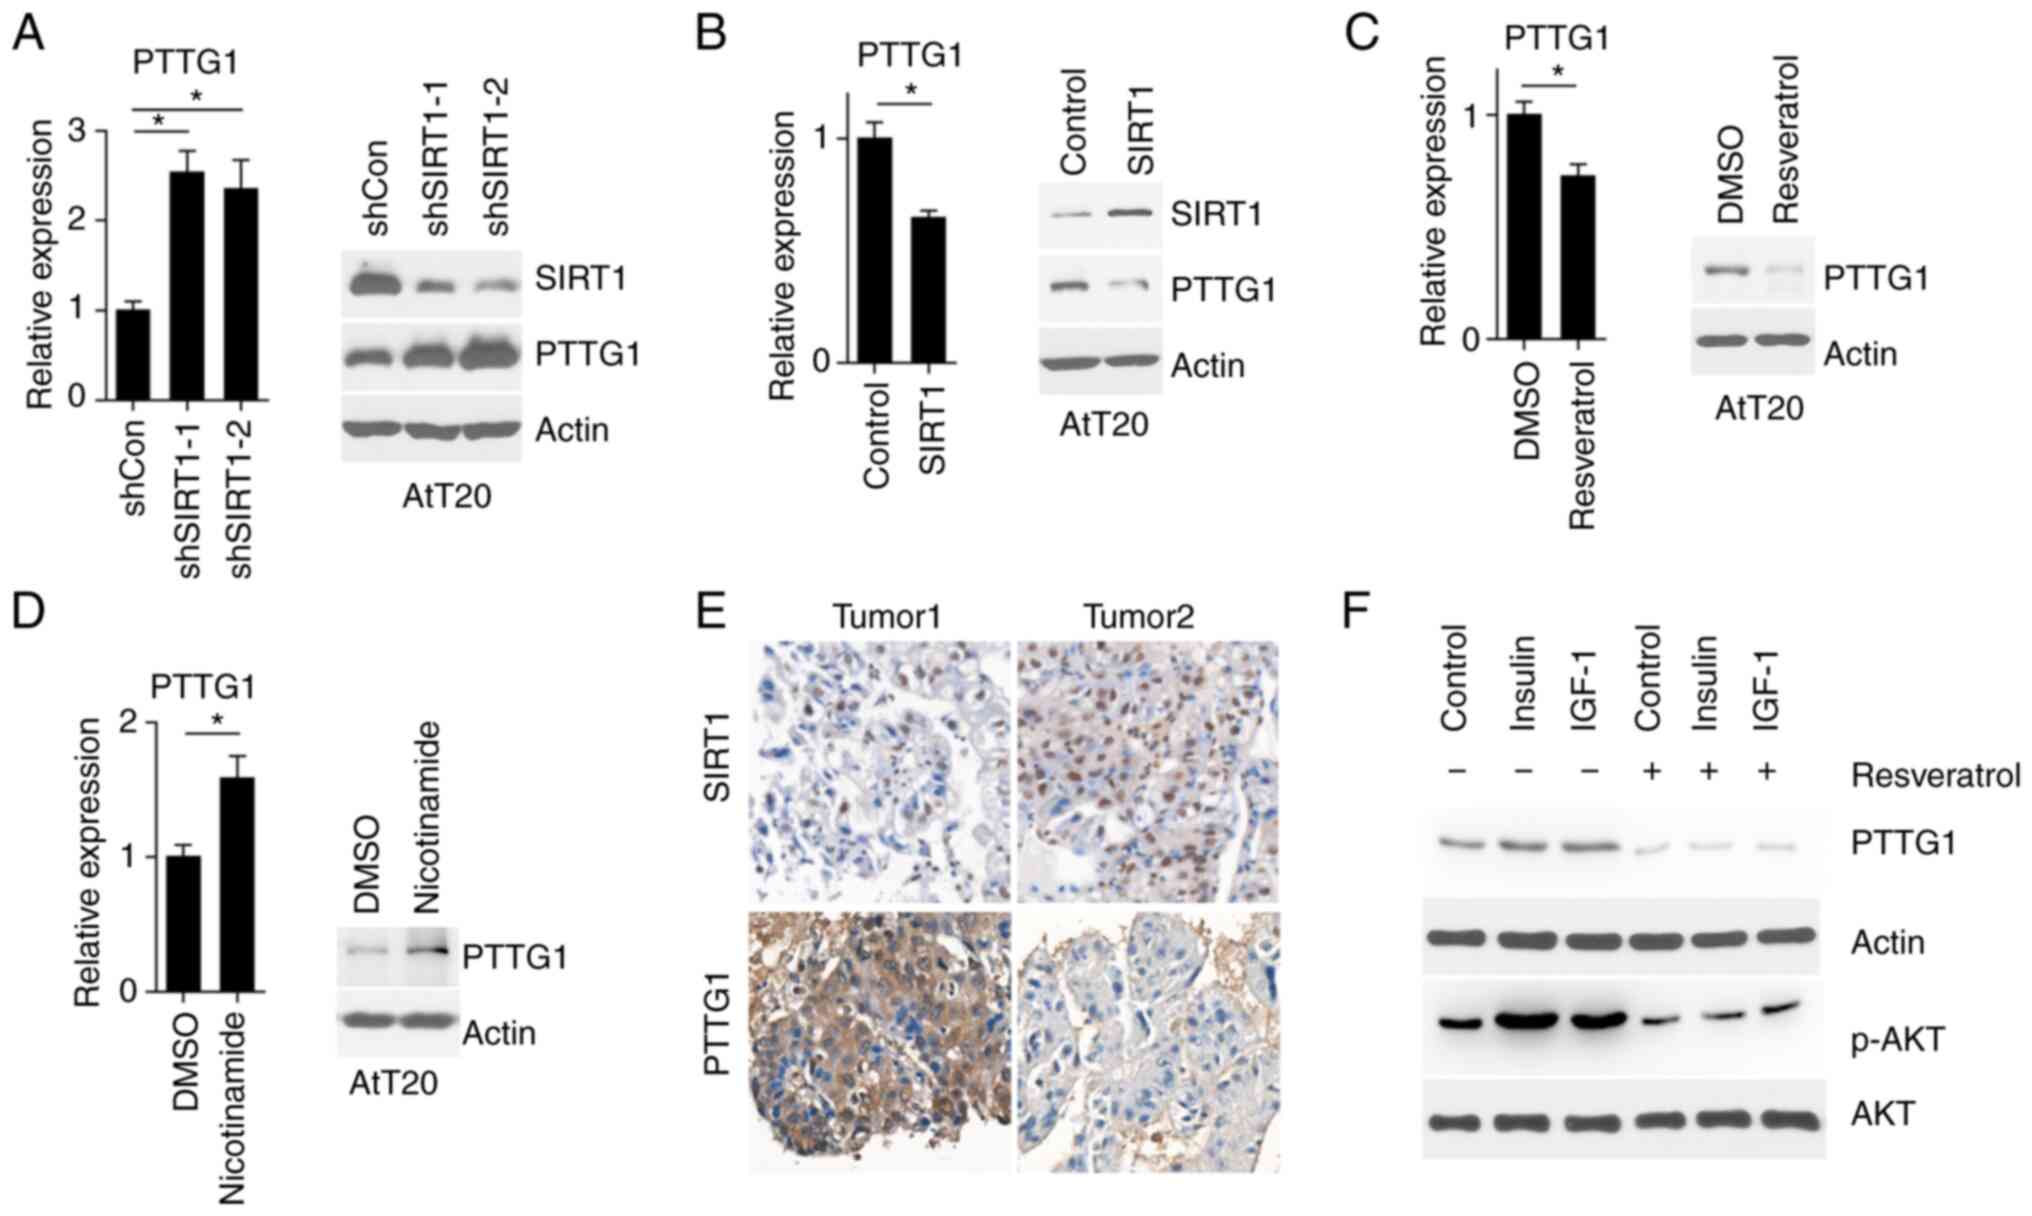
SIRT1 regulates PTTG1 expression
PTTG1 is an oncogene that is expressed in pituitary
tumors but not in normal pituitary glands. As SIRT1 is mainly
localized to the nucleus (10),
the present study aimed to determine whether PTTG1 expression was
regulated by SIRT1. The results demonstrated that PTTG1 mRNA and
protein levels were increased upon SIRT1 inhibition (Fig. 3A). Furthermore, SIRT1
overexpression in AtT20 cells led to decreased levels of PTTG1 mRNA
and protein expression (Fig. 3B).
Moreover, SIRT1 enzymatic activation by resveratrol decreased PTTG1
expression, while its inhibition by nicotinamide increased PTTG1
expression (Fig. 3C and D). This
trend was also observed in clinical pituitary tumor tissues
(Fig. 3E). As insulin and
insulin-like growth factor 1 (IGF-1) activate PTTG1 mRNA
transcription (15), the present
study aimed to elucidate whether SIRT1 was involved in this
process. As presented in Fig. 3F,
insulin and IGF-1 treatment increased PTTG1 expression, while
resveratrol attenuated PTTG1 expression. The aforementioned results
demonstrated that SIRT1 regulated PTTG1 expression.
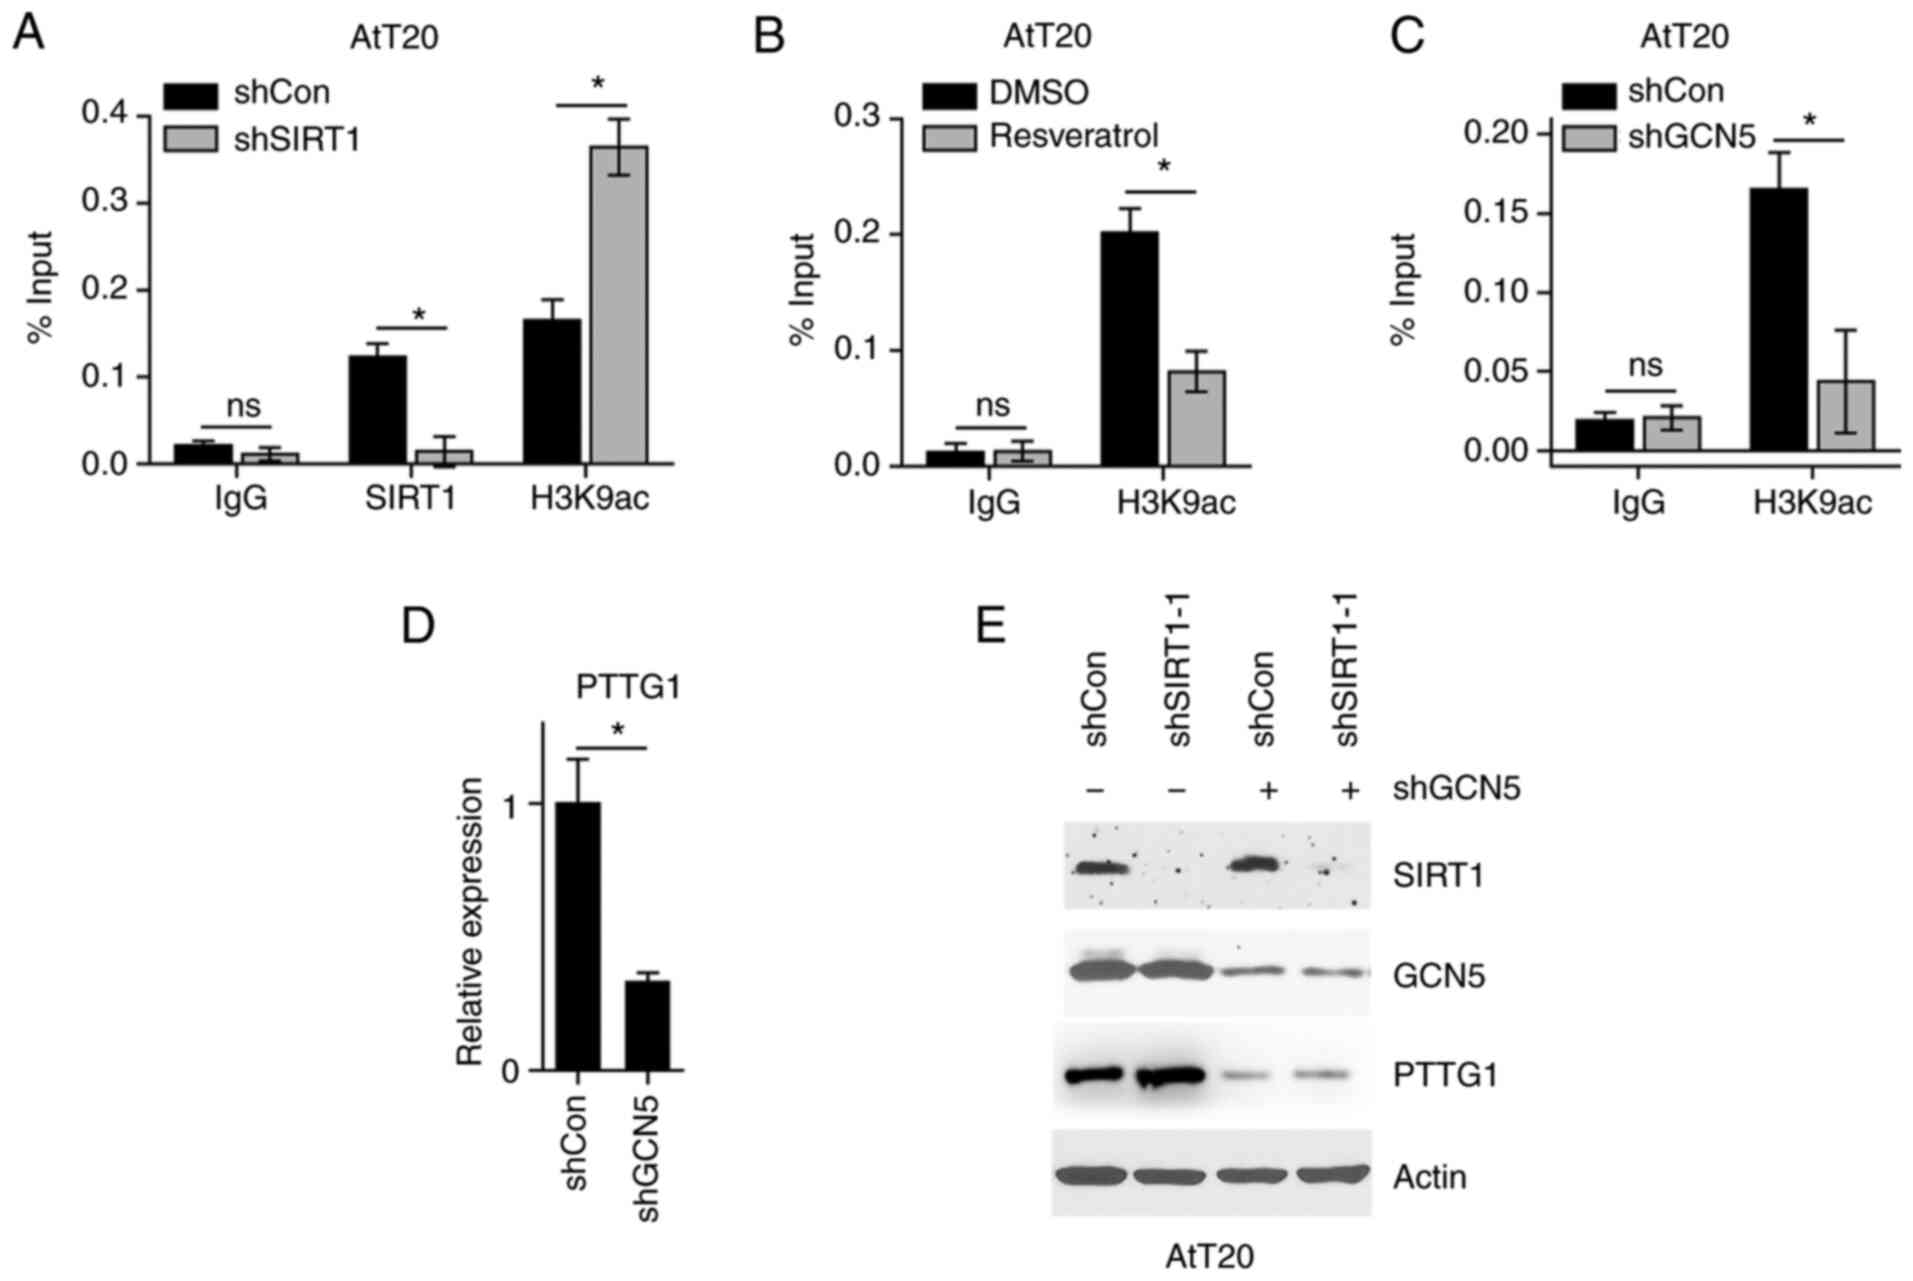
SIRT1 deacetylates the H3K9 to
regulate PTTG1 expression
To gain insight into the mechanism underlying PTTG1
regulation by SIRT1, the present study hypothesized that SIRT1 may
deacetylate H3K9 to suppress PTTG1 transcription. The results
demonstrated that SIRT1 was localized to the PTTG1 promoter region,
and its inhibition enriched H3K9ac at the PTTG1 promoter (Fig. 4A). Furthermore, resveratrol
treatment, which activated SIRT1, decreased H3K9ac levels at the
PTTG1 promoter (Fig. 4B). To
confirm that H3K9ac levels regulated PTTG1 expression, the
expression of GCN5 was knocked down, as GCN5 is known to modify
H3K9 with acetyl moiety (16). The
results of the chromatin immunoprecipitation assay revealed that
H3K9ac levels were decreased at the PTTG1 promoter (Fig. 4C). Furthermore, GCN5 inhibition
resulted in the downregulation of PTTG1 mRNA (Fig. 4D). As GCN5 inhibition decreased
H3K9ac levels at the PTTG1 promoter, the present study aimed to
determine whether SIRT1 regulated PTTG1 expression independently of
H3K9ac. As presented in Fig. 4E,
while SIRT1 KD upregulated PTTG1, this regulation did not occur in
GCN5 KD cells. The results suggested that SIRT1 deacetylated the
H3K9 to regulate PTTG1 expression.
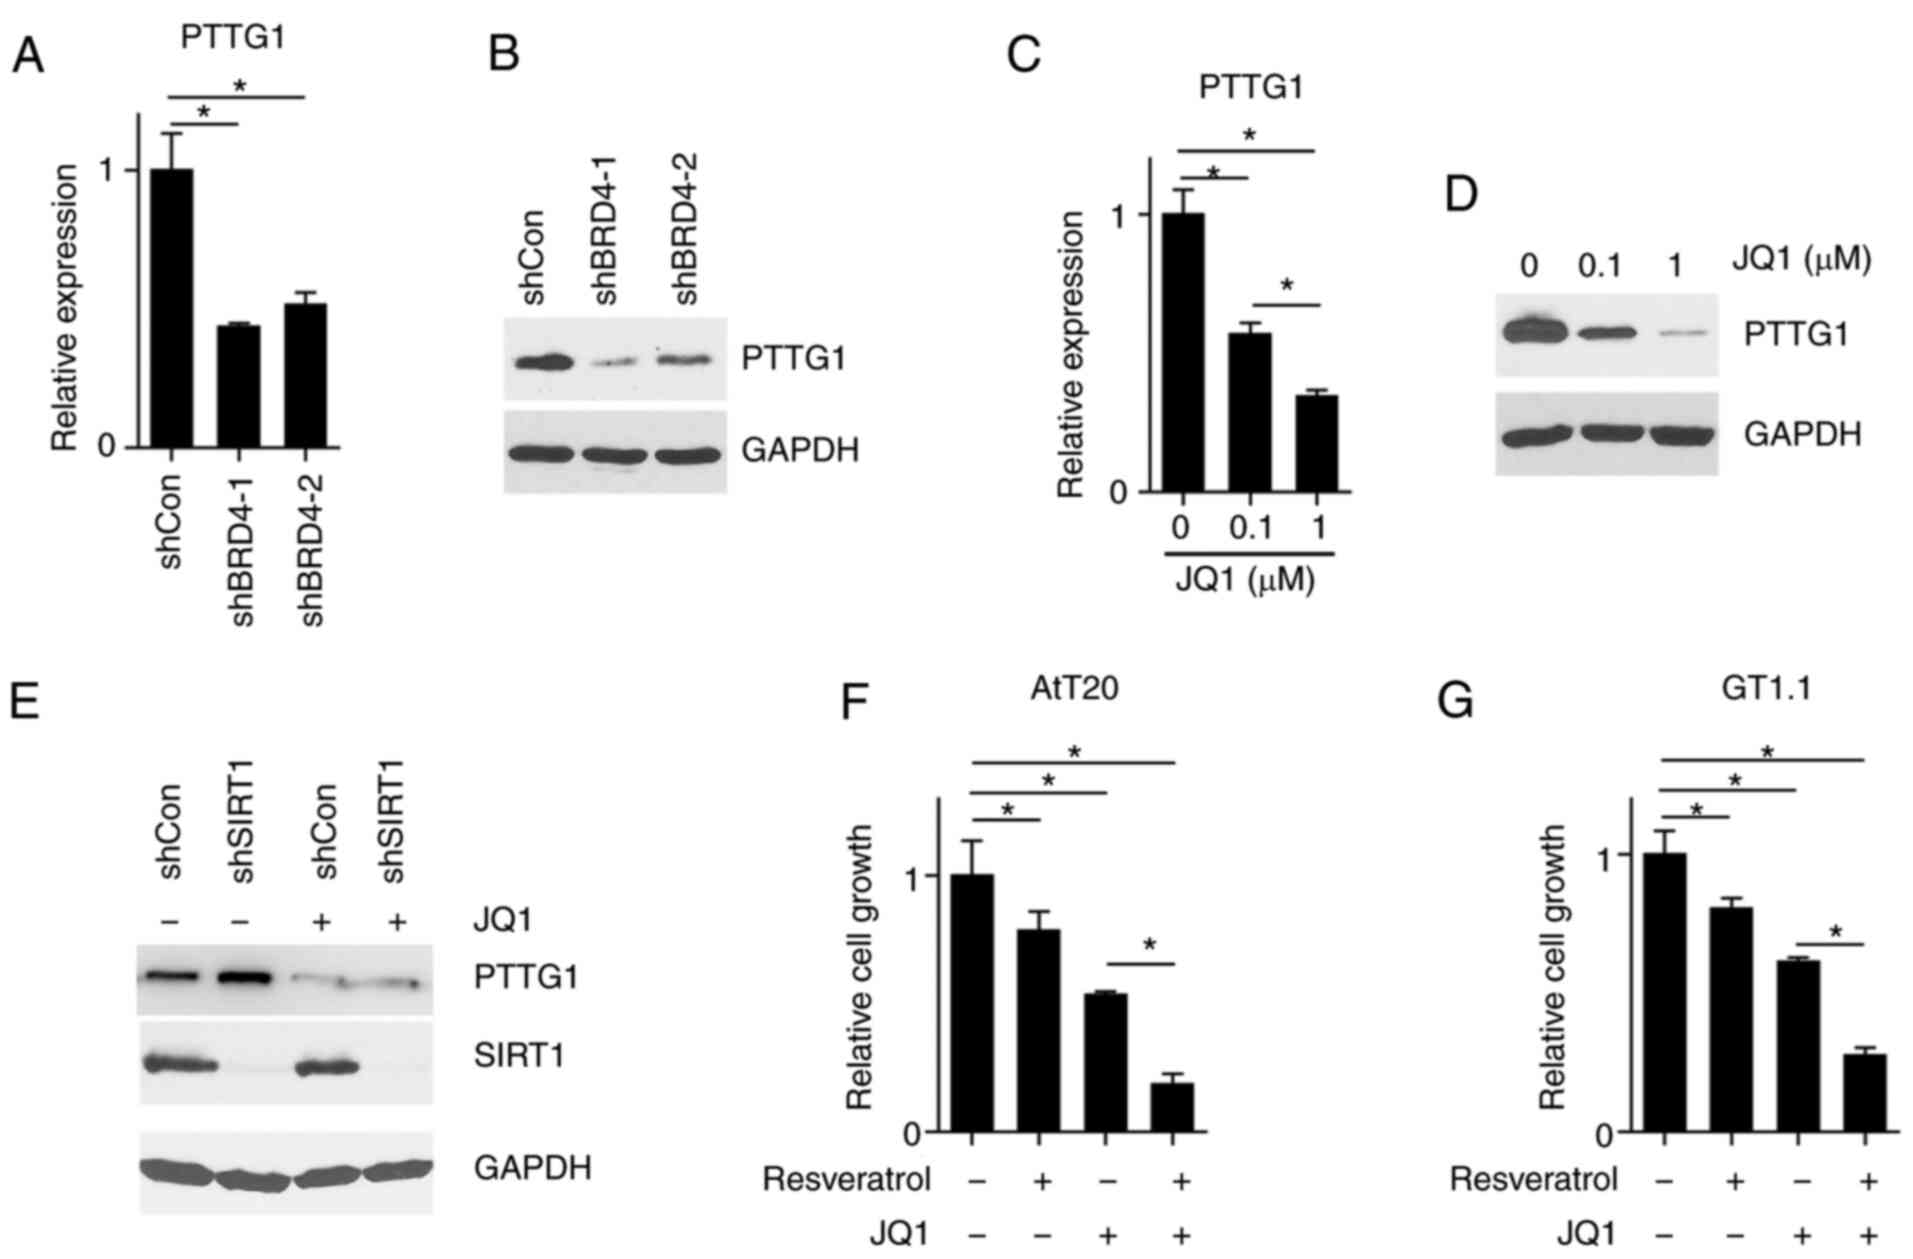
H3K9ac reader bromodomain containing 4
(BRD4) is required for PTTG1 expression
To corroborate that H3K9ac mediated the regulation
of PTTG1 expression by SIRT1, the expression of BRD4 was knocked
down. BRD4 is an H3K9ac reader that when coupled to this, causes
downstream RNA synthesis (17).
The results revealed that BRD4 KD reduced PTTG1 expression
(Fig. 5A and B). JQ1 has been
reported to be an inhibitor of the BRD protein family (18), thus indicating that JQ1 treatment
may mimic the effect of BRD4 KD. As presented in Fig. 5C and D, JQ1 treatment led to a
decreased expression of PTTG1 in a concentration-dependent manner.
Furthermore, treatment of JQ1 abolished the PTTG1 expression that
was induced by SIRT1 KD (Fig. 5E).
The aforementioned results revealed that PTTG1 expression was
regulated by H3K9ac, and that this modification could be divided
into two aspects: Processes determining the abundance of H3K9ac and
cellular ability to decode H3K9ac. While SIRT1 reduced the
abundance of H3K9ac, BRD4 KD attenuated the ability of cells to
decode the H3K9ac signal. To assess whether SIRT1 activation and
BRD4 inhibition would synergically inhibit PTTG1 expression, AtT20
and GT1-1 cells were treated with resveratrol and JQ1. It was
demonstrated that resveratrol treatment alone inhibited cell
growth, and that the concurrent treatment of resveratrol and JQ1
significantly reduced cell growth (Fig. 5F and G). The results suggested that
H3K9ac mediated PTTG1 expression via SIRT1.
Discussion
Gene regulation has been studied to a lesser degree
in pituitary tumors when compared with other tumor types. Although
SIRT1 dysregulation has been reported in numerous types of cancer,
to the best of our knowledge, no study has described the role of
SIRT1 in pituitary tumors. While SIRT1 was reported to be
upregulated and a predictor of poor survival in lung (19), breast (20), gastric (21), colon (22) and prostate cancer (23), along with glioma (24) and sarcoma (25), its expression was confirmed to be
downregulated in head and neck cancer (26). The results of the present study
revealed that SIRT1 was downregulated in pituitary tumors, and that
activation of its expression or enzymatic activity inhibited
pituitary tumor cell growth. Since SIRT1 could be activated by
resveratrol, which is a small chemical, it may represent a
potential treatment strategy for patients with pituitary
tumors.
The present study also revealed that the mRNA
expression of PTTG1 was regulated by SIRT1 in pituitary tumors.
Reported mechanisms underlying the role of SIRT1 in other
malignancies have included: i) Direct deacetylation and
inactivation of tumor suppressor genes, such as tumor protein 53
(27) and retinoblastoma (28); ii) activation of oncogenic
transcription factors such as c-Myc (29), beta-catenin (30) and hypoxia-inducible factor 1α
(31). Moreover, SIRT1 is
classified as a H deacetylase, which indicates its role in the
modification of Hs, its role in the regulation of chromatin
structure and gene expression (32). H substrates of SIRT1 are mainly
comprised of H3 and H4, with strong deacetylation activities for
H3K9ac and H4K16ac, and minor deacetylation activities for H3K14ac,
H4K8ac and H4K12ac (33). H3K9ac
is the classical substrate of SIRT1, and it has been well
established that H3K9ac activates gene transcription at promoter
regions (34). The results of the
present study revealed that SIRT1 expression inhibited PTTG1
expression, but that this was dependent on its enzymatic activity.
SIRT1 was additionally determined to bind to the promoter of PTTG1,
deacetylate H3K9ac and thus attenuate PTTG1 mRNA expression. The
function and mechanism of PTTG1 protein in the development and
progression of different cancer types had gained tremendous
interest, and a number of studies have demonstrated that PTTG1
serves as an oncogene (35). PTTG1
acts as a modulator of the sister chromatid separation process
(36). Its upregulation leads to
genetic instability, including aneuploidy, and thus contributes to
tumor cell evolution. Functional studies have demonstrated that
PTTG1 is an initiator of tumorigenesis as well as a promoter of
tumor progression. Nevertheless, regulation of PTTG1 mRNA
expression has been less frequently reported. Although the
SIRT1/H3K9ac/gene transcription pathway is well accepted, the
specific regulation of PTTG1 by SIRT1 via H3K9ac deacetylation has
not yet been reported to the best of our knowledge.
Three elements are central to H3K9 acetylation
modifications: Writers, erasers and readers (37). The present study identified three
important players that regulate H3K9ac at the promoter region of
PTTG1: GCN5 (the writer), SIRT1 (the eraser) and BRD4 (the reader).
GCN5 belongs to the H acetyltransferase (HAT) family, which
consists of five subfamilies: HAT1, GCN5/P300/CBP-associated
factor, MYST (full name MOZ, Ybf2/Sas3, Sas2 and Tip60), P300/CBP
and Rtt109 (37). Among these
HATs, GCN5 has been demonstrated to acetylate K9 and 14 of H3, and
regulate diverse cellular processes such as cell cycle progression,
metabolism and spermiogenesis (38). GCN5 was also reported to be
involved in cancer progression. For instance, GCN5 acetylated c-Myc
at K323 to stabilize this oncoprotein (39). In non-small cell lung cancer, GCN5
was localized to the promoter regions of E2F transcription factor
1, cyclin D1 and cyclin E1 to promote their gene transcription
(40). Consistent with this model,
the present study revealed that GCN5 upregulated H3K9ac levels at
the promoter region of PTTG1, which in turn promoted PTTG1
expression. However, it should be noted that other HAT proteins may
also regulate this process, and that further study is required to
elucidate these. BRD4 is the most studied member of the bromodomain
and extraterminal family. It contains two bromodomains that
recognizes acetylated K residues (41). Reported substrates of BRD4 include
H3K9ac, H3K14ac and H3K27ac, as well as acetylated Ks in histone 4
(42). When BRD4 binds to its
substrate Hs, it recruits transcription machinery to gene promoters
or enhancers to regulate gene expression (42). The present study revealed that
PTTG1 upregulation, occurring through SIRT1 inhibition, was
reversed by BRD4 inhibition. Since it was demonstrated that SIRT1
inhibition upregulated H3K9ac at the PTTG1 promoter region, the
present results indicated that H3K9ac was read by BRD4 at PTTG1
promoter regions. Furthermore, a synergistic effect was observed
when combining resveratrol and JQ1 to inhibit pituitary cells. This
observation was likely due to the fact that resveratrol decreases
H3K9ac levels at the PTTG1 promoter region, but does not inhibit
them, thus interrupting the readout of H3K9ac, and therefore
inhibiting the binding efficacy of BRD4 to H3K9ac, further
downregulating the expression of PTTG1. The present study not only
validated H3K9ac as an essential regulatory element of PTTG1
expression, but also identified the writer, the eraser and reader
of H3K9ac at the PTTG1 promoter. The results also determined that
the combination of resveratrol and JQ1 inhibited the progression of
pituitary tumor cells, indicating that they may serve as a
potential treatment for patients with pituitary tumors. However,
there are certain limitations in the present study. First,
pituitary tumor subtypes were not addressed in this study since the
clinical samples collected were limited and second, most of the
functional experiments were performed using two cell lines which
render the conclusions preliminary.
Acknowledgements
Not applicable.
Funding
The present study was supported by the research grant of the
National Natural Science Foundation of China (grant no.
81672491).
Availability of data and materials
The data generated in the present study may be
requested from the corresponding author.
Authors' contributions
XD conceived the study. JH and FZ performed most of
the experiments. GH performed RT-PCR and immunohistochemical
assays. YP performed certain drug treatment assays. WS, LJ, PW
provided essential advice and contributed to the design of this
study. JQ analyzed the data and contributed to the interpretation
of all the experimental results. XD, JH and FZ confirm the
authenticity of all the raw data. All authors read and approved the
manuscript and agree to be accountable for all aspects of the
research in ensuring that the accuracy or integrity of any part of
the work are appropriately investigated and resolved.
Ethics approval and consent to
participate
All experimental protocols were in compliance
(approval no. 2021SLYS5) with the Medical Ethics Committee of
Shanghai Changzheng Hospital (Shanghai, China) and written informed
consents were obtained from all the patients.
Patient consent for publication
Not applicable.
Competing interests
The authors declare that they have no competing
interests.
References
|
1
|
Araujo-Castro M, Berrocal VR and
Pascual-Corrales E: Pituitary tumors: Epidemiology and clinical
presentation spectrum. Hormones (Athens). 19:145–155. 2020.
View Article : Google Scholar : PubMed/NCBI
|
|
2
|
Gittleman H, Ostrom QT, Farah PD, Ondracek
A, Chen Y, Wolinsky Y, Kruchko C, Singer J, Kshettry VR, Laws ER,
et al: Descriptive epidemiology of pituitary tumors in the United
States, 2004–2009. J Neurosurg. 121:527–535. 2014. View Article : Google Scholar : PubMed/NCBI
|
|
3
|
Tatsi C and Stratakis CA: The genetics of
pituitary adenomas. J Clin Med. 9:302019. View Article : Google Scholar : PubMed/NCBI
|
|
4
|
Gerber DE: Targeted therapies: A new
generation of cancer treatments. Am Fam Physician. 77:311–319.
2008.PubMed/NCBI
|
|
5
|
Zhou C: Pituitary tumors: Role of
pituitary tumor-transforming gene-1 (PTTG1). Tumors of the Central
Nervous System, Volume 10: Pineal, Pituitary, and Spinal Tumors.
Hayat MA: Springer; Dordrecht: pp. 203–214. 2013, View Article : Google Scholar
|
|
6
|
Pei L and Melmed S: Isolation and
characterization of a pituitary tumor-transforming gene (PTTG). Mol
Endocrinol. 11:433–441. 1997. View Article : Google Scholar : PubMed/NCBI
|
|
7
|
Donangelo I, Gutman S, Horvath E, Kovacs
K, Wawrowsky K, Mount M and Melmed S: Pituitary tumor transforming
gene overexpression facilitates pituitary tumor development.
Endocrinology. 147:4781–4791. 2006. View Article : Google Scholar : PubMed/NCBI
|
|
8
|
Chesnokova V, Kovacs K, Castro AV, Zonis S
and Melmed S: Pituitary hypoplasia in Pttg-/- mice is protective
for Rb+/- pituitary tumorigenesis. Mol Endocrinol. 19:2371–2379.
2005. View Article : Google Scholar : PubMed/NCBI
|
|
9
|
Rahman S and Islam R: Mammalian Sirt1:
Insights on its biological functions. Cell Commun Signal. 9:112011.
View Article : Google Scholar : PubMed/NCBI
|
|
10
|
Li X: SIRT1 and energy metabolism. Acta
Biochim Biophys Sin (Shanghai). 45:51–60. 2013. View Article : Google Scholar : PubMed/NCBI
|
|
11
|
Bordone L and Guarente L: Calorie
restriction, SIRT1 and metabolism: Understanding longevity. Nat Rev
Mol Cell Biol. 6:298–305. 2005. View
Article : Google Scholar : PubMed/NCBI
|
|
12
|
Livak KJ and Schmittgen TD: Analysis of
relative gene expression data using real-time quantitative PCR and
the 2(−Delta Delta C(T)) method. Methods. 25:402–408. 2001.
View Article : Google Scholar : PubMed/NCBI
|
|
13
|
Pagans S, Pedal A, North BJ, Kaehlcke K,
Marshall BL, Dorr A, Hetzer-Egger C, Henklein P, Frye R, McBurney
MW, et al: SIRT1 regulates HIV transcription via Tat deacetylation.
PLoS Biol. 3:e412005. View Article : Google Scholar : PubMed/NCBI
|
|
14
|
Rajman L, Chwalek K and Sinclair DA:
Therapeutic potential of NAD-boosting molecules: The in vivo
evidence. Cell Metab. 27:529–547. 2018. View Article : Google Scholar : PubMed/NCBI
|
|
15
|
Thompson AD III and Kakar SS: Insulin and
IGF-1 regulate the expression of the pituitary tumor transforming
gene (PTTG) in breast tumor cells. FEBS Lett. 579:3195–3200. 2005.
View Article : Google Scholar : PubMed/NCBI
|
|
16
|
Jin Q, Yu LR, Wang L, Zhang Z, Kasper LH,
Lee JE, Wang C, Brindle PK, Dent SY and Ge K: Distinct roles of
GCN5/PCAF-mediated H3K9ac and CBP/p300-mediated H3K18/27ac in
nuclear receptor transactivation. EMBO J. 30:249–262. 2011.
View Article : Google Scholar : PubMed/NCBI
|
|
17
|
Zhang W, Prakash C, Sum C, Gong Y, Li Y,
Kwok JJ, Thiessen N, Pettersson S, Jones SJ, Knapp S, et al:
Bromodomain-containing protein 4 (BRD4) regulates RNA polymerase II
serine 2 phosphorylation in human CD4+ T cells. J Biol Chem.
287:43137–43155. 2012. View Article : Google Scholar : PubMed/NCBI
|
|
18
|
Shi X, Liu C, Liu B, Chen J, Wu X and Gong
W: JQ1: A novel potential therapeutic target. Pharmazie.
73:491–493. 2018.PubMed/NCBI
|
|
19
|
Grbesa I, Pajares MJ, Martinez-Terroba E,
Agorreta J, Mikecin AM, Larráyoz M, Idoate MA, Gall-Troselj K, Pio
R and Montuenga LM: Expression of sirtuin 1 and 2 is associated
with poor prognosis in non-small cell lung cancer patients. PLoS
One. 10:e01246702015. View Article : Google Scholar : PubMed/NCBI
|
|
20
|
Lee H, Kim KR, Noh SJ, Park HS, Kwon KS,
Park BH, Jung SH, Youn HJ, Lee BK, Chung MJ, et al: Expression of
DBC1 and SIRT1 is associated with poor prognosis for breast
carcinoma. Hum Pathol. 42:204–213. 2011. View Article : Google Scholar : PubMed/NCBI
|
|
21
|
Noguchi A, Kikuchi K, Zheng H, Takahashi
H, Miyagi Y, Aoki I and Takano Y: SIRT1 expression is associated
with a poor prognosis, whereas DBC1 is associated with favorable
outcomes in gastric cancer. Cancer Med. 3:1553–1561. 2014.
View Article : Google Scholar : PubMed/NCBI
|
|
22
|
Chen X, Sun K, Jiao S, Cai N, Zhao X, Zou
H, Xie Y, Wang Z, Zhong M and Wei L: High levels of SIRT1
expression enhance tumorigenesis and associate with a poor
prognosis of colorectal carcinoma patients. Sci Rep. 4:74812014.
View Article : Google Scholar : PubMed/NCBI
|
|
23
|
Jung-Hynes B, Nihal M, Zhong W and Ahmad
N: Role of sirtuin histone deacetylase SIRT1 in prostate cancer. A
target for prostate cancer management via its inhibition? J Biol
Chem. 284:3823–3832. 2009.PubMed/NCBI
|
|
24
|
Marshall GM, Liu PY, Gherardi S, Scarlett
CJ, Bedalov A, Xu N, Iraci N, Valli E, Ling D, Thomas W, et al:
SIRT1 promotes N-Myc oncogenesis through a positive feedback loop
involving the effects of MKP3 and ERK on N-Myc protein stability.
PLoS Genet. 7:e10021352011. View Article : Google Scholar : PubMed/NCBI
|
|
25
|
Kim JR, Moon YJ, Kwon KS, Bae JS, Wagle S,
Yu TK, Kim KM, Park HS, Lee JH, Moon WS, et al: Expression of SIRT1
and DBC1 is associated with poor prognosis of soft tissue sarcomas.
PLoS One. 8:e747382013. View Article : Google Scholar : PubMed/NCBI
|
|
26
|
Chen IC, Chiang WF, Huang HH, Chen PF,
Shen YY and Chiang HC: Role of SIRT1 in regulation of
epithelial-to-mesenchymal transition in oral squamous cell
carcinoma metastasis. Mol Cancer. 13:2542014. View Article : Google Scholar : PubMed/NCBI
|
|
27
|
Vaziri H, Dessain SK, Ng Eaton E, Imai SI,
Frye RA, Pandita TK, Guarente L and Weinberg RA: hSIR2(SIRT1)
functions as an NAD-dependent p53 deacetylase. Cell. 107:149–159.
2001. View Article : Google Scholar : PubMed/NCBI
|
|
28
|
Wong S and Weber JD: Deacetylation of the
retinoblastoma tumour suppressor protein by SIRT1. Biochem J.
407:451–460. 2007. View Article : Google Scholar : PubMed/NCBI
|
|
29
|
Menssen A, Hydbring P, Kapelle K,
Vervoorts J, Diebold J, Lüscher B, Larsson LG and Hermeking H: The
c-MYC oncoprotein, the NAMPT enzyme, the SIRT1-inhibitor DBC1, and
the SIRT1 deacetylase form a positive feedback loop. Proc Natl Acad
Sci USA. 109:E187–E196. 2012. View Article : Google Scholar : PubMed/NCBI
|
|
30
|
Firestein R, Blander G, Michan S,
Oberdoerffer P, Ogino S, Campbell J, Bhimavarapu A, Luikenhuis S,
de Cabo R, Fuchs C, et al: The SIRT1 deacetylase suppresses
intestinal tumorigenesis and colon cancer growth. PLoS One.
3:e20202008. View Article : Google Scholar : PubMed/NCBI
|
|
31
|
Lim JH, Lee YM, Chun YS, Chen J, Kim JE
and Park JW: Sirtuin 1 modulates cellular responses to hypoxia by
deacetylating hypoxia-inducible factor 1alpha. Mol Cell.
38:864–878. 2010. View Article : Google Scholar : PubMed/NCBI
|
|
32
|
Garcia-Peterson LM and Li X: Trending
topics of SIRT1 in tumorigenicity. Biochim Biophys Acta Gen Subj.
1865:1299522021. View Article : Google Scholar : PubMed/NCBI
|
|
33
|
Rauh D, Fischer F, Gertz M,
Lakshminarasimhan M, Bergbrede T, Aladini F, Kambach C, Becker CF,
Zerweck J, Schutkowski M and Steegborn C: An acetylome peptide
microarray reveals specificities and deacetylation substrates for
all human sirtuin isoforms. Nat Commun. 4:23272013. View Article : Google Scholar : PubMed/NCBI
|
|
34
|
Marmorstein R and Zhou MM: Writers and
readers of histone acetylation: Structure, mechanism, and
inhibition. Cold Spring Harb Perspect Biol. 6:a0187622014.
View Article : Google Scholar : PubMed/NCBI
|
|
35
|
Vlotides G, Eigler T and Melmed S:
Pituitary tumor-transforming gene: Physiology and implications for
tumorigenesis. Endocr Rev. 28:165–186. 2007. View Article : Google Scholar : PubMed/NCBI
|
|
36
|
Zou H, McGarry TJ, Bernal T and Kirschner
MW: Identification of a vertebrate sister-chromatid separation
inhibitor involved in transformation and tumorigenesis. Science.
285:418–422. 1999. View Article : Google Scholar : PubMed/NCBI
|
|
37
|
Zhang Y, Sun Z, Jia J, Du T, Zhang N, Tang
Y, Fang Y and Fang D: Overview of histone modification. Adv Exp Med
Biol. 1283:1–16. 2021. View Article : Google Scholar : PubMed/NCBI
|
|
38
|
Luense LJ, Donahue G, Lin-Shiao E, Rangel
R, Weller AH, Bartolomei MS and Berger SL: Gcn5-mediated histone
acetylation governs nucleosome dynamics in spermiogenesis. Dev
Cell. 51:745–758.e6. 2019. View Article : Google Scholar : PubMed/NCBI
|
|
39
|
Patel JH, Du Y, Ard PG, Phillips C,
Carella B, Chen CJ, Rakowski C, Chatterjee C, Lieberman PM, Lane
WS, et al: The c-MYC oncoprotein is a substrate of the
acetyltransferases hGCN5/PCAF and TIP60. Mol Cell Biol.
24:10826–10834. 2004. View Article : Google Scholar : PubMed/NCBI
|
|
40
|
Chen L, Wei T, Si X, Wang Q, Li Y, Leng Y,
Deng A, Chen J, Wang G, Zhu S and Kang J: Lysine acetyltransferase
GCN5 potentiates the growth of non-small cell lung cancer via
promotion of E2F1, cyclin D1, and cyclin E1 expression. J Biol
Chem. 288:14510–14521. 2013. View Article : Google Scholar : PubMed/NCBI
|
|
41
|
Gokani S and Bhatt LK: Bromodomains: A
novel target for the anticancer therapy. Eur J Pharmacol.
911:1745232021. View Article : Google Scholar : PubMed/NCBI
|
|
42
|
Yang H, Wei L, Xun Y, Yang A and You H:
BRD4: An emerging prospective therapeutic target in glioma. Mol
Ther Oncolytics. 21:1–14. 2021. View Article : Google Scholar : PubMed/NCBI
|