Introduction
Primary liver cancer is the sixth most common cancer
(4.7%) and the third most common cause of cancer-related death
(8.3%) in 2020 and hepatocellular carcinoma (HCC) comprises 75–85%
of cases (1). Due to the occult
onset and rapid progression of HCC, patients are often diagnosed at
an advanced stage, which severely limits treatment options
(2). Potentially curative therapies
(e.g. transplantation, resection, or ablation) are only suitable
for less than 30% of patients (3).
Sorafenib was the only approved tyrosine kinase inhibitor for
patients with unresectable HCC from 2007 to 2018. This drug blocks
the proliferation of tumor cells and inhibits angiogenesis by
suppressing the RAF/MEK/ERK pathway and inhibiting vascular
endothelial growth factor receptor 2/3 (VEGFR-2/3) and
platelet-derived growth factor receptor (2–4).
Sorafenib can prolong survival by three to five months according to
the SHARP phase III clinical trial (2,5,6,7).
Nevertheless, this effect is limited due to acquired drug
resistance (5,8).
A hypoxic tumor microenvironment, the
epithelial-mesenchymal transition (EMT), epigenetic regulation, and
ferroptosis are mechanisms of sorafenib resistance in HCC
inextricably linked to nuclear factor erythroid 2-related factor 2
(Nrf2) (5). According to a recent
study, sorafenib significantly induced Nrf2 protein expression, but
not its mRNA expression (6). At
present, the most studied mechanism is ferroptosis. Ferroptosis
involves generation of iron-dependent accumulation of lipid
reactive oxygen species (ROS), which can be regulated by cystine
glutamate reverse transporter (systemxc-) and
glutathione peroxidase 4 (GPX4) (6). Systemxc- transports the
extracellular cystine to the inside of the cell, and then converts
it into cysteine to synthesize the antioxidant glutathione (GSH).
Under normal conditions, GPX4 prevents ferroptosis by inhibiting
the accumulation of lipid peroxides in cells. When GPX4 is
inhibited, it can lead to the accumulation of ROS in cells, thus
inducing ferroptosis. GSH is an indispensable cofactor in its
activation process. Sorafenib inhibits systemxc-, which
leads to the accumulation of ROS in the cell, thus triggering
ferroptosis (9). In previous
studies, the expression of Nrf2 increased in response to cell
oxidative stress and the accumulation of ROS (10), which reduced tumor cells ferroptosis
and caused sorafenib resistance. As certain ABC transporters are
downstream proteins, the absence of Nrf2 also increases sorafenib
sensitivity (8,10–13).
Cancer stem cells, which mediate the formation and growth of tumor
tissue and the intrinsic resistance to chemotherapy drugs, highly
express Nrf2 (8,10,14–16).
Nrf2 also upregulates the expression of Bcl-2 and Bcl-Xl, which
encode two antiapoptotic factors (11–13,17).
These studies also highlight the importance of Nrf2 in sorafenib
resistance.
Nrf2 is encoded by the erythroid 2-like 2 (NFE2L2)
gene (18–23). Under normal circumstances,
Kelch-like ECH-associated protein (Keap1) binds Nrf2, leading to
its proteasomal degradation in the cytoplasm (6,18–22,24).
During oxidative stress, electrophiles and ROS react with Keap1,
dissociating it from Nrf2, which translocates to the nucleus and
activates antioxidant response elements (ARE). ARE-mediated
cytoprotective proteins include antioxidant enzymes, stress
response proteins, metal-binding proteins, drug-metabolizing
enzymes and drug transporters (22). Carcinogenesis is also a newly
defined function of Nrf2 (18,19,22).
Nrf2 activation can protect cells against chemicals that cause
cancer for a limited period; however, constant hyperactivation of
Nrf2 is frequently observed in HCC and is related to poor outcome
(25–27).
Camptothecin (CPT) is a natural alkaloid that is an
effective antitumor agent. It binds to DNA topoisomerase I to
suppress DNA replication (10,26,28).
Previous studies by the authors confirmed that CPT is an Nrf2
inhibitor that is effective at lower concentrations, which reduces
drug toxicity (10,26). CPT can be combined with anticancer
drugs that increase the level of Nrf2 to treat HCC (10). Based on the aforementioned studies,
it was hypothesized that CPT could improve the sensitivity of HCC
to sorafenib by inhibiting the NRF2-ARE pathway. In the present
study, two liver tumor models (H22 and VX2) were generated to test
this hypothesis by comparing the tumor response and Nrf2 protein
levels of sorafenib monotherapy and the combined treatment of CPT
and sorafenib.
Materials and methods
H22 HCC model
All animal experiments were performed according to
the ARRIVE guidelines approved (approval no. S0007) by the Animal
Care and Use Committee of the First Hospital of Shandong First
Medical University (Jinan, China). Male BALB/c mice (4–6 weeks old,
20–23 g) were divided into two batches (n=20/batch), maintained
under standard animal housing conditions with room temperature,
adequate air, a 12/12-h light/dark cycle and were allowed access
ad libitum to sterilized water and chow diet. H22 cells
(1×10⁶/200 µl normal saline.) were inoculated
subcutaneously into the mice. When the tumors reached the size of a
soybean grain, the mice underwent magnetic resonance imaging (MRI)
to measure the maximum cross sections, activity, and
microcirculation perfusion of the tumors. A total of 16 mice with
similar tumor sizes were selected from each batch and divided into
four treatment groups: control (CTR) group (normal saline), CPT
group (1 mg/kg CPT), sorafenib (SOR) group (50 mg/kg sorafenib),
and combined (COM) group (1 mg/kg CPT + 50 mg/kg sorafenib). CPT
was administered by intraperitoneal injection every three days, and
sorafenib was administered daily by gavage. The first
administration of drugs was conducted on the second day after MRI.
A second MRI was performed 18 days later. A total of 40 mice model
were established in the experiment, of which 32 were qualified for
inclusion, 8 were not included in the group and euthanized by
injection of pentobarbital sodium. A total of 32 mice survived to
the end of the experiment in a favorable state and were euthanized
by injection of pentobarbital sodium. The method of euthanasia of
mice was 2% pentobarbital sodium slowly intraperitoneally injected
to death. Finally, the tumors were isolated after euthanasia of
mice, and the mice were weighed following tumor removal. The tumor
volume, MRI data and body weights were analyzed to determine the
tumor response and detect drug toxicity. The analysis was performed
using GraphPad Prism software (version 8; GraphPad Software,
Inc.).
VX2 liver tumor model
To generate tumor pieces for implantation into
experimental rabbits, VX2 tumor pieces were implanted
intramuscularly into the hind limbs of young rabbits. After two
weeks, the tumors were resected and milled. Using ultrasound
guidance, 1 mm3 VX2 tumor tissue was implanted in the
left lobe of the livers of forty male New Zealand white rabbits
(3.0-3.5 kg) at a depth of 1.5 cm. After 14 days, MRI was performed
to measure tumor activity and to select 32 rabbits with similar
tumor sizes. The rabbits were randomly divided into four groups
(n=8): CTR group (normal saline), CPT group (3 mg/kg CPT), SOR
group [transcatheter arterial embolization (TAE), 3 mg/kg
sorafenib], and COM groups (1 mg/kg CPT + 3 mg/kg sorafenib, TAE).
TAE was performed under digital subtraction angiography guidance.
Lipiodol (0.1-0.5 ml) and sorafenib were injected into the
tumor-feeding arteries. CPT was administered by intraperitoneal
injection every three days. MRI was performed again nine days after
the first treatment. A total of 36 rabbit models were established
in the experiment, of which 32 were qualified for inclusion, 4 were
not included in the group and euthanized by injection of
pentobarbital sodium. A total of 36 rabbits survived to the end of
the experiment in a favorable state and were euthanized by
injection of pentobarbital sodium. The method of euthanasia of
rabbits was 3% pentobarbital sodium slowly intraperitoneally
injected to death. Next, the tumors were resected after euthanasia
of rabbits, and tumor-free rabbits were weighed. The MRI data, and
the weight of tumor-free rabbits were analyzed by GraphPad Prism
software and used to represent the tumor response and detect the
drug toxicity.
Rabbits and mice were provided by Beijing Weitong
Lihua Company. HCC and VX2 tumors are provided by the laboratory of
Qianfo Mountain Hospital. All animal welfare was taken into
consideration, including efforts to minimize suffering and
distress, use of analgesics or anesthetics, or special housing
conditions. The duration of the experiment of the H22 mice model
was 32 days. The duration of the experiment of the VX2 rabbit
models was 37 days. When the goal of the experiment was completed,
the animals were treated in a scientific and humane way so as to
minimize the panic and pain of the animals and being subjected to
euthanasia gently and quickly. Through the observation of
respiratory and heartbeat cessation, pupil, nerve reflex and other
indicators, a comprehensive judgment on death was determined,
confirming that the experimental animal had succumbed.
Magnetic resonance imaging
Mice
MRI included T2-weighted imaging (T2WI), and
intravoxel incoherent motion (IVIM) (GE, 3.0T MR scanner, mouse
coil). The T2WI sequence was performed using a repetition time (TR)
of 2,200 ms, echo time (TE) of 102.0 ms, slice thickness of 1.5 mm,
and a NEX of 2.0. The IVIM sequence was performed using a TR of
2,000 ms, a minimum TE, a slice thickness of 1.0 mm, and b=0, 50,
100, 150, 200, 400, 600, 800, 1,000 and 1,200 s/mm2. All
images were sent to a workstation for post-processing. The largest
cross-sections of the tumors were marked and used to assess tumor
growth, and the Standard apparent diffusion coefficient (Standard
ADC, representing an average diffusion value), diffusion
coefficient (D, reflecting the diffusion of pure water molecules),
pseudo-diffusion coefficient (D*, reflecting the microcirculation
perfusion), and perfusion fraction (f, defined as the ratio between
the perfusion of local microcirculation and diffusion in overall)
in these areas were also determined. Changes in the ADC (∆ADC), D
(∆D), D* (∆D*), and f (∆f) were calculated by subtracting the
preoperative values from the postoperative values and used to
assess the changes of tumor activity and microcirculation perfusion
after treatment.
Rabbits
MRI included T2WI and diffusion-weighted imaging
(DWI) scans (GE, 3.0T MR scanner, Knee coil). The T2 sequence
consisted of a TR of 5,200 ms, TE of 88.7 ms, slice thickness of 2
mm and a NEX of 2.0. The DWI sequence was performed using a TR of
4,500 ms, a TE of 81.6 ms, a slice thickness of 2 mm, a NEX of 2.0,
and b=0, 800 s/mm2. Post-processing was performed after
the images were transmitted to the workstation. The largest
cross-sections of the tumors were marked, and the ADC values
(representing an average diffusion value) within the areas were
measured. The changes in ADC (∆ADC, postoperative ADC-preoperative
ADC) were calculated to assess the changes of tumor activity after
treatment.
Haematoxylin and eosin (H&E)
staining
The lungs, livers and kidneys from H22 and VX2
tumor-bearing animals were fixed in polyformaldehyde (4%) and
embedded in paraffin wax at room temperature. Sections of 4-µm
thickness were cut, mounted on charged glass slides and then
stained with haematoxylin and eosin at room temperature. Briefly,
hematoxylin was added to the sections for 10 min. Then, 1% acid
ethanol reagent was used to differentiate for 1 min. Then, the blue
returning liquid promoted the nucleus to return blue, and then the
eosin solution was incubated with sections for 3 min. Finally, the
sections were dehydrated and fixed with neutral balsam. The image
was collected under the optical microscope.
Immunohistochemical (IHC)
staining
The reagents and steps for tissue fixation, paraffin
embedding and sectioning were as H&E staining. Paraffin
sections (4-µm) of H22 and VX2 tumors were deparaffinized with
xylene and rehydrated with descending ethanol series. Sections were
blocked with BSA at 37°C for 30 min and covered with antibody
against Nrf2 (1:2,000; cat. no. GB113808), VEGFA (1:500; cat. no.
GB14165), hypoxia-inducible factor-1α (HIF-1α) (1:1,000; cat. no.
APR07746G), N-cadherin (1:1,500; cat. no. GB111273) and Snail
(1:800; cat. no. GB11260) at 4°C, overnight. Antibodies against
Nrf2, VEGFA, N-cadherin, Snail were obtained from Wuhan Servicebio
Technology Co., Ltd. Antibodies against HIF-1α were obtained from
Santa Cruz Biotechnology, Inc. Then, the sections were incubated
with HRP-labeled Goat Anti-Rabbit IgG solution (cat. no.
G1213-100UL) and HRP-labeled Goat Anti-Mouse IgG solution (cat. no.
G1214-100UL; both from Wuhan Servicebio Technology Co., Ltd.) at
dilutions of 1:200 at 37°C for 30 min, and then were added with DAB
substrate. Nuclei were counterstained with haematoxylin. The image
was collected under the optical microscope. Staining was visualized
using Image-Pro Plus 6 software (Media Cybernetics, Inc.), and the
integrated optical density/Area values were used to determine
protein expression levels in the tumors.
Western blotting (WB)
The H22 and VX2 tumors were smashed in the RIPA
(Wuhan Servicebio Technology Co., Ltd.) buffer with 1 mM PMSF on
ice and then centrifuged as previously described (26). Bicinchoninic acid (BCA) was used to
determinate protein concentration. Protein samples (15 µg samples
per lane) were loaded into 30% SDS-PAGE gels and transferred to
PVDF membranes. The membranes were blocked with 3% BSA at room
temperature for 1 h and incubated at 4°C overnight with the
following primary antibodies (obtained from Wuhan Servicebio
Technology Co., Ltd.): Nrf2 (1:1,000), heme oxygenase-1 (HO-1)
(1:1,000; cat. no. GB12104), NAD(P)H quinone oxidoreductase 1
(NQO1) (1:500; cat. no. GB11282), N-cadherin (1:500) and Snail
(1:800). Then, the membranes were incubated with HRP-labeled Goat
Anti-Rabbit IgG solution and HRP-labeled Goat Anti-Mouse IgG
solution at dilutions of 1:5,000 at room temperature for 1 h.
Finally, membranes were covered with enhanced chemiluminescent
(ECL) substrate and scanned. ECL substrate was obtained from Merck
Millipore. Quantification of the results normalized to β-actin was
conducted using Image J software (version 1.8.0.345; National
Institutes of Health).
Serum biochemistry
The health and behavior of H22 mice model were
monitored every day after H22 cells were inoculated subcutaneously
into the mice. The health and behavior of VX2 rabbit models were
monitored in three days before operation and in day 1, 4, 7, 10,
13, 14 after operation. Blood was collected via the retro-orbital
sinus and was centrifuged at 4°C, 1,000 × g for 5 min. Aspartate
aminotransferase, alanine aminotransferase, blood urea nitrogen,
creatinine and total bilirubin levels were measured using an
automatic biochemical analyzer.
Statistical analysis
GraphPad Prism software was used to analyze all
experiments. Data are presented as the mean ± SD. Comparisons
between groups were performed using one-way ANOVA with Tukey's
multiple comparison test as post hoc. P<0.05 was considered to
indicate a statistically significant difference.
Results
CPT reverses sorafenib resistance by
inhibiting Nrf2-ARE activation
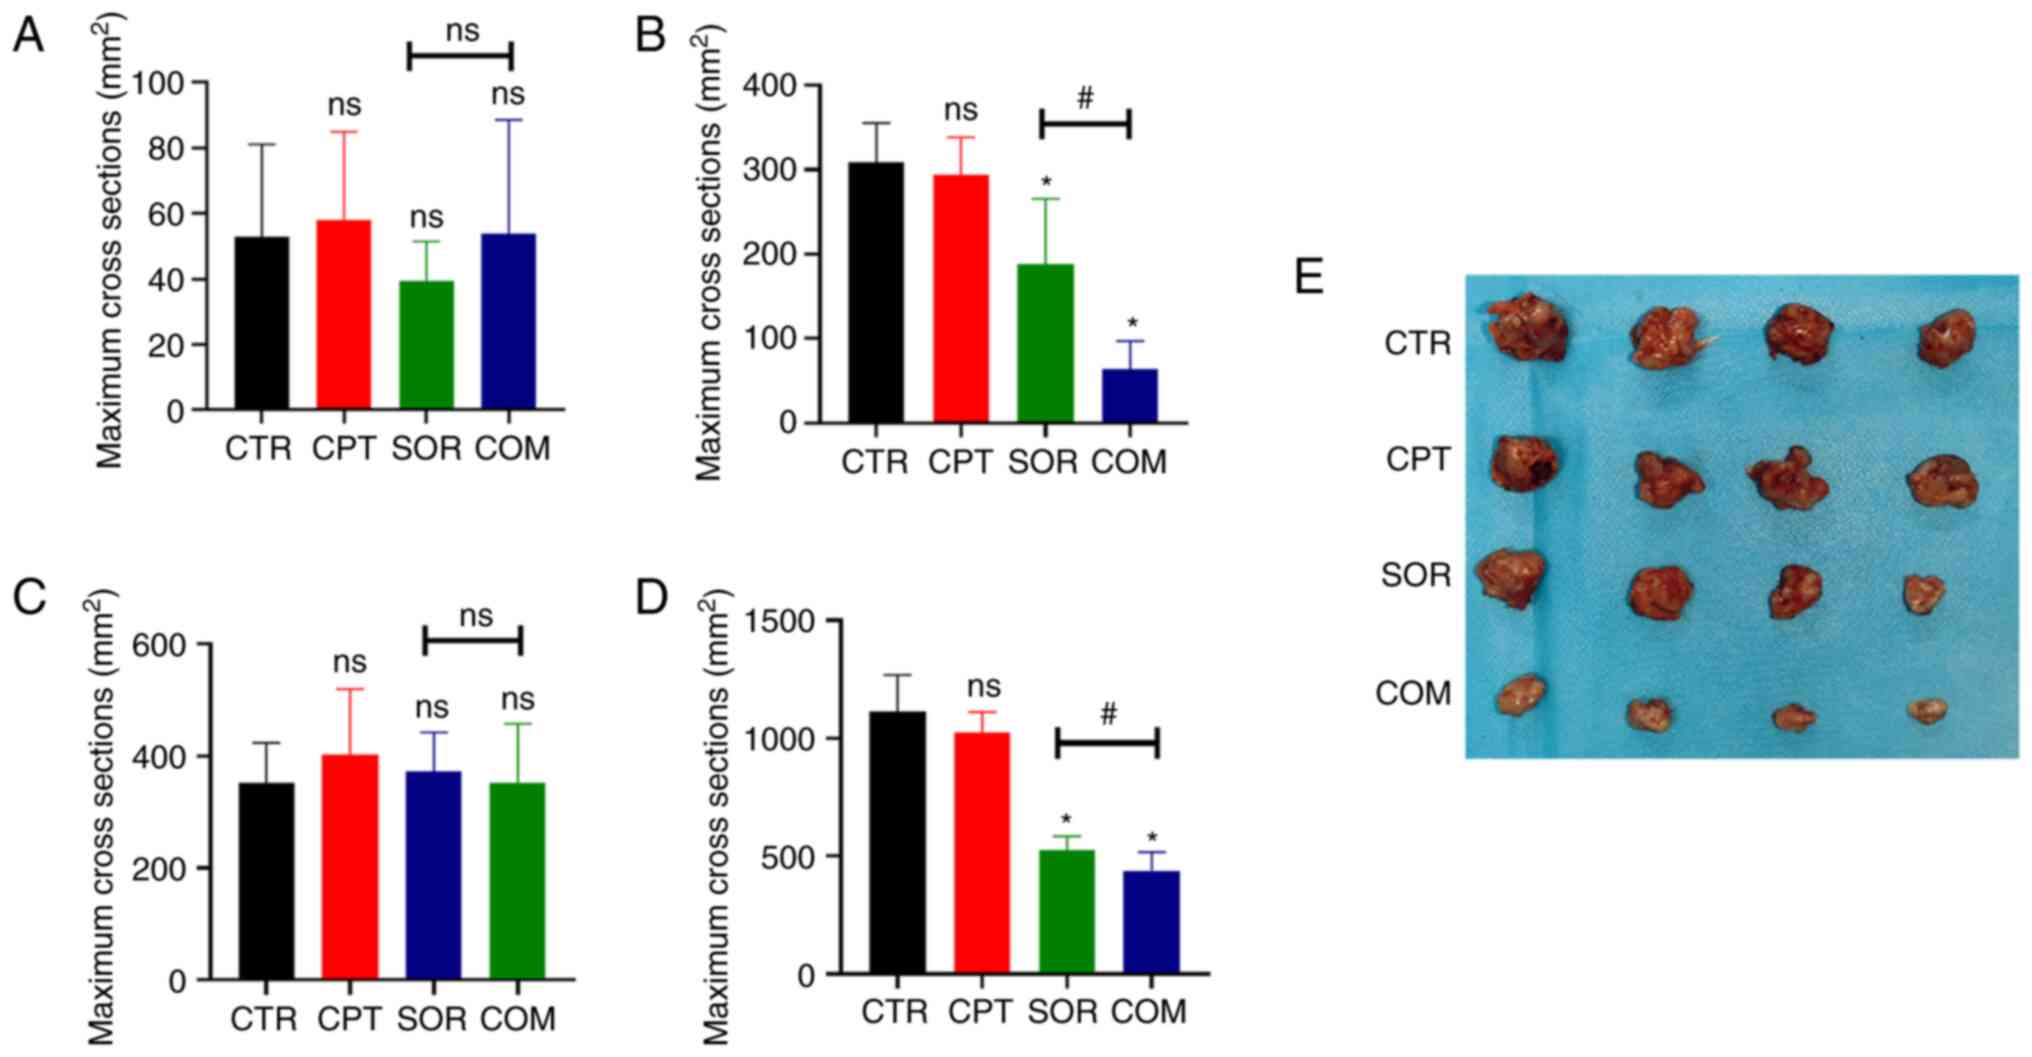
The effects of sorafenib alone or in combination
with CPT are presented in Fig. 1.
According to the T2WI images, the mean maximum H22 tumor cross
sections in the CTR, CPT, SOR, and COM groups before treatment were
52.88±26.45, 58.13±25.13, 39.50±11.8 and 53.75±32.60
mm2, respectively (P≥0.05) (Fig. 1A). After treatment, the maximum
cross sections were 308.5±43.98 mm2 (CTR), 294±41.64
mm2 (CPT), 187.75±73.03 (SOR) and 63.75±31.18
mm2 (COM). There was no significant difference between
the mean maximum cross sections of the CTR and CPT groups (P≥0.05).
By contrast, the differences between the CTR and SOR groups and the
SOR and COM groups were statistically significant (P<0.05)
(Fig. 1B). For the VX2 liver tumor
model, the mean maximum tumor cross sections before treatment were
352.38±75.67 mm2 (CTR), 401.88±117.80 mm2
(CPT), 372.88±69.39 mm2 (SOR) and 352.75±104.81
mm2 (COM) (P≥0.05) (Fig.
1C). After treatment, the mean maximum VX2 cross sections were
1,112.13±145.35 mm2 (CTR), 1,022.38±82.03 mm2
(CPT), 524.13±56.55 mm2 (SOR) and 438.50±72.97
mm2 (COM). The differences of the mean maximum cross
sections of the VX2 tumors in the CTR and SOR groups and the SOR
and COM groups reached statistical significance (P<0.05)
(Fig. 1D). The size of tumors of
H22 models is presented in Fig.
1E.
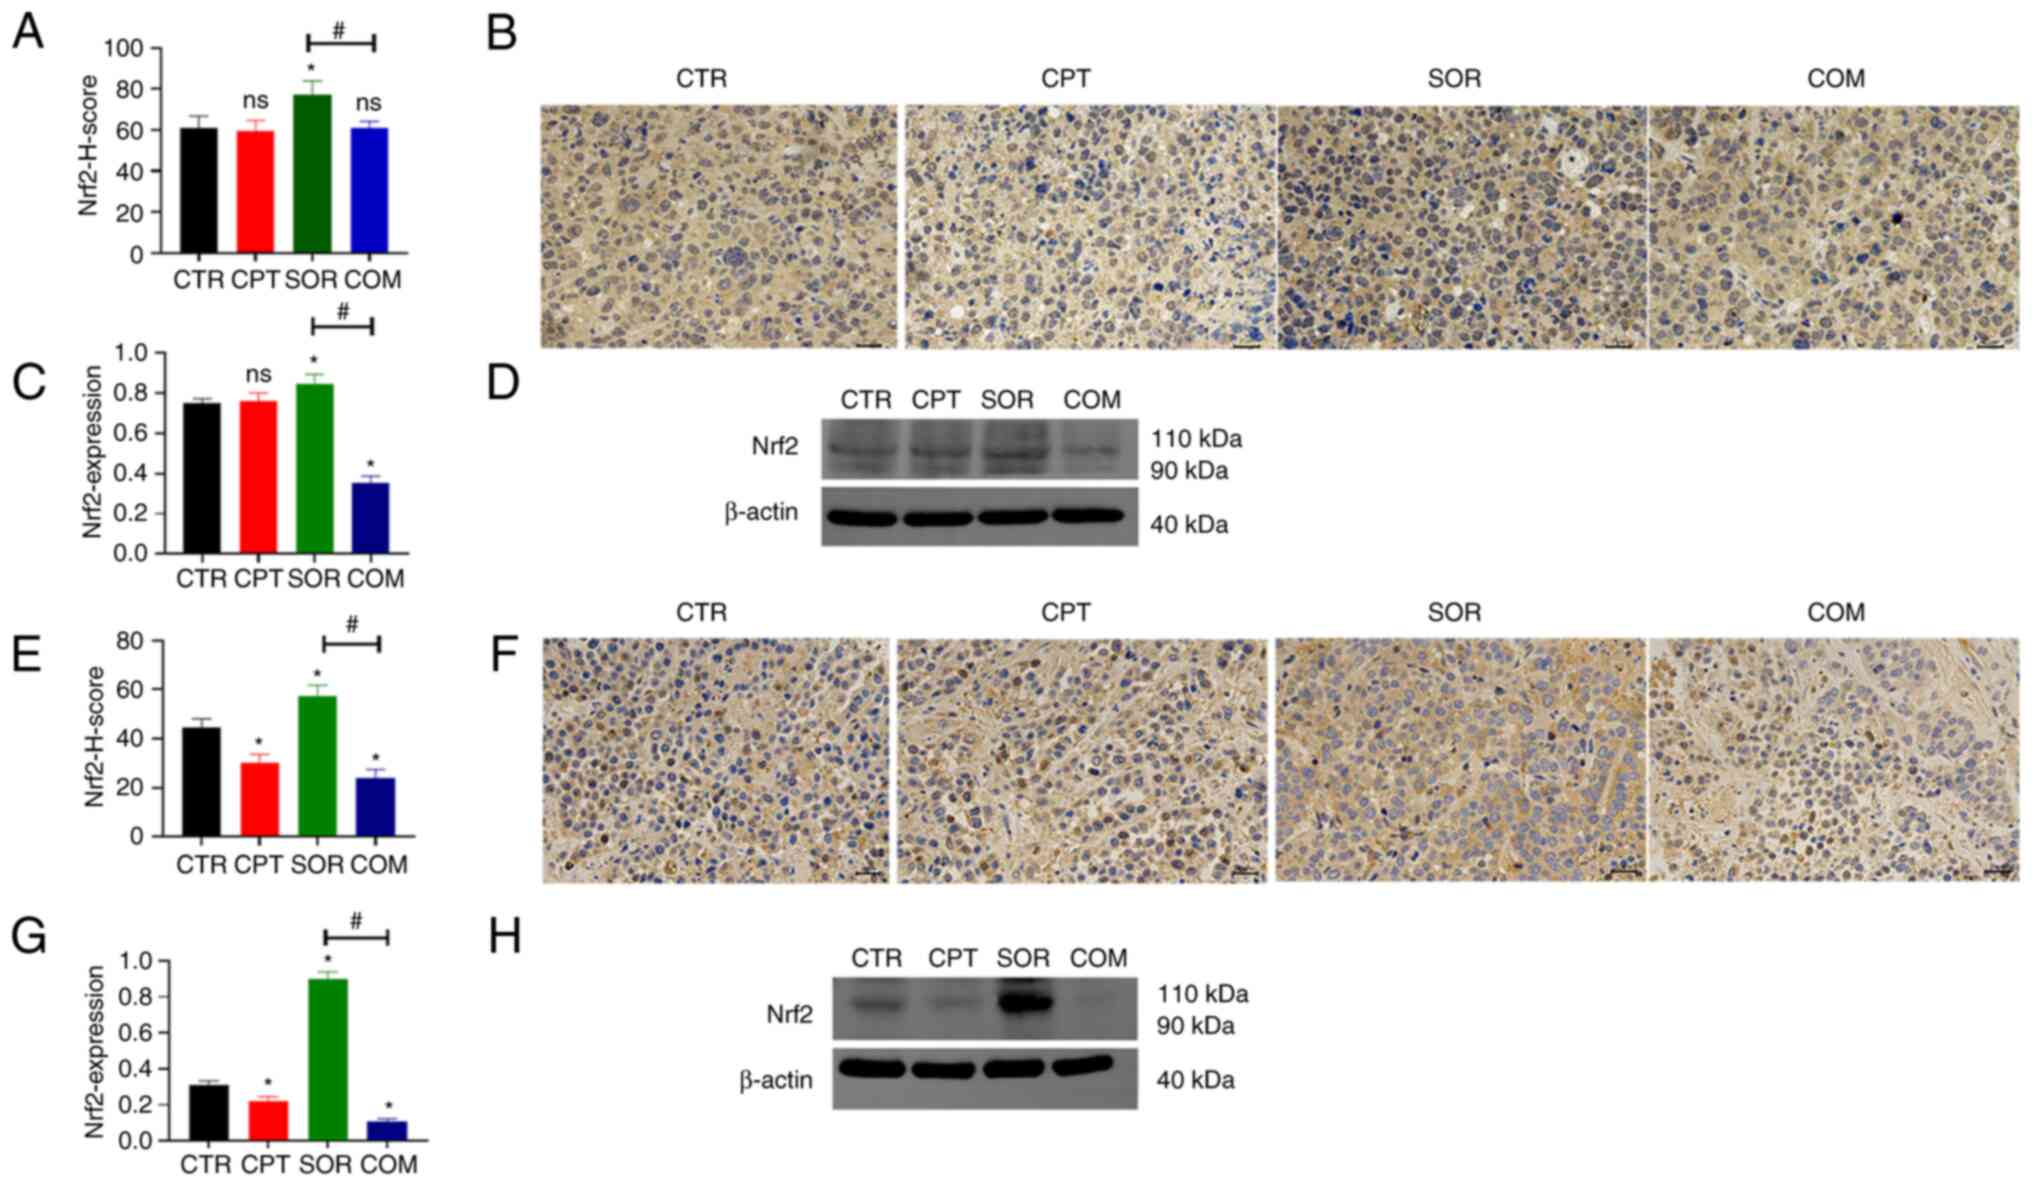
There was no significant difference in the Nrf2
levels in H22 tumors from mice treated with CTR or CPT (P≥0.05).
IHC staining showed that the Nrf2 protein was slightly reduced in
the CPT group (Fig. 2A and B), but
WB showed an increase (Fig. 2C and
D). However, sorafenib treatment significantly increased Nrf2
levels compared with the CTR group. This effect was significantly
reduced by CPT (COM group) (P<0.05). IHC and WB generated
similar results (Fig. 2A-D). In the
VX2 liver model, CPT monotherapy caused a slight reduction in the
Nrf2 levels in the tumors compared with the CTR group (P<0.05).
Similar to the H22 model, sorafenib alone induced Nrf2 protein
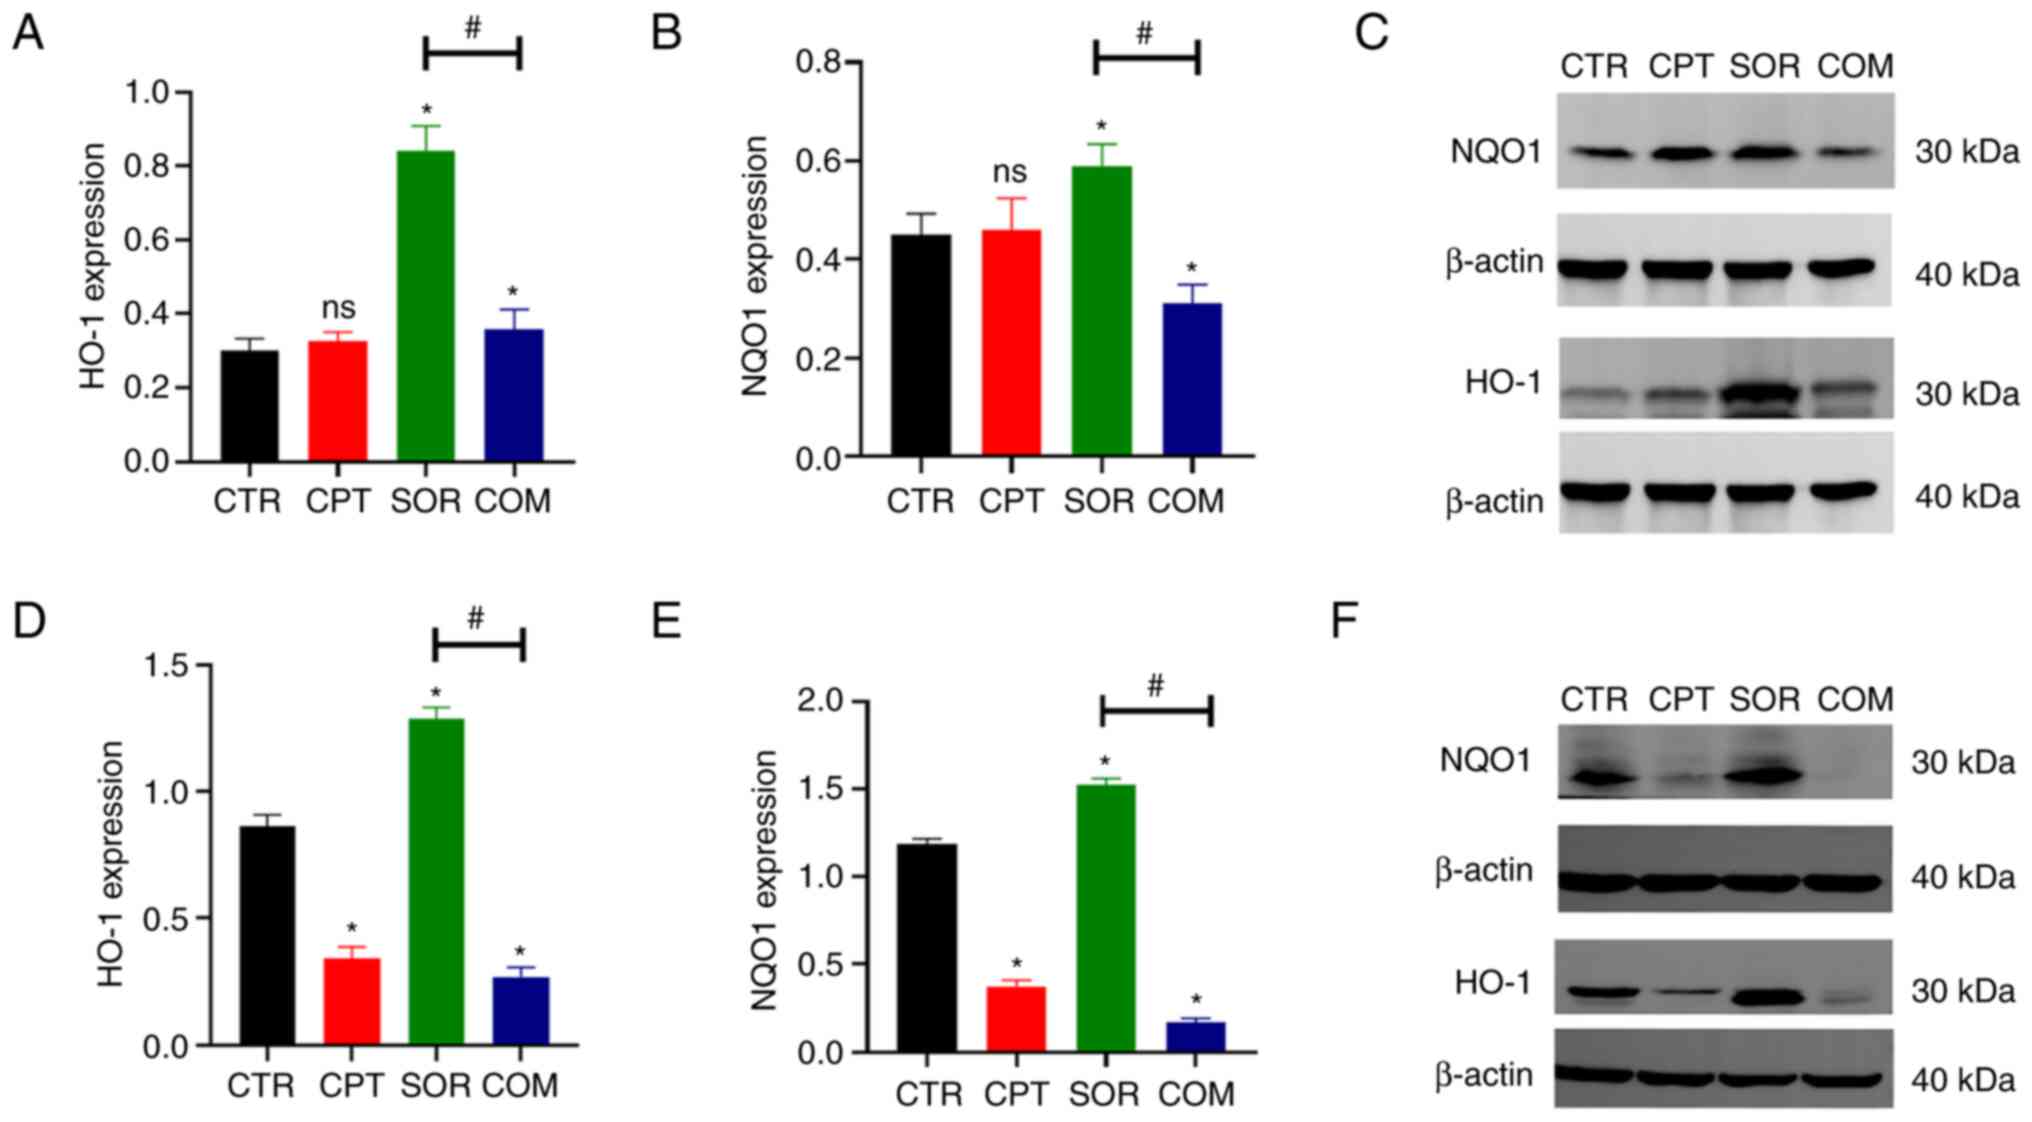
expression, which was abrogated by combining with CPT (Fig. 2E-H). Furthermore, WB revealed that
proteins downstream of Nrf2 (HO-1 and NQO1) changed in a similar
manner (Fig. 3).
CPT reverses sorafenib resistance by
inhibiting EMT
H&E staining of mouse tissues confirmed there
were no obvious metastatic lesions in the lung, liver, or kidney.
By contrast, there were obvious metastatic lesions in the lungs of
VX2 tumor-bearing animals. The most metastatic lesions were
observed in the SOR group, followed by the CTR and CPT groups. The
least number of metastases were found in the lungs collected from
rabbits in the COM group (Fig. 4A).
Therefore, the EMT indexes of the VX2 tumors were examined. Based
on IHC and WB, the EMT indexes (Snail and N-cadherin) were lower in
the COM group than in the SOR group; these indexes in the SOR group
were significantly higher than in the CTR group (P<0.05)
(Fig. 4B-I).
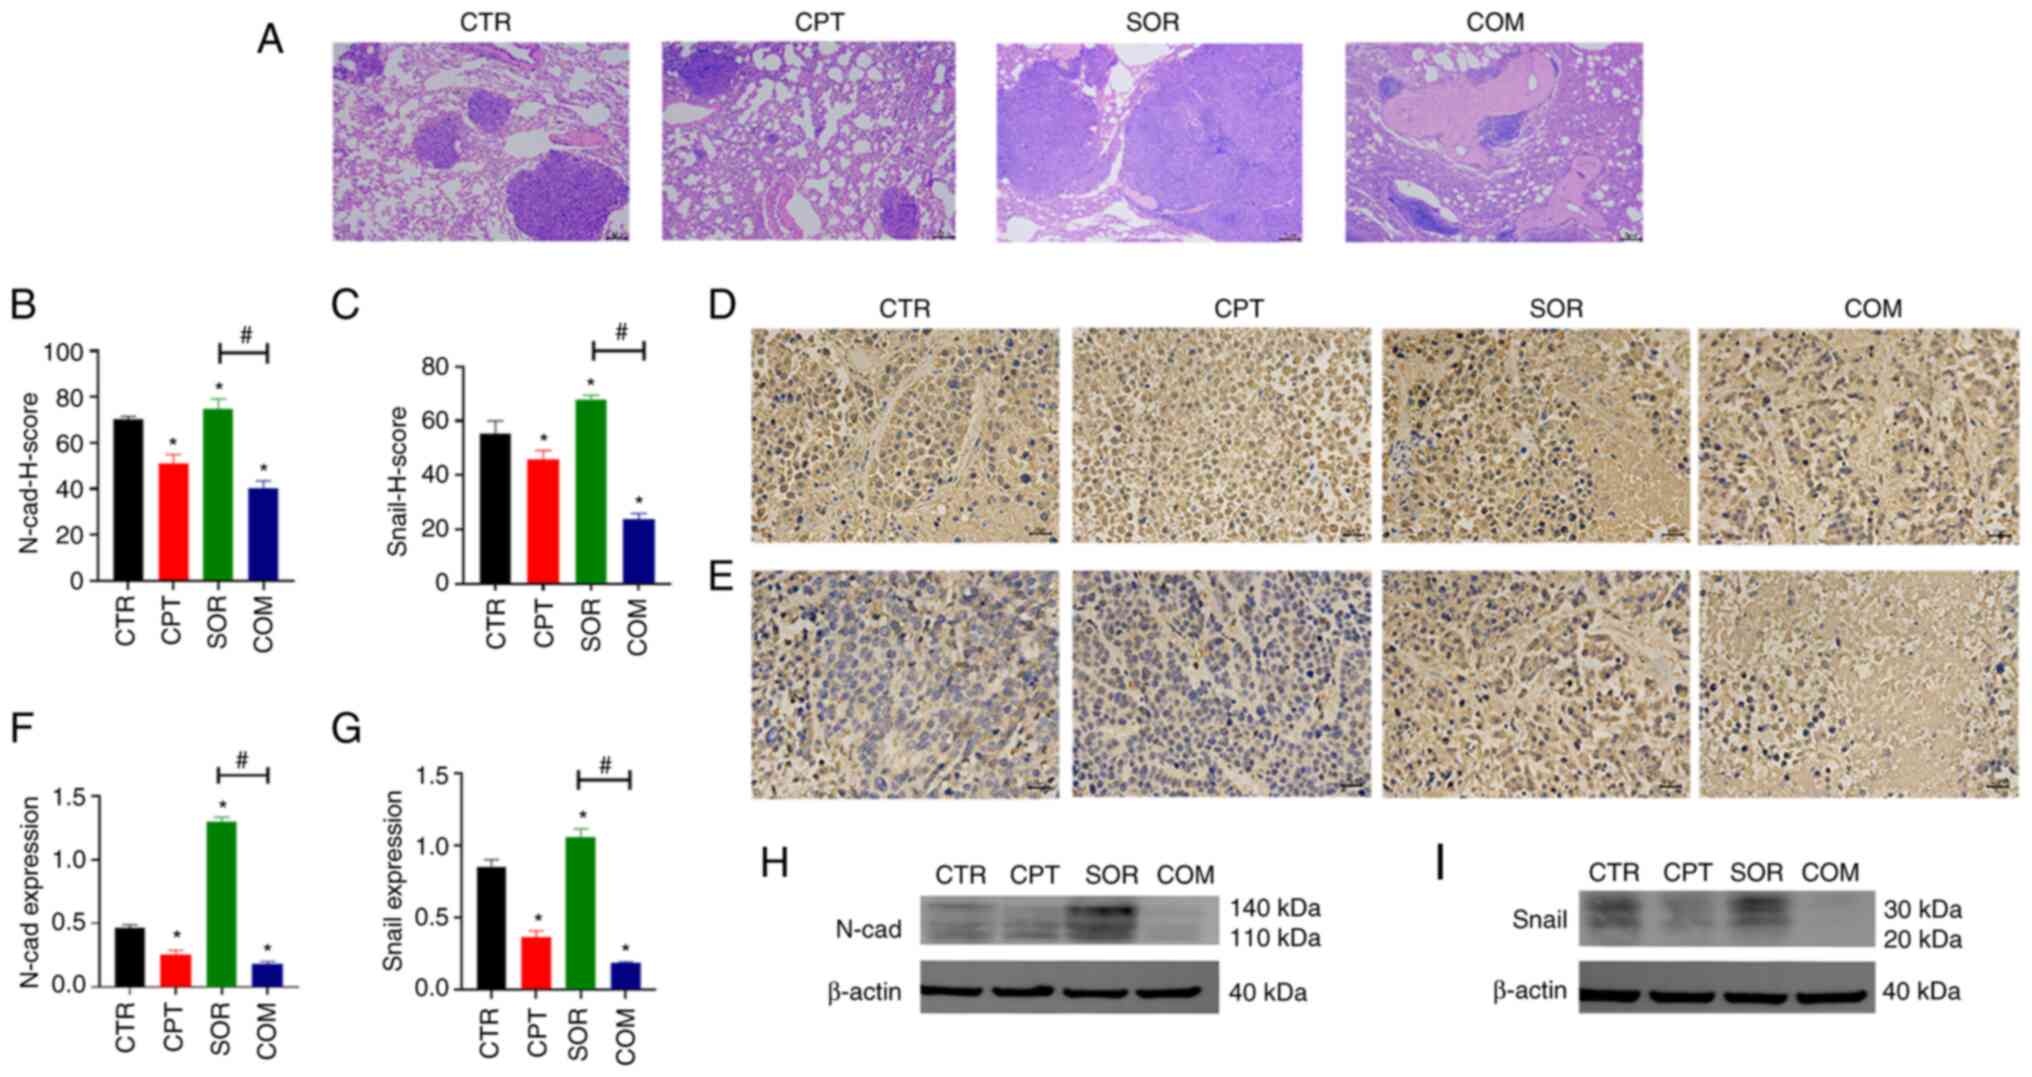 | Figure 4.CPT reverses sorafenib resistance by
inhibiting the process of EMT. (A) Pulmonary metastases observed by
H&E staining in VX2 models. Magnification, ×40; scale bars, 2
µm. (B-E) The expression of EMT indexes including N-cad and Snail
was determined by IHC staining in VX2 models. Magnification, ×400;
scale bars, 20 µm. (F-I) The expression of N-cad and Snail
determined by WB in VX2 models; β-actin was the internal control.
Panels B, C, F and G demonstrate the statistical analysis for IHC
staining and WB (8 samples in each group). *P<0.05 and
#P<0.05. CPT, camptothecin; EMT,
epithelial-mesenchymal transition; H&E, haematoxylin and eosin;
N-cad, N-cadherin; IHC, immunohistochemical; WB, western blotting;
ns, no statistical significance. |
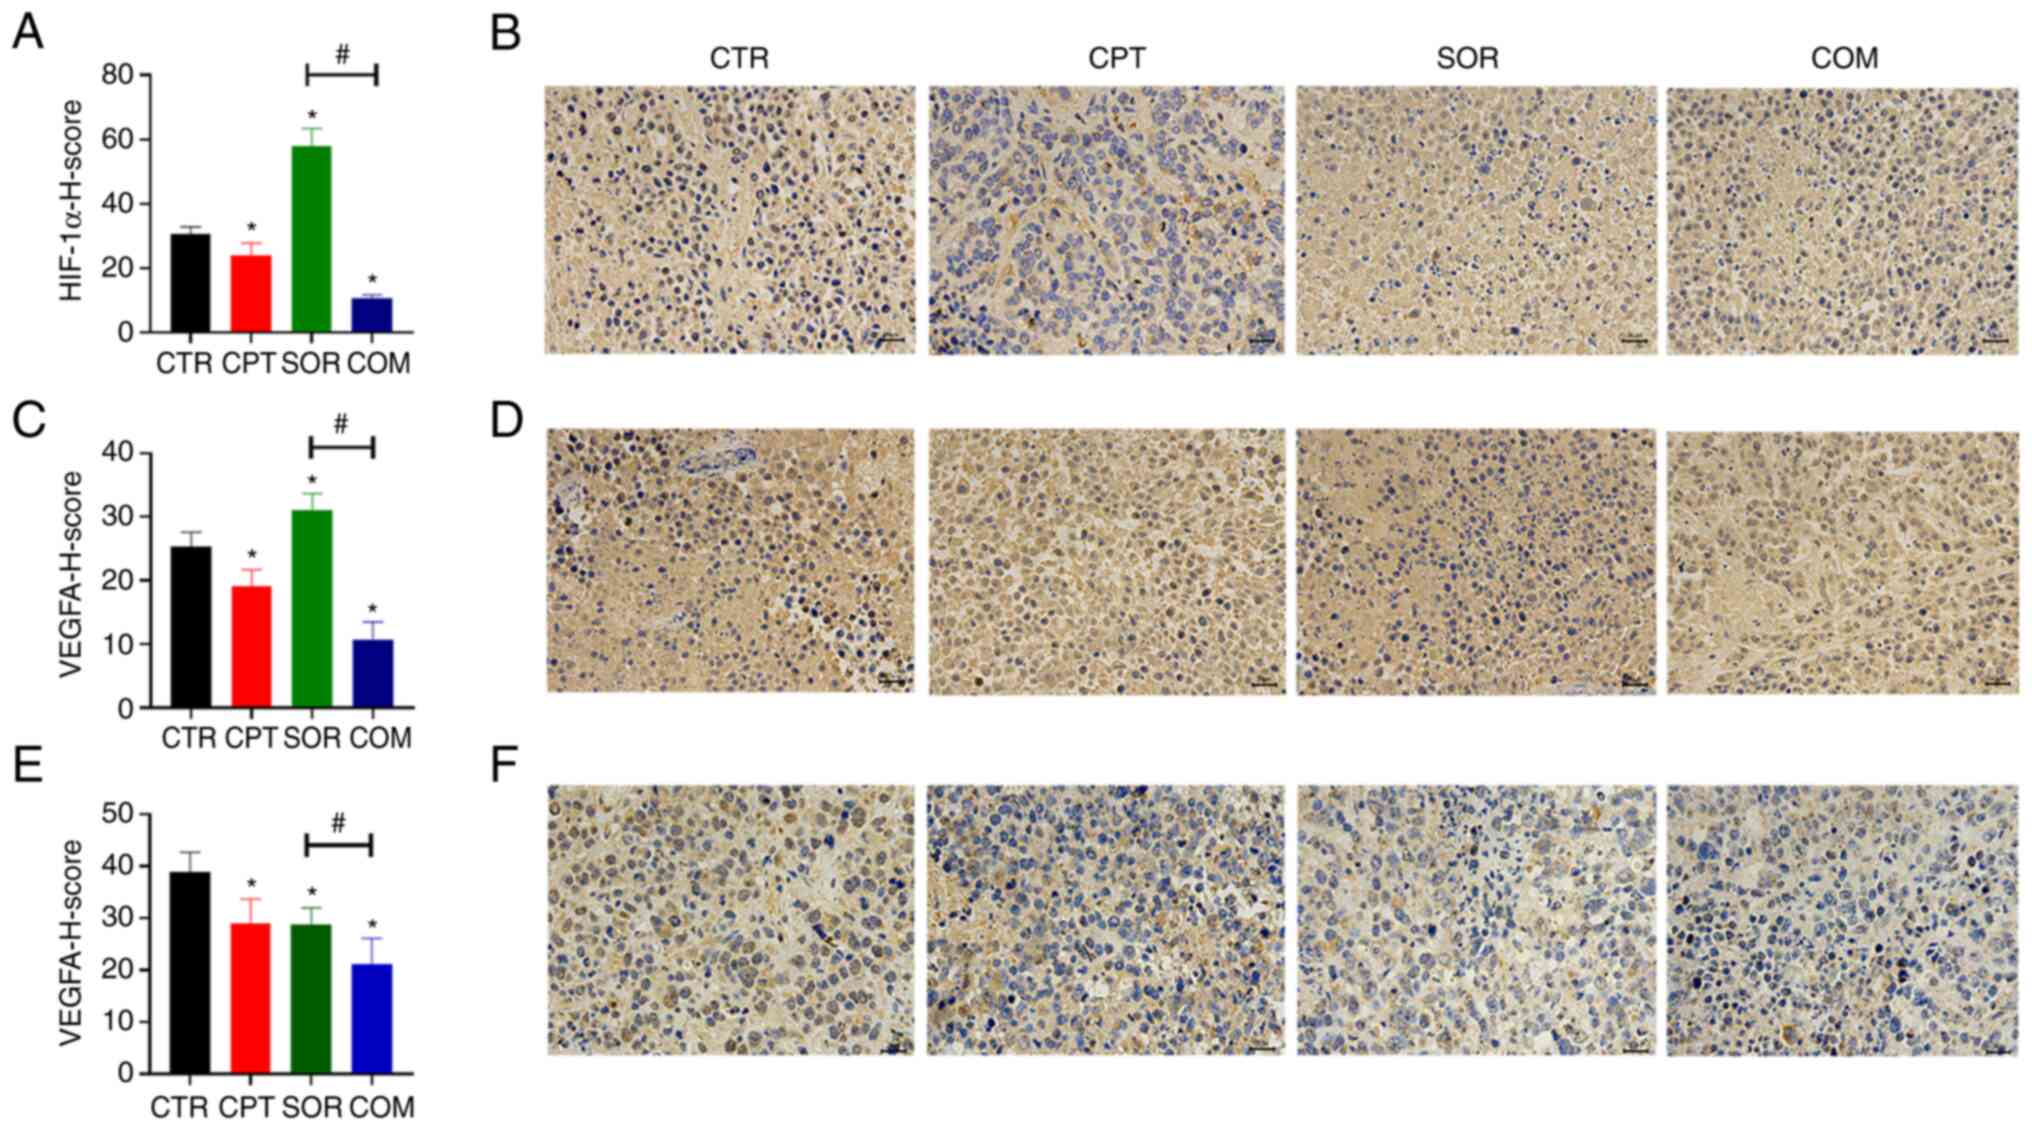
CPT combined with sorafenib inhibits
angiogenesis
For the VX2 model, the expression levels of HIF-1α
and VEGFA in the SOR group were higher than in the CTR and COM
groups (P<0.05) (Fig. 5A-D).
Moreover, the VEGFA levels in the H22 tumors harvested from mice in
the COM group were significantly lower than in the SOR group
(P<0.05) (Fig. 5E and F). MRI
analysis of H22 tumors before and after treatment revealed ΔD*
values of −86.25±334.41 (×10−5 mm2/s) for the
CTR group, −272.5±218.29 (×10−5 mm2/s) for
the CPT group, −240.25±274.89 (×10−5 mm2/s)
for the SOR group, and −381.25±206.22 (×10−5
mm2/s) for the COM group. The ΔD* of the SOR group was
slightly lower than that of the CTR group (P≥0.05) and slightly
higher than that of the COM group (P≥0.05) (Fig. 6A and B). The Δf values were
0.07±0.26 (CTR), 0.14±0.09 (CPT), −0.01±0.18 (SOR) and −0.18±0.14
(COM). The Δf of the SOR group was slightly lower than that of the
CTR group (P≥0.05) and slightly higher than that of the COM group
(P≥0.05) (Fig. 6C and D).
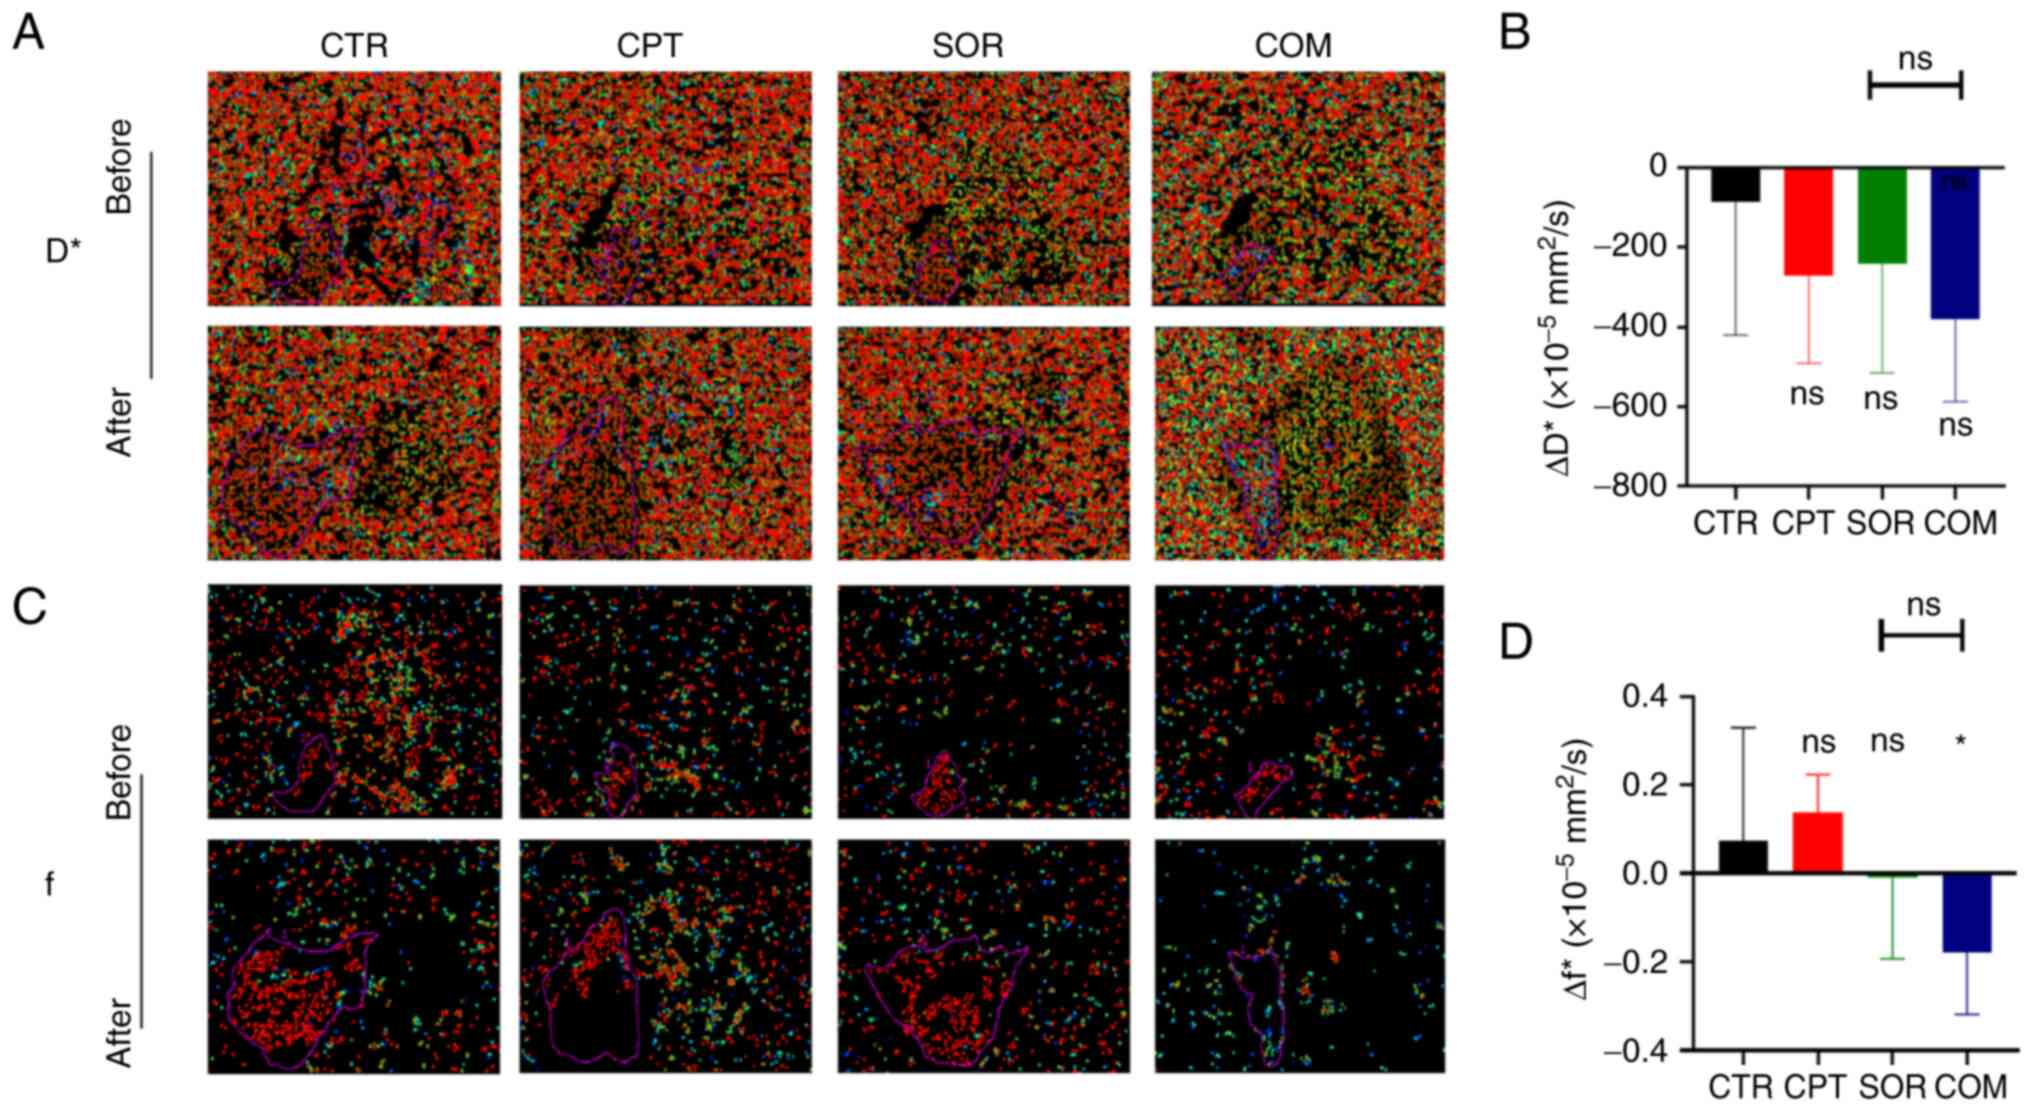 | Figure 6.CPT combined with sorafenib decreases
microcirculation perfusion. (A) D* values of CTR, CPT, SOR and COM
groups in H22 models before and after treatment. (B) ΔD* value was
calculated in four groups. (C) f values of four groups in H22
models before and after treatment. (D) Δf value was calculated in
four groups. The MRI images in panels A and C were enlarged
according to the same scale. *P<0.05. CPT, camptothecin; D*,
pseudo-diffusion coefficient; CTR, control; SOR, sorafenib; COM,
combined; ΔD*, postoperative D* - preoperative D*; f, perfusion
fraction; ∆f, postoperative f - preoperative f; ns, no statistical
significance. |
CPT combined with sorafenib reduces
tumor activity
The ΔStandard ADC for H22 tumors was −17.45±36.38
(×10−5 mm2/s) for the CTR group, −29.87±31.05
(×10−5 mm2/s) for the CPT group, 5.76±52.38
(×10−5 mm2/s) for the SOR group and
76.51±98.96 (×10−5 mm2/s) for the COM group.
Moreover, the Δ Standard ADC for the SOR group was slightly higher
than that of the CTR group (P≥0.05) and slightly lower than that of
the COM group (P≥0.05) (Fig. 7A and
B). The ΔD was −55.75±42.34 (×10−5 mm2/s)
for the CTR group, −39.62±46.48 (×10−5 mm2/s)
for the CPT group, −55.75±73.43 (×10−5 mm2/s)
for the SOR group and 47.25±36.41 (×10−5
mm2/s) for the COM group. The ΔD of the SOR group was
slightly lower than that of the COM group (P≥0.05) (Fig. 7C and D). In the VX2 model, ΔADC
showed statistically significant differences between the SOR and
CTR groups and the COM and SOR groups (P<0.05) (Fig. 7E and F).
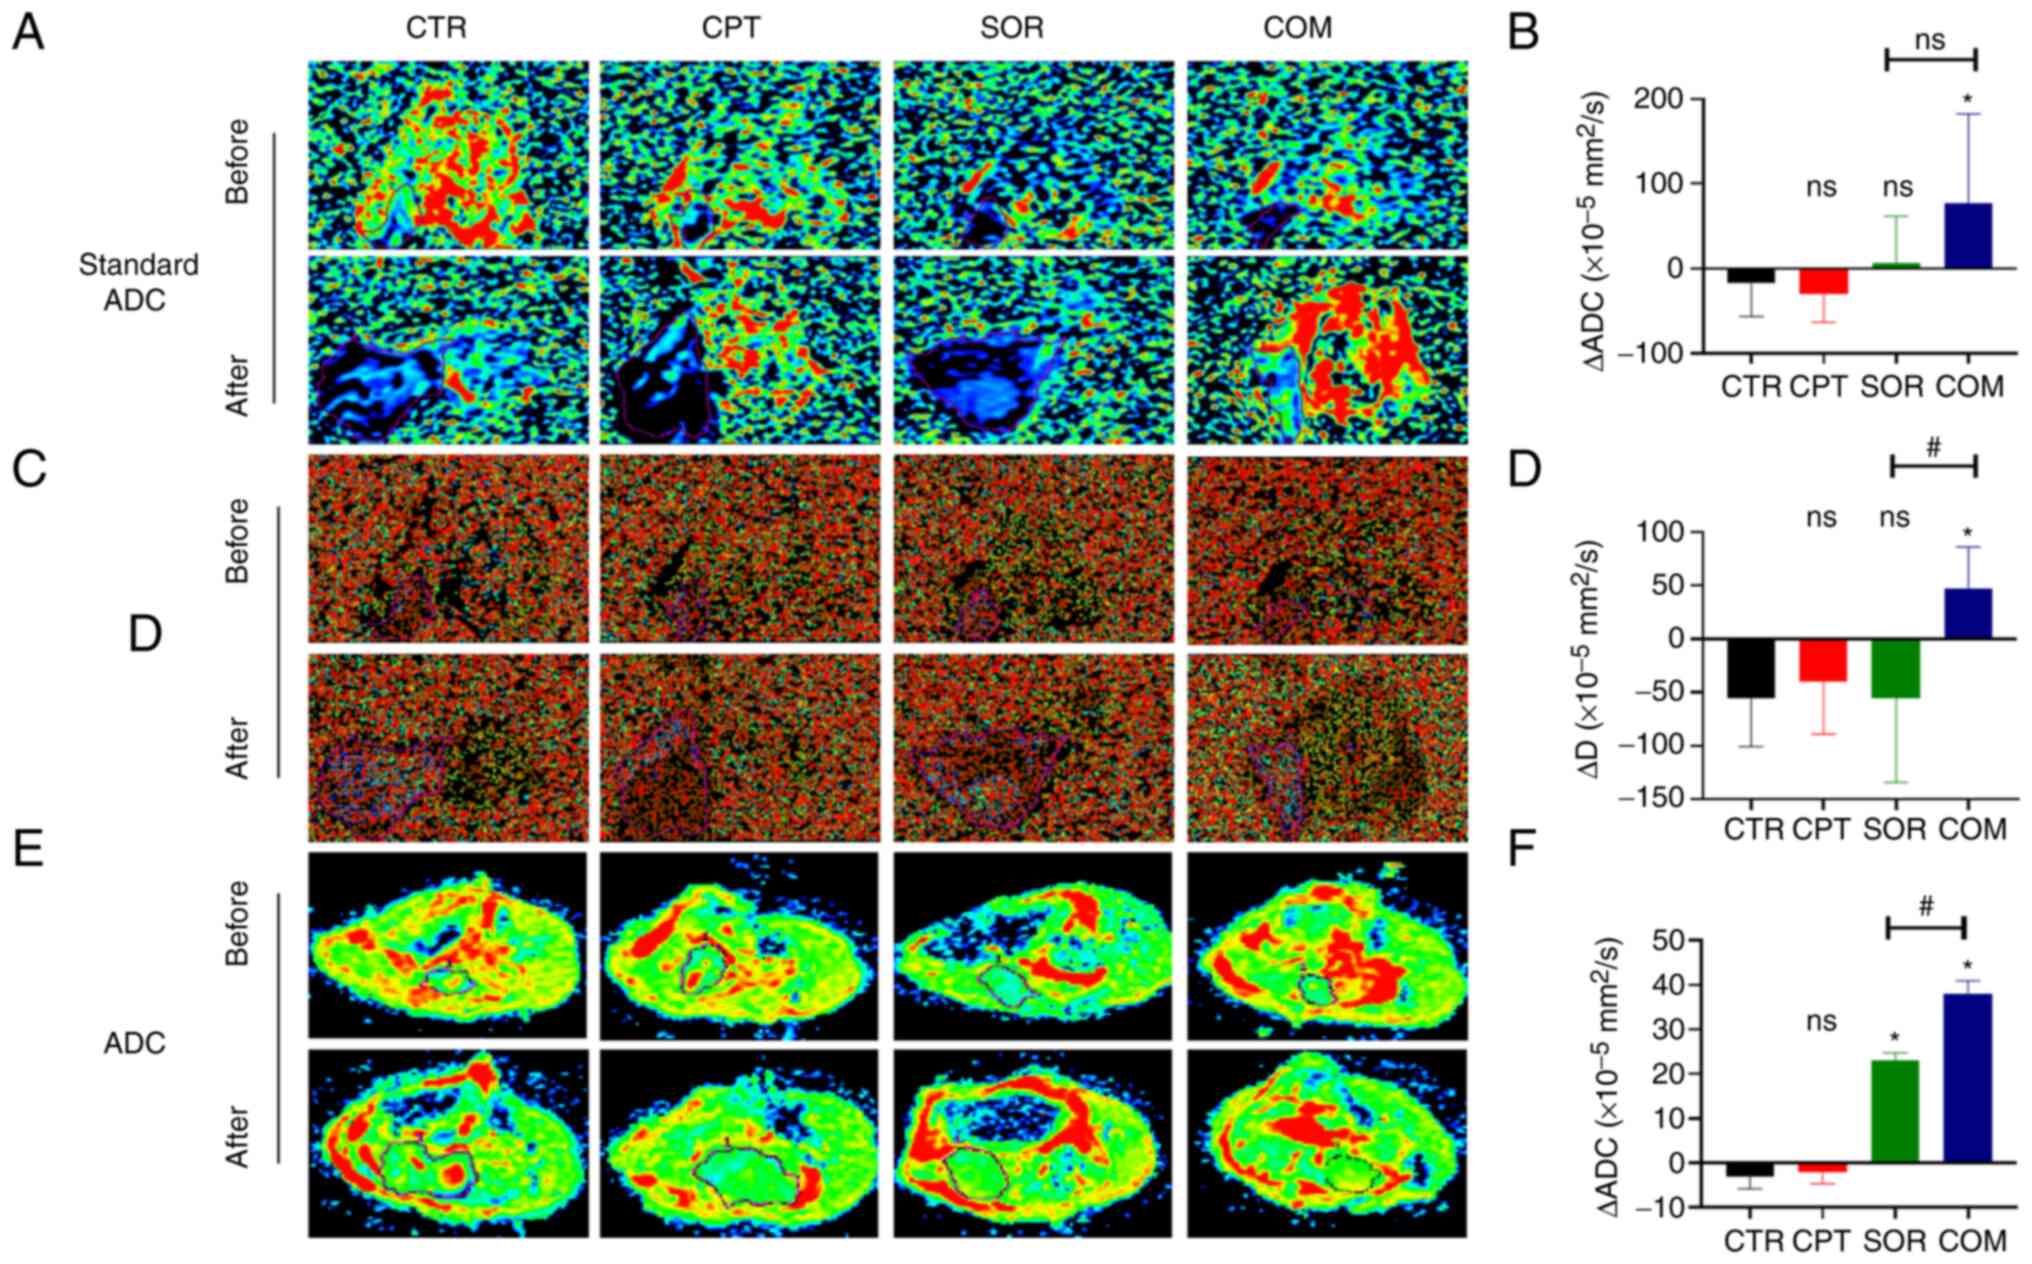 | Figure 7.CPT combined with sorafenib reduces
tumor activity. (A) Standard ADC values of CTR, CPT, SOR and COM
groups in H22 models before and after treatment. (B) Δ standard ADC
value was calculated in four groups. (C) D values of four groups in
H22 models before and after treatment. (D) ΔD value was calculated
in four groups. D and D* images were captured from the same samples
and they differed only in the settings of the imaging parameters.
(E) ADC values of four groups in VX2 models before and after
treatment. (F) ΔADC value was calculated in four groups. The MRI
images in panels A, C and E were enlarged according to the same
scale. *P<0.05 and #P<0.05. CPT, camptothecin;
Standard ADC/ADC, apparent diffusion coefficient; CTR, control;
SOR, sorafenib; COM, combined; Δ Standard ADC/ADC, postoperative
Standard ADC/ADC - preoperative Standard ADC/ADC; D, diffusion
coefficient; ΔD, postoperative D - preoperative D; ns, no
statistical significance. |
The safety and tolerability of the CPT
and sorafenib combination
After treatment and tumor resection, there were no
differences in the weights of the mice and rabbits among the four
treatment groups. The mouse body weights were 20.25±1.79 g (CTR),
18.75±0.83 g (CPT), 18.88±1.05 g (SOR) and 19.25±1.30 g (COM)
(P≥0.05) (Fig. S1A), and the
rabbit body weights of the four groups were 3.33±0.09 kg (CTR),
3.29±0.13 kg (CPT), 3.36±0.11 kg (SOR) and 3.33±0.12 kg (COM)
(P≥0.05) (Fig. S1B). Serum
analysis for the mice revealed that none of the treatments affected
liver or kidney function (Fig.
S1C-G). There was also no obvious damage in the liver or kidney
tissue by H&E staining.
Discussion
Sorafenib improves the survival of patients with
advanced HCC. Nevertheless, only ~30% of patients with HCC benefit
from sorafenib and usually acquire drug resistance within six
months (29). Sorafenib resistance
contributes to proliferation, migration and invasion (8). A previous study confirmed that
sorafenib-resistant cells had lower proliferation, migration and
invasion rates after Nrf2 knockdown (8). Keap1, a redox sensor protein
negatively regulating Nrf2, also enhances sorafenib sensitivity in
HCC (30). Therefore, the
inhibition of Nrf2 in tumors is vital to reversing sorafenib
resistance. Brusatol, retinoic acid receptor α agonists, luteolin,
and trigonelline are known Nrf2 inhibitors (31–34).
In a previous study by the authors (10), CPT was also identified as an
effective Nrf2 inhibitor among thousands of clinical drugs.
As an Nrf2 inhibitor, it was hypothesized that CPT
could enhance the efficacy of sorafenib. Thus, this hypothesis was
examined using two liver cancer models: the H22 murine HCC model
and the VX2 orthotopic rabbit liver tumor model. The results of the
present study indicated that the CPT-sorafenib combination therapy
inhibited tumor growth in the two models. Indeed, the tumors in the
COM group were significantly smaller than that in the SOR group.
Although the size of the tumors was decreased in the CPT group of
the H22-bearing mice compared with the CTR group, the changes were
not statistically significant. These data indicated that in this
model, CPT was acting as a sensitizer of sorafenib rather than a
chemotherapeutic agent. With the VX2 model, there was statistical
significance between the CPT and CTR groups. The possible reason
for the differences observed between the two models is that a
higher CPT dose was used with the VX2 model. The expression of Nrf2
was increased in the SOR group and was inhibited in the COM group
in both models, suggesting that CPT could modulate the effects of
SOR on Nrf2 levels in tumor tissue. Thus, a low CPT dose could
downregulate Nrf2 levels induced by sorafenib, and its combination
with sorafenib could control the growth of liver tumors. In the
present study, Nrf2 and its downstream proteins, HO-1 and NQO1,
were slightly higher in the CPT group than in the CTR group in the
H22 model; however, these changes did not reach statistical
significance. A previous study by the author showed that Nrf2
levels were low in tumor tissue without treatment, suggesting that
CPT alone would not significantly inhibit or even increase Nrf2
(10). By contrast, sorafenib
significantly increased Nrf2 protein in the current study. These
effects were abrogated when sorafenib was combined with CPT,
consistent with CPT being a modulator of Nrf2 activity.
The safety of CPT has been established, and it is
used clinically as a chemotherapeutic agent (35,36).
The CPT doses used in the present study (1 and 3 mg/kg) were lower
than the dose used in the clinic (8 mg/kg) (10). No significant changes in weight were
observed among the four treatment groups with either model and no
obvious damage to the liver and kidney, indicating that the drug
toxicity was within an acceptable range.
HO catalyze the decomposition of heme into carbon
monoxide (CO), free iron, and biliverdin (37). HO-1 is overexpressed in HCC. CO
mediates the antiapoptotic effects of HO-1, promoting tumor growth
(37). Furthermore, HO-1 can
regulate Nrf2-targeted ABC efflux transporters (8). NQO1 is an antioxidant related to the
detoxification of quinones and the reduction of iron-mediated ROS
that is upregulated by Nrf2 in response to sorafenib (6,18,20,38).
NQO1 reduces sorafenib-induced ferroptosis of HCC (39). In addition, NQO1 overexpression
could detoxify antitumor drugs, favoring multidrug resistance
(11). The present study
demonstrated that sorafenib significantly increased HO-1 and NQO1
proteins and these effects were abrogated when sorafenib was
combined with CPT, consistent with Nrf2 nuclear translocation and
Nrf2-ARE activation.
EMT is the biological process for tumor cell
migration and invasion (26,40,41).
Changing a cell phenotype from epithelial to mesenchymal is the
main characteristic of EMT (40–42).
The core regulators of EMT, including N-cadherin and Snail, are
regulated by Nrf2 (26,40,41,43–45).
N-cadherin promotes neovascularization and adhesion between tumor
cells and mesenchymal cells (43).
Snail regulates E-cadherin expression during EMT (43) and can also promote chemoresistance
by upregulating the ABC transporter ABCB1 in HCC cells (46). Previous studies identified EMT
characteristics in sorafenib-resistant HCC cells, including the
activation of the mesenchymal markers N-cadherin and Snail
(46–51). A previous study revealed that EMT
was inhibited after Nrf2 downregulation by CPT (26). In the current study, sorafenib + TAE
treatment significantly increased N-cadherin and Snail levels in
the VX2 tumors, which promotes EMT and drug resistance. The
addition of CPT to the treatment decreased the EMT markers, which
may be one of the reasons why CPT enhanced HCC sorafenib
sensitivity (52). Moreover, fewer
metastases were observed in the rabbits in COM group than in SOR
group. These results are consistent with CPT-mediated Nrf2
downregulation and inhibition of EMT.
High metabolism during tumor growth leads to a
hypoxic microenvironment and HIF-1α activation in tumors, which
activates growth factors (e.g., VEGFA) and induces vasculature
generation. Sorafenib activates HIF-1α and induces VEGFA
expression, which mediates sorafenib resistance (46). Previous studies demonstrated that
downregulating Nrf2 could reduce vasculature formation (53,54).
In a previous study by the authors, CPT could also suppress the
HIF-1α/VEGFA signaling pathway in tumors and decrease vascular
quantity (26). In the current
study, the levels of HIF-1α and VEGFA in the VX2 tumors from the
CPT group were lower than in the CTR group, confirming that CPT
could inhibit the HIF-1 α/VEGFA signaling pathway. The perfusion of
tumor-feeding arteries with sorafenib and lipiodol significantly
increased HIF-1α and VEGFA proteins, whereas these levels
significantly decreased in the COM group. CPT also reduced VEGFA
expression-induced by sorafenib in H22 model.
DWI models presume that the displacement of water
molecules follows a Gaussian distribution (55). The ADC provided by these models
represents an average diffusion value (55,56).
However, water diffusion in vivo is more complex and
includes water molecule diffusion and microcirculation perfusion
(31,57,58).
IVIM is one of the most common non-Gaussian DWI models (55). The parameters for IVIM include the
Standard ADC value, representing an average diffusion value; D
value that reflects the diffusion of pure water molecules, the D*
value that reflects the microcirculation perfusion, and the f value
that is defined as the ratio between the perfusion of local
microcirculation and diffusion overall (55). Although the differences in Δ
Standard ADC and ΔD values for SOR and COM groups for the H22 model
were not statistically significant, they showed an upward trend in
the COM group compared with SOR group, indicating that the tumor
activity of the COM group was lower than that of the SOR group. The
differences between ΔD* and Δf in SOR and COM groups were not
statistically significant, either. They demonstrated a downward
trend in the COM group than SOR group, reflecting that the
microcirculation perfusion in the COM group was lower than in the
SOR group. Similar results for ΔADC were obtained with the VX2
model. Namely, VX2 tumor activity decreased in the COM group.
In conclusion, the present study confirmed that
sorafenib increased Nrf2 protein levels and promoted HCC invasion
and metastasis, which may be the mechanism of sorafenib resistance.
As a novel Nrf2 inhibitor, CPT combined with sorafenib
significantly inhibited tumor growth and reduced tumor
microcirculation perfusion and activity.
Supplementary Material
Supporting Data
Acknowledgements
The authors would like to thank the Experimental
Center of Qianfoshan Hospital of Shandong for providing relevant
consultation and instrument support.
Funding
The present study was supported by the Natural Science
Foundation of Shandong (grant no. ZR2019BH041), the Nature Science
Foundation of China (grant no. 81803008) and the cultivating fund
of the First hospital of Shandong First Medical University (grant
no. QYPY2021NSFC0616).
Availability of data and materials
The datasets used and/or analyzed during the current
study are available from the corresponding author on reasonable
request.
Authors' contributions
FC, GL proposed ideas and completed outline. HW, FM,
JZ and XL carried out the study. LS, QL and SC found the relevant
literature and carried out data collection and analysis. LS wrote
the original draft and edited the manuscript. FC provided final
approval of the version to be published. GL supervised the study
and agreed to be accountable for all aspects of the work. All
authors contributed to the article and read and approved the final
version of the manuscript. LS and HW confirm the authenticity of
all the raw data.
Ethics approval and consent to
participate
All animal experiments were performed according to
the ARRIVE guidelines approved (approval no. S0007) by the Animal
Care and Use Committee of the First Hospital of Shandong First
Medical University (Jinan, China).
Patient consent for publication
Not applicable.
Competing interests
The authors declare that they have no competing
interests.
References
|
1
|
Sung H, Ferlay J, Siegel RL, Laversanne M,
Soerjomataram I, Jemal A and Bray F: Global cancer statistics 2020:
GLOBOCAN estimates of incidence and mortality worldwide for 36
cancers in 185 countries. CA Cancer J Clin. 71:209–249. 2021.
View Article : Google Scholar : PubMed/NCBI
|
|
2
|
Liu W, Quan B, Lu S, Tang B, Li M, Chen R,
Ren Z and Yin X: First-line systemic treatment strategies for
unresectable hepatocellular carcinoma: A systematic review and
network meta-analysis of randomized clinical trials. Front Oncol.
11:7710452021. View Article : Google Scholar : PubMed/NCBI
|
|
3
|
Meyer T, Fox R, Ma YT, Ross PJ, James MW,
Sturgess R, Stubbs C, Stocken DD, Wall L, Watkinson A, et al:
Sorafenib in combination with transarterial chemoembolisation in
patients with unresectable hepatocellular carcinoma (TACE 2): A
randomised placebo-controlled, double-blind, phase 3 trial. Lancet
Gastroenterol Hepatol. 2:565–575. 2017. View Article : Google Scholar : PubMed/NCBI
|
|
4
|
Sun J, Zhou C, Zhao Y, Zhang X, Chen W,
Zhou Q, Hu B, Gao D, Raatz L, Wang Z, et al: Quiescin sulfhydryl
oxidase 1 promotes sorafenib-induced ferroptosis in hepatocellular
carcinoma by driving EGFR endosomal trafficking and inhibiting NRF2
activation. Redox Biol. 41:1019422021. View Article : Google Scholar : PubMed/NCBI
|
|
5
|
Zhang Y, Tan Y, Liu S, Yin H, Duan J, Fan
L, Zhao X and Jiang B: Implications of Withaferin A for the
metastatic potential and drug resistance in hepatocellular
carcinoma cells via Nrf2-mediated EMT and ferroptosis. Toxicol Mech
Methods. 33:47–55. 2022. View Article : Google Scholar : PubMed/NCBI
|
|
6
|
Sun X, Ou Z, Chen R, Niu X, Chen D, Kang R
and Tang D: Activation of the p62-Keap1-NRF2 pathway protects
against ferroptosis in hepatocellular carcinoma cells. Hepatology.
63:173–184. 2016. View Article : Google Scholar : PubMed/NCBI
|
|
7
|
Chen KF, Chen HL, Tai WT, Feng WC, Hsu CH,
Chen PJ and Cheng AL: Activation of phosphatidylinositol
3-kinase/Akt signaling pathway mediates acquired resistance to
sorafenib in hepatocellular carcinoma cells. J Pharmacol Exp Ther.
337:155–161. 2011. View Article : Google Scholar : PubMed/NCBI
|
|
8
|
Gao L, Morine Y, Yamada S, Saito Y,
Ikemoto T, Tokuda K, Takasu C, Miyazaki K and Shimada M: Nrf2
signaling promotes cancer stemness, migration, and expression of
ABC transporter genes in sorafenib-resistant hepatocellular
carcinoma cells. PLoS One. 16:e02567552021. View Article : Google Scholar : PubMed/NCBI
|
|
9
|
Wang Q, Ching B, Xue Q, Gao Q, Huang A,
Wang K and Tang N: GSTZ1 sensitizes hepatocellular carcinoma cells
to sorafenib-induced ferroptosis via inhibition of NRF2/GPX4 axis.
Cell Death Dis. 12:4262021. View Article : Google Scholar : PubMed/NCBI
|
|
10
|
Chen F, Wang H, Zhu J, Zhao R, Xue P,
Zhang Q, Nelson MB, Qu W, Feng B and Pi J: Camptothecin suppresses
NRF2-ARE activity and sensitises hepatocellular carcinoma cells to
anticancer drugs. Br J Cancer. 117:1495–1506. 2017. View Article : Google Scholar : PubMed/NCBI
|
|
11
|
Tian B, Lu ZN and Guo XL: Regulation and
role of nuclear factor-E2-related factor 2 (Nrf2) in multidrug
resistance of hepatocellular carcinoma. Chem Biol Interact.
280:70–76. 2018. View Article : Google Scholar : PubMed/NCBI
|
|
12
|
Tebay LE, Robertson H, Durant ST, Vitale
SR, Penning TM, Dinkova-Kostova AT and Hayes JD: Mechanisms of
activation of the transcription factor Nrf2 by redox stressors,
nutrient cues, and energy status and the pathways through which it
attenuates degenerative disease. Free Radic Biol Med. 88:108–146.
2015. View Article : Google Scholar : PubMed/NCBI
|
|
13
|
Gao AM, Ke ZP, Shi F, Sun GC and Chen H:
Chrysin enhances sensitivity of BEL-7402/ADM cells to doxorubicin
by suppressing PI3K/Akt/Nrf2 and ERK/Nrf2 pathway. Chem Biol
Interact. 206:100–108. 2013. View Article : Google Scholar : PubMed/NCBI
|
|
14
|
Najafi M, Mortezaee K and Majidpoor J:
Cancer stem cell (CSC) resistance drivers. Life Sci.
234:1167812019. View Article : Google Scholar : PubMed/NCBI
|
|
15
|
Shibue T and Weinberg RA: EMT, CSCs, and
drug resistance: The mechanistic link and clinical implications.
Nat Rev Clin Oncol. 14:611–629. 2017. View Article : Google Scholar : PubMed/NCBI
|
|
16
|
Huang T, Song X, Xu D, Tiek D, Goenka A,
Wu B, Sastry N, Hu B and Cheng SY: Stem cell programs in cancer
initiation, progression, and therapy resistance. Theranostics.
10:8721–8743. 2020. View Article : Google Scholar : PubMed/NCBI
|
|
17
|
Niture SK, Khatri R and Jaiswal AK:
Regulation of Nrf2-an update. Free Radic Biol Med. 66:36–44. 2014.
View Article : Google Scholar : PubMed/NCBI
|
|
18
|
He F, Ru X and Wen T: NRF2, a
transcription factor for stress response and beyond. Int J Mol Sci.
21:47772020. View Article : Google Scholar : PubMed/NCBI
|
|
19
|
He F, Antonucci L and Karin M: NRF2 as a
regulator of cell metabolism and inflammation in cancer.
Carcinogenesis. 41:405–416. 2020. View Article : Google Scholar : PubMed/NCBI
|
|
20
|
Tonelli C, Chio IIC and Tuveson DA:
Transcriptional regulation by Nrf2. Antioxid Redox Signal.
29:1727–1745. 2018. View Article : Google Scholar : PubMed/NCBI
|
|
21
|
Zhang DD, Lo SC, Cross JV, Templeton DJ
and Hannink M: Keap1 is a redox-regulated substrate adaptor protein
for a Cul3-dependent ubiquitin ligase complex. Mol Cell Biol.
24:10941–10953. 2004. View Article : Google Scholar : PubMed/NCBI
|
|
22
|
Hayes JD, McMahon M, Chowdhry S and
Dinkova-Kostova AT: Cancer chemoprevention mechanisms mediated
through the Keap1-Nrf2 pathway. Antioxid Redox Signal.
13:1713–1748. 2010. View Article : Google Scholar : PubMed/NCBI
|
|
23
|
Gao L, Morine Y, Yamada S, Saito Y,
Ikemoto T, Tokuda K, Miyazaki K, Okikawa S, Takasu C and Shimada M:
The BAFF/NFκB axis is crucial to interactions between
sorafenib-resistant HCC cells and cancer-associated fibroblasts.
Cancer Sci. 112:3545–3554. 2021. View Article : Google Scholar : PubMed/NCBI
|
|
24
|
Lu MC, Ji JA, Jiang ZY and You QD: The
Keap1-Nrf2-ARE pathway as a potential preventive and therapeutic
target: An update. Med Res Rev. 36:924–963. 2016. View Article : Google Scholar : PubMed/NCBI
|
|
25
|
Robertson H, Dinkova-Kostova AT and Hayes
JD: NRF2 and the ambiguous consequences of its activation during
initiation and the subsequent stages of tumourigenesis. Cancers
(Basel). 12:36092020. View Article : Google Scholar : PubMed/NCBI
|
|
26
|
Liu Q, Zhao S, Meng F, Wang H, Sun L, Li
G, Gao F and Chen F: Nrf2 down-regulation by camptothecin favors
inhibiting invasion, metastasis and angiogenesis in hepatocellular
carcinoma. Front Oncol. 11:6611572021. View Article : Google Scholar : PubMed/NCBI
|
|
27
|
Kitamura H and Motohashi H: NRF2 addiction
in cancer cells. Cancer Sci. 109:900–911. 2018. View Article : Google Scholar : PubMed/NCBI
|
|
28
|
Tang XJ, Han M, Yang B, Shen YQ, He ZG, Xu
DH and Gao JQ: Nanocarrier improves the bioavailability, stability
and antitumor activity of camptothecin. Int J Pharm. 477:536–545.
2014. View Article : Google Scholar : PubMed/NCBI
|
|
29
|
Tang W, Chen Z, Zhang W, Cheng Y, Zhang B,
Wu F, Wang Q, Wang S, Rong D, Reiter FP, et al: The mechanisms of
sorafenib resistance in hepatocellular carcinoma: Theoretical basis
and therapeutic aspects. Signal Transduct Target Ther. 5:872020.
View Article : Google Scholar : PubMed/NCBI
|
|
30
|
Zheng A, Chevalier N, Calderoni M, Dubuis
G, Dormond O, Ziros PG, Sykiotis GP and Widmann C: CRISPR/Cas9
genome-wide screening identifies KEAP1 as a sorafenib, lenvatinib,
and regorafenib sensitivity gene in hepatocellular carcinoma.
Oncotarget. 10:7058–7070. 2019. View Article : Google Scholar : PubMed/NCBI
|
|
31
|
Tang X, Wang H, Fan L, Wu X, Xin A, Ren H
and Wang XJ: Luteolin inhibits Nrf2 leading to negative regulation
of the Nrf2/ARE pathway and sensitization of human lung carcinoma
A549 cells to therapeutic drugs. Free Radic Biol Med. 50:1599–1609.
2011. View Article : Google Scholar : PubMed/NCBI
|
|
32
|
Murakami Y, Sugiyama K, Ebinuma H,
Nakamoto N, Ojiro K, Chu PS, Taniki N, Saito Y, Teratani T, Koda Y,
et al: Dual effects of the Nrf2 inhibitor for inhibition of
hepatitis C virus and hepatic cancer cells. BMC Cancer. 18:6802018.
View Article : Google Scholar : PubMed/NCBI
|
|
33
|
Arlt A, Sebens S, Krebs S, Geismann C,
Grossmann M, Kruse ML, Schreiber S and Schäfer H: Inhibition of the
Nrf2 transcription factor by the alkaloid trigonelline renders
pancreatic cancer cells more susceptible to apoptosis through
decreased proteasomal gene expression and proteasome activity.
Oncogene. 32:4825–4835. 2013. View Article : Google Scholar : PubMed/NCBI
|
|
34
|
Wang XJ, Hayes JD, Henderson CJ and Wolf
CR: Identification of retinoic acid as an inhibitor of
transcription factor Nrf2 through activation of retinoic acid
receptor alpha. Proc Natl Acad Sci U S A. 104:19589–19594. 2007.
View Article : Google Scholar : PubMed/NCBI
|
|
35
|
Bailly C: Irinotecan: 25 years of cancer
treatment. Pharmacol Res. 148:1043982019. View Article : Google Scholar : PubMed/NCBI
|
|
36
|
de Lucas Chazin E, da Rocha Reis R, Junior
WT, Moor LF and Vasconcelos TR: An overview on the development of
new potentially active camptothecin analogs against cancer. Mini
Rev Med Chem. 14:953–962. 2014. View Article : Google Scholar : PubMed/NCBI
|
|
37
|
Sass G, Barikbin R and Tiegs G: The
multiple functions of heme oxygenase-1 in the liver. Z
Gastroenterol. 50:34–40. 2012. View Article : Google Scholar : PubMed/NCBI
|
|
38
|
Leung HW, Lau EYT, Leung CON, Lei MML, Mok
EHK, Ma VWS, Cho WCS, Ng IOL, Yun JP, Cai SH, et al: NRF2/SHH
signaling cascade promotes tumor-initiating cell lineage and drug
resistance in hepatocellular carcinoma. Cancer Lett. 476:48–56.
2020. View Article : Google Scholar : PubMed/NCBI
|
|
39
|
Dai C, Chen X, Li J, Comish P, Kang R and
Tang D: Transcription factors in ferroptotic cell death. Cancer
Gene Ther. 27:645–656. 2020. View Article : Google Scholar : PubMed/NCBI
|
|
40
|
Zhang G and Zhang G: Upregulation of FoxP4
in HCC promotes migration and invasion through regulation of EMT.
Oncol Lett. 17:3944–3951. 2019.PubMed/NCBI
|
|
41
|
Wang Y, Shi J, Chai K, Ying X and Zhou BP:
The role of snail in EMT and tumorigenesis. Curr Cancer Drug
Targets. 13:963–972. 2013. View Article : Google Scholar : PubMed/NCBI
|
|
42
|
Giannelli G, Koudelkova P, Dituri F and
Mikulits W: Role of epithelial to mesenchymal transition in
hepatocellular carcinoma. J Hepatol. 65:798–808. 2016. View Article : Google Scholar : PubMed/NCBI
|
|
43
|
Gheldof A and Berx G: Cadherins and
epithelial-to-mesenchymal transition. Prog Mol Biol Transl Sci.
116:317–336. 2013. View Article : Google Scholar : PubMed/NCBI
|
|
44
|
Al Khatib AM, Mărgăritescu C, Taisescu O,
Andreiana BC, Florescu MM and Ciurea RN: Immunoexpression of
E-cadherin, snail and twist in colonic adenocarcinomas. Rom J
Morphol Embryol. 60:531–536. 2019.PubMed/NCBI
|
|
45
|
Tian Y, Qi P, Niu Q and Hu X: Combined
snail and E-cadherin predicts overall survival of cervical
carcinoma patients: Comparison among various epithelial-mesenchymal
transition proteins. Front Mol Biosci. 7:222020. View Article : Google Scholar : PubMed/NCBI
|
|
46
|
Zhao H, Cheng X, Yu J and Li Y:
Stabilization of snail maintains the sorafenib resistance of
hepatocellular carcinoma cells. Arch Biochem Biophys.
699:1087542021. View Article : Google Scholar : PubMed/NCBI
|
|
47
|
Chen HA, Kuo TC, Tseng CF, Ma JT, Yang ST,
Yen CJ, Yang CY, Sung SY and Su JL: Angiopoietin-like protein 1
antagonizes MET receptor activity to repress sorafenib resistance
and cancer stemness in hepatocellular carcinoma. Hepatology.
64:1637–1651. 2016. View Article : Google Scholar : PubMed/NCBI
|
|
48
|
van Malenstein H, Dekervel J, Verslype C,
Van Cutsem E, Windmolders P, Nevens F and van Pelt J: Long-term
exposure to sorafenib of liver cancer cells induces resistance with
epithelial-to-mesenchymal transition, increased invasion and risk
of rebound growth. Cancer Lett. 329:74–83. 2013. View Article : Google Scholar : PubMed/NCBI
|
|
49
|
Zhao CX, Luo CL and Wu XH: Hypoxia
promotes 786-O cells invasiveness and resistance to sorafenib via
HIF-2α/COX-2. Med Oncol. 32:4192014. View Article : Google Scholar : PubMed/NCBI
|
|
50
|
Liu H, Wang M, Liang N and Guan L: PDCD2
sensitizes HepG2 cells to sorafenib by suppressing
epithelialmesenchymal transition. Mol Med Rep. 19:2173–2179.
2019.PubMed/NCBI
|
|
51
|
Chen W, Yang J, Zhang Y, Cai H, Chen X and
Sun D: Regorafenib reverses HGF-induced sorafenib resistance by
inhibiting epithelial-mesenchymal transition in hepatocellular
carcinoma. FEBS Open Bio. 9:335–347. 2019. View Article : Google Scholar : PubMed/NCBI
|
|
52
|
Mir N, Jayachandran A, Dhungel B, Shrestha
R and Steel JC: Epithelial-to-mesenchymal transition: A mediator of
sorafenib resistance in advanced hepatocellular carcinoma. Curr
Cancer Drug Targets. 17:698–706. 2017. View Article : Google Scholar : PubMed/NCBI
|
|
53
|
Ji X, Wang H, Zhu J, Zhu L, Pan H, Li W,
Zhou Y, Cong Z, Yan F and Chen S: Knockdown of Nrf2 suppresses
glioblastoma angiogenesis by inhibiting hypoxia-induced activation
of HIF-1α. Int J Cancer. 135:574–584. 2014. View Article : Google Scholar : PubMed/NCBI
|
|
54
|
Kim TH, Hur EG, Kang SJ, Kim JA, Thapa D,
Lee YM, Ku SK, Jung Y and Kwak MK: NRF2 blockade suppresses colon
tumor angiogenesis by inhibiting hypoxia-induced activation of
HIF-1α. Cancer Res. 71:2260–2275. 2011. View Article : Google Scholar : PubMed/NCBI
|
|
55
|
Tramontano L, Cavaliere C, Salvatore M and
Brancato V: The role of non-gaussian models of diffusion weighted
MRI in hepatocellular carcinoma: A systematic review. J Clin Med.
10:26412021. View Article : Google Scholar : PubMed/NCBI
|
|
56
|
Zhou Y, Yang G, Gong XQ, Tao YY, Wang R,
Zheng J, Yang C, Peng J, Yang L, Li JD and Zhang XM: A study of the
correlations between IVIM-DWI parameters and the histologic
differentiation of hepatocellular carcinoma. Sci Rep. 11:103922021.
View Article : Google Scholar : PubMed/NCBI
|
|
57
|
Le Bihan D, Breton E, Lallemand D, Grenier
P, Cabanis E and Laval-Jeantet M: MR imaging of intravoxel
incoherent motions: Application to diffusion and perfusion in
neurologic disorders. Radiology. 161:401–407. 1986. View Article : Google Scholar : PubMed/NCBI
|
|
58
|
Granata V, Fusco R, Filice S, Catalano O,
Piccirillo M, Palaia R, Izzo F and Petrillo A: The current role and
future prospectives of functional parameters by diffusion weighted
imaging in the assessment of histologic grade of HCC. Infect Agent
Cancer. 13:232018. View Article : Google Scholar : PubMed/NCBI
|