Introduction
Cancer, the malignant growth of cells due to
uncontrolled cell proliferation, ranks as a major cause of
morbidity and premature death worldwide. GLOBOCAN estimated that
there were 18.1 million new cancer cases and nearly 10 million
cancer deaths in 2020 (1).
According to the World Health Organization (WHO), lung cancer is
the leading cause of cancer mortality in 2020, accounting for 1.8
million deaths (2). The most common
type of lung cancer is non-small cell lung cancer (NSCLC, including
large cell carcinoma, squamous cell carcinoma and adenocarcinoma)
which accounts for up to 85% of lung cancers, while small cell lung
cancer is responsible for 10% of the cases and histological
variants represent the other 5% (3). Cigarette smoking is the most prevalent
risk factor for lung cancer. Other known contributory factors
include radiation, radon gas, certain metals, smoke, toxic
chemicals, asbestos, as well as genetic factors. Despite
significant breakthroughs in the understanding of cancer biology,
the success of current conventional chemotherapies remains limited
due to toxicity, efficacy and drug resistance (4). Novel drug discovery and development is
thus an important aspect of cancer research to improve outcomes in
cancer treatment.
The discovery of new medications with remarkable
effects has made significant progress and contributed significantly
to disease-free survival improvement. However, drug resistance
develops in the majority of patients, as treatment progresses.
Chemotherapy resistance is a significant challenge to cancer
treatment success and patient survival, resulting in cancer relapse
and recurrence and, eventually, death. The ability of cancer cells
to resist the effects of chemotherapeutic drugs can occur before
treatment (intrinsic mechanisms) or later during treatment
(acquired mechanisms). Drug resistance results from multiple
molecular determinants, such as increased drug efflux, decreased
drug uptake, alteration of drug targets, epigenetic alterations,
increased DNA repair and inhibition of cell death (5). The high complexity and heterogeneity
of tumors, as well as cancer's ability to evade therapies, render
it more difficult to deal with drug resistance. There are several
ongoing efforts towards improved understanding of the mechanisms of
chemotherapy resistance and of developing novel therapeutic
strategies to overcome it. Due to the high likelihood of drug
resistance and treatment failure with monotherapy, combination
therapy regimens are preferred for overcoming chemotherapy
resistance because they target multiple driver genes at once.
Emerging evidence suggests that sequential chemotherapeutic
administration may be more effective than combinational therapies
in preventing drug resistance and increasing treatment success
rates (6). One strategy for
combating chemotherapy resistance is to target apoptotic pathways.
An abundance of evidence suggests that natural compounds, such as
galbanic acid, can induce TRAIL-mediated apoptosis (7). Specific drug delivery platforms, such
as exosome or nanoparticle conjugations, have recently gained
attention and demonstrated a remarkable potential to overcome drug
resistance (8).
The tumor microenvironment (TME), a non-malignant
part of tumors, has been widely implicated in tumor formation,
progression and metastatic dissemination (9). In 2022, the hallmarks of cancer have
been expanded from 6 to 14, with TME being recognized as the
emerging participant in cancer development (10). Numerous studies have shown that the
dynamic and bidirectional communication between cancer cells and
the cellular (stromal cells) and acellular components (such as
fibronectin, collagen, laminin and hyaluronan) in the TME can
reprogram cancer initiation, growth, metastasis, as well as
response to therapies (11).
Selection of the experimental model is the key to
in vitro experimentation. Cell culture models that perform
similarly, both morphologically and functionally, to the cells
in vivo are desirable, in order to obtain the most reliable
results. Currently, the traditional two-dimensional (2D) culture
system, where cells are cultured as monolayers on plastic surfaces,
serves as the main platform for basic cellular research. However,
important signals from the TME, particularly factors influencing
response to therapy are largely ignored when cells are cultured in
2D. Thus, the failure of 2D cultures to imitate the complexity of
in vivo microenvironment may be responsible for the poor
correlation between in vitro and in vivo drug
candidate activity by providing misleading results and
non-predictive data (12). Although
the vast majority of new therapeutic agents show excellent
antitumor properties in vitro, only 5% of the compounds
passed clinical trials, indicating that 2D culture is a relatively
poor model for drug discovery and development (13).
It is increasingly evident that three-dimensional
(3D) cell culture systems represent improved predictive in
vitro approaches than the traditional 2D culture. 3D culture
models can more accurately reflect the complex interactions of
cell-cell and cell-extracellular matrix (ECM) interactions that
resemble in vivo microenvironment, thus providing more
accurate results for preclinical drug development. These
interactions, as well as the 3D architecture affect a range of
cellular functions and cell behavior, including morphology,
proliferation, differentiation, angiogenesis, migration, invasion
and gene/protein expression (14,15).
Moreover, several recent publications demonstrated that numerous
signaling pathways associated with drug sensitivity are
differentially activated in cells cultured in 3D compared with 2D
settings, leading to increased drug resistance in 3D culture
(16,17). Notably, numerous studies have shown
that the gene or protein expression patterns of 3D-cultured cells
more closely resemble those of native tissue than those of
monolayer cultures (18,19).
In the present study, the culture of A549 human lung
epithelial cells in a basement membrane extract-based 3D culture
system was described, that restored the crucial microenvironmental
cues from the ECM and provided a more physiologically relevant
model. Cellular characteristics of cells in 2D and 3D culturing
microenvironment which are key determinants in cancer progression
including migration, invasion, cell cycle, hypoxia, stemness and
degree of apoptosis, were evaluated. Chemotherapeutic response of
cells to a variety of conventional chemotherapeutic drugs, small
molecule inhibitors, and natural products was also assessed.
Further investigation of the signaling events accounting for the
biological features of cells led to the delineation of key
regulatory elements associated with tumor dormancy and drug
resistance.
Materials and methods
Cell culture
The human lung epithelial cell line A549 (cat. no.
CCL-185™; American Type Culture Collection) was
maintained in RPMI-1640 containing 10% (v/v) FBS (Gibco; Thermo
Fisher Scientific, Inc.) and 1% (v/v) antibiotic-antimycotic
solution (Gibco; Thermo Fisher Scientific, Inc.). The 3D on-top
culture was performed as previously described (20) with certain modifications. Briefly,
the prechilled 24-well culture plates were coated with a thin layer
of reconstituted basement membrane (Matrigel; BD Biosciences, cat.
no. 356234) and incubated at 37°C for 30 min. Subsequently, a cell
suspension (0.5×10⁵ cells in 500 µl of complete medium
containing 2% Matrigel) was added on top of Matrigel. The medium
was changed every 3–4 days and the cultures were maintained for 7
days. For 2D cultivation, the cells were cultured for 3 days before
being used. In all experiments, the cells were maintained in a
humidified atmosphere incubator (5% CO2) at 37°C.
Flow cytometric analysis of apoptosis
and cell cycle distribution
The apoptotic profiles and cell cycle progression of
A549 cells cultured in 2D/3D culturing microenvironments were
assessed using Muse® Cell Analyzer (Luminex) as
previously described (21).
Briefly, the cells were harvested, dissociated into single-cell
suspensions and stained with Muse Annexin V & Dead Cell kit or
Muse Cell Cycle kit (Luminex), according to the manufacturer's
instructions. Then, the cells were subjected to apoptotic detection
or cell cycle analysis. Results are expressed as the mean values of
total apoptosis (percentage of early + late apoptotic cells) or
proportion of the cells in each phase of cell cycle
(G0/G1, S and G2/M).
In vitro cell migration and invasion
assays
Cellular potential for migration and invasion of the
2D and 3D cells were assessed using 24-well Transwell chambers (8
mm; BD Biosciences). For migration assay, a total of
4×10⁴ cells in 200-µl suspension were seeded into the
Transwell chamber, while 1×10⁵ cells were seeded in the
Matrigel-coated upper chamber for the invasion assay. The lower
compartment of the chamber was filled with 500 µl of
chemoattractant [conditioned medium prepared from human lung
fibroblasts (MRC-5)]. The cells were allowed to migrate or invade
for 24 h, after which the non-migratory or non-invasive cells on
the top of the filter were carefully removed with cotton swabs.
Membrane containing migratory or invasive cells was immersed in 25%
methanol for 15 min, developed with 500 µl of 0.5% crystal violet
(MilliporeSigma) for 15 min, and acid-extracted with 100 µl of 0.1
N HCl in methanol. The absorbance was measured at 550 nm using a
microplate reader.
Drug sensitivity assay
The chemosensitivity of the cells to a variety of
conventional chemotherapeutic drugs, small molecule inhibitors, and
natural products was determined using an MTT assay. The choice of
chemotherapeutic agents was motivated by the desire to compare cell
response between two models, 3D cells in the present study and
semi-solid Matrigel-embedded cells in our previous study (22). Standard chemotherapeutic agents that
target proliferating cell mechanisms, as well as drugs with
multi-targeted actions that do not rely on the proliferative status
of the cells, were used. Doxorubicin, etoposide, vinblastine,
paclitaxel, 2-deoxyglucose (2-DG), emodin, apigenin, resveratrol,
caffeic acid phenethyl ester (CAPE), curcumin, capsaicin, shikonin,
and dihydroxybenzaldehyde (DHBZ) were purchased from
MilliporeSigma. Cucurbitacin I (CBC-I), AG-490, and BAY 11-7085
were purchased from Calbiochem. Chrysin was kindly provided by Dr
Sirivan Athikomkulchai (Faculty of Pharmacy, Srinakharinwirot
University, Nakhon Nayok, Thailand). Briefly, 100 µl of the cell
suspension was seeded into each well of a 96-well plate
(1×10⁴ cells), then 100 µl of cytotoxic agents in a
range of concentrations or a vehicle (cell culture media) were
added. After 48 h of incubation, each well was replaced with 100 µl
of 0.5 mg/ml MTT solution (MilliporeSigma) and incubated for
another 2 h at 37°C. Absorbance was measured at 550 nm (650 nm was
subtracted as the reference wavelength) using a microplate reader.
The IC50 value for each cytotoxic drug (the drug
concentration exhibiting 50% cell viability) was calculated.
Reverse transcription-quantitative PCR
(RT-qPCR) analysis
Total RNA isolation was performed using NucleoSpin
RNA Mini kit, following the manufacturer's instructions. First
strand cDNA was reverse transcribed form 2 µg of template RNA using
SuperScript III Reverse Transcriptase (Invitrogen; Thermo Fisher
Scientific, Inc.). A total of 1 µl of 10 mM Oligo(dT)20
primer and 2 µg RNA were combined and the volume was adjusted to 12
µl with DEPC-treated water in a 0.2 ml PCR tube. The tube was
incubated at 60°C for 5 min and then placed on ice immediately.
Meanwhile, a master reaction was prepared with 4 µl 5X First-Strand
Buffer, 1 µl 0.1 M DTT, 1 µl 10 mM dNTP mix, and 1 µl
SuperScript™ III RT (200 units/µl) and added to the
reaction. The reaction was incubated at 50°C for 50 min, followed
by inactivation of the reaction by heating at 70°C for 15 min.
Real-time PCR was performed using StepOnePlus™ Real-Time
PCR System (Applied Biosystems; Thermo Fisher Scientific, Inc.).
Each PCR reaction (20 µl) was composed of 20 ng of cDNA, KAPA SYBR
FAST qPCR kit reagent (Kapa Biosystems; Roche Diagnostics) and 10
pmol of PCR primers. Oligonucleotide primers used in the present
study are listed in Table I. The
thermocycling conditions were as follows: An initial activation
step at 95°C for 10 min was followed by 40 cycles comprising
denaturation at 95°C for 15 sec, annealing at 60°C for 30 sec, and
extension at 72°C for 30 sec. Data were analyzed using the
2−ΔΔCq method (23). The
relative mRNA expression of the gene was normalized to the level of
RPS13 mRNA (internal control).
 | Table I.Sequence of primers used for reverse
transcription-quantitative PCR analysis. |
Table I.
Sequence of primers used for reverse
transcription-quantitative PCR analysis.
| Gene name | Primer sequence
(5′→3′) |
|---|
| uPA | F:
TCGTCTGTTCCCTCCAAGGC |
|
| R:
TGCGGATCCAGGGTAAGAAG |
| uPA receptor | F:
TAAGACCAACGGGGATTGCC |
|
| R:
TCTCCTTCTTCCCACAAGCG |
| c-MET | F:
CATGCCGACAAGTGCAGTA |
|
| R:
TCTTGCCATCATTGTCCAAC |
| MMP-1 | F:
AGAGCAGATGTGGACCATGC |
|
| R:
TTGTCCCGATGATCTCCCCT |
| MMP-2 | F:
CAAGGACCGGTTCATTTGGC |
|
| R:
GGCCTCGTATACCGCATCAA |
| MMP-3 | F:
ACAAAGGATACAACAGGGACCA |
|
| R:
AGCTTCAGTGTTGGCTGAGT |
| MMP-7 | F:
AGTGGTCACCTACAGGATCG |
|
| R:
GGGATCTCTTTGCCCCACAT |
| MMP-9 | F:
AAGGATGGGAAGTACTGGCG |
|
| R:
GCTCCTCAAAGACCGAGTCC |
| MMP-10 | F:
AGTTTGGCTCATGCCTACCC |
|
| R:
TTGGTGCCTGATGCATCTTCT |
| MMP-11 | F:
ACCTTTACTGAGGTGCACGAG |
|
| R:
CAAATTCATGGGCTGCCACC |
| MMP-13 | F:
TCCAGTCTCTCTATGGTCCAGG |
|
| R:
CCTCGGAGACTGGTAATGGC |
| TIMP-1 | F:
GCTGTGAGGAATGCACAGTGTT |
|
| R:
CCTTTTCAGAGCCTTGGAGGA |
| TIMP-2 | F:
GTTTATCTACACGGCCCCCT |
|
| R:
TCGGCCTTTCCTGCAATGAG |
| TIMP-3 | F:
ACCGAGGCTTCACCAAGATG |
|
| R:
ATAGACGCGACCTGTCAGCA |
| TIMP-4 | F:
AACTGTGGCTGCCAAATCAC |
|
| R:
GCTTTCGTTCCAACAGCCAG |
| TUBBI | F:
ATACCTTGAGGCGAGCAAAA |
|
| R:
CTGATCACCTCCCAGAACTTG |
| TUBBIIa | F:
AAATATGTACCTCGGGCCATC |
|
| R:
GTTATTCCCGGCTCCACTCT |
| TUBBIIb | F:
AGGACGGACAGACCCAGAC |
|
| R:
CTGATGACCTCCCAAAACTTG |
| TUBBIII | F:
GCAACTACGTGGGCGACT |
|
| R:
CGAGGCACGTACTTGTGAGA |
| TUBBIVa | F:
CCGGACAACTTCGTGTTTG |
|
| R:
ACAGCGTCCACCAGCTCT |
| TUBBIVb | F:
TTGTCTACTTCCTCCTGCTTCC |
|
| R:
CTGATCACCTCCCAAAACTTG |
| TUBBV | F:
AGGCTACGTGGGAGACTCG |
|
| R:
GCCCTGGGCACATATTTCT |
| TUBBVI | F:
GGATGCGTGAAATTGTCCAT |
|
| R:
AGTCGATCCCGTGTTCCTC |
| MDR-1 | F:
GTCTTTGGTGCCATGGCCGT |
|
| R:
ATGTCCGGTCGGGTGGGATA |
| MRP-1 | F:
CTGACAAGCTAGACCATGAATGT |
|
| R:
CCTTTGTCCAAGACGATCACCC |
| MRP-2 | F:
GCCAGATTGGCCCAGCAAA |
|
| R:
AATCTGACCACCGGCAGCCT |
| MRP-3 | F:
GGGACCCTGCGCATGAACCTG |
|
| R:
TAGGCAAGTCCAGCATCTCTGG |
| MRP-5 | F:
CTAGAGAGACTGTGGCAAGAAGAGC |
|
| R:
AAATGCCATGGTTAGGATGGC |
| MRP-7 | F:
TAGGCACTGACTCTGAACGG |
|
| R:
TTGTTGACGGGTACCAGCAG |
| BCRP | F:
TGGCTGTCATGGCTTCAGTA |
|
| R:
GCCACGTGATTCTTCCACAA |
| LRP | F:
GAGCAGTTCACAGTGTTGTCC |
|
| R:
AAAGCCAAAGACAGCAGTGCG |
| HIF-1a | F:
ATCCATGTGACCATGAGGAAATG |
|
| R:
CTCGGCTAGTTAGGGTACACTT |
| Oct4A | F:
CGCAAGCCCTCATTTCAC |
|
| R:
CATCACCTCCACCACCTG |
| Oct4B | F:
CAGGGAATGGGTGAATGAC |
|
| R:
AGGCAGAAGACTTGTAAGAAC |
| Oct4B1 | F:
GGGTTCTATTTGGTGGGTTCC |
|
| R:
TCCCTCTCCCTACTCCTCTTCA |
| Nanog | F:
ATGCCTCACACGGAGACTG |
|
| R:
CTGCGTCACACCATTGCTA |
| CD133 | F:
GCTTTGCAATCTCCCTGTTG |
|
| R:
TTGATCCGGGTTCTTACCTG |
| EPCAM | F:
CGCAGCTCAGGAAGAATGTG |
|
| R:
TGAAGTACACTGGCATTGACGA |
| Sox-2 | F:
CAAGATGCACAACTCGGAGA |
|
| R:
GCTTAGCCTCGTCGATGAAC |
| ALDH1 | F:
TCCTGGTTATGGGCCTACAG |
|
| R:
CTGGCCCTGGTGGTAGAATA |
| RPS13 | F:
CGAAAGCATCTTGAGAGGAACA |
|
| R:
TCGAGCCAAACGGTGAATC |
Western blot analysis
A549 cells cultured in 2D monolayer or 3D aggregates
were harvested and lysed in cell signaling lysis buffer (Merck
Millipore) containing protease/phosphatase inhibitor cocktail (Cell
Signaling Technology, Inc.). Protein quantification was performed
using a Bradford assay kit (Bio-Rad Laboratories, Inc.). A total of
20 µg protein per lane was separated by 10% SDS-PAGE,
electroblotted onto Immobilon-P Transfer Membranes (Merck
Millipore) and blocked for 1 h at room temperature with 3% BSA
(Sigma-Aldrich; Merck KGaA) in TBS-T (0.1% Tween-20). The membranes
were then probed with the indicated primary antibodies:
phosphorylated (p)-STAT3 (Y705; 1:250; rabbit, monoclonal; cat. no.
9145), STAT3 (1:3,000; rabbit, polyclonal; cat. no. 4904), p-Akt
(1:250; rabbit, polyclonal; cat. no. 9271), Akt (1:1,000; rabbit,
polyclonal; cat. no 9272), p-ERK (1:10,000; rabbit, polyclonal;
cat. no. 9101), ERK (1:4,000; rabbit, polyclonal; cat. no. 9102),
p-p38 (T180/Y182; 1:250; rabbit, polyclonal; cat. no. 9211), p38
(1:1,000; rabbit, polyclonal; cat. no. 9212), p-FAK (1:200; rabbit,
monoclonal; cat. no. 8556), FAK (1:1,000; rabbit, polyclonal; cat.
no. 3285), Mcl-1 (1:250; rabbit, polyclonal; cat. no. 4572),
survivin (1:200; rabbit, polyclonal; cat. no. 2803), puma (1:500;
rabbit, polyclonal; cat. no. 4976), cyclin D1 (1:250; rabbit,
polyclonal; cat. no. 2922), cyclin D3 (1:1,000; mouse, monoclonal;
cat. no. 2936), CDK2 (1:1,000; rabbit, monoclonal; cat. no. 2546)
(all from Cell Signaling Technology, Inc.), MYLK (1:200; mouse,
monoclonal; cat. no. sc-365352; Santa Cruz Biotechnology, Inc.) and
GAPDH (1:50,000; rabbit, monoclonal; cat. no. ab190480; Abcam) at
4°C overnight. The membranes were washed and incubated for 1 h at
room temperature in a 1:5,000 dilution of HRP-conjugated goat
anti-rabbit (monoclonal; cat. no. 7074; Cell Signaling Technology,
Inc.) or rabbit anti-mouse (polyclonal; cat. no. P0260; Dako;
Agilent Technologies, Inc.) secondary antibodies. Visualization of
the protein bands was performed with the SuperSignal™
West Pico PLUS Chemiluminescent Substrate (cat. no. 34580; Thermo
Fisher Scientific) or SuperSignal™ West Femto Maximum
Sensitivity Substrate (cat. no. 34096; Thermo Fisher Scientific,
Inc.). Quantification of the bands was carried out by densitometry
using ImageJ version 1.53k software (National Institutes of
Health).
Statistical analysis
All experimental data were expressed as means ±
standard deviation of three biological replicates. Statistical
values were performed using a two-tailed unpaired Student's t-test
to determine the difference between 2 groups. The statistical
significance between multiple experimental groups was assessed
using one-way analysis of variance (ANOVA), followed by Tukey's
post hoc test. P<0.05 was considered to indicate a statistically
significant difference.
Results
Morphological characteristics of A549
cells in 2D and 3D-cultivation
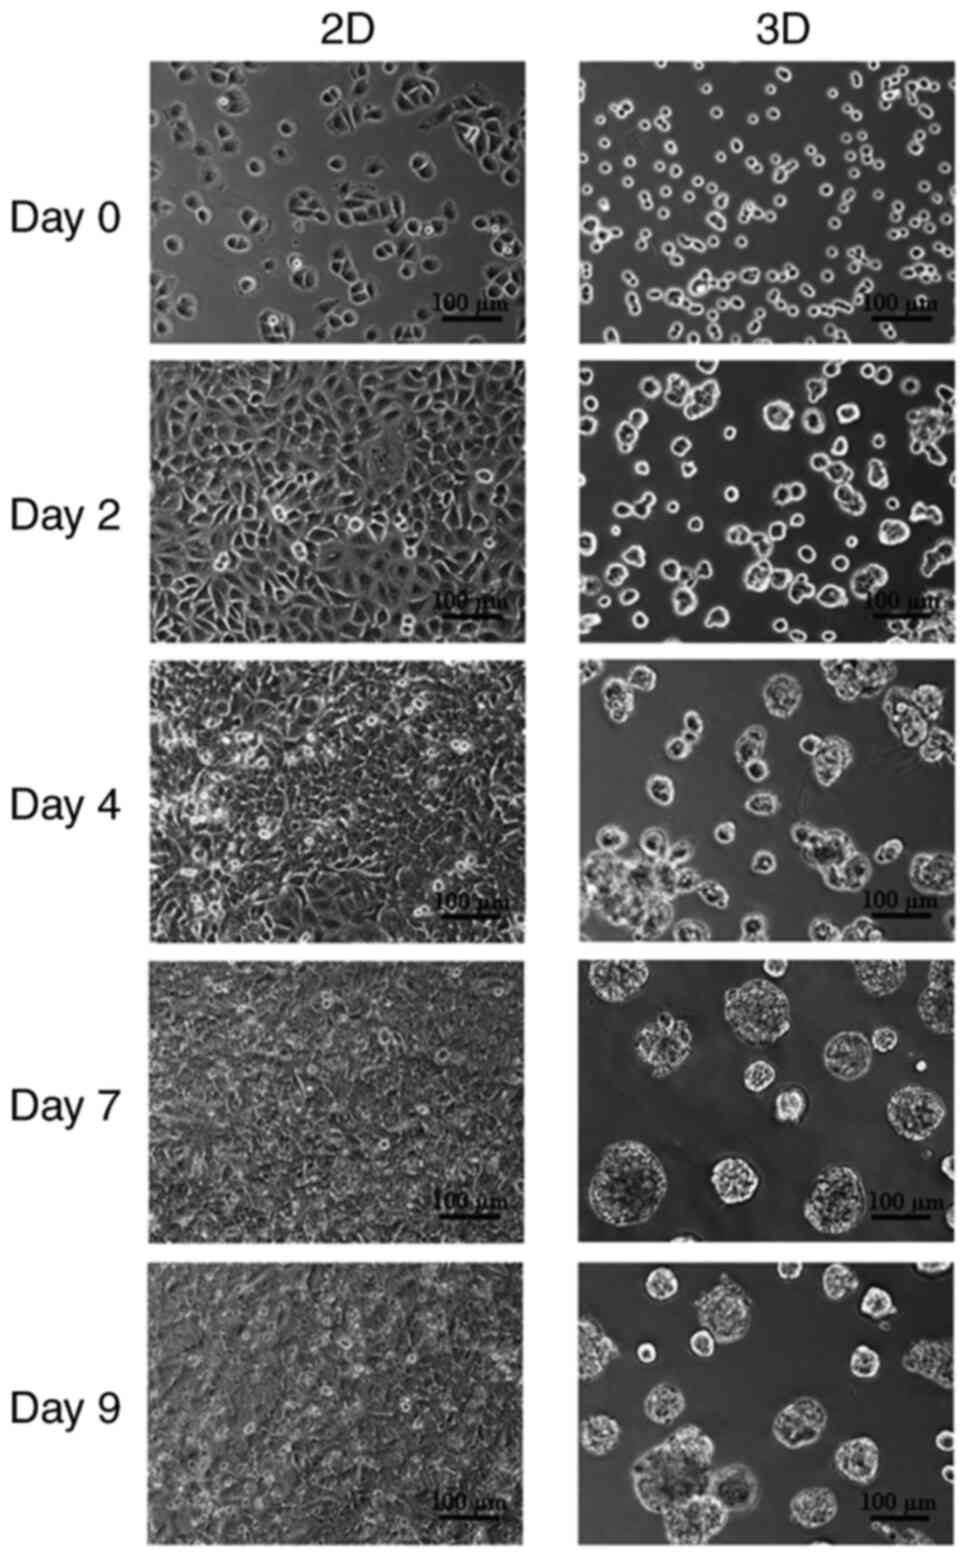
Cell morphology was assessed on day 0, 2, 4, 7, and
9 using inverted phase-contrast microscopy. As revealed in Fig. 1, the morphologies of the cells
differed noticeably between the two culturing strategies. A549
cells plated on tissue culture plastic for 2D culture appeared flat
and preserved the typical cobblestone form (Fig. 1, left panel), whereas the shape of
cells plated on Matrigel for 3D culture was changed to be
spherical, similar to acini in vivo (Fig. 1, right panel). The 7-day cultivation
period was chosen for the 3D culture approach based on previous
experience with excessive 3D aggregate compaction leading to cell
death.
A549 cells cultured as 3D aggregates
undergo apoptosis
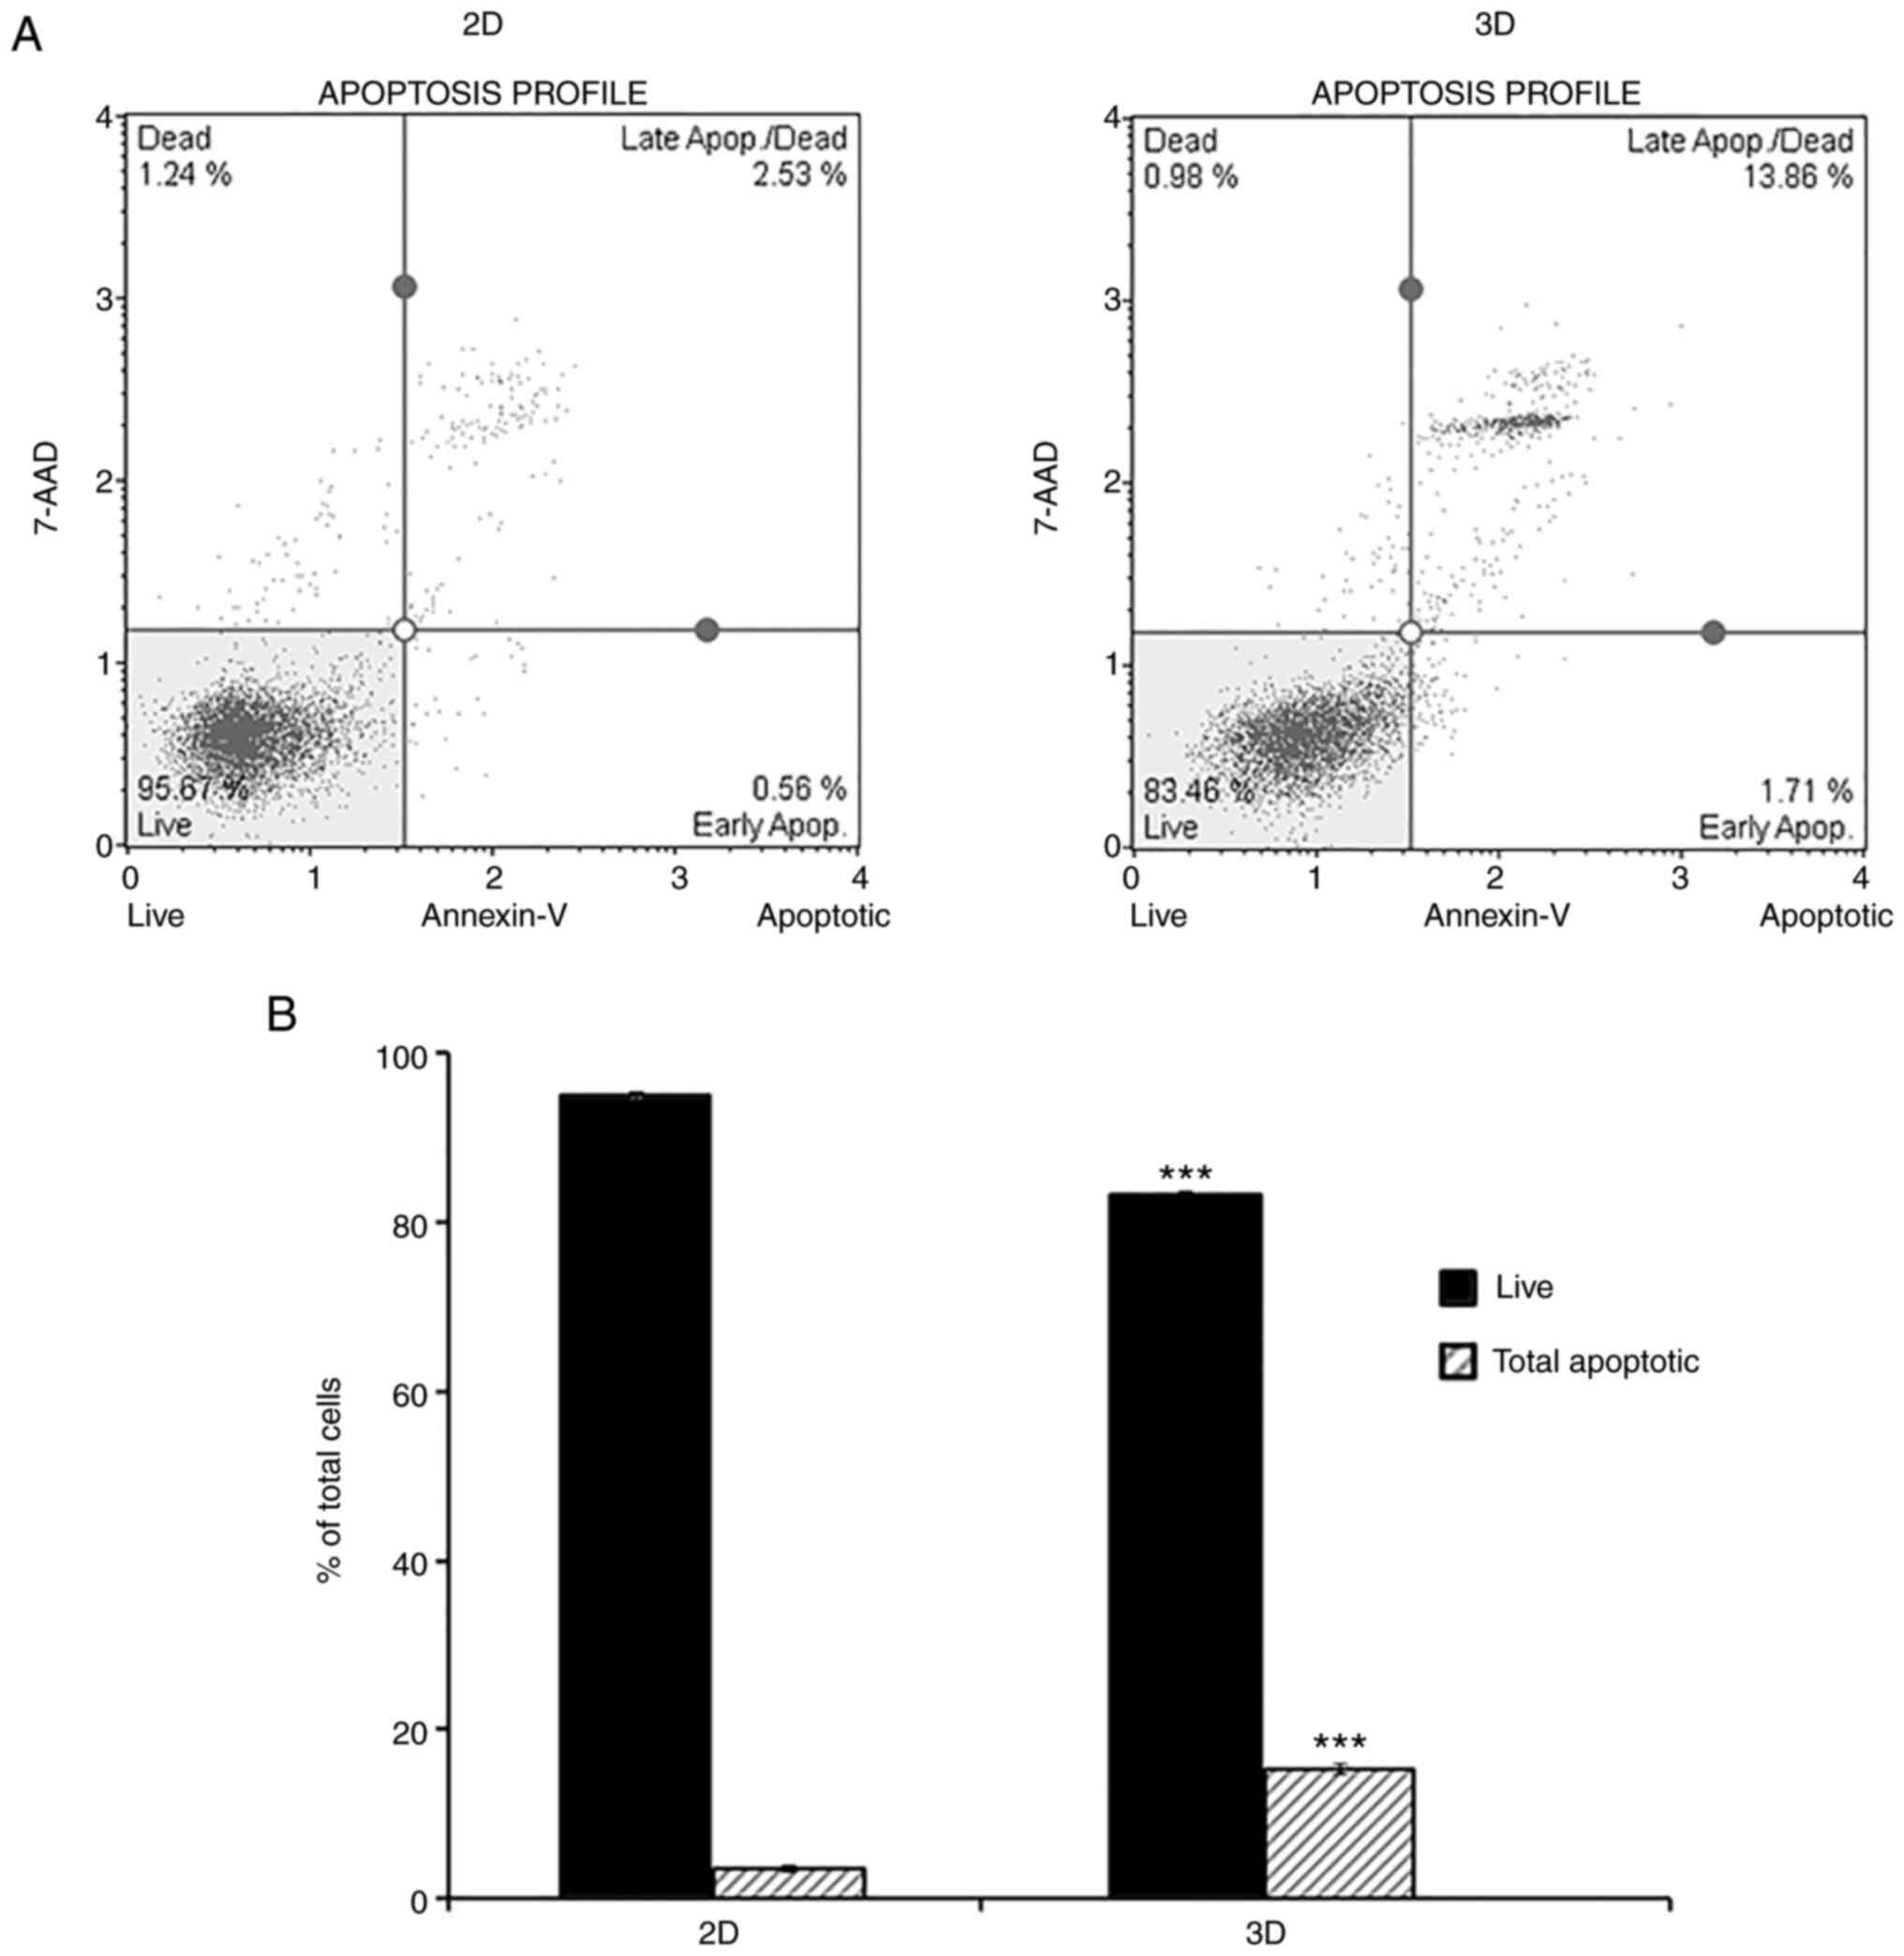
Several studies suggested that in 3D cultures,
gradients of oxygen and nutrients as well as the accumulation of
waste led to cell death, which increases with prolonged culture
time (24,25). In the present study, Annexin V/7-AAD
double staining and flow cytometry allowed quantitative measurement
of apoptosis in 2D and 3D culturing systems. As demonstrated in
Fig. 2, a higher percentage of
cells cultured in 3D (15.2±0.6%) stained positive for Annexin V
compared with the 2D culture (3.5±0.4%), indicating increased
apoptosis of cells in the 3D model.
Effect of 3D culture on cell migration
and invasion
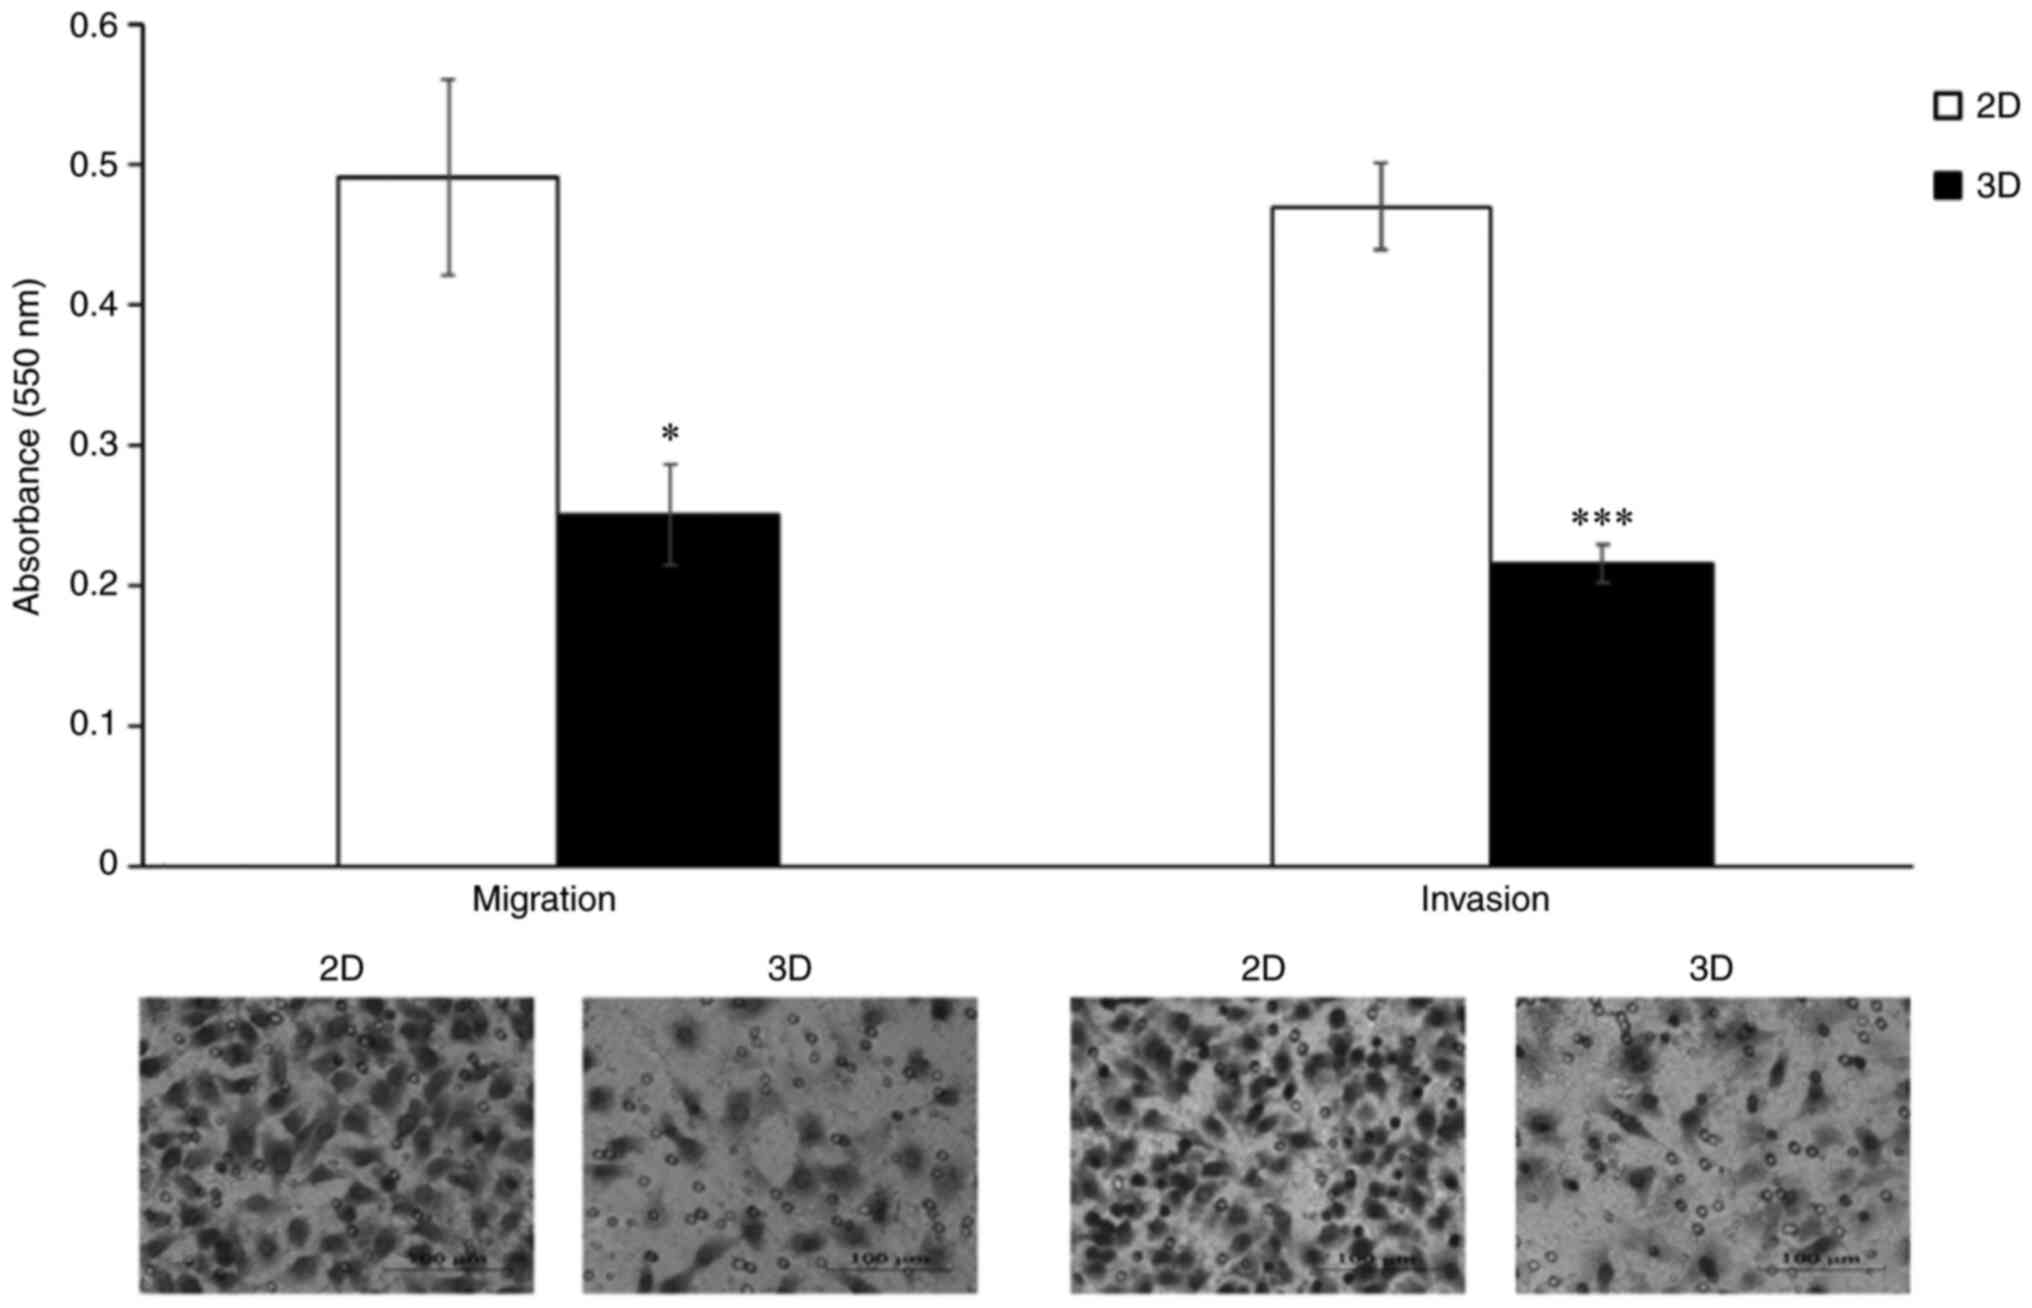
Migratory and invasive behavior of A549 cells under
2D and 3D culture were evaluated using the Transwell cell migration
and invasion assay. The attenuation of the migration and invasion
ability of A549 cells following 3D-cultivation are revealed in
Fig. 3. Cell migration ability was
significantly lower in the 3D model than that in the 2D model, with
the number of migrating cells being 49% lower among cells cultured
in 3D. Similar results were observed in the Transwell Matrigel
invasion assay, where 3D in vitro culture reduced the
invasive ability of A549 cells to 46% compared with those cultured
in 2D.
The 3D culture system induces
G0/G1 phase arrest in A549 cells
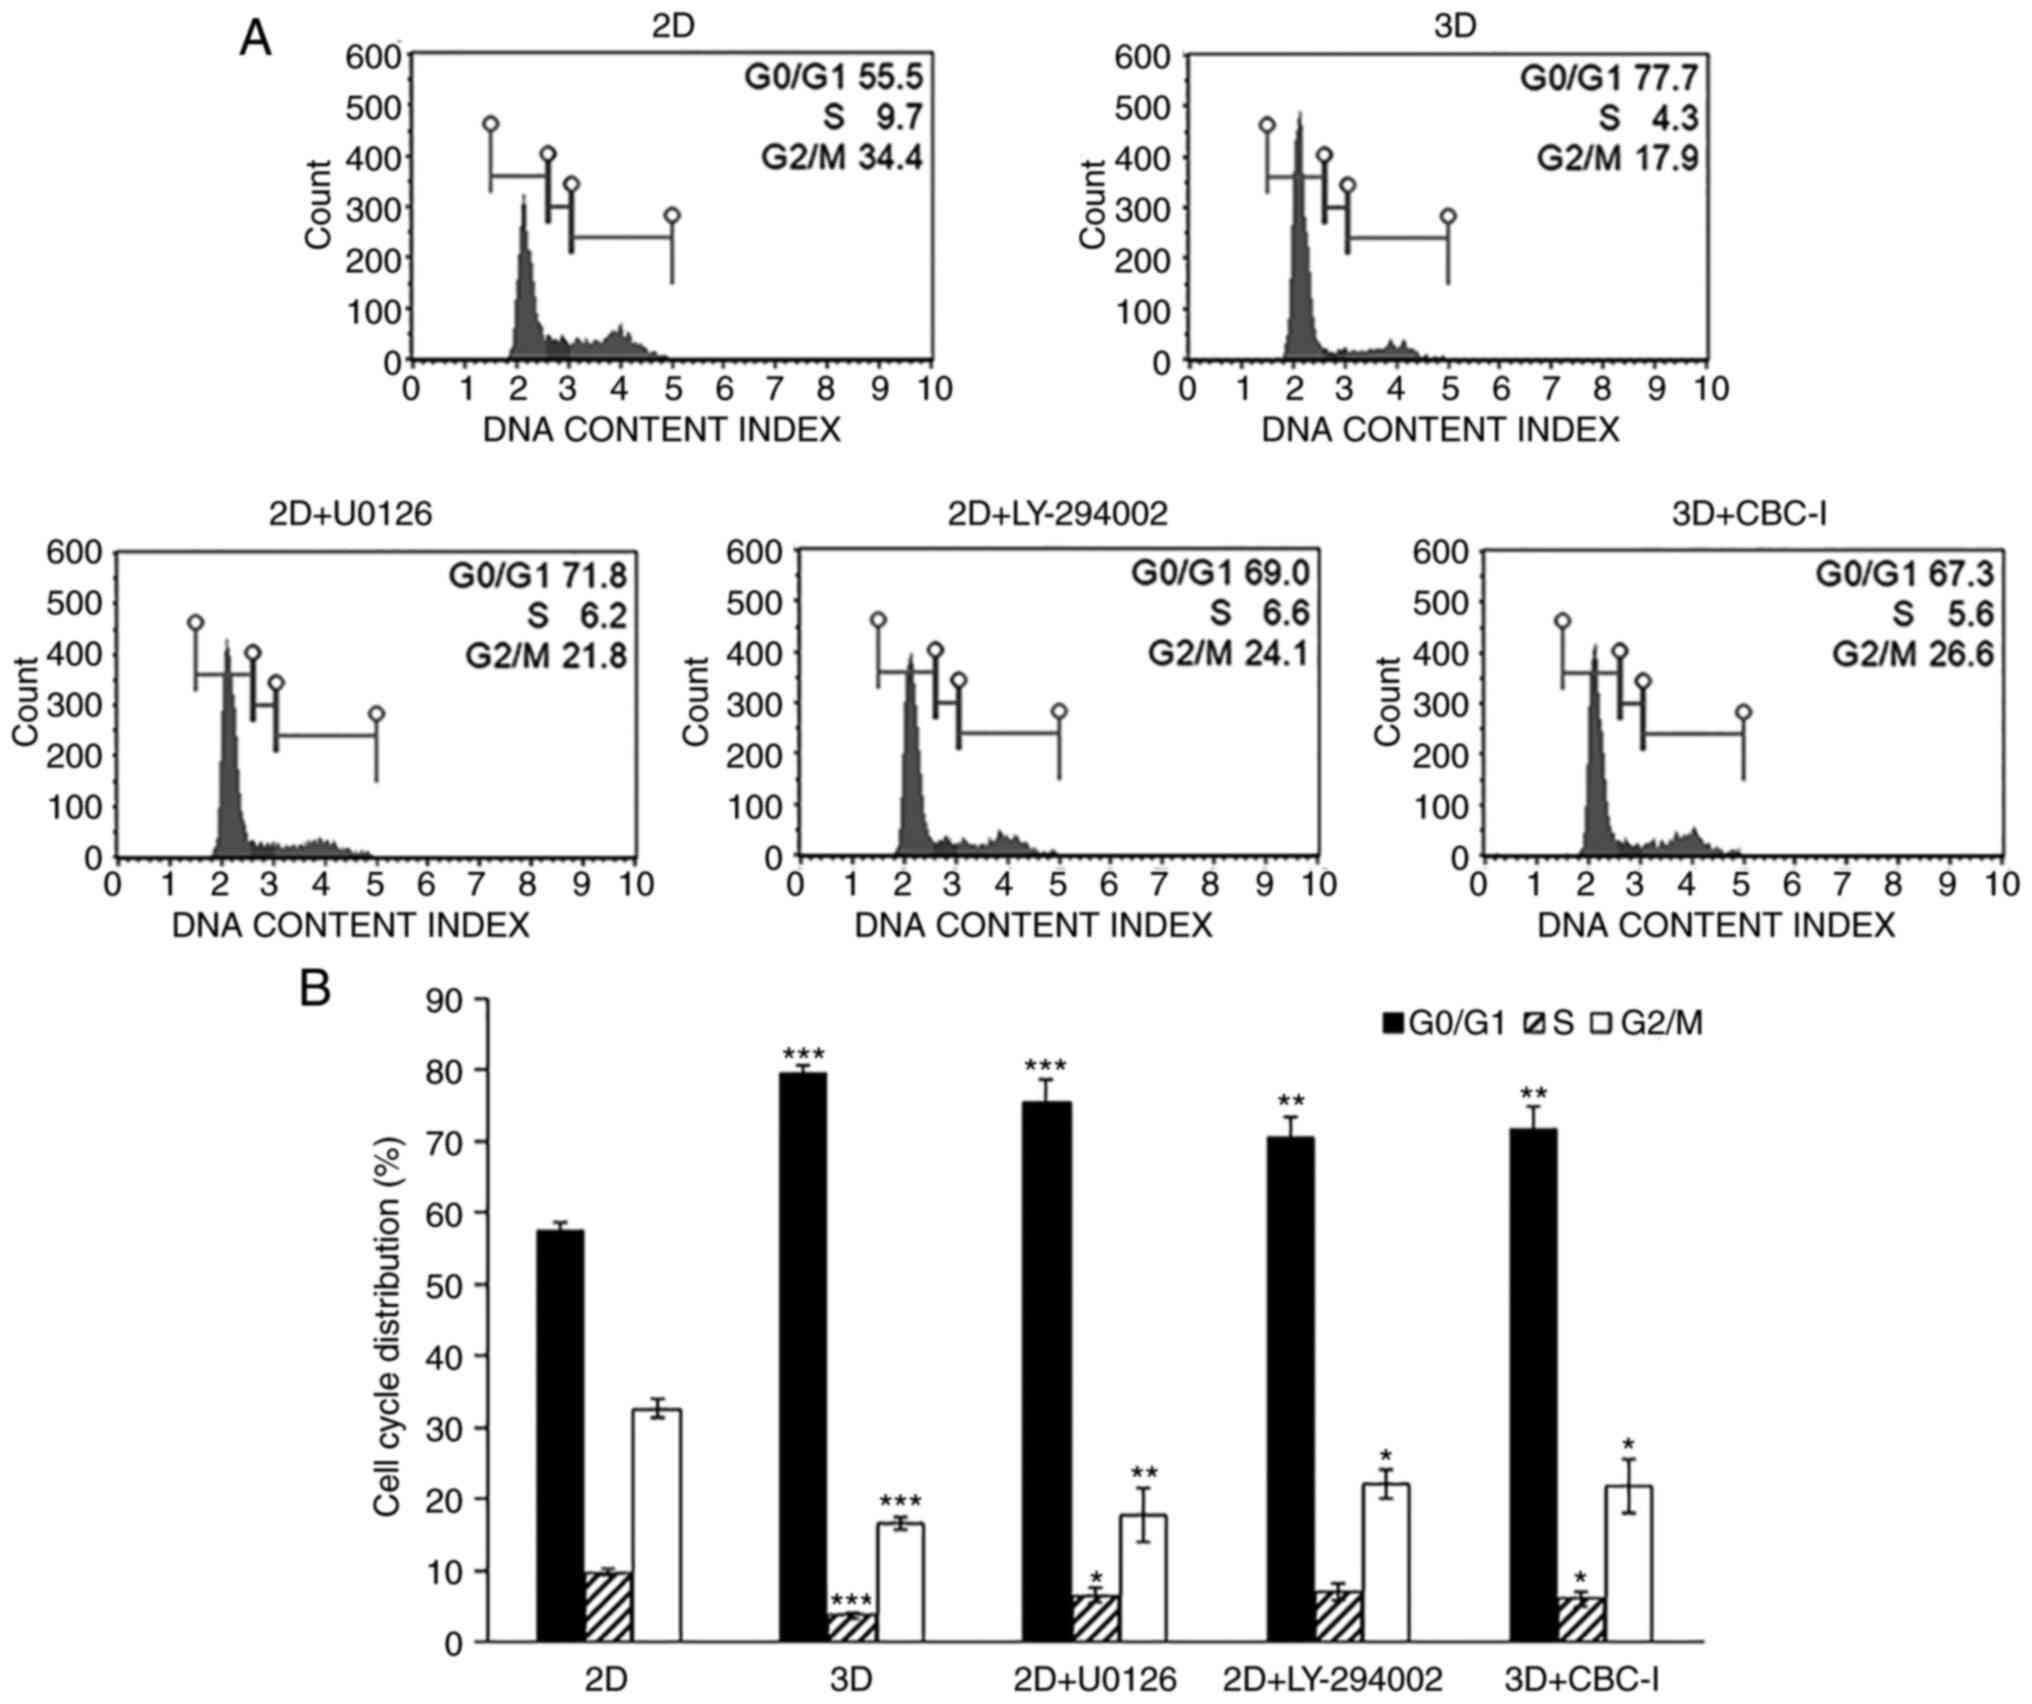
The effect of 3D culture on A549 cell cycle
progression was investigated by flow cytometric analysis. The
results demonstrated a significantly larger proportion of cells in
the G0/G1 phase in 3D-cultured A549 cells
compared with the corresponding 2D monolayer cultures (79.5±1.3 vs.
57.3±1.3%; Fig. 4). Consistent with
this result, the 3D-cultured A549 cells exhibited a decrease in the
percentage of cells in the S phase (3.8±0.4%) and G2/M
phase (16.6±0.9%), compared with the traditional 2D monolayer
(9.7±0.4 and 32.7±1.2%, respectively). These findings revealed that
cell cycle arrest at the G0/G1 phase was
induced in A549 cells cultured in 3D.
Differential response of 2D and 3D
cultured A549 cells to chemotherapy
The differences in cell responsiveness to various
chemotherapeutic agents between 2D and 3D cultivation were
investigated. Cells cultured in 2D and 3D were harvested,
dissociated into individual cells and exposed to various
concentrations of the drugs. The survival rate was determined after
48 h of incubation by MTT assays (Fig.
S1). The results demonstrated that the 3D cells display
enhanced resistance to a number of anticancer agents [doxorubicin
(24.5-fold), etoposide (22.6-fold), 2-DG (14.6-fold), CBC-I
(10.5-fold), emodin (3.8-fold), vinblastine (3.1-fold) and
paclitaxel (3.0-fold)], using a threshold value of 3-fold
difference (Table II).
| Table II.Chemosensitivity of 2D- and
3D-cultured A549 cells against various anticancer agents. |
Table II.
Chemosensitivity of 2D- and
3D-cultured A549 cells against various anticancer agents.
|
|
IC50 |
|
|
|---|
|
|
|
|
|
|---|
| Anticancer
agents | 2D | 3D | Fold change | P-value |
|---|
| Doxorubicin
(µM) | 0.8±0.0 | 18.7±2.6 | 24.5±4.2 | 0.0006 |
| Etoposide (µM) | 24.3±2.4 | 545.0±14.7 | 22.6±1.7 |
1.005×10⁻⁶ |
| 2-DG (mM) | 5.6±1.0 | 78.3±6.2 | 14.6±3.3 |
8.354×10⁻⁵ |
| CBC-I (µM) | 0.1±0.0 | 1.0±0.2 | 10.5±1.3 | 0.003 |
| Emodin (µM) | 35.0±3.2 | 131.7±7.4 | 3.8±0.1 |
7.105×10⁻⁵ |
| Vinblastine
(nM) | 27.7±2.8 | 84.0±5.3 | 3.1±0.2 | 0.0002 |
| Paclitaxel
(nM) | 11.3±1.2 | 33.3±2.6 | 3.0±0.2 | 0.0004 |
| Apigenin (µM) | 34.8±5.4 | 84.8±19.2 | 2.5±0.8 | 0.024 |
| Resveratrol
(µM) | 88.7±2.6 | 176.7±11.9 | 2.0±0.2 | 0.0005 |
| AG-490 (µM) | 59.8±4.4 | 121.7±16.5 | 2.0±0.3 | 0.007 |
| CAPE (µM) | 60.8±2.7 | 113.3±12.5 | 1.9±0.1 | 0.004 |
| Curcumin (µM) | 27.7±2.1 | 51.0±9.9 | 1.8±0.2 | 0.031 |
| Shikonin (µM) | 1.8±0.0 | 3.2±0.3 | 1.8±0.2 | 0.004 |
| Chrysin (µM) | 66.8±4.5 | 104.3±18.9 | 1.6±0.2 | 0.052 |
| DHBZ (µM) | 567.7±32.3 | 730.0±78.7 | 1.3±0.1 | 0.054 |
| Capsaicin (µM) | 181.7±2.4 | 215.0±7.1 | 1.2±0.0 | 0.003 |
| Bay 11-7085
(µM) | 15.9±2.8 | 16.8±0.6 | 1.1±0.2 | 0.665 |
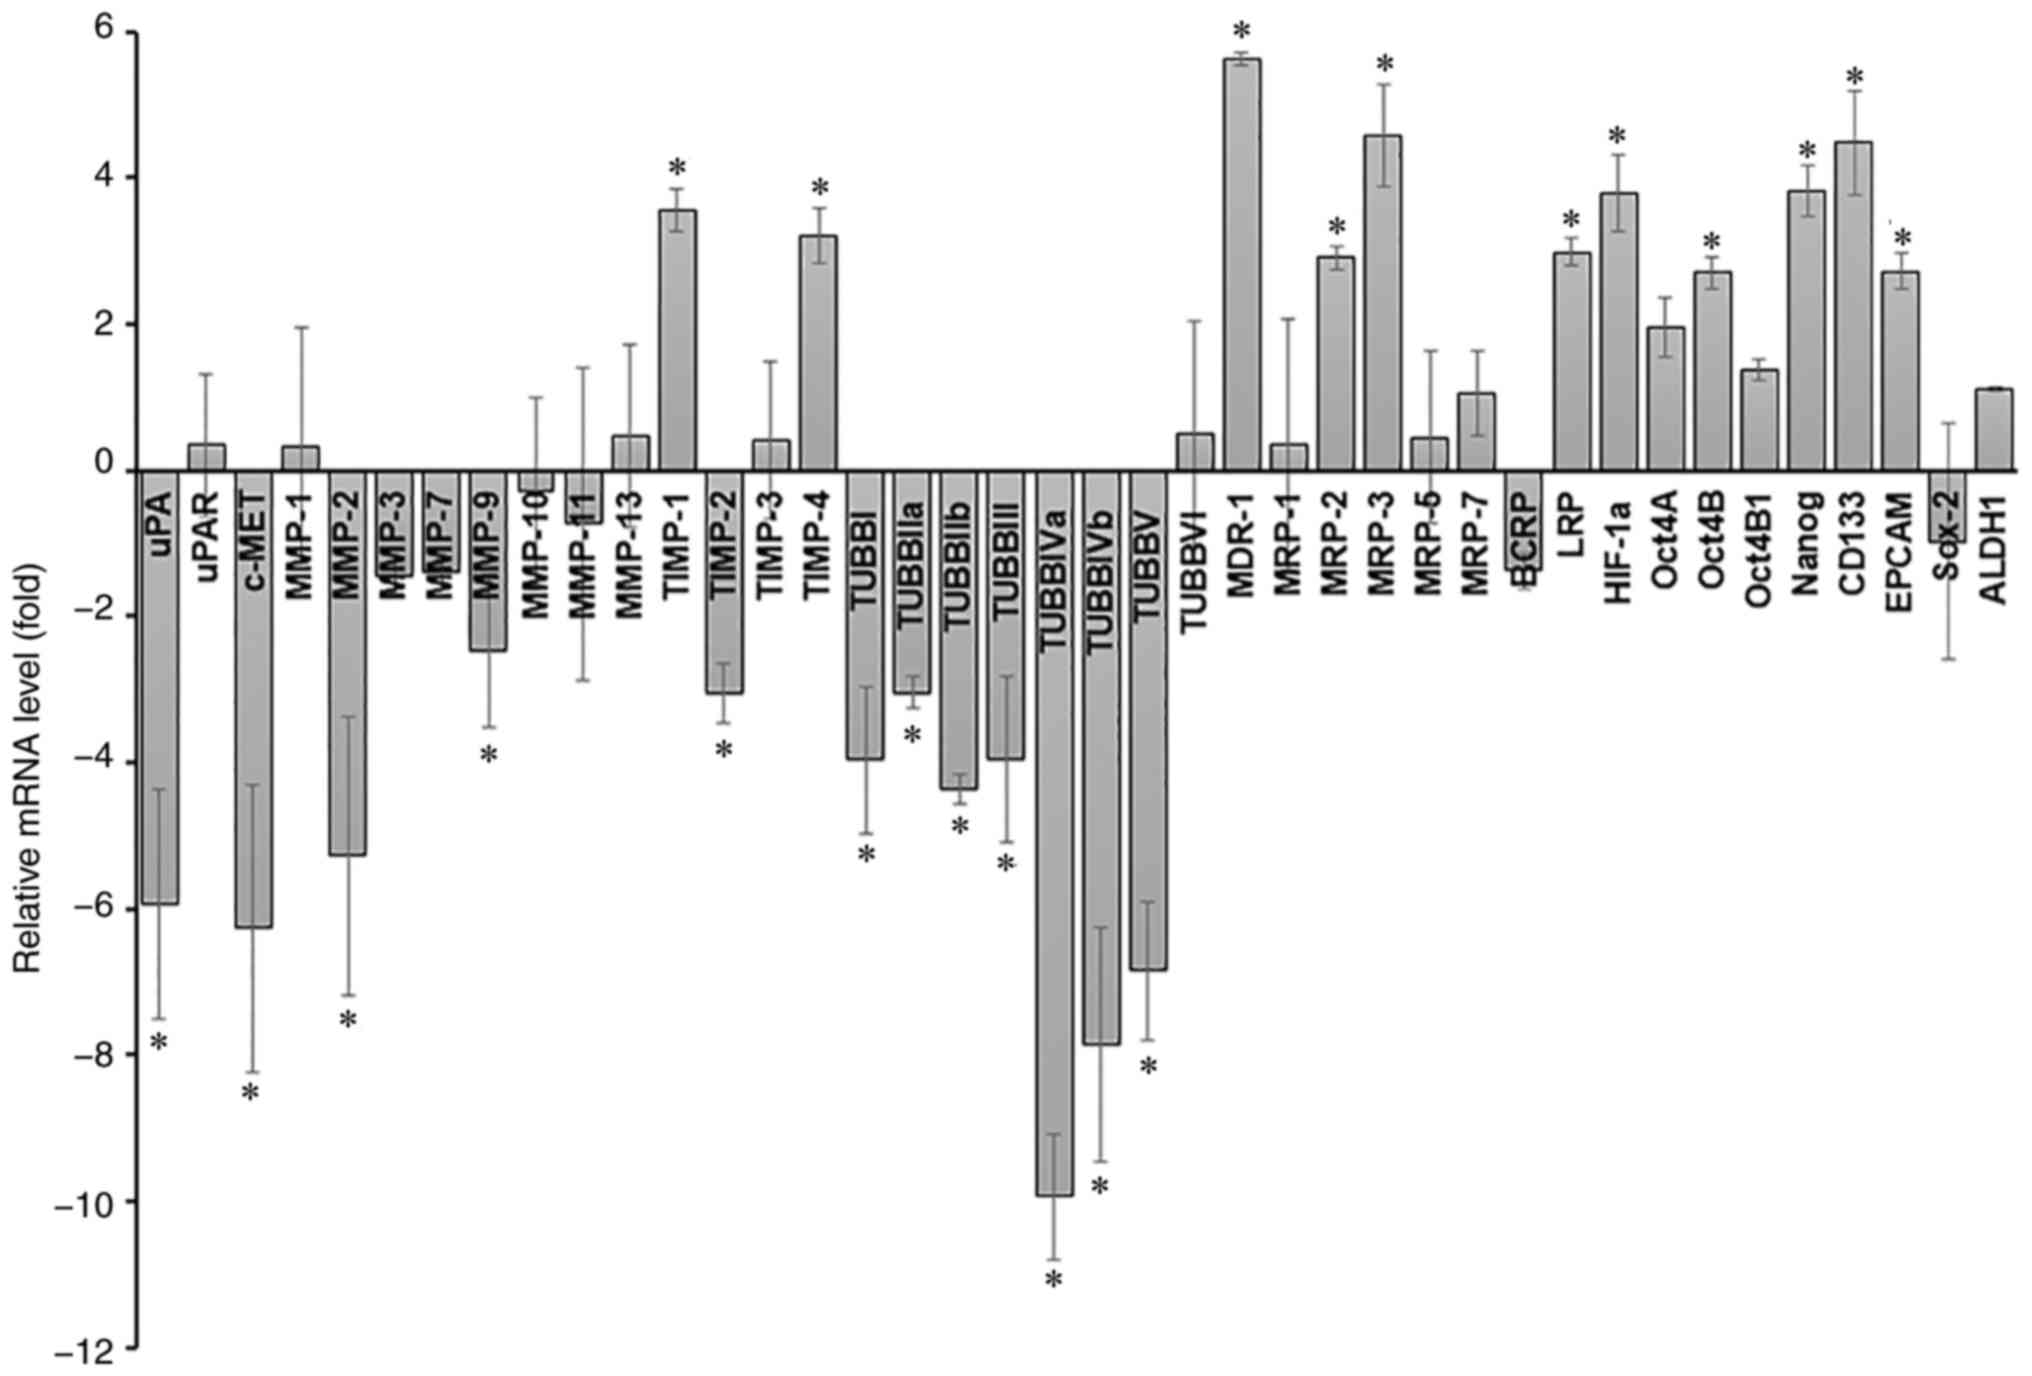
Differences in gene expression levels
of A549 cells in 2D and 3D culture
To gain insights into the molecular mechanisms
underlying the effects of the culturing system, the alterations in
gene expression patterns of A549 cells cultured under 2D and 3D
culture were examined by RT-qPCR. An array of genes associated with
tumor progression and metastasis [uPA, uPA receptor (uPAR), c-MET,
MMP-1, MMP-2, MMP-3, MMP-7, MMP-9, MMP-10, MMP-11, MMP-13, TIMP-1,
TIMP-2, TIMP-3, TIMP-4, and beta-tubulin isotypes (TUBBI, TUBBIIa,
TUBBIIb, TUBBIII, TUBBIVa, TUBBIVb, TUBBV, and TUBBVI)], drug
resistance (MDR-1, MRP-1, MRP-2, MRP-3, MRP-5, MRP-7, BCRP, and
LRP), hypoxia-associated protein (HIF-1a), and stemness marker
(Oct4A, Oct4B, Oct4B1, Nanog, CD133, EPCAM, Sox-2, and ALDH1) was
assessed. Using a 2.5-fold change in expression as a threshold
value, the results demonstrated that 11 genes were upregulated
[TIMP-1 (3.5-fold), TIMP-4 (3.2-fold), MDR-1 (5.6-fold), MRP-2
(2.9-fold), MRP-3 (4.6-fold), LRP (3.0-fold), HIF-1a (3.8-fold),
Oct4B (2.7-fold), Nanog (3.8-fold), CD133 (4.5-fold) and EPCAM
(2.7-fold)] and 12 genes were downregulated [uPA (−5.9-fold), c-MET
(−6.3-fold), MMP-2 (−5.3-fold), MMP-9 (−2.5-fold), TIMP-2
(−3.1-fold), TUBBI (−4.0-fold), TUBBIIa (−3.1-fold), TUBBIIb
(−4.4-fold), TUBBIII (−4.0-fold), TUBBIVa (−9.9-fold), TUBBIVb
(−7.9-fold), and TUBBV (−6.9-fold)] in A549 cells cultured in 3D
compared with baseline expression of corresponding 2D monolayer
cultures (Fig. 5).
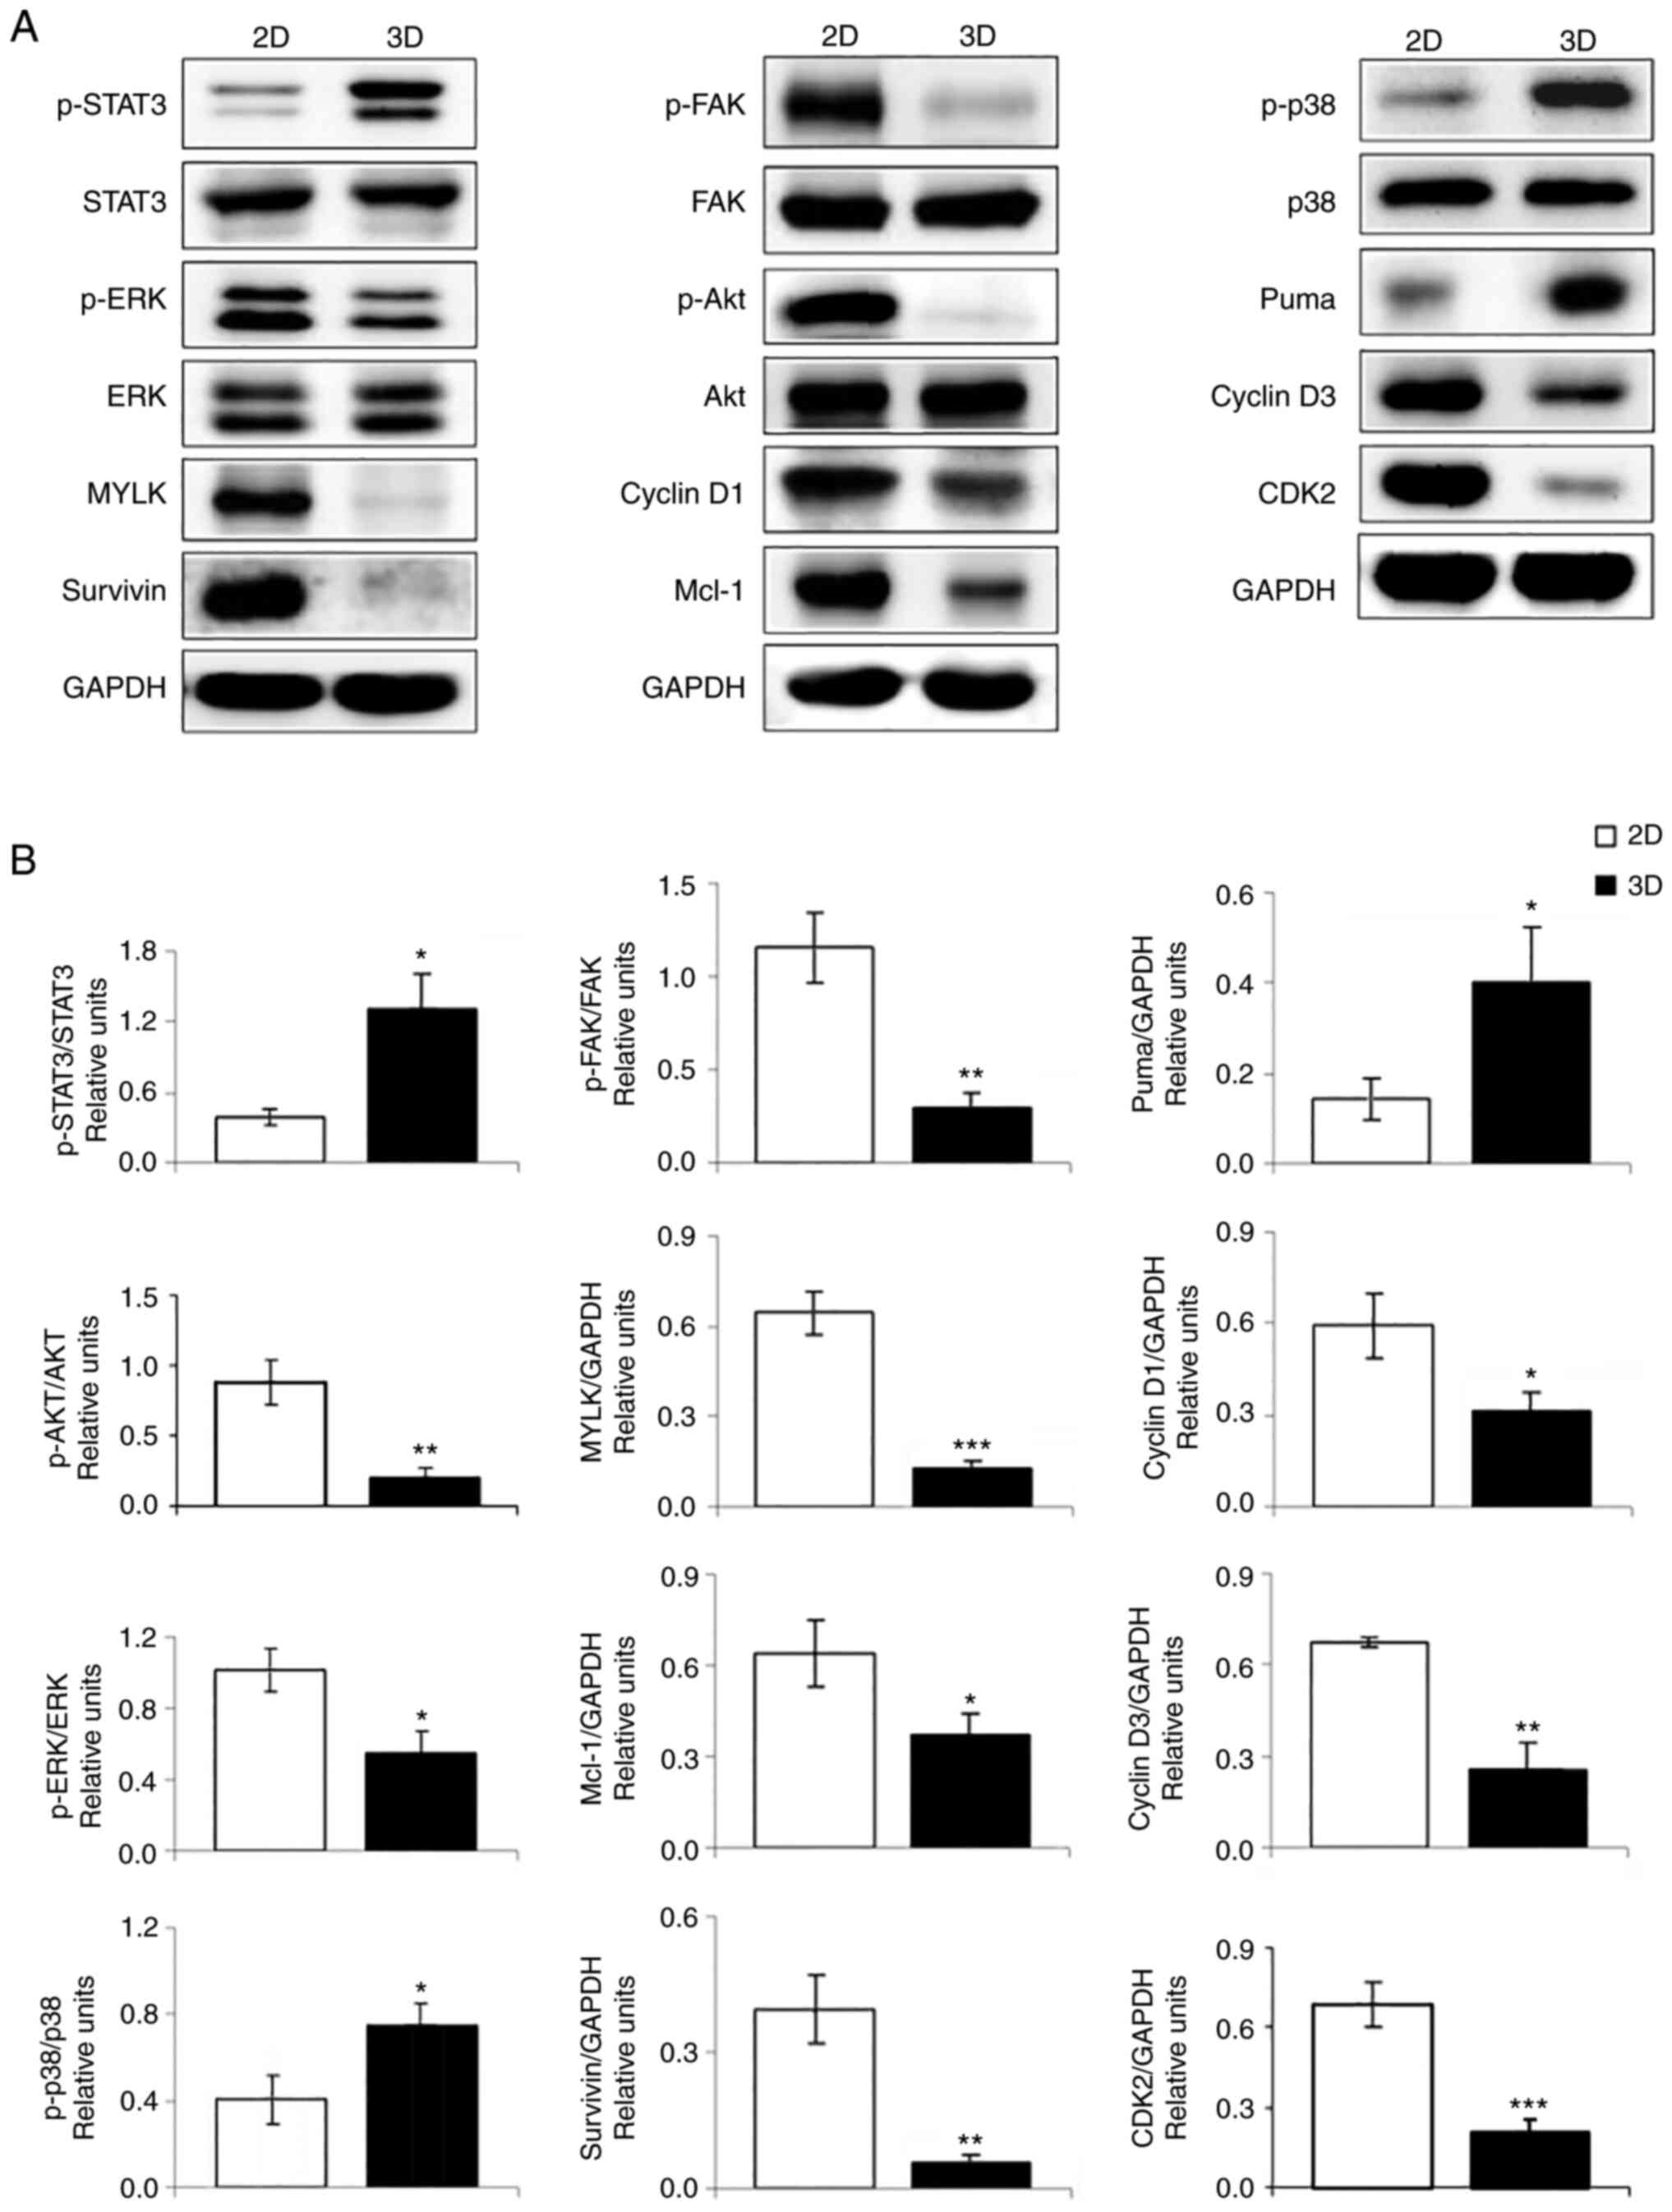
Effect of 3D in vitro culture on
protein expression
The signaling molecules linked to cell survival,
proliferation, stress, migration, apoptosis and cell cycle were
evaluated for protein expression levels by Western blot analysis.
As shown in Fig. 6, A549 cells in
3D architecture had increased expression of p-STAT3 (control of
numerous critical cellular processes, including cell proliferation,
survival, and metastasis), p-p38 (cellular stress response), and
puma (pro-apoptotic protein). Furthermore, decreased expression of
p-Akt (cell growth, proliferation, migration, and survival), p-ERK
(differentiation, proliferation, and apoptosis), p-FAK
(differentiation, cell spreading, and migration), MYLK (migration),
anti-apoptotic proteins (Mcl-1 and survivin), and cell cycle
regulators (cyclin D1, cyclin D3 and CDK2) was observed in A549
cells in 3D culture compared with those in 2D cells.
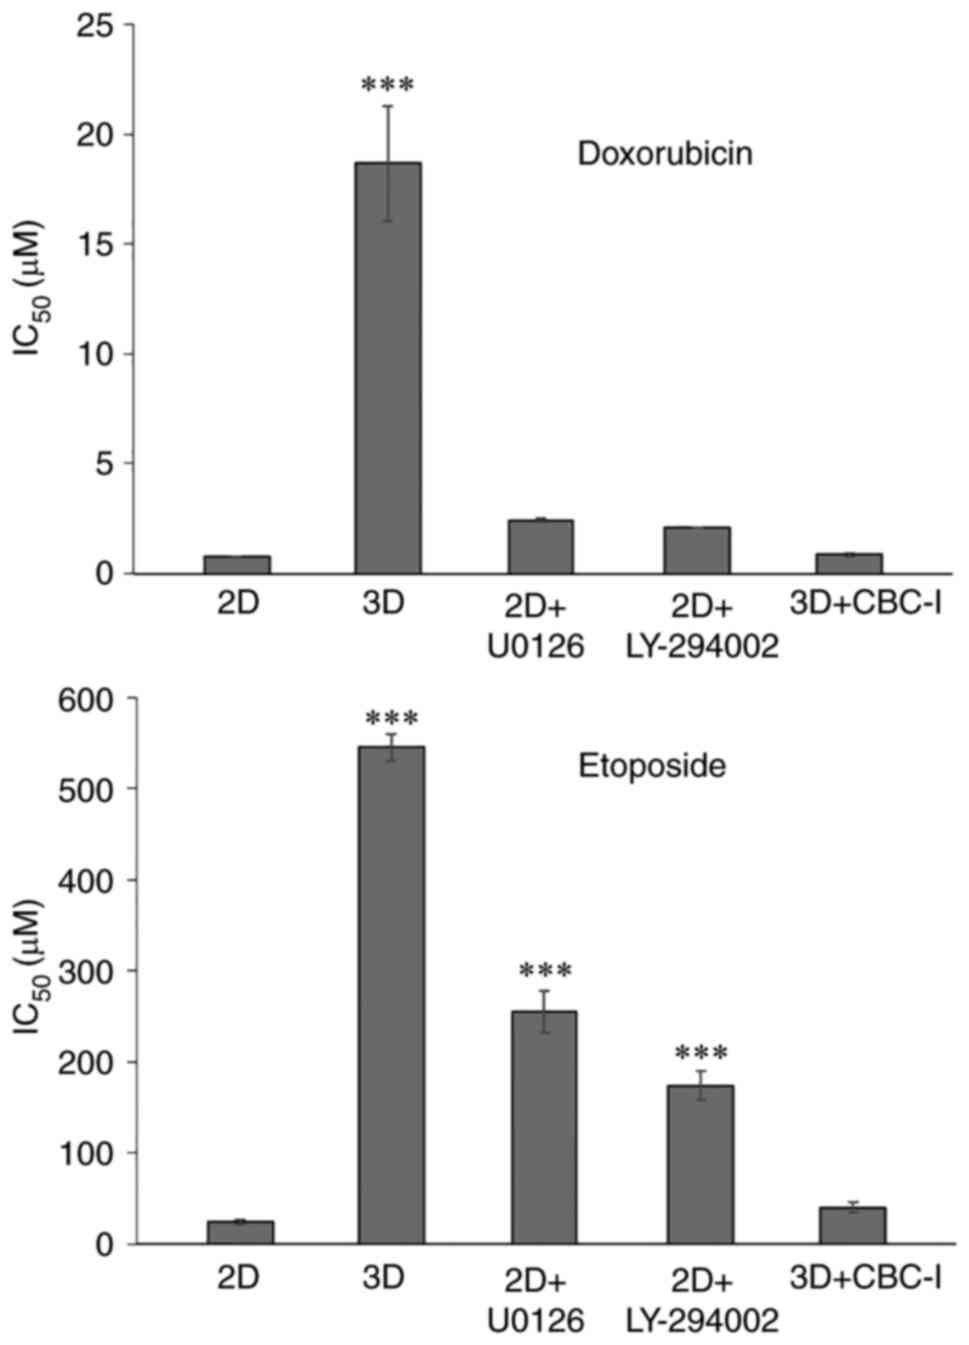
STAT3 inhibitor sensitizes A549 cells
cultured in 3D microenvironment towards doxorubicin and
etoposide-mediated cytotoxicity
Western blot analysis indicated an increased
expression level of p-STAT3 and decreased levels of p-ERK and
p-Akt, three key signaling molecules involved in numerous
biological activities. Specific inhibitors of STAT3 (CBC-I), MEK1/2
(U0126), and PI3K (LY-294002) were used to study the correlation
between these signaling nodes and dormancy, as well as
chemoresistance. The inhibitor doses were chosen to have least
impact on cell viability (with over 80% cell survival). Thus, after
treatment of A549 cells in 3D culture with 25 nM of CBC-I and
treatment of 2D monolayer cells with 30 µM of U0126 or 20 µM of
LY-294002 for 24 h prior to and during the assays, cell cycle
progression and chemosensitivity to doxorubicin and etoposide (the
most resistant drugs in the present study) were evaluated.
Doxorubicin and etoposide are well-known chemotherapeutic agents.
Although not centrally used in NSCLC, the combination of etoposide
and platinum-based anticancer drug has been studied for efficacy
and safety in the treatment of lung cancer (26). The combination of lurbinectedin and
doxorubicin is being tested as second-line therapy in a phase III
trial (27) and the combination of
photodynamic therapy and doxorubicin has been shown to improve
long-term lung cancer cure rates (28). The results showed that inhibitors of
ERK and Akt shifted the cell cycle distribution of 2D cells toward
G0/G1 phase arrest (75.6±3.1 and 70.5±2.8%
for U0126 and LY-294002 treatment, respectively; Fig. 4). These inhibitors also decreased
susceptibility to the cytotoxic effects of doxorubicin [cells
treated with U0126 or LY-294002 had IC50 values of
2.4±0.1 µM (3.2-fold) and 2.1±0.0 µM (2.7-fold), respectively;
Fig. 7] and etoposide [the
IC50 values for cells treated with U0126 or LY-294002
were 255±22.7 µM (10.7-fold) and 174±16.4 µM (7.2-fold),
respectively; Fig. 7]. The STAT3
inhibitor, although showing little to no effect on the cell cycle
(71.6±3.1% for G0/G1 phase; Fig. 4), substantially increased
doxorubicin and etoposide cytotoxicity to levels comparable to
those of the corresponding 2D cells [IC50 values were
0.9±0.1 µM (1.1-fold) and 40.2±5.2 µM (1.7-fold) for doxorubicin
and etoposide, respectively; Fig.
7]. These results highlighted the importance of p-STAT3 on
doxorubicin and etoposide resistance of A549 cells cultured in
3D.
Discussion
The large gap between studies using the 2D culture
model and the results from in vivo environment indicates the
lack of a predictive preclinical model. Accumulating research has
found that drug responses of cells in the 2D monolayer culture
model do not accurately predict clinical study outcomes (29,30).
As a consequence, numerous novel chemotherapeutic agents, that show
promising results in 2D culture, fail during clinical trials
(31,32). Given the relatively high failure
rate of the 2D culture model in drug discovery and development, 3D
culture platforms were developed to provide a higher degree of
similarity to in vivo conditions. Previous experiments have
shown that cells in 3D culture more closely imitate cell behavior,
proliferation rate, gene or protein expression profiles, signaling
and cellular responses found in living tissues and tumors, compared
with their 2D counterparts (14,33). A
previous study demonstrated that 3D cultures of epithelial ovarian
cancer cells accurately reflect the biological, histological and
molecular characteristics of primary tumors in vivo and in
xenografts than traditional 2D cell cultures (34). Earlier studies indicated that, in
terms of signaling, tumor cells undergoing 3D culture mimic in
vivo tumor biology in an improved way compared with 2D
monolayer culture model (35). As a
result of greater in vitro-to-in vivo correlations,
3D cell culture gained attention in bridging the gap between
traditional 2D monolayer and animal models, and more precisely
predicting therapeutic efficacy of drug candidates.
In contrast to the 2D culture microenvironment where
all cells receive uniformly rich nutrition and oxygenation, 3D
cultures develop gradients of nutrients, oxygen, metabolites and
waste. Therefore, proliferative gradients are established within
the 3D aggregates with proliferating cells found mainly at the
outer surface (24), while
quiescent, hypoxic, necrotic or apoptotic cells occur at the core
of the spheroid due to the restricted nutrients, growth factors,
and oxygen (36). This cellular
heterogeneity, a feature resembling in vivo tissues and
tumors, was found in A549 cells cultured in 3D culture of the
present study. Annexin V staining and flow cytometry-based
apoptosis detection indicated increased apoptosis in A549 cells
under 3D-culture compared with the 2D-cultured counterparts. A
similar finding was reported by Mishra et al (37), who showed a significantly higher
Caspase-3 staining of cells cultured in the ex vivo 3D model than
in the 2D culture. Higher expression of a pro-apoptotic protein,
puma, concurrently with the decreased levels of anti-apoptotic
proteins, Mcl-1 and survivin, observed in 3D cultures by western
blot analysis further support this notion. Consistent with these
data, the hypoxic states of the cells in 3D architecture were
detected using RT-qPCR, which revealed an increase in HIF-1a, the
master transcriptional regulator of hypoxia responses, levels.
It has previously been reported that in order to
maintain homeostasis, cells at the core of spheroids adapt their
metabolism and become quiescent prior to cell death (38). A previous study by the authors
indicated that these non-proliferating quiescent/dormant cells
residing in the G0/G1 phase could avoid cell
death induced by chemotherapeutic agents (22). Cell cycle distribution analysis of
the present results revealed that A549 cells cultured in 3D induced
G0/G1 cell cycle arrest, which could be
responsible for the acquired chemoresistance. It is well documented
that cyclin D-CDK4, cyclin D-CDK 6, and cyclin E-CDK2 complexes are
essential cell cycle machinery components which govern transition
from G1 to S phase (39). In the present study, the decreased
levels of cyclin D1 and cyclin D3 were observed in A549 cells
cultured in 3D, together with the decreased CDK2 levels, so that
the progression through the G1 phase was halted. It is
evident that the ERK to p38 activity ratio can be used to as a
determinant of in vivo cell proliferation or dormancy
(40). ERK has been demonstrated to
be negatively regulated by p38 and the high p38/ERK ratio favors
growth arrest (40), consistent
with the reduction in ERK1/2 activation and the enhanced
phosphorylation of p38 observed in 3D aggregates of A549 cells.
3D-cultivation of A549 cells caused a marked
decrease in p-FAK and MYLK, the two important mediators for cell
migration, expression (by western blotting), concurrent with the
decreased levels of a panel of beta-tubulin, the building blocks of
microtubules, (by RT-qPCR) which was also implicated in cell
migration. This is in line with the decrease in migration
capability of A549 cells undergoing 3D culture. Numerous studies
have shown that beta-tubulin is functionally linked to cell
migration; for example, Kanojia et al (41) demonstrated the overexpression of
TUBBIII in breast cancer brain metastases and the critical role of
TUBBIII in metastatic ability in vivo. A large body of
evidence now supports the significance of uPA and c-Met, a receptor
tyrosine kinase, in cancer invasion and metastasis (42,43).
Moreover, Lim et al (44)
have shown that c-Met promoted cancer cell migration and invasion
through MMP-1, MMP-2 and MMP-9 expression. These findings were in
consistency with the results of the present study, which showed
decreased invasion rate of A549 cells in 3D microenvironment that
corresponded with the decreased levels of uPA, c-Met, MMP-2 and
MMP-9. The family of TIMPs (TIMP-1 to TIMP-4) play a key role as
specific inhibitors of MMPs. Notably, Hernandez-Barrantes et
al (45) revealed that TIMP-2
has dual roles, serving as both an MMP inhibitor and a positive
regulator of MMP-2 activity. This was consistent with the decrease
in TIMP-2 and an increase in TIMP-1 and TIMP-4 mRNA levels observed
in the present study.
An abundance of evidence indicates that cancer stem
cells (CSCs), a subpopulation of cancer cells with stem-like
properties, have been strongly implicated in tumor initiation,
chemoresistance, metastasis, and relapse (46). In the present study, RT-qPCR
analysis results revealed a marked increase in the expression
levels of several stem cell markers, including Oct4B, Nanog, CD133
and EPCAM, suggesting that A549 cells acquired stem-like properties
due to 3D cultivation. Emerging data showed significant overlap
between quiescent/dormant cells and CSCs, in terms of immune
escape, quiescence and therapy resistance (47). Accumulated evidence has suggested
that the resistance to antiproliferative chemotherapy of CSCs may
be mediated by the relative quiescence (48). These data highlight the observation
that A549 cells in 3D culture and CSCs share certain
characteristics, including stemness marker expression, dormancy,
and chemotherapeutic resistance.
Drug penetration is a critical parameter influencing
response to therapy of cells in 3D culture system. In contrast to
2D cells that are equally exposed to drugs, diffusion is limited in
3D cells. However, the 3D cultured cells in the present study were
disaggregated into single cells before exposure to anticancer
agents, to allow drugs to fully penetrate the cells. The difference
in chemosensitivity observed between cells in the 2D and 3D
microenvironments was thus an intrinsic property of the cells per
se. In addition to the proliferative status of the cells, the
increased resistance to different classes of chemotherapeutic drugs
of cells in 3D architecture could be due to hypoxia, which has been
reported to play a major role in radio-/chemo-resistance (49). This supports the observation that
A549 cells in 3D model demonstrated hypoxia and increased
chemoresistance compared with 2D culture. The ATP-binding cassette
(ABC) transporter represents the ATP-driven efflux pump superfamily
that transports a wide variety of substrates across cell membranes.
Concrete evidence indicates that the MDR-1 (ABCB1, ABC subfamily B
member 1), plays a critical role in drug efflux transport and the
emergence of drug resistance (50).
MRPs (ABCC, ABC subfamily C) have been strongly implicated as
determinants of multidrug resistance in cancer cells (51). Furthermore, LRP has been shown to be
associated with drug resistance in acute myeloid leukemia (52). In support of a role for MDR-1, MRPs,
and LRP in drug resistance, the present results revealed
significantly higher levels of MDR-1, MRP-2, MRP-3 and LRP mRNA
expression, which may act in concert with each other to confer drug
resistance.
MAPK/ERK, PI3K/Akt, and STAT3, the three major
cancer-associated pathways, are responsible for a wide range of
cellular activities. Specific inhibitors of p-ERK, p-Akt and
p-STAT3 were thus used for delineating the signaling pathway
underlying increased drug resistance in 3D aggregates. In agreement
with another study showing that MEK and PI3K inhibitors inhibited
malignant pleural mesothelioma cell growth by inducing
G1 cell cycle arrest (53), the 2D-cultured cells in the current
study experience quiescence and become more resistant to
doxorubicin and etoposide, after being treated with specific MEK
and PI3K/Akt inhibitors. However, the level of resistance was not
comparable to that of cells cultured in the 3D manner, suggesting
that the enhanced chemoresistance of 2D cells treated with specific
inhibitors was most likely due to cell cycle arrest, since active
cell proliferation is required for antiproliferative agents such as
doxorubicin and etoposide. More importantly, the STAT3 inhibitor
reverses doxorubicin and etoposide resistance in 3D-cultured A549
cells, underlining the critical role of p-STAT3 in mediating drug
resistance. The JAK/STAT3 pathway has been implicated in enhanced
resistance to a wide range of targeted cancer therapies and
chemotherapies (54). This was
consistent with a recent study showing that JAK/STAT3 suppression
counteracts the cancer-associated fibroblast-induced
chemoresistance of gastric cancer cells (55). A previous study has linked the STAT3
signaling pathway to the expression of multidrug resistance
proteins such as MDR-1, MRPs and BCRP (56), which further supports the findings
of the current study. A recent study demonstrated that
JAK/STAT3/PD-L1 pathway has been associated with ATM-mediated
cisplatin-resistance, epithelial-to-mesenchymal transition and
metastatic potential of lung cancer cells (57). Parallel research using a 3D
microfluidic platform revealed that growth factors in the TME can
provide a survival advantage and modulate chemoresistance in tumor
cells. CAF-derived HGF was found to activate Met/PI3K/AKT,
upregulate GRP78 and inhibit paclitaxel-induced apoptosis in A549
cells (58). A similar study found
a link between the PI3K/Akt pathway, occludin expression and
resistance to anticancer drugs in an A549 spheroid culture model
(59).
As cancer therapeutics shift toward molecularly
targeted therapies, which are drugs designed to block specific
molecules involved in carcinogenesis, tumor growth and metastasis,
highlight the importance of 3D culture systems for discovering new
targets that conventional 2D cultures do not reveal. Immune
checkpoint therapies have represented a cancer treatment
breakthrough by preventing inhibitory checkpoint proteins from
interacting with their partner proteins, thereby restoring
cytotoxic T cell activity to attack cancer cells. Notably,
currently approved immune checkpoint inhibitors such as PD-1, PD-L1
and CTLA-4 have been used to treat a variety of cancers (60). Although checkpoint blockade
immunotherapy is a promising therapeutic strategy, the use of
immune checkpoint inhibitors as monotherapy remains limited due to
an unsatisfactory therapeutic effect. Furthermore, additional
research has revealed that molecular targeted agents have
immunostimulatory or immunosuppressive properties that impair
therapeutic efficacy (61). As a
result, combining molecularly targeted therapies with immune
checkpoint therapies could be a potentially effective strategy for
improving therapeutic responses. Indeed, various combination
strategies are being investigated and have demonstrated significant
synergistic treatment efficacy (62).
Cancer is a heterogeneous disease and cancer
heterogeneity has long been recognized to play a significant role
in treatment response. Cells cultured in 3D capture the
heterogeneous nature of cancer biology while also preserving other
key characteristics such as the highly complex 3D arrangement and
the restoration of important microenvironmental cues. Although the
3D aggregates were not uniformly sized, the rates of
reproducibility were quite high, as evidenced by the drug
sensitivity results. The presence of proliferative and metabolic
gradients in 3D aggregates, as well as restricted nutrition and
oxygenation, mimics the in vivo microenvironment in an
improved way and represents a significant improvement of 3D
cultures over conventional 2D models. Furthermore, when compared
with animal models, 3D culture systems are simple, fast,
cost-effective and can reduce ethical concerns. However, 3D culture
systems do not fully imitate the in vivo complexity of
tumors. Current 3D models lack the complex vascular systems that
provide nutrients, oxygenation and waste removal, and thus only
represent the environment of avascular tumors. Moreover, their high
costs in comparison to 2D cultures may be one of the practical
challenges to their use as a routine approach in preclinical drug
development. The present study adopted a model system that allowed
cell-cell and cell-ECM interactions to mimic the complex in
vivo architecture and microenvironment. However, one of the
limitations to the present study is that the molecular targets and
mechanisms underlying chemoresistance were determined only in
3D-cultured A549 cells. The response of the cells may differ
depending on the cell type. Some cells slow their proliferation
rate, while others grow rapidly when they come into contact with
ECM proteins. Additional studies are planned using more and
different types of cancer cell lines.
In summary, the present study demonstrated that the
STAT3 signaling pathway could be a key mechanism underlying the 3D
culture-induced chemoresistance of A549 cells. STAT3-targeted
inhibition is therefore proposed as a promi-sing strategy for
increasing the efficacy of chemotherapeutic agents in A549 cells
under 3D culture. The differences in the cellular responses among
culture conditions described in the current study underscores the
importance of complex crosstalks established between cancer cells,
neighboring cells, as well as the surrounding ECM that ultimately
influence gene and protein expression. The current standard
procedure for screening compounds in drug discovery begins with 2D
cell culture tests and progresses to animal model tests, and
finally clinical trials. However, drug responses in 2D culture
tests do not accurately predict clinical study outcomes. Thus,
before proceeding to animal testing, it may be advantageous to
incorporate 3D studies into drug screening programs as in
vitro alternatives. Data from 3D models could lead to more
efficient animal testing and a reduction in the number of animals
used. These findings strongly suggest the potential application of
the 3D culture systems as in vitro alternatives for
preclinical drug development.
Supplementary Material
Supporting Data
Acknowledgements
Not applicable.
Funding
The present study was supported by the Thailand Science Research
and Innovation (TSRI), Chulabhorn Research Institute (grant no.
36821/4274354).
Availability of data and materials
The datasets used and/or analyzed during the current
study are available from the corresponding author on reasonable
request.
Authors' contributions
SK designed the study, performed the experiments,
interpreted the data and wrote the manuscript. TS and NO performed
sample preparation and western blot analysis. LN performed RT-qPCR
and wrote the manuscript. JS contributed to the conception of the
work, supervised the study design, and corrected the manuscript. SK
and LN confirm the authenticity of all the raw data. All authors
read and approved the final manuscript.
Ethics approval and consent to
participate
Not applicable.
Patient consent for publication
Not applicable.
Competing interests
The authors declare that they have no competing
interests.
References
|
1
|
Sung H, Ferlay J, Siegel RL, Laversanne M,
Soerjomataram I, Jemal A and Bray F: Global cancer statistics 2020:
GLOBOCAN estimates of incidence and mortality worldwide for 36
cancers in 185 countries. CA Cancer J Clin. 71:209–249. 2021.
View Article : Google Scholar : PubMed/NCBI
|
|
2
|
World Health Organization (WHO), . Cancer.
WHO; Geneva: 2022, https://www.who.int/news-room/fact-sheets/detail/cancerFebruary
3–2022
|
|
3
|
Jemal A, Siegel R, Ward E, Hao Y, Xu J and
Thun MJ: Cancer statistics, 2009. CA Cancer J Clin. 59:225–249.
2009. View Article : Google Scholar : PubMed/NCBI
|
|
4
|
Savage P, Stebbing J, Bower M and Crook T:
Why does cytotoxic chemotherapy cure only some cancers? Nat Clin
Pract Oncol. 6:43–52. 2009. View Article : Google Scholar : PubMed/NCBI
|
|
5
|
Mansoori B, Mohammadi A, Davudian S,
Shirjang S and Baradaran B: The different mechanisms of cancer drug
resistance: A brief review. Adv Pharm Bull. 7:339–348. 2017.
View Article : Google Scholar : PubMed/NCBI
|
|
6
|
Аrtykov АА, Belov DA, Shipunova VO,
Trushina DB, Deyev SM, Dolgikh DA, Kirpichnikov MP and Gasparian
ME: Chemotherapeutic agents sensitize resistant cancer cells to the
DR5-specific variant DR5-B more efficiently than to TRAIL by
modulating the surface expression of death and decoy receptors.
Cancers (Basel). 12:11292020. View Article : Google Scholar
|
|
7
|
Kim YH, Shin EA, Jung JH, Park JE, Koo J,
Koo JI, Shim BS and Kim SH: Galbanic acid potentiates TRAIL induced
apoptosis in resistant non-small cell lung cancer cells via
inhibition of MDR1 and activation of caspases and DR5. Eur J
Pharmacol. 847:91–96. 2019. View Article : Google Scholar : PubMed/NCBI
|
|
8
|
Kim MS, Haney MJ, Zhao Y, Mahajan V,
Deygen I, Klyachko NL, Inskoe E, Piroyan A, Sokolsky M, Okolie O,
et al: Development of exosome-encapsulated paclitaxel to overcome
MDR in cancer cells. Nanomedicine. 12:655–664. 2016. View Article : Google Scholar : PubMed/NCBI
|
|
9
|
Weaver VM, Fischer AH, Peterson OW and
Bissell MJ: The importance of the microenvironment in breast cancer
progression: Recapitulation of mammary tumorigenesis using a unique
human mammary epithelial cell model and a three-dimensional culture
assay. Biochem Cell Biol. 74:833–851. 1996. View Article : Google Scholar : PubMed/NCBI
|
|
10
|
Hanahan D: Hallmarks of cancer: New
dimensions. Cancer Discov. 12:31–46. 2022. View Article : Google Scholar : PubMed/NCBI
|
|
11
|
Hanahan D and Coussens LM: Accessories to
the crime: Functions of cells recruited to the tumor
microenvironment. Cancer Cell. 21:309–322. 2012. View Article : Google Scholar : PubMed/NCBI
|
|
12
|
Bhadriraju K and Chen CS: Engineering
cellular microenvironments to improve cell-based drug testing. Drug
Discov Today. 7:612–620. 2002. View Article : Google Scholar : PubMed/NCBI
|
|
13
|
Ashworth A, Balkwill F, Bast RC, Berek JS,
Kaye A, Boyd JA, Mills G, Weinstein JN, Woolley K and Workman P:
Opportunities and challenges in ovarian cancer research, a
perspective from the 11th Ovarian cancer action/HHMT Forum, Lake
Como, March 2007. Gynecol Oncol. 108:652–657. 2008. View Article : Google Scholar : PubMed/NCBI
|
|
14
|
Gurski LA, Petrelli NJ, Jia X and
Farach-Carson MC: 3D matrices for anti-cancer drug testing and
development. Oncol Issues. 25:20–25. 2010. View Article : Google Scholar
|
|
15
|
Baharvand H, Hashemi SM, Kazemi Ashtiani S
and Farrokhi A: Differentiation of human embryonic stem cells into
hepatocytes in 2D and 3D culture systems in vitro. Int J Dev Biol.
50:645–652. 2006. View Article : Google Scholar : PubMed/NCBI
|
|
16
|
Amann A, Gamerith G, Huber JM, Zwierzina
M, Hilbe W and Zwierzina H: Predicting drug sensitivity by 3D cell
culture models. Memo. 8:77–80. 2015. View Article : Google Scholar
|
|
17
|
Huber JM, Amann A, Koeck S, Lorenz E, Kelm
JM, Obexer P, Zwierzina H and Gamerith G: Evaluation of assays for
drug efficacy in a three-dimensional model of the lung. J Cancer
Res Clin. 142:1955–1966. 2016. View Article : Google Scholar : PubMed/NCBI
|
|
18
|
Takahashi Y, Hori Y, Yamamoto T, Urashima
T, Ohara Y and Tanaka H: 3D spheroid cultures improve the metabolic
gene expression profiles of HepaRG cells. Biosci Rep.
35:e002082015. View Article : Google Scholar : PubMed/NCBI
|
|
19
|
Wiśniewski JR, Vildhede A, Norén A and
Artursson P: In-depth quantitative analysis and comparison of the
human hepatocyte and hepatoma cell line HepG2 proteomes. J
Proteomics. 136:234–247. 2016. View Article : Google Scholar : PubMed/NCBI
|
|
20
|
Lee GY, Kenny PA, Lee EH and Bissell MJ:
Three-dimensional culture models of normal and malignant breast
epithelial cells. Nat Methods. 4:359–365. 2007. View Article : Google Scholar : PubMed/NCBI
|
|
21
|
Keeratichamroen S, Lirdprapamongkol K,
Thongnest S, Boonsombat J, Chawengrum P, Sornprachum T, Sirirak J,
Verathamjamras C, Ornnork N, Ruchirawat S and Svasti J:
JAK2/STAT3-mediated dose-dependent cytostatic and cytotoxic effects
of sesquiterpene lactones from Gymnanthemum extensum on A549 human
lung carcinoma cells. Oncol Rep. 47:62022. View Article : Google Scholar : PubMed/NCBI
|
|
22
|
Keeratichamroen S, Lirdprapamongkol K and
Svasti J: Mechanism of ECM-induced dormancy and chemoresistance in
A549 human lung carcinoma cells. Oncol Rep. 39:1765–1774.
2018.PubMed/NCBI
|
|
23
|
Livak KJ and Schmittgen TD: Analysis of
relative gene expression data using real-time quantitative PCR and
the 2(−Delta Delta C(T)) method. Methods. 25:402–408. 2001.
View Article : Google Scholar : PubMed/NCBI
|
|
24
|
Khaitan D, Chandna S, Arya MB and
Dwarakanath BS: Establishment and characterization of multicellular
spheroids from a human glioma cell line; implications for tumor
therapy. J Transl Med. 4:122006. View Article : Google Scholar : PubMed/NCBI
|
|
25
|
Mehta G, Hsiao AY, Ingram M, Luker GD and
Takayama S: Opportunities and challenges for use of tumor spheroids
as models to test drug delivery and efficacy. J Control Release.
164:192–204. 2012. View Article : Google Scholar : PubMed/NCBI
|
|
26
|
Wang Z, Mai S, Lv P, Xu L and Wang Y:
Etoposide plus cisplatin chemotherapy improves the efficacy and
safety of small cell lung cancer. Am J Transl Res. 13:12825–12833.
2021.PubMed/NCBI
|
|
27
|
Olmedo ME, Forster M, Moreno V,
López-Criado MP, Braña I, Flynn M, Doger B, de Miguel M,
López-Vilariño JA, Núñez R, et al: Efficacy and safety of
lurbinectedin and doxorubicin in relapsed small cell lung cancer.
Results from an expansion cohort of a phase I study. Invest New
Drugs. 39:1275–1283. 2021. View Article : Google Scholar : PubMed/NCBI
|
|
28
|
Cacaccio JC, Durrani FA, Missert JR and
Pandey RK: Photodynamic therapy in combination with doxorubicin is
superior to monotherapy for the treatment of lung cancer.
Biomedicines. 10:8572022. View Article : Google Scholar : PubMed/NCBI
|
|
29
|
Gomez-Roman N, Stevenson K, Gilmour L,
Hamilton G and Chalmers AJ: A novel 3D human glioblastoma cell
culture system for modeling drug and radiation responses. Neuro
Oncol. 19:229–241. 2017.PubMed/NCBI
|
|
30
|
Aljitawi OS, Li D, Xiao Y, Zhang D,
Ramachandran K, Stehno-Bittel L, Van Veldhuizen P, Lin TL,
Kambhampati S and Garimella R: A novel three-dimensional
stromal-based model for in vitro chemotherapy sensitivity testing
of leukemia cells. Leuk Lymphoma. 55:378–391. 2014. View Article : Google Scholar : PubMed/NCBI
|
|
31
|
Kola I: The state of innovation in drug
development. Clin Pharmacol Ther. 83:227–230. 2008. View Article : Google Scholar : PubMed/NCBI
|
|
32
|
Zanoni M, Piccinini F, Arienti C, Zamagni
A, Santi S, Polico R, Bevilacqua A and Tesei A: 3D tumor spheroid
models for in vitro therapeutic screening: A systematic approach to
enhance the biological relevance of data obtained. Sci Rep.
6:191032016. View Article : Google Scholar : PubMed/NCBI
|
|
33
|
Giannattasio A, Weil S, Kloess S, Ansari
N, Stelzer EH, Cerwenka A, Steinle A, Koehl U and Koch J:
Cytotoxicity and infiltration of human NK cells in in vivo-like
tumor spheroids. BMC Cancer. 15:3512015. View Article : Google Scholar : PubMed/NCBI
|
|
34
|
Lee JM, Mhawech-Fauceglia P, Lee N,
Parsanian LC, Lin YG, Gayther SA and Lawrenson K: A
three-dimensional microenvironment alters protein expression and
chemosensitivity of epithelial ovarian cancer cells in vitro. Lab
Invest. 93:528–542. 2013. View Article : Google Scholar : PubMed/NCBI
|
|
35
|
Edmondson R, Broglie JJ, Adcock AF and
Yang L: Three-dimensional cell culture systems and their
applications in drug discovery and cell-based biosensors. Assay
Drug Dev Technol. 12:207–218. 2014. View Article : Google Scholar : PubMed/NCBI
|
|
36
|
Riffle S and Hegde RS: Modeling tumor cell
adaptations to hypoxia in multicellular tumor spheroids. J Exp Clin
Cancer Res. 36:1022017. View Article : Google Scholar : PubMed/NCBI
|
|
37
|
Mishra DK, Sakamoto JH, Thrall MJ, Baird
BN, Blackmon SH, Ferrari M, Kurie JM and Kim MP: Human lung cancer
cells grown in an ex vivo 3D lung model produce matrix
metalloproteinases not produced in 2D culture. PLoS One.
7:e453082012. View Article : Google Scholar : PubMed/NCBI
|
|
38
|
Walenta S, Dötsch J, Bourrat-Flöck B and
Mueller-Klieser W: Size-dependent oxygenation and energy status in
multicellular tumor spheroids. Adv Exp Med Biol. 277:889–893. 1990.
View Article : Google Scholar : PubMed/NCBI
|
|
39
|
Topacio BR, Zatulovskiy E, Cristea S, Xie
S, Tambo CS, Rubin SM, Sage J, Kõivomägi M and Skotheim JM: Cyclin
D-Cdk4,6 drives cell-cycle progression via the retinoblastoma
protein's C-terminal helix. Mol Cell. 74:758–770.e4. 2019.
View Article : Google Scholar : PubMed/NCBI
|
|
40
|
Aguirre-Ghiso JA, Estrada Y, Liu D and
Ossowski L: ERK(MAPK) activity as a determinant of tumor growth and
dormancy; regulation by p38(SAPK). Cancer Res. 63:1684–1695.
2003.PubMed/NCBI
|
|
41
|
Kanojia D, Morshed RA, Zhang L, Miska JM,
Qiao J, Kim JW, Pytel P, Balyasnikova IV, Lesniak MS and Ahmed AU:
βIII-tubulin regulates breast cancer metastases to the brain. Mol
Cancer Ther. 14:1152–1161. 2015. View Article : Google Scholar : PubMed/NCBI
|
|
42
|
Duffy MJ: The urokinase plasminogen
activator system: Role in malignancy. Curr Pharm Des. 10:39–49.
2004. View Article : Google Scholar : PubMed/NCBI
|
|
43
|
Nan L, Qin T, Xiao Y, Qian W, Li J, Wang
Z, Ma J, Ma Q and Wu Z: Pancreatic stellate cells facilitate
perineural invasion of pancreatic cancer via HGF/c-Met pathway.
Cell Transplant. 28:1289–1298. 2019. View Article : Google Scholar : PubMed/NCBI
|
|
44
|
Lim YC, Han JH, Kang HJ, Kim YS, Lee BH,
Choi EC and Kim CH: Overexpression of c-Met promotes invasion and
metastasis of small oral tongue carcinoma. Oral Oncol.
48:1114–1119. 2012. View Article : Google Scholar : PubMed/NCBI
|
|
45
|
Hernandez-Barrantes S, Shimura Y, Soloway
PD, Sang QA and Fridman R: Differential roles of TIMP-4 and TIMP-2
in pro-MMP-2 activation by MT1-MMP. Biochem Biophys Res Commun.
281:126–130. 2001. View Article : Google Scholar : PubMed/NCBI
|
|
46
|
Lu KH, Chen YW, Tsai PH, Tsai ML, Lee YY,
Chiang CY, Kao CL, Chiou SH, Ku HH, Lin CH and Chen YJ: Evaluation
of radiotherapy effect in resveratrol-treated medulloblastoma
cancer stem-like cells. Childs Nerv Syst. 25:543–550. 2009.
View Article : Google Scholar : PubMed/NCBI
|
|
47
|
Talukdar S, Bhoopathi P, Emdad L, Das S,
Sarkar D and Fisher PB: Dormancy and cancer stem cells: An enigma
for cancer therapeutic targeting. Adv Cancer Res. 141:43–84. 2019.
View Article : Google Scholar : PubMed/NCBI
|
|
48
|
Arai F and Suda T: Maintenance of
quiescent hematopoietic stem cells in the osteoblastic niche. Ann N
Y Acad Sci. 1106:41–53. 2007. View Article : Google Scholar : PubMed/NCBI
|
|
49
|
Olive PL and Durand RE: Drug and radiation
resistance in spheroids: Cell contact and kinetics. Cancer
Metastasis Rev. 13:121–138. 1994. View Article : Google Scholar : PubMed/NCBI
|
|
50
|
Fardel O, Payen L, Courtois A, Vernhet L
and Lecureur V: Regulation of biliary drug efflux pump expression
by hormones and xenobiotics. Toxicology. 167:37–46. 2001.
View Article : Google Scholar : PubMed/NCBI
|
|
51
|
Korita PV, Wakai T, Shirai Y, Matsuda Y,
Sakata J, Takamura M, Yano M, Sanpei A, Aoyagi Y, Hatakeyama K and
Ajioka Y: Multidrug resistance-associated protein 2 determines the
efficacy of cisplatin in patients with hepatocellular carcinoma.
Oncol Rep. 23:965–972. 2010.PubMed/NCBI
|
|
52
|
Pirker R, Pohl G, Stranzl T, Suchomel RW,
Scheper RJ, Jäger U, Geissler K, Lechner K and Filipits M: The lung
resistance protein (LRP) predicts poor outcome in acute myeloid
leukemia. Adv Exp Med Biol. 457:133–139. 1999. View Article : Google Scholar : PubMed/NCBI
|
|
53
|
Miyoshi S, Hamada H, Hamaguchi N, Kato A,
Katayama H, Irifune K, Ito R, Miyazaki T, Okura T and Higaki J:
Antitumor activity of MEK and PI3K inhibitors against malignant
pleural mesothelioma cells in vitro and in vivo. Int
J Oncol. 41:449–456. 2012. View Article : Google Scholar : PubMed/NCBI
|
|
54
|
Resemann HK, Watson CJ and Lloyd-Lewis B:
The Stat3 paradox: A killer and an oncogene. Mol Cell Endocrinol.
382:603–611. 2014. View Article : Google Scholar : PubMed/NCBI
|
|
55
|
Ham IH, Wang L, Lee D, Woo J, Kim TH,
Jeong HY, Oh HJ, Choi KS, Kim TM and Hur H: Curcumin inhibits the
cancer-associated fibroblast-derived chemoresistance of gastric
cancer through the suppression of the JAK/STAT3 signaling pathway.
Int J Oncol. 61:852022. View Article : Google Scholar : PubMed/NCBI
|
|
56
|
Seo HS, Ku JM, Choi HS, Woo JK, Lee BH,
Kim DS, Song HJ, Jang BH, Shin YC and Ko SG: Apigenin overcomes
drug resistance by blocking the signal transducer and activator of
transcription 3 signaling in breast cancer cells. Oncol Rep.
38:715–724. 2017. View Article : Google Scholar : PubMed/NCBI
|
|
57
|
Shen M, Xu Z, Xu W, Jiang K, Zhang F, Ding
Q, Xu Z and Chen Y: Inhibition of ATM reverses EMT and decreases
metastatic potential of cisplatin-resistant lung cancer cells
through JAK/STAT3/PD-L1 pathway. J Exp Clin Cancer Res. 38:1492019.
View Article : Google Scholar : PubMed/NCBI
|
|
58
|
Ying L, Zhu Z, Xu Z, He T, Li E, Guo Z,
Liu F, Jiang C and Wang Q: Cancer associated fibroblast-derived
hepatocyte growth factor inhibits the paclitaxel-induced apoptosis
of lung cancer a549 cells by up-regulating the PI3K/Akt and GRP78
signaling on a microfluidic platform. PLoS One. 10:e01295932015.
View Article : Google Scholar : PubMed/NCBI
|
|
59
|
Eguchi H, Akizuki R, Maruhashi R,
Tsukimoto M, Furuta T, Matsunaga T, Endo S and Ikari A: Increase in
resistance to anticancer drugs involves occludin in spheroid
culture model of lung adenocarcinoma A549 cells. Sci Rep.
8:151572018. View Article : Google Scholar : PubMed/NCBI
|
|
60
|
Archilla-Ortega A, Domuro C,
Martin-Liberal J and Muñoz P: Blockade of novel immune checkpoints
and new therapeutic combinations to boost antitumor immunity. J Exp
Clin Cancer Res. 41:622022. View Article : Google Scholar : PubMed/NCBI
|
|
61
|
Liu XD, Hoang A, Zhou L, Kalra S, Yetil A,
Sun M, Ding Z, Zhang X, Bai S, German P, et al: Resistance to
antiangiogenic therapy is associated with an immunosuppressive
tumor microenvironment in metastatic renal cell carcinoma. Cancer
Immunol Res. 3:1017–1029. 2015. View Article : Google Scholar : PubMed/NCBI
|
|
62
|
Kohlhapp FJ, Haribhai D, Mathew R, Duggan
R, Ellis PA, Wang R, Lasater EA, Shi Y, Dave N, Riehm JJ, et al:
Venetoclax increases intratumoral effector T cells and antitumor
efficacy in combination with immune checkpoint blockade. Cancer
Discov. 11:68–79. 2021. View Article : Google Scholar : PubMed/NCBI
|