Introduction
Glioblastoma (GBM) is the most common primary
malignancy of the central nervous system and is associated with
poor prognosis (1–3). GBM accounts for 49% of all malignant
primary brain and central nervous system tumors in adult patients
(4), with ~13,000 cases diagnosed
in the US each year (5). The
disease has 5-year relative survival rate of 5% (6,7).
Currently, early diagnosis and classification, precise intervention
and easy prognosis assessment of GBM are challenging due to
difficulties in accurately delineating tumor boundaries,
distinguishing tumor recurrence from treatment-related changes, and
capturing intratumoral heterogeneity using conventional diagnostic
approaches (6,8). Development and popularization of
non-invasive imaging techniques such as magnetic resonance imaging
(MRI) and positron emission tomography-computed tomography (PET-CT)
serve an important role in the early diagnosis and prognostic
assessment of GBM, potentially decreasing the morbidity and
mortality of GBM (1,9). MRI can accurately locate the position
of the tumor and characterize its metabolic profile by quantifying
key metabolites, including choline-containing compounds,
N-acetylaspartate, creatine, lactate and lipids, using MR
spectroscopy (MRS) (10,11). Using PET-CT, the location of tumor
can be shown after injecting specific nuclide tracers such as
18F-fluorodeoxyglucose (FDG) (12,13).
Simultaneously, the pharmacokinetics of FDG in both tumor and other
tissue or organs can be analyzed and quantified by PET-CT imaging
(14). However, research on the
origin, progression, and pathology of GBM cannot be conducted in
clinical setting because of ethical issues. Instead, preclinical
study of tumor animal models is used to investigate the origin,
growth and metastasis of GBM. With the advancement of high field
small animal MRI and submillimeter-level high-resolution small
animal PET-CT technology (14,15),
new approaches and methodologies have emerged for preclinical
research on brain glioma.
There are two commonly used tumor models of GBM in
mice, including subcutaneous and in situ tumor model in the
brain (16,17). Subcutaneous tumor is a simple model
for preclinical evaluation of drug efficacy in vivo and also
plays a key role in the study of tumor pathogenesis and drug
action. This model is easy to operate and demonstrates the tumor
growth process. However, the main limitation of this model is that
the tumor is implanted and grows subcutaneously, having no
associated tumor microenvironment. This limitation can be resolved
by using the in situ tumor model, in which the GBM cells are
directly injected into the brain. This model better simulates the
microenvironment of tumor cells in vivo and simulates the
process of tumor growth and metastasis. However, the tumor in the
brain of mice cannot be easily detected without imaging technology
such as MRI and PET-CT unless the mice are sacrificed (18,19).
Humans have an average body weight of 60 kg, whereas mice have an
average body weight of 25 g. Therefore, high field MRI and
high-resolution PET-CT equipment specifically designed for small
animals have emerged (13,20,21).
These technologies have the advantages of detecting and monitoring
the tumor in a visual, dynamic, non-invasive and quantitative
manner, recording the tumor growth process to the maximum
extent.
9.4 Tesla MRI (9.4T MRI) leverages an ultra-high
magnetic field to acquire images with high spatial resolution and
signal-to-noise ratio, making it a meaningful tool in preclinical
biomedical research fields such as neuroscience and oncology. In an
in situ GBM rat model using U87 cells, Yun et al
(22) dynamically evaluated the
antiangiogenic effect of bevacizumab using a 9.4T MRI scanner and
found that the tumor volume in the brain of rats shown by
T2-weighted imaging (T2WI) continuously increased in the
time-dependent manner. In the same model, Nickel et al
(23) scanned the brain on a 9.4T
MRI and concluded that standard contrast agent dosage is sufficient
to visualize the core tumor volume in T1WI MRI. Simultaneously,
brain tumor metabolism was assessed non-invasively using
1H-MRS.
FDG is valuable in the diagnosis and prognosis of
GBM (24). In high-grade tumors,
FDG uptake is typically elevated and several parameters can be
evaluated, among which the maximum standardized uptake value
(SUVmax) is the most commonly used in clinical diagnosis (10,25).
SUVmax is associated with tumor prognosis as increased glucose
consumption in tumors is associated with tumor grade, biological
aggressiveness and patient survival in glioma (23). However, lesions in or adjacent to
grey matter may be masked by high uptake in normal grey matter and
there is an overlap in FDG uptake between low- and high-grade
gliomas, so it is currently not possible to differentiate between
tumor boundary and glioma grade or predict prognosis based on FDG
PET alone (24). Combining FDG
PET/CT with MRI improves the accuracy of tumor grading.
The integration of MR sequences with FDG PET/CT
enables the evaluation of the association between parameters such
as regional cerebral blood volume, choline-to-creatine ratio
(Cho/Cr), N-acetylaspartate-to-choline ratio (NAA/Cho) and FDG
SUVmax, and tumor genetics and histopathology. This comprehensive
approach facilitates the determination of tumor malignancy by
linking imaging-derived parameters (Cho/Cr, NAA/Cho and FDG SUVmax)
to underlying biological processes, including cell proliferation,
neuronal loss, altered energy metabolism, and tumor aggressiveness
(23).
The present study aimed to establish an in
vivo GBM mouse model and evaluate it using high resolution
small animal PET-CT and 9.4T MRI, complemented by morphological and
pathological validation. Metabolic alterations were further
analyzed using 1H-MRS.
Materials and methods
Animals and GBM model
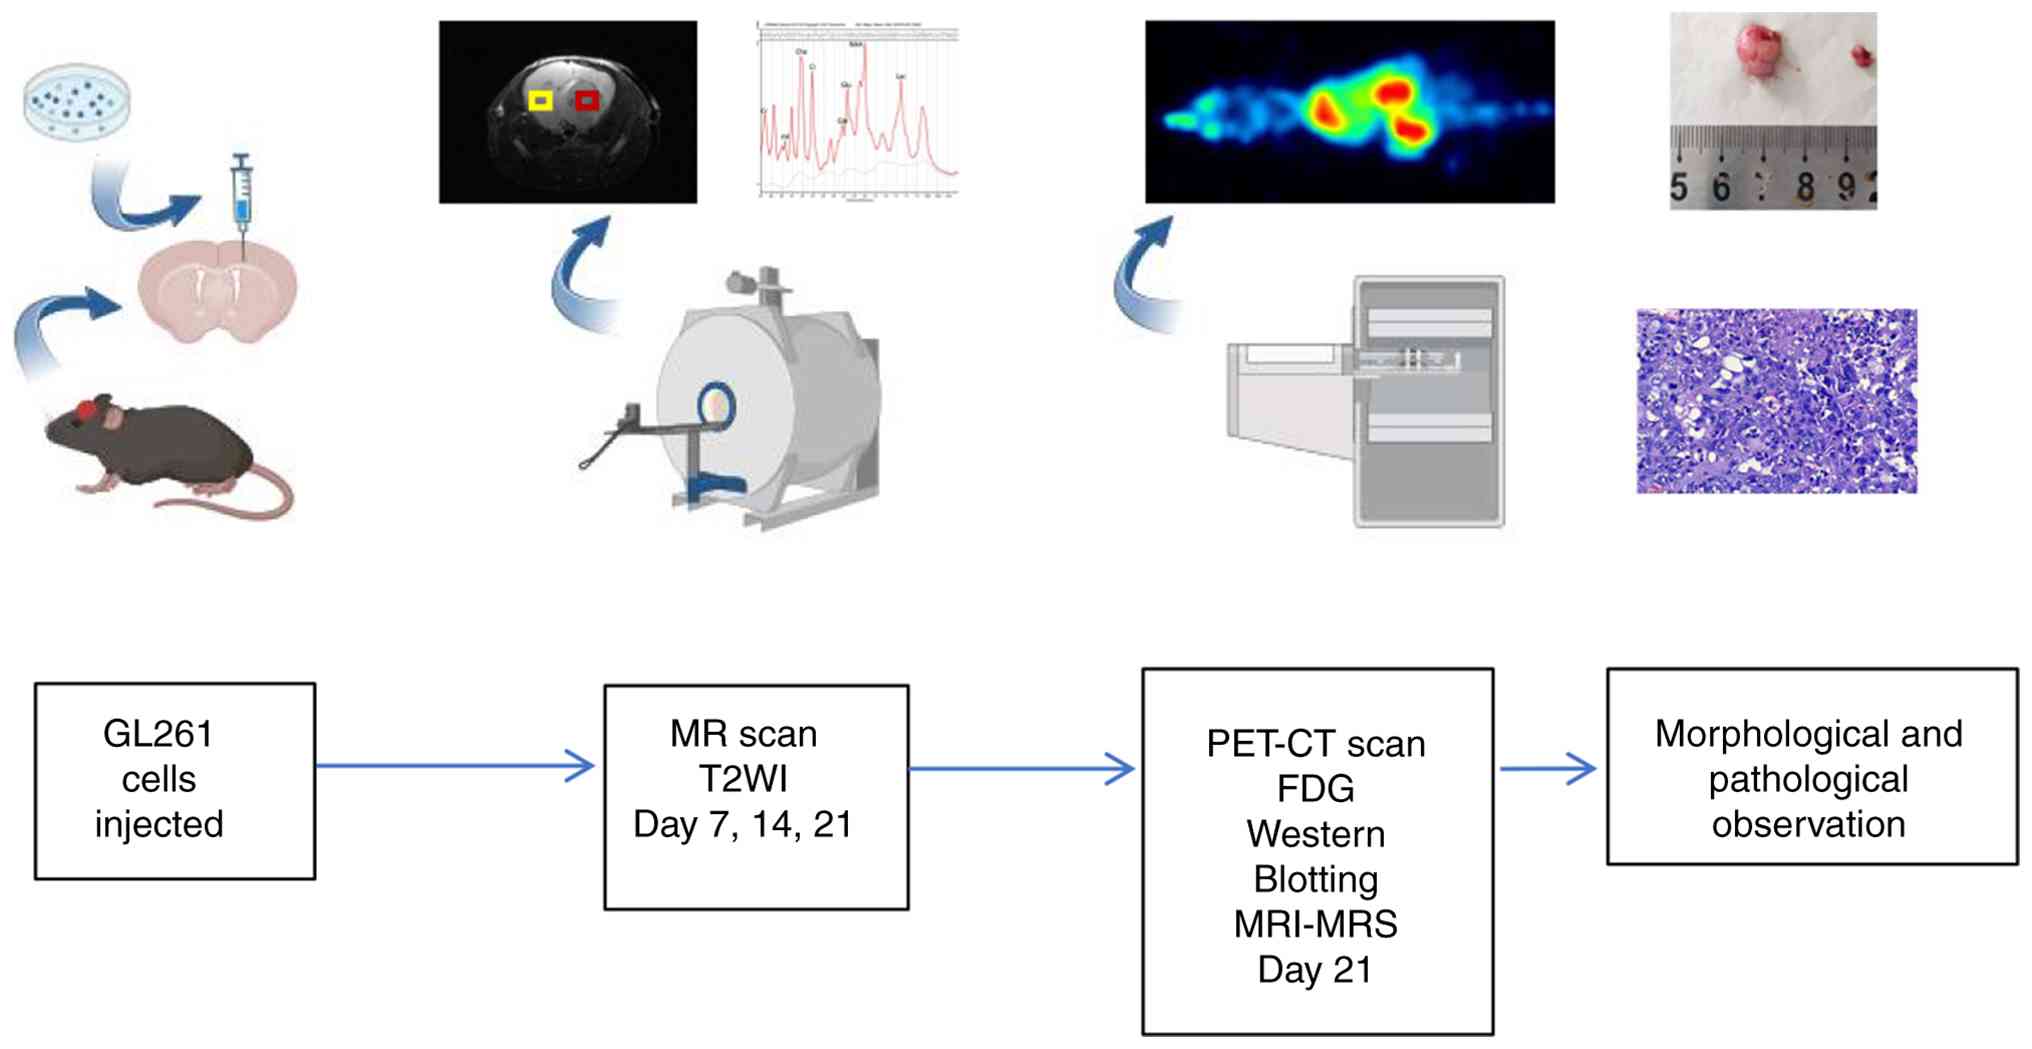
The entire experimental process is shown in Fig. 1. The Ethics Committee on Animal
Study of Lanzhou University Second Hospital (Lanzhou, China)
approved the protocol (approval no. D2025-787). C57 mice (weight,
17–18 g) were purchased from Experimental Animal Center of Lanzhou
University. Mice were housed in the specific-pathogen-free animal
care facility of Lanzhou University Second Hospital under a 12/12-h
light/dark cycle (lights on at 7:00 AM), an ambient temperature of
22±2°C and a relative humidity of 50±10%. All mice were fed a
standard diet and had ad libitum access to autoclaved
drinking water. The animals were housed (3–5 mice/cage) in standard
ventilated cages with corn cob bedding. A total of 18 male C57BL/6
mice (age, 8 weeks) were included (12 for MRI, with 6 assigned to
the tumor group and 6 to the normal group; 6 for PET-CT, with 3
assigned to the tumor group and 3 to the normal group).
In the surgery, mice were anesthetized for 5 min
using 3% isoflurane (2 l/min). Subsequently, anesthesia was
maintained at 1–1.5% isoflurane (1 l/min) until the procedure was
completed. The mice were placed on a thermal pad, and their heads
were secured in a stereotaxic instrument. After the head was
sterilized with iodophor, the skin was cut longitudinally in
accordance with the sagittal midline position; the length of the
incision was ~1 cm, and the position corresponding to the right
caudate nucleus was determined according to the anatomical map of
the stereotaxic instrument: 2.0 mm anterior to the fontanel, 1.0 mm
right to the midline and 3.5 mm subdural in depth. A hole was
drilled with a skull drill without damaging the dura mater. A total
of 5 µl (5×10⁴ GL261 cells) cell suspension was injected
using a glass electrode at an injection rate of 50 nl/sec. After
the cell suspension was injected, the needle was retained for 10
min. The incision was sutured with a 5-gauge thread and sterilized
with iodophor to prevent infection. Following surgery, mice were
kept on a heating pad until full recovery from anesthesia and
monitored closely for the first 6 h. Health and behavioral
assessments were conducted every 2 days initially, with the
frequency increasing to daily from day 14 onward. Humane endpoints
requiring immediate euthanasia included weight loss >20% of peak
body weight. No mice died during the 21 day experimental period
following the cell suspension injection. All mice were euthanized
at the predetermined experimental endpoint for tissue sampling.
Death was confirmed by cessation of chest movement and spontaneous
breathing, and the absence of a palpable heartbeat for ≥2 min.
Cell culture
The murine glioma GL261 cell line was obtained from
Zhili Zhongte Biological Technology Co., Ltd. Cells were cultured
in DMEM, supplemented with 10% fetal bovine serum (both Beijing
Solarbio Technology Co., Ltd.,), and 100 µg/ml streptomycin. All
cells were maintained at 37°C in a humidified incubator with an
atmosphere of 5% CO2.
MRI and 1H-MRS
GL261 cells were injected into the right caudate
nucleus of the mice to establish the in situ brain tumor
model. A total of 12 mice underwent regular in vivo scans
using MRI: T2WI was performed on days 7, 14 and 21 after
implantation to non-invasively evaluate the growth of the tumor
tissue. Additionally, 1H-MRS was used to measure brain
metabolites in mice 21 days after tumor implantation. Mice were
anesthetized with 3% isoflurane at 2 l/min for up to 5 min,
followed by 1–1.5% isoflurane at 1 l/min consistently during the
MRI scan. All MRI and MRS experiments were acquired on the
horizontal 30 cm-bore preclinical 9.4T MR system (uMR 9.4T,
Shanghai United Imaging Healthcare Co., Ltd.) using a volume coil
with 86 mm inner diameter for radio frequency transmission and a
three-channel phased array mouse brain surface coil for signal
reception. To stabilize the body temperature of the mice, an animal
warming system was used, which consisted of a warm water (39°C)
reservoir with a pump and hoses underneath the animal bed. The mice
breathed freely during the whole MR acquisition and were monitored
for changes in respiratory rate to adjust the anesthetic
concentration. Body temperature and respiratory rate were kept at
36–37°C and 60–80 bpm, respectively, using small animal vital signs
monitor system (SA instruments, Inc.) during the MRI scan.
A fat suppressed T2-weighted fast spin echo sequence
was performed for transverse imaging of the mouse brain to evaluate
brain tumor, with the following parameters: Repetition time, 3,000
msec; echo time, 49 msec; volume of interest (VOI), 20×20
mm2; resolution, 0.1×0.1 mm; echo spacing, 7.04 msec;
echo train length, 13; slice thickness, 0.5 mm with no gap. Imaris
software (version 10.2; Oxford Instruments) was used for 3D
reconstruction as well as rendering of mouse brain tumors.
Water-suppressed and non-water-suppressed MRS data
of mouse brain tumor and the contralateral brain tissue were
acquired using the Point Resolved Spectroscopy sequence with
following parameters: Repetition time, 2,500 msec; echo time, 6
msec; VOI, 2×2×2 mm3; bandwidth, 4,000 Hz; number of
excitations (NEX), 128. After positioning of the VOI, manual
shimming (defined as the manual optimization of magnetic field
homogeneity within each VOI) was adjusted for each VOI. To avoid
residual water signals in the spectral data caused by suboptimal
shimming results, Java Based Magnetic Resonance User Interface
software (version 5.2) (26) was
used to suppress the water signal in the MRS data (27,28).
Metabolite quantification was performed using the LCModel (version
6.3-1L) (29,30), which calculates the best fit to the
experimental spectrum as a linear combination of model spectra
(simulated spectra of brain metabolites). Raw data were used for
the standard data input. The water-suppressed time domain data were
analyzed between 0.2 and 4.0 ppm. The following metabolites were
included in the basis set of simulated metabolite spectra used to
model and quantify the in vivo MRS data: creatine (Cr),
glycerophosphorylcholine (GPC), phosphorylcholine (PCh),
glutathione, myo-inositol (mI), lactate (Lac), phosphocreatine
(PCr), N-acetylaspartate (NAA), N-acetylaspartylglutamate (NAAG)
and lipids at 1.3 ppm (Lip1.3). The absolute quantitative
concentrations of metabolites in the mouse brain were calculated
using the LCModel software, with reference to the internal tissue
water signal. Key metabolite ratios were calculated, including
tNAA/tCr, tCho/tCr, tNAA/tCho, Lip1.3/tCr, Lac/tCr and mI/tCr,
where tNAA=NAA + NAAG, tCr=Cr + PCr and tCho=GPC + PCh.
Additionally, the composite lipid peak at 1.3 ppm was analyzed,
defined as Lip1.3=Lip1.3a (at ~1.28 ppm) + Lip1.3b (at ~1.30 ppm).
The 1H-MRS dataset analyzed during the present study is
available in the Zenodo repository (zenodo.org/records/17759344) at
the following DOI: 10.5281/zenodo.17759344.
PET-CT imaging and
pharmacokinetics
Following induction with 3% isoflurane (2 l/min for
up to 5 min), mice were maintained under anesthesia with 1.0–1.5%
isoflurane at 1 l/min during a 2 h, whole-body FDG dynamic PET/CT
scan (MadicLab PSA071, Shandong Madic Technology Co., Ltd.). At the
start of the scan, mice were injected via a tail vein indwelling
needle with 100 µl FDG solution, containing 8.4±0.7 MBq
radioactivity. PET/CT images were reconstructed in
three-dimensional reconstruction algorithm for maximum likelihood
analysis (3D RAMLA; MadicLab PSA071, Shandong Madic Technology Co.,
Ltd.) with CT scan (80 kV, 70 mAs) for attenuation correction and
fusion localization, with 0.8×0.8×0.8 mm as the final resolution.
PMOD software (version 4.4, PMOD Technology GmbH) was used for data
processing and image analysis. For visual assessment of tracer
distribution, maximum intensity projection images were generated.
Based on PET/CT imaging, VOI of the liver, kidney and bladder was
manually plotted. The VOI of the tumor and the corresponding
anatomically matched region on the contralateral hemisphere
(serving as the background) were outlined as a sphere with a
diameter of 1.5 mm. The standardized uptake value of FDG in the VOI
(SUVmax) was calculated. The tumor/background (T/B) ratio was
calculated as SUVmax-T/SUVmax-B. Time-activity curves (TACs) were
extracted from organ VOIs.
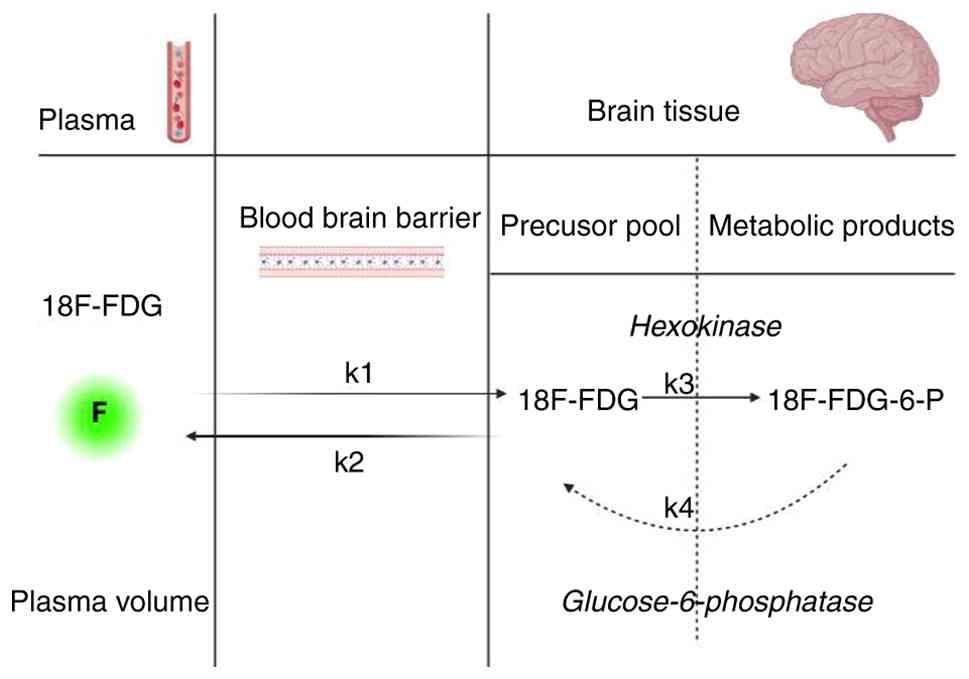
A 2-tissue compartment model (plasma and precursor
and metabolic product pool in brain tissue) was constructed
(Fig. 2). k1
(ml/min/cm3) and k2 (min−1) represent the
blood-to-tissue and tissue-to-blood FDG delivery rate,
respectively; k3 (min−1) is the FDG phosphorylation
rate. This irreversible model assumes negligible FDG
dephosphorylation [FDG dephosphorylation rate (k4;
min−1) is 0] (31). In
addition, VOI placement and TAC extraction were performed for the
inferior vena cava to obtain the image-derived input function.
Ki was calculated to represent the net FDG influx rate,
which is used to describe glucose (32).
Western blot analysis
The mice were euthanized by an overdose of 5%
isoflurane delivered at 2 l/min for 5 min and perfused
transcardially with cold physiological saline. The brain was
dissected and tissue was immediately collected on ice and stored at
−80°C. Total protein was extracted using RIPA lysis buffer
(Beyotime Institute of Biotechnology; cat. no. P0013B) supplemented
with PMSF. BCA protein assay kit was used to quantify the protein
concentration. The protein sample (20 µg/lane) was separated by 10%
SDS-PAGE and transferred to a PVDF membrane. The membranes were
blocked with 5% BSA (Wuhan Servicebio Technology; cat. no. G2052)
for 1 h at room temperature. Subsequently, they were incubated
overnight at 4°C with the following primary antibodies: Glucose
transporter type 1 (GLUT1, (Proteintech Group, Inc.; cat. no.
66290-1-Ig, 1:1,500) and GAPDH (Wuhan Servicebio Technology Co.,
Ltd.; cat. no. GB12002, 1:2,500). The next day, membranes were
washed three times (10 min each) with TBST (0.1% Tween-20) and
incubated with HRP-conjugated secondary antibodies (Wuhan
Servicebio Technology; cat. no. GB23301, 1:5,000) at room
temperature for 1 h. The membranes were washed again three times
with TBST (10 min each). Protein bands were visualized using ECL
reagent (Biosharp Biotechnology) and imaged with a gel imaging
system. The relative gray values of the protein bands were analyzed
using ImageJ (version 1.50b) software.
Morphology and pathology
The mice were euthanized by an overdose of 5%
isoflurane delivered at 2 l/min for 5 min, perfused transcardially
with cold physiological saline. The dissected brain was fixed in 4%
PFA at 4°C for 24 h. Following fixation, tissue underwent graded
dehydration, cleared in xylene, embedded in paraffin, and sectioned
at a thickness of 5 µm. For hematoxylin and eosin (HE) staining,
sections were deparaffinized, rehydrated stained with hematoxylin
(5–8 min) and eosin (1–3 min) at room temperature, dehydrated,
cleared, and mounted. Stained sections were examined and imaged
under a light microscope for morphological analysis.
Statistical analysis
All data are presented as the mean ± SD of ≥3
independent biological replicates unless otherwise specified.
Statistical analysis was performed using Prism 9 (GraphPad
Software, Inc.; Dotmatics). For comparisons between two groups, a
paired Student's t-test was used. For comparisons among >2
groups, one-way ANOVA was performed, followed by Tukey's post hoc
test for multiple comparisons. P<0.05 was considered to indicate
a statistically significant difference.
Results
Dynamic and non-invasive evaluation of
GBM growth by MRI
A small animal 9.4T MRI was used to evaluate whether
the GBM tumor model in the mouse brain was successfully
established. The tumor was observed longitudinally 7, 14 and 21
days after injection of GL261 cells in the brain under T2WI
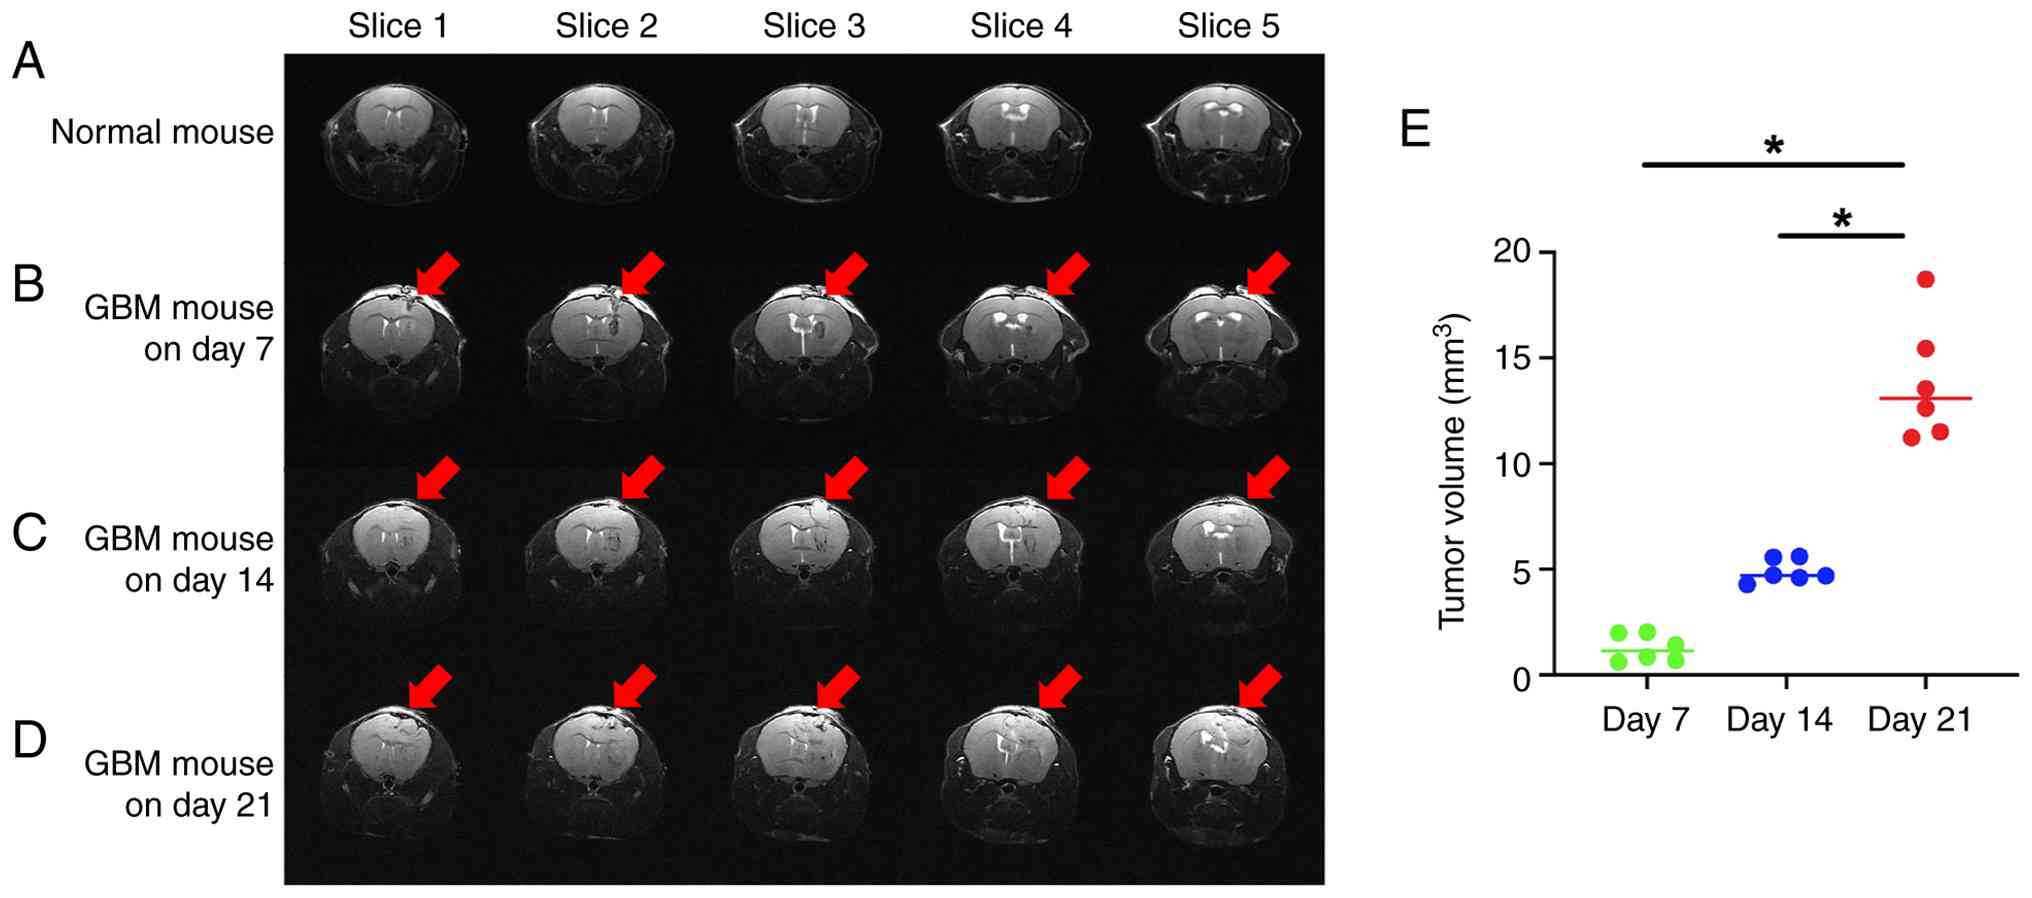
condition. Compared with normal C57BL/6 mouse MRI (Fig. 3A), the tumor was located in the
right cerebral hemisphere, with a spherical shape, relatively clear
boundary between the tumor tissue and the surrounding normal brain
tissue, non-uniform signal within the tumor and a small number of
edema bands around the tumor (Fig.
3B-D). The midline of the brain was shifted to the left, the
tumor occupying effect was notable and the right lateral ventricle
had different degrees of compression and deformation (Data S1, Data
S2, Data S3, Data S4). The tumor grew in a
time-dependent manner, measuring 1.26±0.65, 4.92±0.55 and
13.85±2.83 mm3 on day 7, 14 and 21 respectively
(Fig. 3E; Table SI).
Measurement of metabolism in GBM with
1H-MRS
The metabolism in the tumor was different from that
of the contralateral normal brain tissue as well as normal C57
mouse brain tissue. The levels of tCho (Fig. 4A) and the tCho/tCr ratio (Fig. 4E) were significantly increased in
the tumor compared with that in the contralateral normal brain and
the normal mouse brain tissue. Levels of tNAA (Fig. 4C) and tCr (Fig. 4B), key brain metabolites, were
decreased in tumor compared with normal brain tissue. A notable
decline in tNAA/tCho (Fig. 4F)
ratio and increase in tNAA/tCr (Fig.
4D) ratio were demonstrated in the tumor compared with the
contralateral and the normal mouse brain tissue. Lip1.3/tCr
(Fig. 4G), Lac/tCr (Fig. 4H) and mI/tCr (Fig. 4I) in the tumor were significantly
higher than in the contralateral normal brain tissue and the normal
mouse brain tissue.
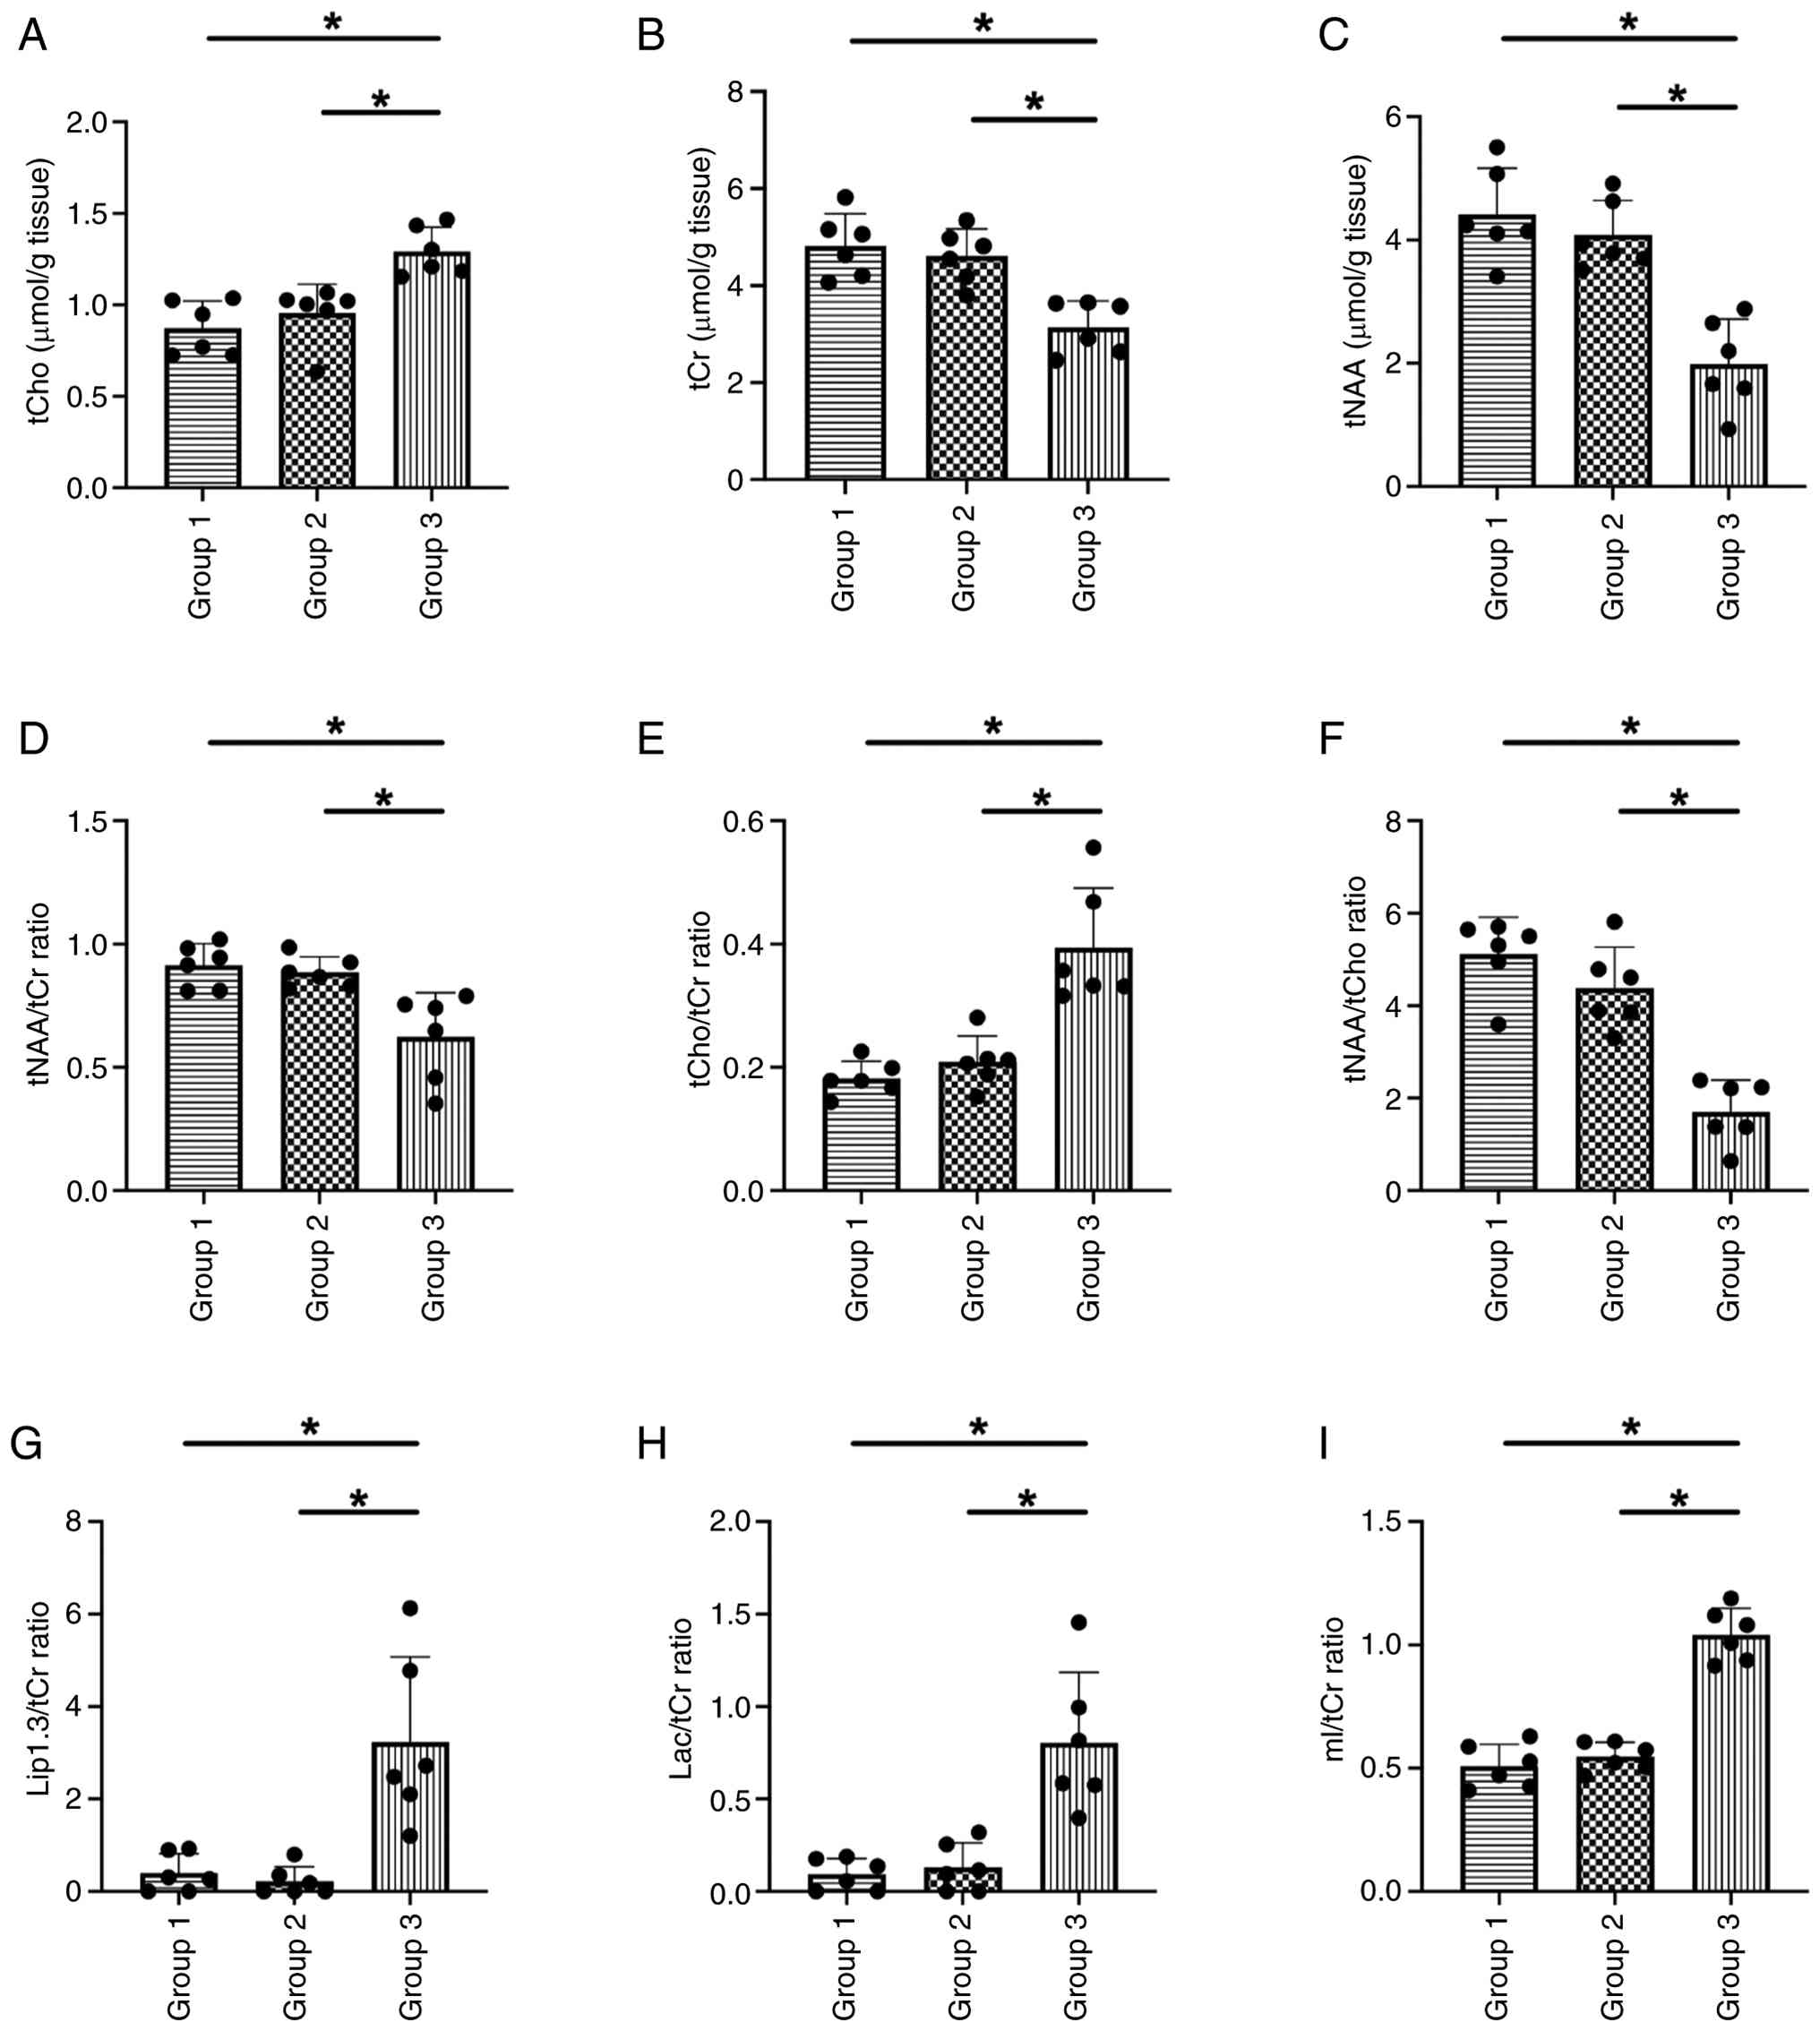 | Figure 4.Mean metabolite concentration and
ratios with tCr in normal and GBM mice. The peak area measurements
of the metabolites were used to calculate the metabolite
concentrations and ratios relative to (A): tCho, (B) tCr and (C)
tNAA concentration and (D) tNAA/tCr, (E) tCho/tCr, (F) tNAA/tCho
(F); Lip1.3/tCr ratio (G); Lac/tCr ratio (H); mI/tCr ratio (I).
n=6. *P<0.05. Group 1, normal mouse; group 2, normal
contralateral brain tissue of GBM mouse; group 3, tumor tissue of
GBM mouse. tCr, total creatine; GBM, glioblastoma; tCho, total
choline; tNAA, total N-acetylaspartate; Lip1.3, lipids at 1.3 ppm;
Lac, lactate; mI, myo-inositol. |
Detection of GBM with PET-CT
The diagnosis of tumors was confirmed using small
animal PET-CT 21 days following intracerebral injection of GL261
cells in mice. FDG was rapidly distributed throughout the body of
the mice after injection via the tail vein, but in the brain on the
tumor side, FDG was absent for the first 6 min, after which the FDG
content in the tumor tissue increased (Fig. 5F). By contrast, the FDG content in
normal brain tissue decreased in a time-dependent manner (Fig. 5E). Calculation of T/B revealed a
time-dependent increase (Fig. 5C),
which was significantly higher at 2 h (T/B=2.23) compared with the
conventional time point imaging modality of 1 h after FDG injection
(T/B=1.55; Fig. 5D). SUV decreased
in the kidney and liver (Fig.
5G-J), whereas SUV increased in the bladder in a time-dependent
manner (Fig. 5H and L). FDG was
specifically and selectively distributed in tumor tissue rather
than in normal brain tissue and it was easier to differentiate
tumor from normal brain tissue after extending the scan time to 2 h
(Fig. 5A and B; Data S5 and S6).
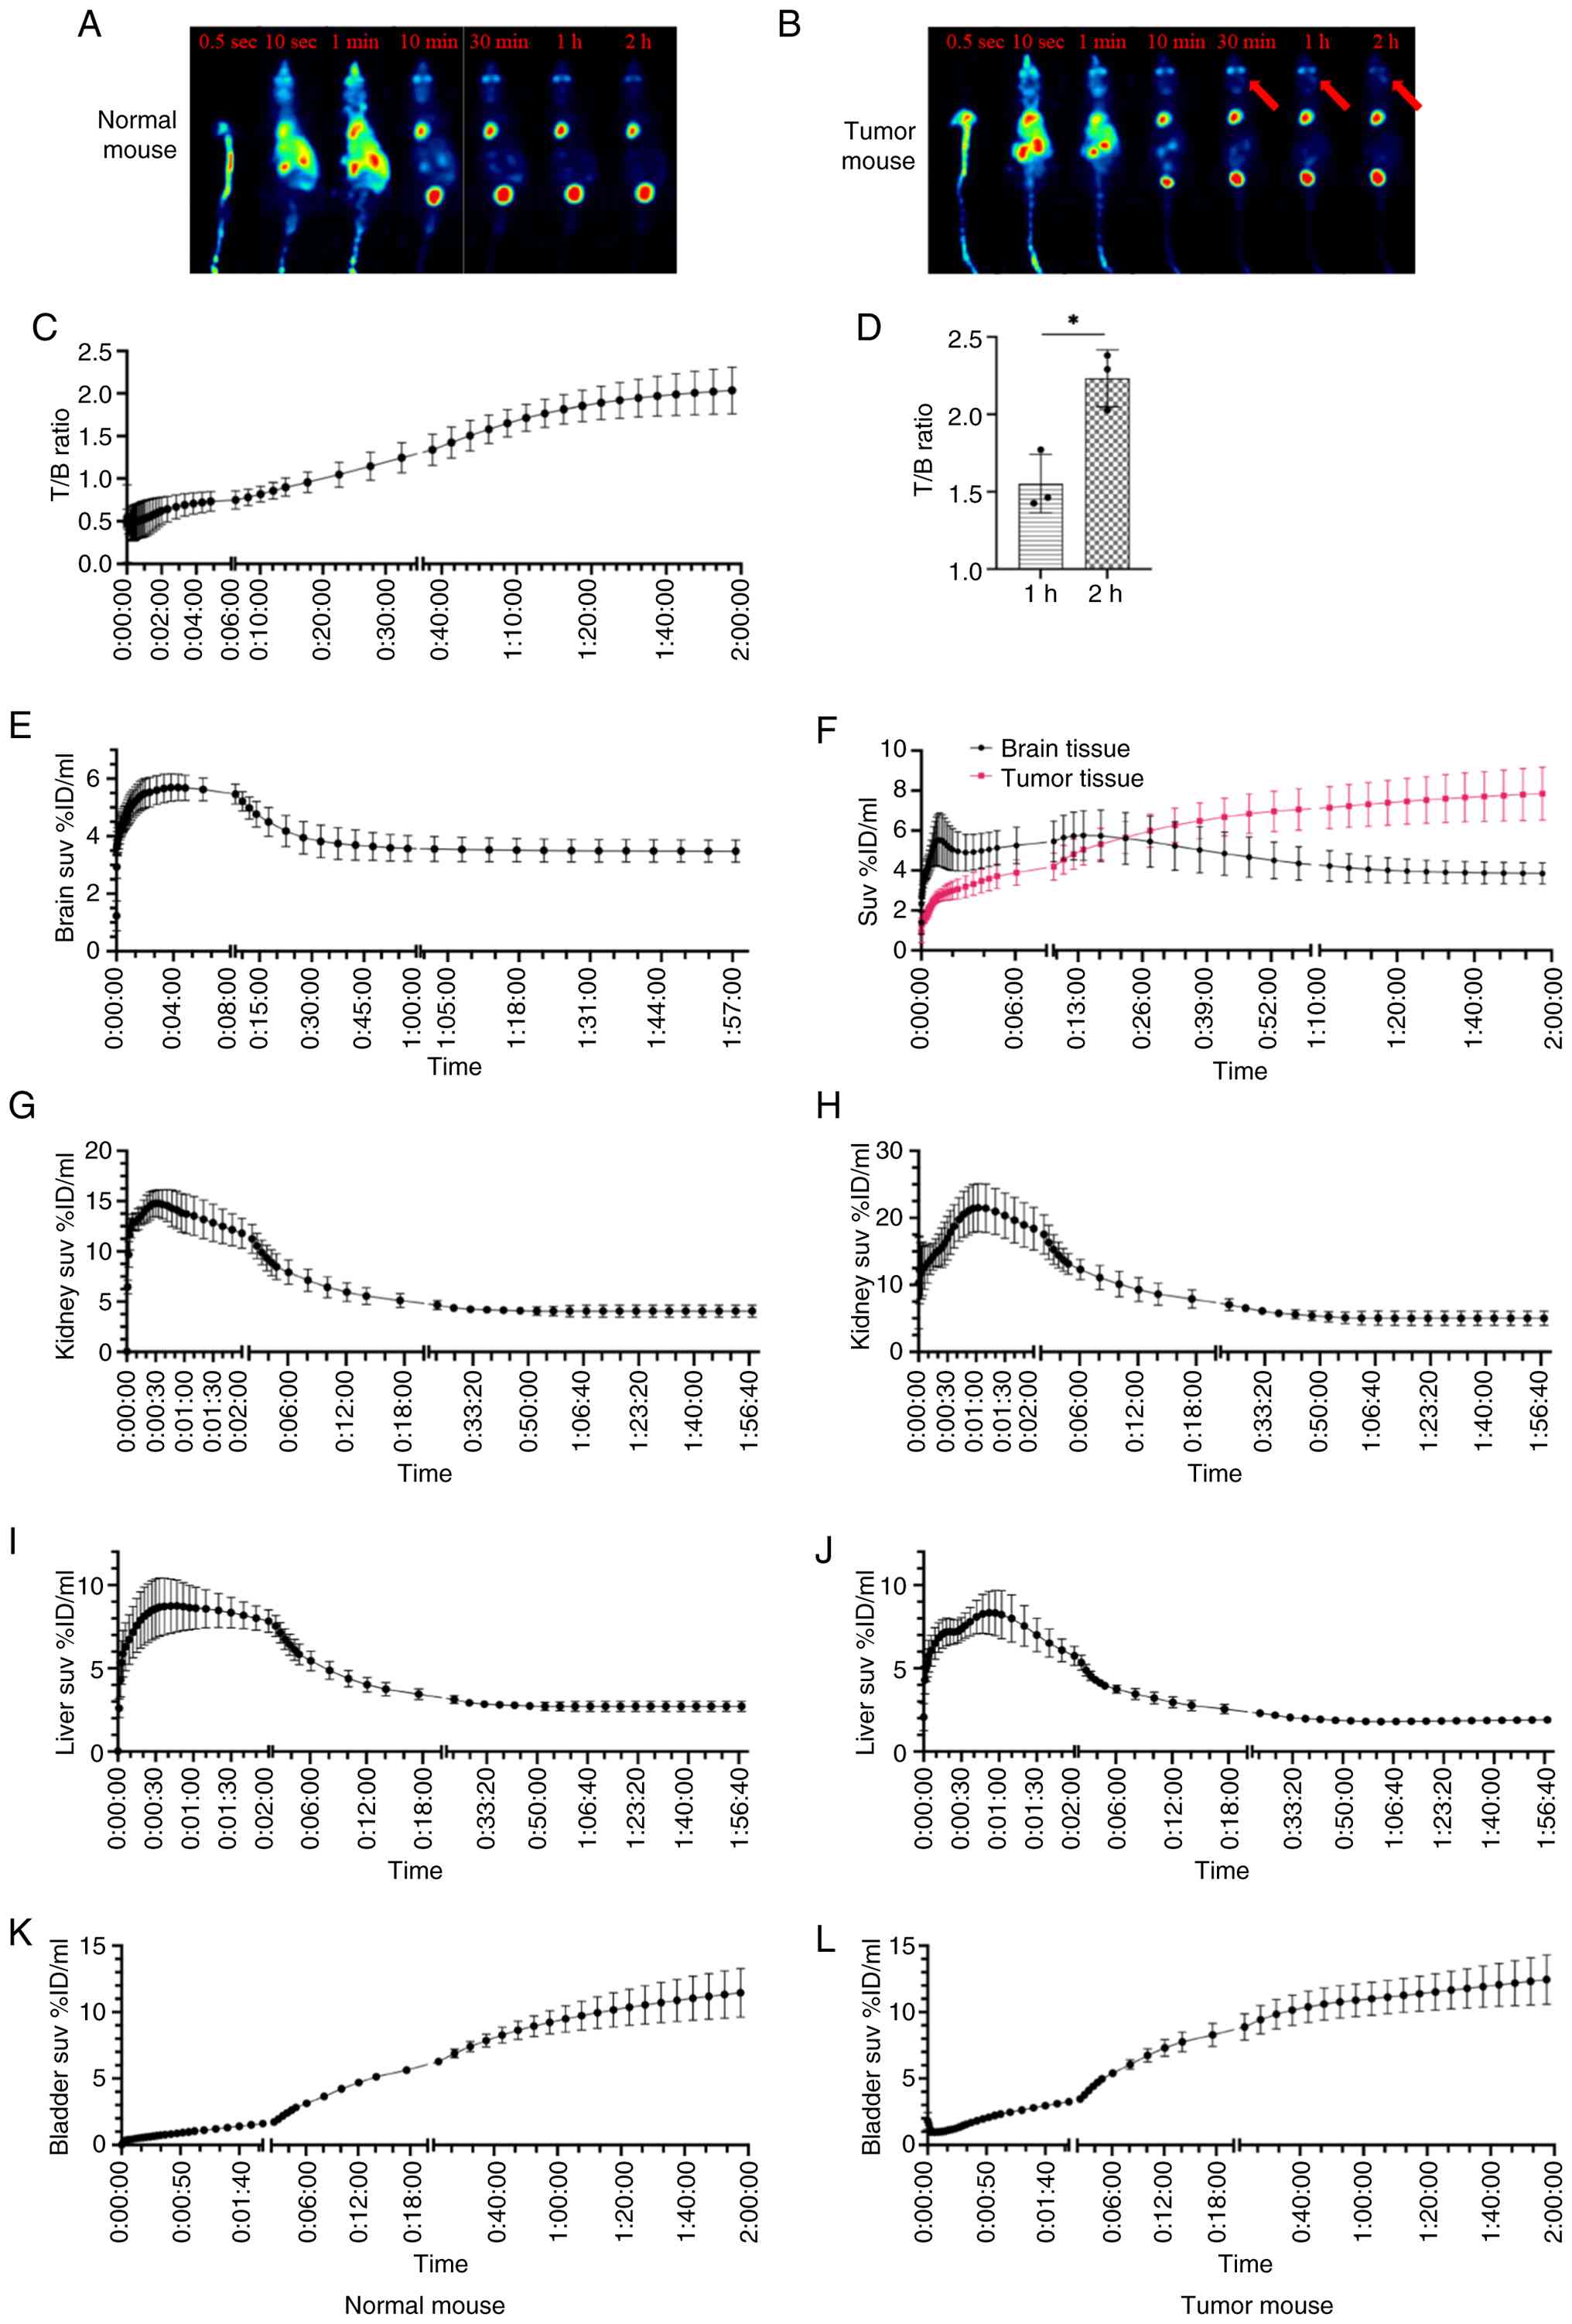 | Figure 5.Characteristics of FDG imaging in
tumor and normal mouse. (A) Normal and (B) tumor mice. Arrow, tumor
regions. FDG was specifically and selectively distributed in tumor
tissue rather than in normal brain tissue after extending the scan
time to 2 h. There was a time-dependent increase in the T/B ratio
(C). Comparison of T/B ratios at 1 and 2 h after FDG injection
revealed that the 2 h T/B ratio was significantly higher than the 1
h T/B ratio (D). FDG was rapidly distributed throughout the body of
the mice (E), but in the brain on the tumor side, FDG was absent
for the first 6 min, after which the FDG content in the tumor
tissue increased (F). SUV values in the normal mice kidneys (G),
tumor mice kidneys (H), normal mice livers (I) and tumor mice
livers (J) gradually decreased over time. Conversely, SUV values in
the normal mice bladders (K) and tumor mice bladders (L) exhibited
a time dependent upward trend. n=3. *P<0.05. T/B, tumor
tissue/background; FDG, 18F-fluorodeoxyglucose; SUV,
standardized uptake value; ID, injected dose. |
Pharmacokinetics of FDG in mice with
brain tumors
Pharmacokinetic analysis showed that the
distribution of FDG in brain and tumor tissue was consistent with a
two-compartment model. The metabolism of FDG was abnormal in the
tumor compared with brain tissue in GBM mice, represented by
decreased uptake of FDG and slow metabolism of FDG in the tumor
tissue (k1=0.797 vs. 1.844 for the uptake, k2=2.722 vs. 3.844 for
the metabolism, k3=0.319 vs. 0.280 for the phosphorylation, νB=2.3%
vs. 3.6% for blood volume fraction, Ki=0.084 vs. 0.125
for the FDG net influx rate); values in normal mice were as
follows: k1=1.530, k2=3.218, k3=0.426, νB=2.8% and
Ki=0.179 (Table I).
 | Table I.Pharmacokinetics of FDG in normal and
tumor mice. |
Table I.
Pharmacokinetics of FDG in normal and
tumor mice.
|
| Normal mouse | Tumor mouse |
|---|
|
|
|
|
|---|
| Parameter | Brain | Liver | Kidney | Bladder | Brain | Tumor | Liver | Kidney | Bladder |
|---|
| νB | 0.028 | 0.036 | 0.051 | 0.012 | 0.036 | 0.023 | 0.057 | 0.267 | 0.024 |
| k1 | 1.530 | 2.922 | 7.497 | 0.181 | 1.844 | 0.797 | 3.677 | 7.975 | 0.211 |
| k2 | 3.218 | 2.583 | 3.325 | 0.023 | 3.844 | 2.722 | 4.462 | 4.120 | 0.076 |
| k3 | 0.426 | 0.000 | 2.297 | 0.081 | 0.280 | 0.319 | 0.014 | 3.264 | 0.037 |
| Vt | 1.553 | 0.081 | 1.558 | 10.964 | 2.250 | 4.941 | 0.954 | 3.613 | 13.850 |
| Vs | 0.985 | 1.262 | 3.324 | 2.762 | 1.758 | 4.499 | 0.084 | 1.790 | 2.725 |
| k1/k2 | 0.568 | 1.141 | 2.481 | 8.203 | 0.490 | 0.442 | 0.870 | 2.025 | 4.432 |
| Flux | 0.182 | 0.000 | 3.144 | 0.092 | 0.133 | 0.083 | 0.015 | 3.722 | 0.049 |
| AUC | 27028.321 | 21747.060 | 50661.858 | 88515.180 | 31927.733 | 47218.743 | 15373.799 | 44143.267 | 72962.892 |
| Ki | 0.179 | 0.000 | 3.063 | 0.141 | 0.125 | 0.084 | 0.011 | 3.525 | 0.069 |
GLUT1 protein expression in brain
tissue and tumor tissue
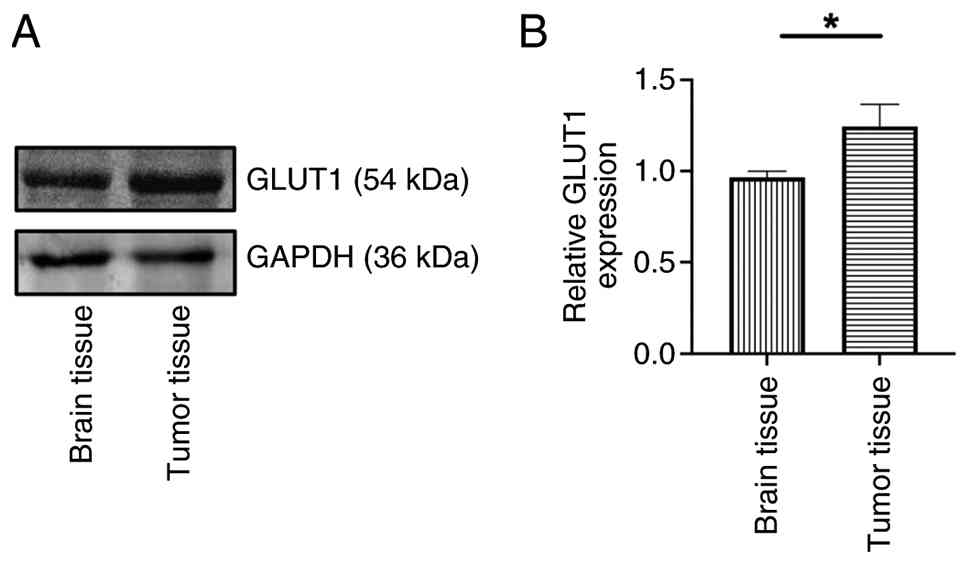
To investigate the specific molecular mechanisms
underlying glucose uptake in glioma, the present study analyzed the
protein expression levels of GLUT1 (Fig. 6A) in brain and tumor tissue.
Compared with normal brain tissue, glioma tissue exhibited
significantly elevated GLUT1 protein levels (Fig. 6B).
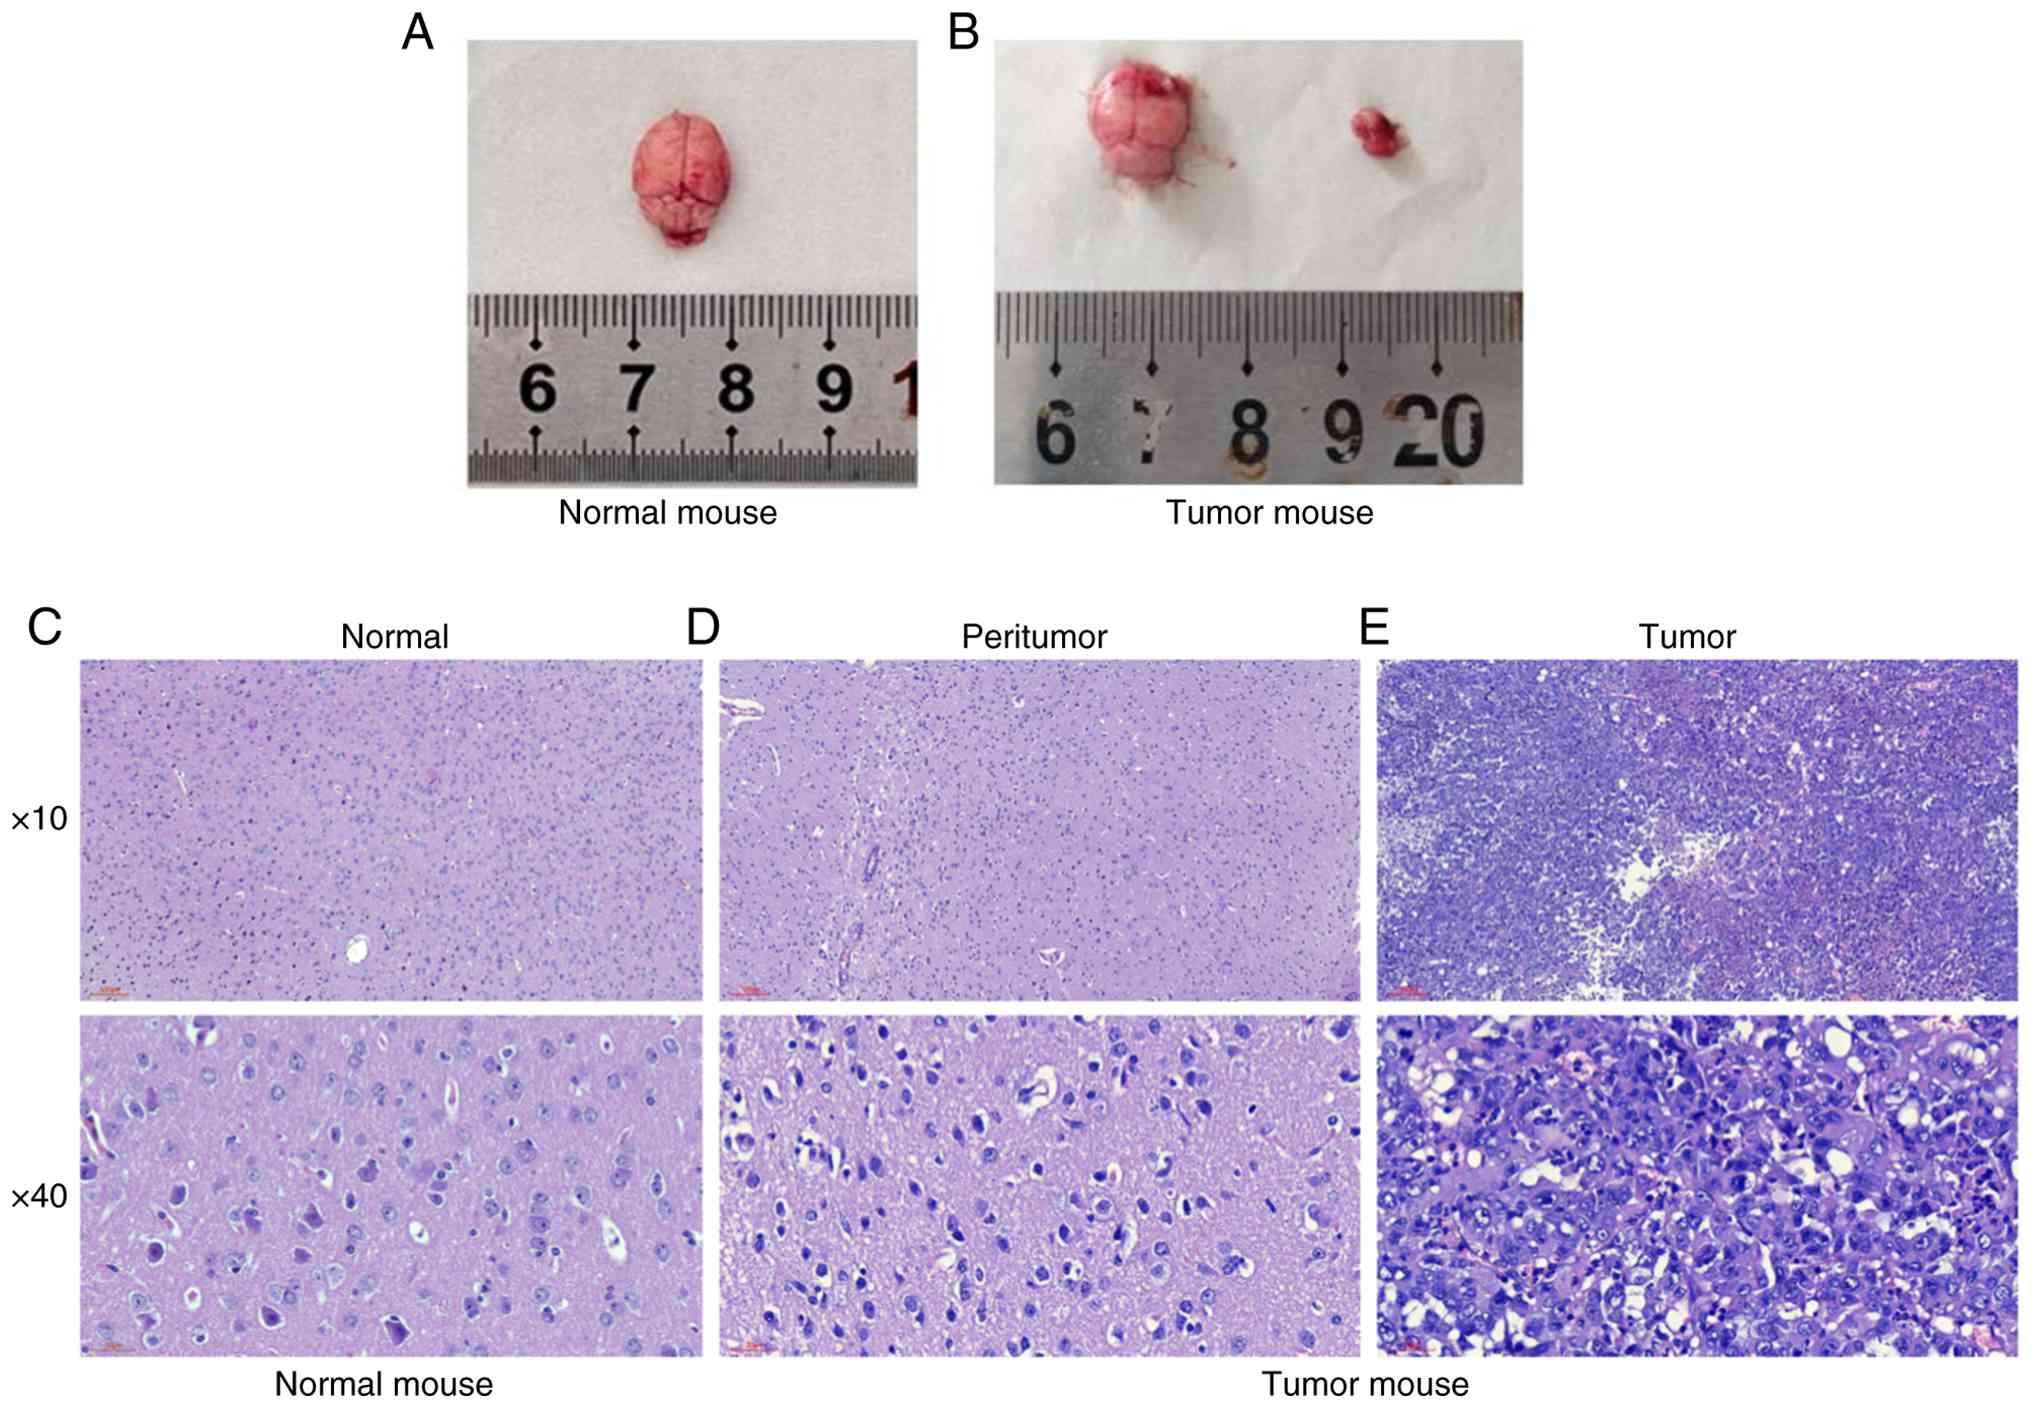
Morphological and pathological
analysis
Morphological analysis confirmed the formation of
tumors in the brain of GBM mice detected by MRI and PET-CT, along
with pathological changes in tissue structure (Fig. 7A and B). HE staining showed notable
heterogeneity of tumor cells (tumor cells varied in size, distinct
nucleoli, abundant and eosinophilic cytoplasm, mitotic figures),
accompanied by focal necrosis (Fig.
7C-E).
Discussion
The present study established a mouse GBM model and
characterized gliomas in GL261 mice by 9.4T high field small animal
MRI and PET-CT. The present study established a methodological
framework for investigation of tumor characteristics and molecular
mechanisms of GBM.
GBM is the most common type of primary malignant
brain tumor in adults (1,8,32).
Surgical tumor resection followed by concurrent chemoradiotherapy
along with adjuvant temozolomide is the current standard therapy
for patients with GBM (33).
Accurate diagnosis and clinical staging of gliomas are key for
clinical decision-making and treatment planning. Advances in
imaging technology, particularly the application of MRI and PET-CT,
have provided powerful tools for diagnosing glioma (34). These imaging modalities enable
direct visualization, dynamic assessment, non-invasive procedures
and quantitative analysis, thereby facilitating early diagnosis and
more effective treatment, ultimately contributing to reduced
mortality rates (35,36). While the gold standard for
confirming the grading of glioma remains pathological testing,
numerous findings (37–41) have shown that MRS helps imaging
physicians more accurately and non-invasively assess the
histological grade, molecular profile, prognosis and effectiveness
of novel therapies in patients with glioma. The primary metabolites
of glioma used in clinical practice include tNAA, tCr, tCho, Lac
and their ratio (42). However, the
spectral resolution of ¹H-MRS is dependent on the magnetic field
strength. A higher field strength increases the frequency
separation between metabolite peaks at a given chemical shift,
thereby improving spectral resolution and allowing detection of
more metabolite information (43,44).
Therefore, the mouse model with 9.4T high field was used to observe
characteristics of tumor metabolites in an in situ glioma
model.
The present study compared the metabolism between
brain tumors, normal brain tissue of tumor-bearing mice and normal
mouse brain tissues using 1H-MRS. Of particular
relevance to tumor biology is the metabolism of choline-containing
compounds, which reflects cell membrane turnover and proliferation
(45). Specifically, the levels of
tCho and the ratio of tCho/tCr were significantly increased in the
tumor. These alterations are associated with the degree of
malignancy and mitotic activity of GBM (45,46),
and the elevated tCho/tCr ratio indicated that the tumor cells were
proliferating actively. It has been hypothesized that the tCho/tCr
ratio may predict the expression of microchromosome maintenance
protein 2 to non-invasively assess cell proliferation activity as a
marker of energy metabolism (47,48).
In addition, levels of tNAA, a key brain metabolite as a marker of
neuronal integrity, were significantly decreased in tumor tissue.
NAA is one of the most concentrated neurometabolites in the brain.
In neuronal mitochondria, NAA is synthesized from the substrates
acetyl CoA and aspartate (47). The
tNAA/tCr and the tNAA/tCho ratio demonstrated a notable decrease in
tumor tissue. These changes indicate neuronal loss or dysfunction
due to tumor invasion and displacement. In a retrospective study
evaluating the association between MRS and the grading of glioma,
it was found that NAA/Cho and NAA/Cr were negatively associated and
Cho/Cr was positively associated with pathological grading in
patients with glioma (9). These
findings are useful for preoperative diagnostic prediction of
glioma. The present study also found an increase in the Lac and
lipid peaks in the tumor tissue. When the proliferation rate of GBM
increases rapidly, it may lead to increased Lac/tCr and lipid
(Lip1.3/tCr) levels due to local hypoxia and tissue necrosis
(48). Clinically, clear lipid
peaks may be associated with grade IV tumors (49,50).
Therefore, the GL261 glioma model may have certain characteristics
of a grade IV glioma, which is more malignant. mI is a basic sugar
produced primarily by astrocytes and is a component of key
molecules such as inositol phosphates and phosphatidylinositol
(44). Here, the mI/tCr ratio was
increased in brain tumors compared with normal brain tissue. In
glioma, increased mI concentration has also been evaluated as a
marker of astrocytopathy, typically accompanied by changes in Cr
and other metabolites (49,51,52).
Following dynamic 2 h PET-CT scanning of the whole
body of the mice, it was possible to detect whether distant
metastasis of GBM had occurred. In addition, the metabolism of FDG
in other organs (liver, kidney and bladder) was analyzed,
demonstrating a decrease in SUV values in the heart, liver and
kidney, and an increase in the SUV values of the bladder over time,
which is consistent with the metabolic profile of FDG. Attempts
have been made to differentiate normal cortical hypermetabolism
from high-grade lesions by delayed acquisition imaging, but this
has been inconclusive due to patient compliance issues (53). The present study assessed whether
delayed dynamic FDG imaging of untreated GBM offers a diagnostic
advantage compared with the conventional imaging time point of ~1 h
following tracer injection. FDG was not distributed for the first 6
min, then the tumor region showed a gradual increase in SUV value,
with a gradual decrease in SUV in normal brain tissue. It was
hypothesized that the increasing T/B contrast over time results
from differential tracer clearance rates. Normal brain tissue
rapidly clears unbound FDG, while tumor cells, due to upregulated
GLUT1 and hexokinase activity, trap FDG-6-phosphate
intracellularly, leading to progressive signal accumulation. This
phenomenon may be attributed to the upregulation of GLUT1 in tumor
cells (54). Under physiological
conditions, GLUT1 is predominantly localized at the blood-brain
barrier, where it facilitates basal glucose transport (55). In high-grade glioma, however,
neoplastic cells demonstrate upregulated GLUT1 expression and
enhanced hexokinase activity. Following cellular uptake, FDG is
phosphorylated by hexokinase to FDG-6-phosphate, which cannot be
further metabolized via glycolysis. This leads to its effective
entrapment within tumor cells, resulting in radiotracer
accumulation and clear visualization of malignant lesions on
imaging (56). The present western
blot results, which confirmed elevated GLUT1 expression in tumor
tissue, provided direct molecular support for this mechanism. In
clinical practice, regions with high FDG uptake correspond to the
tumor core, characterized by intense metabolic activity, and are
associated with a higher pathological grade. This association
offers a rational basis for improving the discrimination between
tumor recurrence and treatment-associated changes, thereby
facilitating more precise clinical decision-making (57).
Gross dissection of GBM mouse brain revealed
necrosis within the tumor tissue. The pathological findings
revealed by HE staining validated the detection results of ¹H-MRS
and PET-CT, confirming necrotic areas and an invasive growth
pattern which were consistent with the pathological
characteristics.
The present study used a multimodal, multi-level
research strategy, which integrated in vivo non-invasive
imaging with ex vivo molecular and morphological analysis.
This approach enables a comprehensive assessment of mouse brain
glioma. However, the present study has certain limitations.
Firstly, all experiments were conducted using mouse models, which
exhibit notable species differences from human patients in tumor
microenvironment composition, immune response characteristics and
disease progression dynamics. Consequently, it is challenging to
simulate the complex pathological features and heterogeneity of
human brain glioma, limiting clinical translation. Secondly, the
present study primarily focused on observing and describing the
disease state without incorporating any therapeutic intervention.
Consequently, the sensitivity and clinical utility of the
multimodal assessment system for monitoring treatment efficacy
remain unverified. Thirdly, use of only three model and three
control mice may limit the statistical power of some analyses and
increase the influence of individual variability. However, the
present findings are in agreement with previously published reports
(37,49,58),
which strengthens the reliability of the conclusions.
In summary, the present study established a mouse
glioblastoma model. High-field MRI was used for non-invasive
assessment of brain gliomas in mice, while MRS was used to analyze
the metabolic processes of brain tumors. Combined with non-invasive
metabolic imaging via PET-CT and molecular-level analysis of GLUT1
protein expression, the present approach provided robust and
consistent evidence for the key role of high glycolysis in this
mouse glioblastoma model. Finally, pathological evaluation was
supplemented by HE staining.
Supplementary Material
Supporting Data
Supporting Data
Supporting Data
Supporting Data
Supporting Data
Supporting Data
Supporting Data
Acknowledgements
Not applicable.
Funding
The present study was supported by Fundamental Research Funds
for the Central Universities of Lanzhou University (grant no.
lzujbky-2022-sp08); Medical Research Improvement Project of Lanzhou
University (grant no. lzuyxcx-2022-154); Medical Innovation and
Development Project of Lanzhou University (grant no.
lzuyxcx-2022-141); Major Science and Technology Project of Gansu
Province (grant nos. 22ZD6FA050, 22JR9KA002, 23YFFA0047 and
20ZD7FA003); Project of Gansu Provincial Department of Education
(grant no. 2021jyjbgs-02); Project of Gansu Provincial Development
and Reform Commission (grant no. 2020-20240); Natural Science
Foundation of Gansu Province (grant nos. 21JR1RA135 and
23JRRA1001); National Natural Science Foundation of China (grant
nos. 81960673, 81870329 and 82260612) and 2023 Lanzhou Science and
Technology Plan Project and Talent Innovation and Entrepreneurship
Project (grant no. ZX-62000001-2023-015).
Availability of data and materials
The data generated in the present study may be
requested from the corresponding author.
Authors' contributions
FT, XZ and YL conceived and designed the study. SL,
WG and YJ interpreted MRI and PET-CT data. TL, LS and YujW
established the mouse model. SL and WG wrote the manuscript. YS,
HJ, ZW, YucW and BW analyzed data. YL and FT supervised the study
and confirm the authenticity of all the raw data. All authors have
read and approved the final manuscript.
Ethics approval and consent to
participate
All experimental procedures were conducted according
to the guidelines for the care and handling of laboratory animals
recommended by the National Institutes of Health and the protocol
was approved by the Ethics Committee of Lanzhou University Second
Hospital (approval no. D2025-787), Lanzhou, China.
Patient consent for publication
Not applicable.
Competing interests
The authors declare that they have no competing
interests.
References
|
1
|
Bathla G, Dhruba DD, Liu Y, Le NH, Soni N,
Zhang H, Mohan S, Roberts-Wolfe D, Rathore S, Sonka M, et al:
Differentiation between glioblastoma and metastatic disease on
conventional MRI imaging using 3D-convolutional neural networks:
Model development and validation. Acad Radiol. 31:2041–2049. 2024.
View Article : Google Scholar : PubMed/NCBI
|
|
2
|
Bonada M, Rossi LF, Carone G, Panico F,
Cofano F, Fiaschi P, Garbossa D, Di Meco F and Bianconi A: Deep
learning for MRI segmentation and molecular subtyping in
glioblastoma: Critical aspects from an emerging field.
Biomedicines. 12:18782024. View Article : Google Scholar : PubMed/NCBI
|
|
3
|
Wang J, Liu G and Wang J: Prediction of
O6-methylguanine-DNA ethyhransferase methylation status in
glioblastoma based on deep learning. J Lanzhou Univ (Med Sci).
49:50–55. 2023.
|
|
4
|
Schaff LR and Mellinghoff IK: Glioblastoma
and other primary brain malignancies in adults: A review. JAMA.
329:574–587. 2023. View Article : Google Scholar : PubMed/NCBI
|
|
5
|
Price M, Ballard C, Benedetti J, Neff C,
Cioffi G, Waite KA, Kruchko C, Barnholtz-Sloan JS and Ostrom QT:
CBTRUS statistical report: Primary brain and other central nervous
system tumors diagnosed in the United States in 2017–2021. Neuro
Oncol. 26 (Suppl_6):vi1–vi85. 2024. View Article : Google Scholar : PubMed/NCBI
|
|
6
|
Chan P, Rich JN and Kay SA: Watching the
clock in glioblastoma. Neuro Oncol. 25:1932–1946. 2023. View Article : Google Scholar : PubMed/NCBI
|
|
7
|
Deng J, Li S and Huang X: Quantitative
evaluation of the therapeutic effect of temozolomide on rat C6
glioma by spectral CT imaging. J Lanzhou Univ (Med Sci). 49:25–31.
2023.
|
|
8
|
Chelliah A, Wood DA, Canas LS, Shuaib H,
Currie S, Fatania K, Frood R, Rowland-Hill C, Thust S, Wastling SJ,
et al: Glioblastoma and radiotherapy: A multicenter AI study for
Survival Predictions from MRI (GRASP study). Neuro Oncol.
26:1138–1151. 2024. View Article : Google Scholar : PubMed/NCBI
|
|
9
|
Hesse F, Low J, Cao J, Bulat F, Kreis F,
Wright AJ and Brindle KM: Deuterium MRI of serine metabolism in
mouse models of glioblastoma. Magn Reson Med. 92:1811–1821. 2024.
View Article : Google Scholar : PubMed/NCBI
|
|
10
|
In't Zandt R, Mahmutovic Persson I,
Tibiletti M, von Wachenfeldt K, Parker GJM and Olsson LE; TRISTAN
Consortium, : Contrast enhanced longitudinal changes observed in an
experimental bleomycin-induced lung fibrosis rat model by radial
DCE-MRI at 9.4T. PLoS One. 19:e03106432024. View Article : Google Scholar : PubMed/NCBI
|
|
11
|
Kodama N, Setoi A and Kose K: Spiral MRI
on a 9.4T vertical-bore superconducting magnet using unshielded and
self-shielded gradient coils. Magn Reson Med Sci. 17:174–183. 2018.
View Article : Google Scholar : PubMed/NCBI
|
|
12
|
Tripathi M, D'Souza M, Bal J, Guliani S,
Jain J, Santosh Sharma R and Mondal A: Comparision of F-18 FDG and
C-11 methionine PET/CT for demonstration of subependymal deposit in
a treated case of glioblastoma multiforme. Indian J Nucl Med.
26:91–93. 2011. View Article : Google Scholar : PubMed/NCBI
|
|
13
|
Zhou W, Wen J, Hua F, Xu W, Lu X, Yin B,
Geng D and Guan Y: 18F-FDG PET/CT in immunocompetent
patients with primary central nervous system lymphoma:
Differentiation from glioblastoma and correlation with DWI. Eur J
Radiol. 104:26–32. 2018. View Article : Google Scholar : PubMed/NCBI
|
|
14
|
Malik D: FDG PET/CT in recurrent
glioblastoma multiforme with leptomeningeal and diffuse spinal cord
metastasis. Clin Nucl Med. 46:138–139. 2021. View Article : Google Scholar : PubMed/NCBI
|
|
15
|
Kim SH, Lee SJ and Yu SM: Study of lipid
proton difference evaluation via 9.4T MRI analysis of fatty liver
induced by exposure to methionine and choline-deficient (MCD) diet
and high-fat diet (HFD) in an animal model. Chem Phys Lipids.
242:1051642022. View Article : Google Scholar : PubMed/NCBI
|
|
16
|
Pudelko L, Edwards S, Balan M, Nyqvist D,
Al-Saadi J, Dittmer J, Almlöf I, Helleday T and Bräutigam L: An
orthotopic glioblastoma animal model suitable for high-throughput
screenings. Neuro Oncol. 20:1475–1484. 2018. View Article : Google Scholar : PubMed/NCBI
|
|
17
|
Hsu W, Siu IM, Pradilla G, Gokaslan ZL,
Jallo GI and Gallia GL: Animal model of intramedullary spinal cord
glioma using human glioblastoma multiforme neurospheres. J
Neurosurg Spine. 16:315–319. 2012. View Article : Google Scholar : PubMed/NCBI
|
|
18
|
Underhill HR: A continuous-infusion
dynamic MRI model at 3.0 Tesla for the serial quantitative
evaluation of microvascular proliferation in an animal model of
glioblastoma multiforme. Magn Reson Med. 78:1824–1838. 2017.
View Article : Google Scholar : PubMed/NCBI
|
|
19
|
Bolcaen J, Descamps B, Deblaere K,
Boterberg T, Hallaert G, Van den Broecke C, Decrock E, Vral A,
Leybaert L, Vanhove C and Goethals I: MRI-guided 3D conformal arc
micro-irradiation of a F98 glioblastoma rat model using the Small
Animal Radiation Research Platform (SARRP). J Neurooncol.
120:257–266. 2014. View Article : Google Scholar : PubMed/NCBI
|
|
20
|
Helthuis JHG, van der Zwan A, van Doormaal
TPC, Bleys RLAW, Harteveld AA, van der Toorn A, Brozici M,
Hendrikse J and Zwanenburg JJM: High resolution 7T and 9.4T-MRI of
human cerebral arterial casts enables accurate estimations of the
cerebrovascular morphometry. Sci Rep. 8:142352018. View Article : Google Scholar : PubMed/NCBI
|
|
21
|
Tang H, Zhang Y, Dai C, Ru T, Li J, Chen
J, Zhang B, Zhou K, Lv P, Liu R, et al: Postmortem 9.4-T MRI for
fetuses with congenital heart defects diagnosed in the first
trimester. Front Cardiovasc Med. 8:7645872021. View Article : Google Scholar : PubMed/NCBI
|
|
22
|
Yun TJ, Cho HR, Choi SH, Kim H, Won JK,
Park SW, Kim JH, Sohn CH and Han MH: Antiangiogenic Effect of
bevacizumab: Application of arterial spin-labeling perfusion MR
imaging in a rat glioblastoma model. AJNR Am J Neuroradiol.
37:1650–1656. 2016. View Article : Google Scholar : PubMed/NCBI
|
|
23
|
Nickel A, Milford D, Fischer M, Bendszus M
and Heiland S: Effect of contrast agent dosage on longitudinal
relaxation time, signal and apparent tumor volume in glioblastoma
at 9.4T. Z Med Phys. 29:206–215. 2019. View Article : Google Scholar : PubMed/NCBI
|
|
24
|
Louis DN, Perry A, Wesseling P, Brat DJ,
Cree IA, Figarella-Branger D, Hawkins C, Ng HK, Pfister SM,
Reifenberger G, et al: The 2021 WHO classification of tumors of the
central nervous system: A summary. Neuro Oncol. 23:1231–1251. 2021.
View Article : Google Scholar : PubMed/NCBI
|
|
25
|
Hooper GW, Ansari S, Johnson JM and Ginat
DT: Advances in the radiological evaluation of and theranostics for
glioblastoma. Cancers (Basel). 15:41622023. View Article : Google Scholar : PubMed/NCBI
|
|
26
|
Naressi A, Couturier C, Devos JM, Janssen
M, Mangeat C, de Beer R and Graveron-Demilly D: Java-based
graphical user interface for the MRUI quantitation package. Magma.
12:141–152. 2001. View Article : Google Scholar : PubMed/NCBI
|
|
27
|
Mandal PK: In vivo proton magnetic
resonance spectroscopic signal processing for the absolute
quantitation of brain metabolites. Eur J Radiol. 81:e653–e664.
2012. View Article : Google Scholar : PubMed/NCBI
|
|
28
|
Jabłoński M, Starčuková J and Starčuk Z
Jr: Processing tracking in jMRUI software for magnetic resonance
spectra quantitation reproducibility assurance. BMC Bioinformatics.
18:562017. View Article : Google Scholar : PubMed/NCBI
|
|
29
|
Provencher SW: Estimation of metabolite
concentrations from localized in vivo proton NMR spectra. Magn
Reson Med. 30:672–679. 1993. View Article : Google Scholar : PubMed/NCBI
|
|
30
|
Provencher SW: Automatic quantitation of
localized in vivo 1H spectra with LCModel. NMR Biomed. 14:260–264.
2001. View Article : Google Scholar : PubMed/NCBI
|
|
31
|
Spence AM, Muzi M, Mankoff DA, O'Sullivan
SF, Link JM, Lewellen TK, Lewellen B, Pham P, Minoshima S, Swanson
K and Krohn KA: 18F-FDG PET of gliomas at delayed intervals:
Improved distinction between tumor and normal gray matter. J Nucl
Med. 45:1653–1659. 2004.PubMed/NCBI
|
|
32
|
Jansen JF, Schöder H, Lee NY, Stambuk HE,
Wang Y, Fury MG, Patel SG, Pfister DG, Shah JP, Koutcher JA and
Shukla-Dave A: Tumor metabolism and perfusion in head and neck
squamous cell carcinoma: Pretreatment multimodality imaging with 1H
magnetic resonance spectroscopy, dynamic contrast-enhanced MRI, and
[18F]FDG-PET. Int J Radiat Oncol Biol Phys. 82:299–307. 2012.
View Article : Google Scholar : PubMed/NCBI
|
|
33
|
Zhang Y, Zhang H, Zhang H, Ouyang Y, Su R,
Yang W and Huang B: Glioblastoma and solitary brain metastasis:
Differentiation by integrating demographic-MRI and Deep-learning
radiomics signatures. J Magn Reson Imaging. 60:909–920. 2024.
View Article : Google Scholar : PubMed/NCBI
|
|
34
|
Tsiouris S, Bougias C and Fotopoulos A:
Principles and current trends in the correlative evaluation of
glioma with advanced MRI techniques and PET. Hell J Nucl Med.
22:206–219. 2019.PubMed/NCBI
|
|
35
|
Fan H, Luo Y, Gu F, Tian B, Xiong Y, Wu G,
Nie X, Yu J, Tong J and Liao X: Artificial intelligence-based MRI
radiomics and radiogenomics in glioma. Cancer Imaging. 24:362024.
View Article : Google Scholar : PubMed/NCBI
|
|
36
|
Molina D, Perez-Beteta J, Luque B, Arregui
E, Calvo M, Borras JM, Lopez C, Martino J, Velasquez C, Asenjo B,
et al: Tumour heterogeneity in glioblastoma assessed by MRI texture
analysis: A potential marker of survival. Br J Radiol.
89:201602422016. View Article : Google Scholar : PubMed/NCBI
|
|
37
|
Clément A, Doyen M, Fauvelle F, Hossu G,
Chen B, Barberi-Heyob M, Hirtz A, Stupar V, Lamiral Z, Pouget C, et
al: In vivo characterization of physiological and metabolic changes
related to isocitrate dehydrogenase 1 mutation expcression by
multiparametric MRI and MRS in a rat model with orthotopically
grafted human-derived glioblastoma cell lines. NMR Biomed.
34:e44902021. View Article : Google Scholar : PubMed/NCBI
|
|
38
|
Kumar M, Arlauckas SP, Saksena S, Verma G,
Ittyerah R, Pickup S, Popov AV, Delikatny EJ and Poptani H:
Magnetic resonance spectroscopy for detection of choline kinase
inhibition in the treatment of brain tumors. Mol Cancer Ther.
14:899–908. 2015. View Article : Google Scholar : PubMed/NCBI
|
|
39
|
Shukla G, Alexander GS, Bakas S, Nikam R,
Talekar K, Palmer JD and Shi W: Advanced magnetic resonance imaging
in glioblastoma: A review. Chin Clin Oncol. 6:402017. View Article : Google Scholar : PubMed/NCBI
|
|
40
|
Aleid AM, Alrasheed AS, Aldanyowi SN and
Almalki SF: Advanced magnetic resonance imaging for glioblastoma:
Oncology-radiology integration. Surg Neurol Int. 15:3092024.
View Article : Google Scholar : PubMed/NCBI
|
|
41
|
Han X, Xiao K, Bai J, Li F, Cui B, Cheng
Y, Liu H and Lu J: Multimodal MRI and 1H-MRS for
preoperative stratification of high-risk molecular subtype in
adult-type diffuse gliomas. Diagnostics (Basel). 14:25692024.
View Article : Google Scholar : PubMed/NCBI
|
|
42
|
Wang L, Chen G and Dai K: Hydrogen proton
magnetic resonance spectroscopy (MRS) in differential diagnosis of
intracranial tumors: A systematic review. Contrast Media Mol
Imaging. 2022:72421922022. View Article : Google Scholar : PubMed/NCBI
|
|
43
|
Wilson M, Andronesi O, Barker PB, Bartha
R, Bizzi A, Bolan PJ, Brindle KM, Choi IY, Cudalbu C, Dydak U, et
al: Methodological consensus on clinical proton MRS of the brain:
Review and recommendations. Magn Reson Med. 82:527–550. 2019.
View Article : Google Scholar : PubMed/NCBI
|
|
44
|
Henning A: Proton and multinuclear
magnetic resonance spectroscopy in the human brain at ultra-high
field strength: A review. Neuroimage. 168:181–198. 2018. View Article : Google Scholar : PubMed/NCBI
|
|
45
|
Tran D, Nguyen DH, Nguyen HK, Nguyen-Thanh
VA, Dong-Van H and Nguyen MD: Diagnostic performance of MRI
perfusion and spectroscopy for brainstem glioma grading. Eur Rev
Med Pharmacol Sci. 26:7938–7948. 2022.PubMed/NCBI
|
|
46
|
Shi Y, Liu D, Kong Z, Liu Q, Xing H, Wang
Y, Wang Y and Ma W: Prognostic value of choline and other
metabolites measured using 1H-magnetic resonance
spectroscopy in gliomas: A meta-analysis and systemic review.
Metabolites. 12:12192022. View Article : Google Scholar : PubMed/NCBI
|
|
47
|
Li J, Sun J, Wang N and Zhang Y: Study on
the relationship between MRI functional imaging and multiple
immunohistochemical features of glioma: A noninvasive and more
precise glioma management. Mol Imaging. 23:153535082412615832024.
View Article : Google Scholar : PubMed/NCBI
|
|
48
|
Gao W, Wang X, Li F, Shi W, Li H and Zeng
Q: Cho/Cr ratio at MR spectroscopy as a biomarker for cellular
proliferation activity and prognosis in glioma: Correlation with
the expression of minichromosome maintenance protein 2. Acta
Radiol. 60:106–112. 2019. View Article : Google Scholar : PubMed/NCBI
|
|
49
|
Bhaduri S, Kelly CL, Lesbats C, Sharkey J,
Ressel L, Mukherjee S, Platt MD, Delikatny EJ and Poptani H:
Metabolic changes in glioblastomas in response to choline kinase
inhibition: In vivo MRS in rodent models. NMR Biomed. 36:e48552023.
View Article : Google Scholar : PubMed/NCBI
|
|
50
|
Nakamura H, Doi M, Suzuki T, Yoshida Y,
Hoshikawa M, Uchida M, Tanaka Y, Takagi M and Nakajima Y: The
significance of lactate and lipid peaks for predicting primary
neuroepithelial tumor grade with proton MR spectroscopy. Magn Reson
Med Sci. 17:238–243. 2018. View Article : Google Scholar : PubMed/NCBI
|
|
51
|
Hnilicová P, Richterová R, Kantorová E,
Bittšanský M, Baranovičová E and Dobrota D: Proton MR spectroscopic
imaging of human glioblastomas at 1.5 Tesla. Gen Physiol Biophys.
36:531–537. 2017. View Article : Google Scholar : PubMed/NCBI
|
|
52
|
Steidl E, Pilatus U, Hattingen E,
Steinbach JP, Zanella F, Ronellenfitsch MW and Bähr O: Myoinositol
as a biomarker in recurrent glioblastoma treated with bevacizumab:
A 1H-magnetic resonance spectroscopy study. PLoS One.
11:e01681132016. View Article : Google Scholar : PubMed/NCBI
|
|
53
|
Zajkowska K, Cegla P and Dedecjus M: Role
of [18F]FDG PET/CT in the management of follicular
cell-derived thyroid carcinoma. Cancer Imaging. 24:1472024.
View Article : Google Scholar : PubMed/NCBI
|
|
54
|
Li T, Xu D, Ruan Z, Zhou J, Sun W, Rao B
and Xu H: Metabolism/immunity dual-regulation thermogels
potentiating immunotherapy of glioblastoma through
lactate-excretion inhibition and PD-1/PD-L1 blockade. Adv Sci
(Weinh). 11:e23101632024. View Article : Google Scholar : PubMed/NCBI
|
|
55
|
Patching SG: Glucose transporters at the
blood-brain barrier: Function, regulation and gateways for drug
delivery. Mol Neurobiol. 54:1046–1077. 2017. View Article : Google Scholar : PubMed/NCBI
|
|
56
|
Hatano T, Zhao S, Zhao Y, Nishijima K,
Kuno N, Hanzawa H, Sakamoto T, Tamaki N and Kuge Y: Biological
characteristics of intratumoral [F-18]-fluoromisonidazole
distribution in a rodent model of glioma. Int J Oncol. 42:823–830.
2013. View Article : Google Scholar : PubMed/NCBI
|
|
57
|
Stocksdale B, Nagpal S, Hixson JD, Johnson
DR, Rai P, Shivaprasad A and Tremont-Lukats IW: Neuro-oncology
practice clinical debate: Long-term antiepileptic drug prophylaxis
in patients with glioma. Neurooncol Pract. 7:583–588.
2020.PubMed/NCBI
|
|
58
|
Doblas S, He T, Saunders D, Hoyle J, Smith
N, Pye Q, Lerner M, Jensen RL and Towner RA: In vivo
characterization of several rodent glioma models by 1H MRS. NMR
Biomed. 25:685–694. 2012. View Article : Google Scholar : PubMed/NCBI
|