Introduction
Breast cancer is the most prevalent cancer among
women globally. GLOBOCAN estimated there would be 2.3 million new
cases of breast cancer in 2022; breast cancer also caused 670,000
deaths in 2022, accounting for 25.0% of female cancer cases and
15.5% of cancer-related deaths (1).
Among its subtypes, triple-negative breast cancer (TNBC) is
particularly aggressive as it lacks hormone receptors and HER2
expression. This limitation restricts the availability of targeted
therapies for patients with TNBC (2–4). The
aggressive nature of TNBC necessitates the urgent elucidation of
novel molecular drivers of its progression.
Emerging evidence indicates that metabolic
reprogramming constitutes a fundamental hallmark of tumor
progression. This characteristic is especially critical in rapidly
proliferating tumors such as TNBC, which exhibit heightened demands
for energy and biosynthetic resources (5–7). The
Warburg effect (8), characterized
by aerobic glycolysis, is well-documented. However, mitochondrial
function, including oxidative phosphorylation and dynamics, plays a
critical role in facilitating tumor cell survival, proliferation
and adaptation to stress (9,10).
Mitochondria are essential components of cellular metabolism and
the preservation of their integrity is imperative (11).
Mitophagy, the selective degradation of damaged
mitochondria, is crucial for maintaining mitochondrial quality and
regulating cellular metabolism (12–14).
PTEN-induced kinase 1 (PINK1) plays a central role in this process
(15). Under normal conditions,
PINK1 is rapidly degraded; however, upon mitochondrial damage, it
accumulates on the outer membrane and recruits the E3 ligase Parkin
to initiate mitophagy (16). While
PINK1 has been recognized for its neuroprotective role in
Parkinson's disease, studies have also revealed its dualistic
function in cancer biology (17–19).
In breast cancer, particularly TNBC, high PINK1 expression is
associated with poor prognosis (20). Notably, PINK1 exhibits
context-dependent roles in cancer, suppressing tumorigenesis in
liver and renal cancer while correlating with poor prognosis in
breast, ovarian and lung cancer (21–24).
Mechanistically, PINK1-mediated mitophagy is
hypothesized to facilitate cancer progression; it achieves this by
maintaining mitochondrial integrity, ensuring ATP production and
alleviating oxidative stress (25,26). A
recent investigation indicated that PINK1 may also modulate
glycolytic flux by regulating key glycolytic enzymes (20). PINK1-driven mitophagy interacts with
metabolic reprogramming by upregulating phosphoglycerate kinase 2
(PGK2) to enhance glycolytic flux, increasing glucose uptake and
elevating pyruvate/acetyl-CoA levels; this interplay promotes TNBC
pathogenesis. Specifically, this mechanism could be crucial for
driving tumor growth, facilitating migration and developing
resistance to therapies in TNBC (27). PGK2 is a notable enzyme in the
glycolytic pathway, catalyzing the conversion of
glycerol-1,3-diphosphate into 3-phosphoglycerate, while
simultaneously producing ATP (28).
Furthermore, PGK2 influences DNA replication and repair in
mammalian nuclei (29,30). PGK2 expression is regulated by
oxygen tension, with elevated expression levels often correlating
with accelerated tumor growth and a stronger anaerobic growth
phenotype (31). Emerging evidence
suggests that PGK2, traditionally regarded as testis-specific, is
also expressed in various malignancies (32). PGK2 is a specific form found in
spermatogenic cells and in renal, breast, pancreatic, ovarian and
testicular cancer cells (33,34).
Studies have emphasized the role of PGK2 in cancer, particularly
its upregulation in ovarian cancer, linking it to metabolic
reprogramming and tumor progression (35,36).
However, its precise role in breast cancer remains to be
elucidated.
The present study aimed to investigate the potential
oncogenic roles of PINK1 in breast cancer, emphasizing its
involvement in metabolic reprogramming through mitophagy.
Specifically, the present study explored whether PGK2 acts as a
downstream effector of PINK1-associated metabolic regulation. Using
gain- and loss-of-function approaches, the present study examined
the relationship between PINK1-mediated mitophagy and glycolytic
metabolism, as well as its potential impact on malignant phenotypes
in luminal and TNBC cells. By elucidating the link between
mitochondrial quality control and metabolic reprogramming, this
work sought to provide insights into the role of the PINK1-PGK2
axis in breast cancer progression and its potential therapeutic
relevance, particularly in TNBC.
Materials and methods
Data collection
Gene expression data for patients with breast cancer
were downloaded from the Xena database (https://xenabrowser.net/datapages/). The dataset
includes 1,226 samples, consisting of 1,113 breast cancer tumor
samples and 113 normal control samples, which were collected using
Illumina HiSeq 2000 sequencing technology (37). These data correspond to The Cancer
Genome Atlas-Breast Invasive Carcinoma (TCGA-BRCA) project (dbGaP:
phs000178). The original study describing this dataset was
conducted by TCGA Network (https://portal.gdc.cancer.gov/) (38). This dataset was used to explore the
gene expression profiles of patients with breast cancer, providing
insight into the molecular mechanisms involved in tumor progression
and the role of PINK1-mediated mitophagy.
Screening of differentially expressed
genes (DEGs)
To identify DEGs associated with mitochondrial
autophagy in breast cancer, transcriptomic data from the TCGA-BRCA
dataset were utilized. Tumor and normal control samples were
categorized into the Tumor and Normal groups. Differential gene
expression analysis was conducted using the DESeq2 package in R
(v4.3.1) (https://www.r-project.org/), with a
threshold for selecting DEGs set at false discovery rate (FDR)
<0.05 and log2 fold change (FC) >1. Significant DEGs were
visualized using heatmaps generated with the heatmap package and
volcano plots created with ggplot2, both implemented in the R
statistical environment. Subsequently, the selected DEGs underwent
functional enrichment analysis utilizing the clusterProfiler
package in R (v4.3.1). Gene Ontology (GO) (http://geneontology.org/) and Kyoto Encyclopedia of
Genes and Genomes (KEGG) (https://www.kegg.jp/) (39) pathway enrichment analyses were
performed to identify the biological processes and signaling
pathways associated with the DEGs. An FDR threshold of <0.05 was
used to define significant enrichments.
Differential expression of mitophagy
and glycolysis genes
To identify DEGs associated with mitophagy and
glycolysis in breast cancer, mitochondrial autophagy-related gene
sets were compiled from the literature and the MSigDB database
(40). The mitophagy gene sets were
obtained and curated using Metascape (https://metascape.org), including GOBP_MITOPHAGY,
GOBP_PARKIN_MEDIATED_STIMULATION_OF_MITOPHAGY_IN_RESPONSE_TO_MITOCHONDRIAL_DEPOLARIZATION,
GOBP_POSITIVE_REGULATION_OF_MITOPHAGY,
GOBP_POSITIVE_REGULATION_OF_MITOPHAGY_IN_RESPONSE_TO_MITOCHONDRIAL_DEPOLARIZATION,
GOBP_REGULATION_OF_MITOPHAGY, REACTOME_MITOPHAGY,
REACTOME_PINK1_PRKN_MEDIATED_MITOPHAGY and
REACTOME_RECEPTOR_MEDIATED_MITOPHAGY. Similarly, glycolysis-related
gene sets, such as BIOCARTA_GLYCOLYSIS_PATHWAY,
GOBP_GLYCOLYTIC_PROCESS_THROUGH_FRUCTOSE_6_PHOSPHATE,
GOBP_GLYCOLYTIC_PROCESS_THROUGH_GLUCOSE_6_PHOSPHATE,
HALLMARK_GLYCOLYSIS, KEGG_GLYCOLYSIS_GLUCONEOGENESIS,
KEGG_MEDICUS_REFERENCE_GLYCOLYSIS, MOOTHA_GLYCOLYSIS,
REACTOME_GLYCOLYSIS and WP_GLYCOLYSIS_AND_GLUCONEOGENESIS, were
also downloaded from the same databases. Next, the genes listed
under each category were extracted, duplicates were removed and
they were categorized into two groups: Mitophagy-related genes and
glycolysis-related genes. The intersection of the DEGs with these
gene sets were then identified. The overlapping genes for mitophagy
and glycolysis were termed Mito-DEGs and Glyco-DEGs, respectively,
and were used for subsequent analysis.
Enrichment and correlation analysis of
mitophagy and glycolysis
Utilizing the expression matrix from the TCGA-BRCA
cohort, single sample gene set enrichment analysis (ssGSEA) was
performed to calculate enrichment scores for the mitophagy and
glycolysis gene sets in each sample (41). To assess the statistical differences
between the Tumor and Normal groups, the Wilcoxon rank-sum test was
applied (42). A significance
threshold of P<0.05 |log2 FC|>1 was established. Results were
visualized using ggplot2 to illustrate the differential enrichment
of pathways between the two groups. Furthermore, based on the
differential gene expression results from the Tumor and Normal
groups, the GSEABase package in R (v4.3.1) was utilized to analyze
the enrichment of the mitophagy and glycolysis gene sets (43). The enrichplot package in R was
subsequently employed to generate enrichment result plots. To
evaluate the correlation between mitophagy and glycolysis, the
Spearman correlation coefficient was calculated based on the
enrichment scores of the respective gene sets in the tumor samples.
Statistical significance for these correlations was defined as
P<0.05. The relationship between differential glycolysis genes
and mitophagy pathway enrichment scores was also analyzed using
Spearman's correlation coefficient. The results of these
correlation analyses were visualized using scatter plots.
PINK1 single-gene functional
enrichment analysis
Based on the expression levels of PINK1 in the Tumor
samples from the TCGA-BRCA cohort, the samples were divided into
two groups: PINK1-high and PINK1-low, using the median expression
value as the threshold. DEGs between these two groups were
identified using the DESeq2 package in R (44). A threshold of FDR<0.05 and |log2
FC|>1 was applied to select significant DEGs. The DEGs were
visualized using heatmaps created with the heatmap package and
volcano plots generated with ggplot2 (45). Subsequently, functional enrichment
analysis of the selected DEGs was performed using the
clusterProfiler package in R (46).
GO functional annotation and KEGG pathway enrichment analysis were
conducted, with an FDR threshold of <0.05 to define significant
enrichment (46).
Immune-related analysis
The CIBERSORT algorithm (47) (https://cibersort.stanford.edu/index.ph) was utilized
to calculate the infiltration scores of 22 immune cell types in the
breast cancer samples. The correlation between PINK1 expression
levels and the distribution of these immune cell proportions was
then analyzed using the Spearman correlation coefficient test in R
(v4.3.1) (48). A threshold of
P<0.05 was set to define significant correlations. Next,
cancer-associated fibroblasts (CAFs), M1 macrophage and M2
macrophage-related genes were collected from the literature. The
Spearman correlation coefficient was calculated to assess the
relationship between PINK1 expression and the expression of these
genes. P<0.05 was used to determine significant correlations.
The correlation analysis results were visualized using scatter
plots, and the top three genes with the highest correlation
coefficients for each group were displayed.
Prognostic correlation analysis
To evaluate the prognostic significance of PINK1 and
the related gene sets, gene expression data were integrated with
clinical survival outcomes. This was achieved by combining
individual gene expression levels with ssGSEA enrichment scores for
specific gene sets. These gene sets were selected based on their
relevance to processes such as mitophagy, metabolism and the immune
response. The survival analysis was conducted using the survival
package (v2.41–1) in R (v4.3.1) (49). Kaplan-Meier survival curves and
log-rank tests were used to compare survival outcomes between high
and low expression groups for each gene or gene set. Additionally,
Cox proportional hazards regression models were employed to assess
the independent prognostic value of PINK1 and its associated genes.
This comprehensive analysis aimed to identify potential biomarkers
and to improve the understanding of how PINK1-related pathways
influence breast cancer prognosis, providing insights for patient
stratification and targeted therapeutic approaches.
Cell lines and cell culture
Two breast cancer cell lines, MCF-7 (hormone
receptor-positive) and MDA-MB-231 (triple-negative and highly
invasive) were procured from the Cell Bank, Shanghai Institute of
Biochemistry and Cell Biology, Chinese Academy of Sciences, Chinese
Academy of Sciences. MCF-7 cells, recognized for their
hormone-dependent characteristics, and MDA-MB-231 cells, noted for
their aggressive metastatic potential, were selected to represent
distinct molecular subtypes of breast cancer (50). MCF-7 cells were cultured in
RPMI-1640 medium (Procell Life Science & Technology Co., Ltd.;
cat. no. PM150110), while MDA-MB-231 cells were maintained in L-15
medium (Gibco; Thermo Fisher Scientific, Inc.; cat. no. 11415064)
at 37°C with 5% CO2. All cell lines underwent short
tandem repeat profiling and mycoplasma testing to verify
authenticity and sterility. All cell lines were cultured in media
supplemented with 10% fetal bovine serum (FBS; Gibco; Thermo Fisher
Scientific, Inc.). Passage numbers were kept below 20 for
consistency. Routine mycoplasma testing was performed using the
MycoAlert Mycoplasma Detection Kit (Lonza Group Ltd.; cat. no.
LT07-218) to ensure cell culture integrity.
Cell transfection
To evaluate the functional impact of PINK1, four
experimental groups were established: Empty vector negative control
(OE-NC), PINK1 overexpression (PINK1-OE), short hairpin RNA (shRNA)
targeting PINK1 (sh-PINK1) and sh-NC. Constructs for PINK1-OE and
sh-PINK1 were generated using pLV3 lentiviral vector (MiaoLing Bio;
lot. no. P693631) incorporating NotI/XhoI restriction
sites for the insertion of the human PINK1 coding sequence (NCBI
accession NM_032409.2). OE-NC and sh-NC comprised empty plasmids.
PINK1 overexpression plasmids (lot. no. P69631) and sh-PINK1
constructs (lot. no. P50879) were obtained from Wuhan MiaoLing
Biotech Science Co., Ltd. Constructs for PINK1-OE and silencing
PGK2 (siPGK2) were used to assess the effects of metabolic
suppression in breast cancer cells. Transfection was conducted
using Lipofectamine 3000 (Thermo Fisher Scientific, Inc.; cat. no.
L3000015) following the manufacturer's protocol. Specifically, 2 µg
of plasmid DNA was mixed with 100 µl of Opti-MEM I medium (Gibco;
Thermo Fisher Scientific, Inc.; cat. no. 31985070), and 6 µl of
Lipofectamine 3000 was separately diluted in another 100 µl of
Opti-MEM I. The two solutions were combined, incubated for 15 min
at room temperature and then added dropwise to MCF-7 and MDA-MB-231
breast cancer cells seeded in 6-well plates. Cells were incubated
for 24 h post-transfection prior to downstream assays at 37°C. This
methodology ensured efficient modulation of PINK1 expression for
assessing its role in mitophagy and metabolic remodeling in breast
cancer cells. For siRNA transfection, two siRNA oligonucleotides
targeting PGK2 were designed: siRNA-1 sense,
5′-GAAGUUGACUUUAGACAAA-3′ and antisense, 5′-UUUGUCUAAAGUCAACUUC-3′;
siRNA-2 sense, 5′-GGGACAAGUUUGACGAGAA-3′ and antisense,
5′-UUCUCGUCAAACUUGUCCC-3′. In the experiment, an NC siRNA (siNC),
sense 5′-UUGAUGUGUUUAGUCGCUAtt-3′ and antisense
5′-UAGCGACUAAACACAUCAAtt-3′ was included to rule out non-specific
effects. For PINK1 knockdown, a shRNA targeting the sequence
5′-GAAGCCACCATGCCTACATTGT-3′ was used. sh-NC targeted the sequence
5′-GCGTGATCTTCACCGACAAGA-3′.
Chemical synthesis of siPGK2
PGK2-targeting siRNA sequences were designed from
human PGK2 mRNA (NCBI RefSeq: NM_138733.5). RNA oligonucleotides
were synthesized by solid-phase phosphoramidite chemistry on a CPG
column (Glen Research; cat. no. 20-3330; 1000 Å, 1 µmol) using
2′-O-TBDMS RNA phosphoramidites (Glen Research; Bz-A-CE, cat. no.
10-3003; Ac-C-CE, cat. no. 10-3015; Ac-G-CE, cat. no. 10-3025;
U-CE, cat. no. 10-3030) on an Applied Biosystems 394 DNA/RNA
Synthesizer (Thermo Fisher Scientific, Inc.). Oligonucleotides were
cleaved and base-deprotected with a ammonium hydroxide-methylamine
mixture [1:1 ammonium hydroxide, Sigma-Aldrich (Merck KGaA), cat.
no. A2706; methylamine, Sigma-Aldrich (Merck KGaA), cat. no.
M2769], followed by 2′-O-TBDMS removal using triethylamine
trihydrofluoride (Sigma-Aldrich; Merck KGaA; cat. no. 344648) in
DMSO (65°C, 2.5 h). RNAs were purified by RP-HPLC (Agilent 1260
Infinity; ZORBAX Eclipse Plus C18; 4.6×250 mm, 5 µm; cat. no.
959963-902) and annealed to generate duplex siRNA.
Reverse transcription-quantitative
polymerase chain reaction (RT-qPCR) assays
For RT-qPCR, total RNA was extracted from MCF-7 and
MDA-MB-231 breast cancer cells across the OE-NC, PINK1-OE, sh-NC,
sh-PINK1, si-NC and si-PGK2 experimental groups. RNA isolation was
carried out using TRIzol reagent (Beyotime Biotechnology; cat. no.
R1100) in accordance with the manufacturer's instructions.
First-strand cDNA was synthesized using the RNA cDNA First Strand
Synthesis Kit (Wuhan Servicebio Technology Co., Ltd.; cat. no.
G3330), according to the manufacturer's instructions, which
included a 50°C incubation step for 60 min with oligo(dT) primers.
qPCR analysis was performed on a Bioer fluorescence PCR system
using SYBR Green Master Mix (Shanghai Yeasen Biotechnology Co.,
Ltd.; cat. no. 11201ES). The amplification protocol consisted of
initial denaturation at 95°C for 10 min, followed by 40 cycles of
95°C for 15 sec and 60°C for 60 sec. Relative gene expression was
calculated using the 2−ΔΔCq method (51), normalized to GAPDH. The primer
sequences were as follows: PINK1 forward,
5′-CCCTCACCCCAACATCATCC-3′ and reverse, 5′-ATAACGAGGAACAGCGTCCG-3′;
GAPDH forward, 5′-TCCAAAATCAAGTGGGGCGA-3′ and reverse
5′-AAATGAGCCCCAGCCTTCTC-3′; PGK2 forward, 5′-AACCCAGTGAGACCCTTTC-3′
and reverse 5′-ACCTGAGCGTTCTCGTCA-3′.
Western blot analysis
MCF-7 and MDA-MB-231 breast cancer cells from the
OE-NC, PINK1-OE, sh-NC and sh-PINK1 groups were lysed in RIPA
buffer (Epizyme; Ipsen Pharma; cat. no. PC101) supplemented with
protease inhibitors. Protein concentrations were determined using a
BCA kit (Thermo Fisher Scientific, Inc.; cat. no. 23225). Equal
amounts of protein (30 µg) were separated by 10% SDS-PAGE (15% for
LC3 detection) and transferred to PVDF membranes (MilliporeSigma;
cat. no. IPVH00010). The 15% gel improves separation of small LC3
proteins, enabling precise LC3-I/II quantification, key for
assessing mitophagy. Larger proteins such as PINK1 and Parkin are
well detected on standard gels, so no high-percentage gel was
needed. Membranes were blocked with blocking buffer (Epizyme; Ipsen
Pharma; cat. no. PS108) for 1 h at room temperature, then incubated
overnight at 4°C with the following primary antibodies: PINK1
(1:1,000; Hangzhou HuaAn Biotechnology Co., Ltd.; cat. no.
HA723021), Parkin (1:1,000; Hangzhou HuaAn Biotechnology Co., Ltd.;
cat. no. HA722952), LC3 (1:1,000; Cell Signaling Technology, Inc.;
cat. no. 12741), β-actin (1:5,000; Cell Signaling Technology, Inc.;
cat. no. 4970) and PGK2 (1:1,000; Proteintech Group, Inc.; cat. no.
13686-1-AP). After washing, HRP-conjugated secondary antibodies
(1:5,000; Proteintech Group, Inc.; cat. no. SA00001-2) were applied
for 2 h at room temperature. Signal was visualized using ECL
reagent (MilliporeSigma; cat. no. WBKLS0100) and imaged with Image
Lab software (version 6.0, Bio-Rad Laboratories, Hercules,
Inc.).
Transmission electron microscopy
(TEM)
Cells from OE-NC, PINK1-OE, sh-NC and sh-PINK1
groups were digested with trypsin and collected at 1×10⁶
cells per sample. Following centrifugation at 1,200 × g for 10 min
at 4°C, cell pellets were fixed in 2.5% glutaraldehyde
(MilliporeSigma; cat. no. G5882) in 0.1 M phosphate buffer (pH 7.4)
overnight at 4°C. Post-fixation was conducted with 1% osmium
tetroxide for 2 h at room temperature to stabilize cellular
ultrastructure (notably lipids) and enhance contrast for electron
microscopy. Samples were dehydrated sequentially in 50, 70 and 90%
ethanol, followed by a 1:1 mixture of 90% ethanol and 90% acetone,
then 90% acetone alone. Final dehydration was completed in 100%
acetone for 20 min at 4°C. The samples were embedded in epoxy resin
and polymerized at 60°C for 24 h. Ultrathin sections (70–90 nm)
were prepared with an ultramicrotome (Leica Microsystems GmbH;
Model EM UC7) and double-stained with uranyl acetate for 15 min and
lead citrate 10 min at 25°C. TEM was performed using a JEOL
JEM-1400 transmission electron microscope to assess mitochondrial
morphology and autophagosome structures. Digital images were
obtained to evaluate the extent of PINK1-mediated mitophagic
activity. ImageJ software (National Institutes of Health; version
1.54h), equipped with the JACoP plugin (v2.0), was used for the
quantitative analysis of autophagic vesicles in TEM images.
Cell proliferation detection
Cells were seeded in 96-well plates at a density of
2×10³ cells per well and cultured for 0–96 h. At each
designated time point (0, 24, 48, 72 and 96 h), 10 µl of Cell
Counting Kit-8 (CCK-8) reagent (Sangon Biotech Co., Ltd.; cat. no.
E606335-500) was added to each well. Following a 2-h incubation
period at 37°C, the absorbance at 450 nm was measured using a
Bio-Rad Laboratories, Inc. microplate reader. Control wells
containing only medium and CCK-8 without cells were included for
background subtraction, while peripheral wells were filled with PBS
to mitigate edge effects. Proliferation curves were constructed
from the absorbance values to evaluate the influence of PINK1
modulation on cellular growth dynamics.
Flow cytometry-based glucose uptake
assay
MCF-7 and MDA-MB-231 cells (OE-NC, PINK1-OE and
PINK1-OE + siPGK2 groups) were cultured in glucose-free DMEM
(Gibco; Thermo Fisher Scientific, Inc.; cat. no. 11966025)
containing 10% FBS for 24 h to synchronize metabolic activity.
Cells were seeded into 6-well plates at 2×10⁵ cells per
well. After removing the medium and washing with PBS, 1 ml of
2-NBDG working solution (Beyotime Biotechnology; cat. no. S0561S)
was added. Plates were incubated at 37°C for 30 min in the dark.
Afterwards, cells were washed twice with PBS and glucose uptake was
assessed by flow cytometry (Thermo Fisher Scientific, Inc.; cat.
no. A59358) based on 2-NBDG fluorescence. Data were acquired and
analyzed using Attune™ Xenith Software (Thermo Fisher
Scientific, Inc.; version 1.3). Cells were gated using forward and
side scatter to exclude debris and doublets. Fluorescence
thresholds were set with unstained control (empty) cells as the
baseline and populations exceeding this threshold were defined as
positive. All flow cytometry experiments were performed in
triplicate (n=3).
Wound healing assay for migration
MCF-7 and MDA-MB-231 breast cancer cells [from the
experimental groups OE-NC, PINK1-OE, sh-NC, sh-PINK1 and PINK1-OE
combined with the silencing PGK2 (PINK1-OE + siPGK2)] were seeded
into 6-well plates that were pre-marked with three parallel
reference lines using a sterile ruler. Cells were cultured in DMEM
supplemented with 10% FBS until they attained 100% confluency. A
200 µl pipette tip was utilized to create uniform scratches across
the monolayer, intersecting the reference lines for standardized
imaging positions. Plates were incubated at 37°C with 5%
CO2 with medium supplemented with 0% FBS, and scratch
closure was monitored at 0 and 24 h using an Olympus IX73
microscope (10X objective). ImageJ software was employed to analyze
the residual scratch areas normalized to initial widths, to
quantify migration rates.
Transwell invasion assay
Transwell invasion assays were conducted using
Matrigel-coated Corning chambers (Corning, Inc.; cat. no. 354480).
MCF-7 and MDA-MB-231 cells from the OE-NC, PINK1-OE, sh-NC,
sh-PINK1 and PINK1-OE + siPGK2 groups were resuspended in
serum-free medium and 1×10⁴ cells were seeded into the
upper chambers of 24-well plates. The lower chambers were filled
with 500 µl DMEM containing 10% FBS. After 48 h of incubation at
37°C, the inserts were fixed in 4% paraformaldehyde at room
temperature for 30 min and stained with crystal violet (Wuhan
Servicebio Technology Co., Ltd.; cat. no. G1014) for 30 min at
25°C. Non-invading cells on the upper surface were gently wiped off
and invaded cells on the underside were imaged and counted using an
Olympus IX71 light microscope to evaluate cell invasion under
various conditions.
Targeted metabolite assays
MCF-7 and MDA-MB-231 breast cancer cells (OE-NC,
PINK1-OE, sh-NC and sh-PINK1 groups) were lysed in ice-cold RIPA
buffer supplemented with protease inhibitors. After centrifugation
(12,000 × g, 15 min, 4°C), supernatants were collected for targeted
metabolite assays. PGK2 levels were quantified using the PGK2 ELISA
Kit (Jianglai Biotechnology). Specifically, supernatants (50
µl/well) and biotinylated capture antibodies were incubated in
pre-coated 96-well plates for 60 min at 37°C, followed by
streptavidin-HRP conjugate incubation and TMB substrate development
(15 min in the dark). Pyruvate concentrations were determined via
the Pyruvate Colorimetric Assay Kit (Sigma-Aldrich; Merck KGaA;
cat. no. MAK567, USA). Specifically, cell lysates (50 µl) were
mixed with 2,4-dinitrophenylhydrazine reagent, incubated at 37°C
for 30 min and absorbance was measured at 520 nm. Acetyl-CoA
content was assessed using the Acetyl-CoA ELISA Kit (Wuhan
Elabscience Biotechnology Co., Ltd.; cat. no. E-BC-F046-48T-ELS).
Specifically, samples were diluted 1:5 in assay buffer, transferred
to antibody-coated plates with serial standards (0–240 ng/ml),
incubated with HRP-conjugated detection antibody (60 min at 37°C)
and developed with TMB. Reactions for all assays were terminated
with 2 M H2SO4 and absorbance at 450 nm
(reference 630 nm) was measured using a microplate reader. Total
protein normalization was performed via BCA assay, with results
expressed as ng/mg protein.
Statistical analysis
All statistical analyses were conducted using SPSS
version 18.0 (SPSS, Inc.) and GraphPad Prism 9.0 (Dotmatics).
Comparisons between two groups were performed using a unpaired
two-tailed Student's t-test, while comparisons among more than two
groups were analyzed using one-way ANOVA followed by Tukey's
post-hoc test. For non-parametric data, such as differences in
enrichment scores between tumor and normal tissues, the
Mann-Whitney U test was applied. Spearman's rank correlation
coefficient was employed to assess associations between continuous
variables. Kaplan-Meier survival curves were generated and compared
using the log-rank test. GSEA was conducted to identify
significantly enriched pathways. P<0.05 was considered to
indicate a statistically significant difference. All data are
presented as the mean ± standard error of the mean derived from at
least three independent experiments.
Results
Differential expression and enrichment
in breast cancer
To investigate the transcriptional alterations in
breast cancer progression and their relationship with
PINK1-mediated mitophagy, a differential expression analysis
utilizing TCGA-BRCA RNA-sequencing data was conducted. The analysis
identified a total of 12,077 DEGs, comprising 7,995 upregulated and
4,082 downregulated genes. A volcano plot (Fig. S1A) and a heatmap of the top 30 DEGs
(Fig. S1B) were generated to
visualize the expression patterns. The volcano plot distinctly
highlighted the significantly upregulated genes in red and
downregulated genes in green, while the heatmap illustrated the
expression levels of the top 30 DEGs across samples, with a color
gradient representing expression intensity. GO and KEGG enrichment
analyses revealed significant enrichment in several classical
pathways (Fig. S1C-F). The GO
enrichment analysis indicated that upregulated DEGs were
significantly associated with biological processes such as cell
cycle regulation, chromosomal segregation and organelle fission
(Fig. S1C). The most significant
terms, based on gene ratios, were ‘organelle fission’ and
‘chromosomal segregation’, with notable enrichment in cell
cycle-related processes. Furthermore, structural components such as
‘sarcomeres’, ‘ion channel complexes’ and ‘actin-binding elements’
were significantly enriched (Fig.
S1D), underscoring their relevance to mitochondrial dynamics
and cellular structure. These processes are closely linked to
mitochondrial dynamics and cellular energy regulation, suggesting a
potential enhancement of mitophagy.
KEGG pathway analysis indicated notable enrichment
in immune-related pathways, particularly ‘cytokine-cytokine
receptor interactions’ and ‘viral protein interactions with
cytokines’ (Fig. S1E). These
immune pathways may influence the tumor microenvironment and
interact with mitochondrial function, suggesting a connection to
metabolic reprogramming in breast cancer progression. Conversely,
metabolic and signaling pathways, including ‘PI3K-Akt signaling’,
‘calcium signaling’ and ‘extracellular matrix-receptor
interactions’, were also notably upregulated (Fig. S1F). These pathways are essential
for mitochondrial quality control and metabolic reprogramming,
indicating that factors such as immune signaling and metabolic
pathways may drive metabolic and structural changes by regulating
both immune and metabolic signaling pathways. This aligns with
prior studies emphasizing the role of mitophagy in tumor
progression and energy metabolism, supporting the hypothesis that
mitophagy is crucial in breast cancer (52,53).
Detailed results on the DEGs and functional enrichment are
available in Table SI.
PINK1-mediated mitophagy and immune
evasion
Building on the transcriptomic evidence from a
PINK1-associated dataset suggesting the enrichment of
mitophagy-related pathways in metabolic reprogramming, the clinical
and immunological relevance of PINK1 was further investigated using
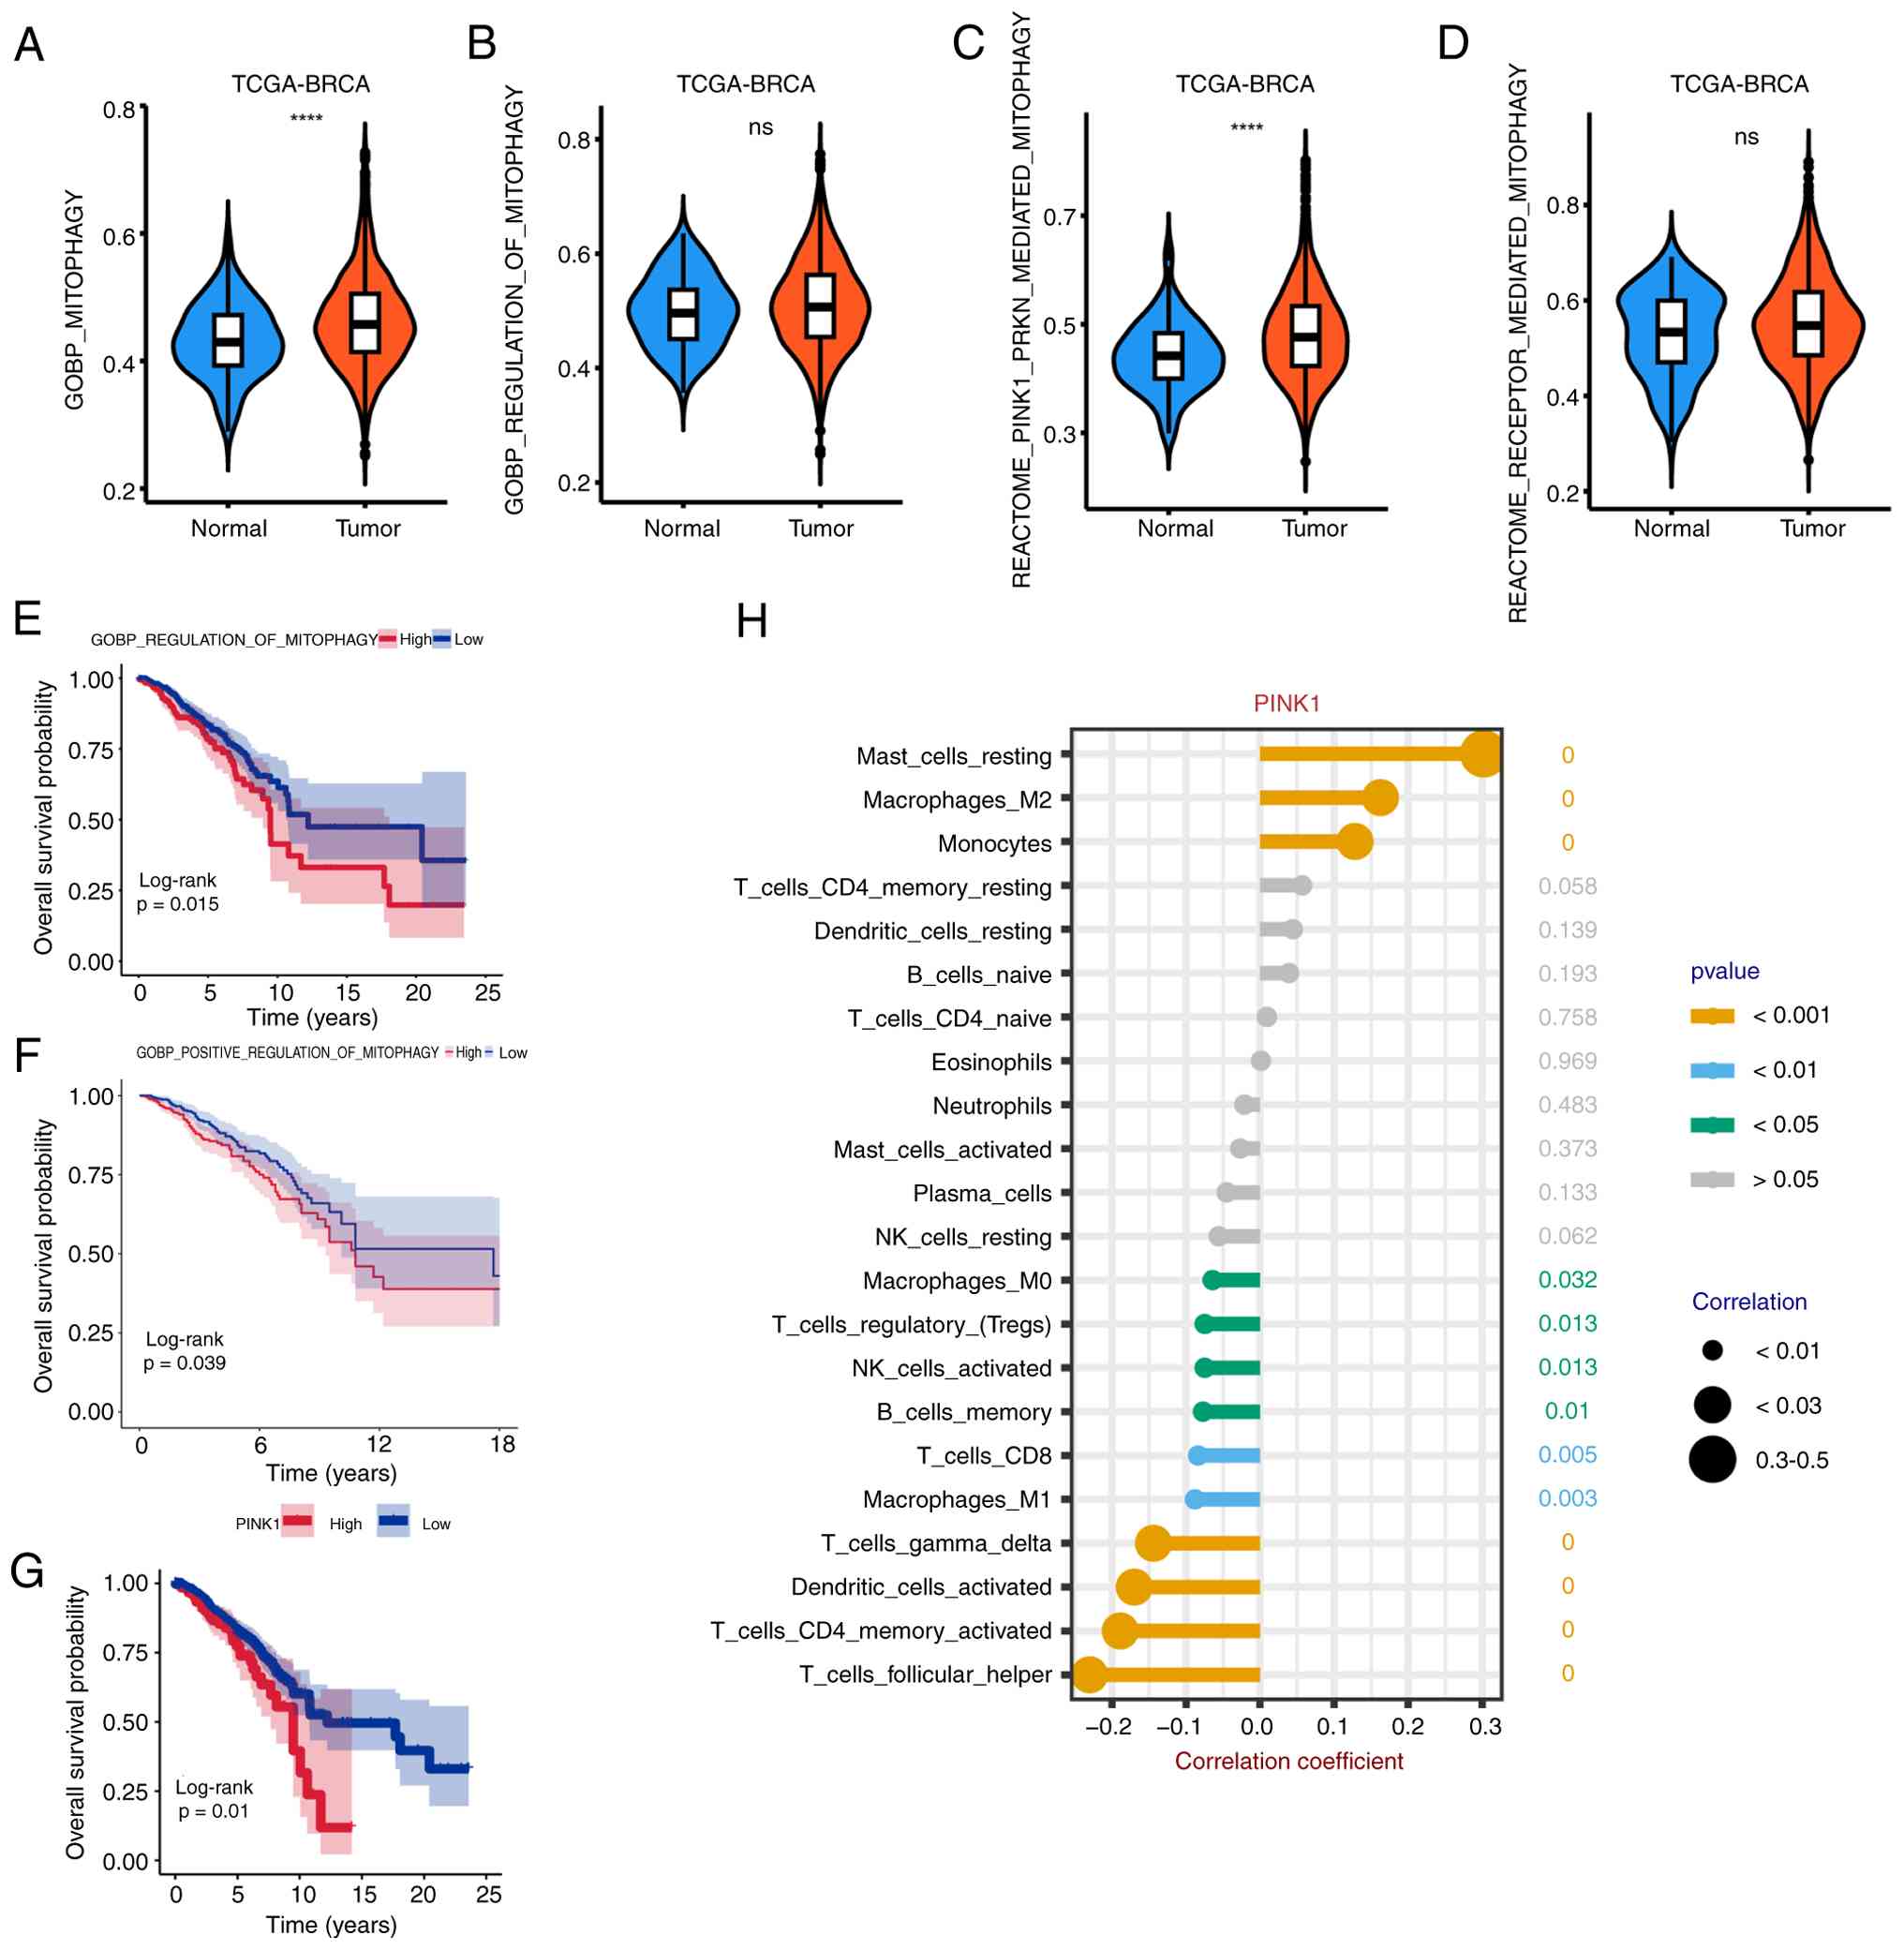
TCGA-BRCA data. The enrichment scores of mitophagy pathways were
evaluated using ssGSEA. The findings demonstrated that several
mitophagy-related pathways were upregulated in the tumor group.
Notably, the ‘REACTOME_PINK1_PRKN_MEDIATED_MITOPHAGY’ pathway
exhibited a significant increase in enrichment scores, whereas the
REACTOME_RECEPTOR_MEDIATED_MITOPHAGY pathway displayed no
significant changes (Fig. 1A-D).
These results suggest that PINK1-mediated mitophagy may be
particularly active in tumor tissues, potentially facilitating
tumor progression through metabolic reprogramming. The absence of
significant changes in receptor-mediated mitophagy pathways implies
a more specific role for PINK1 in this context. In-depth prognostic
analysis of mitophagy pathway enrichment scores revealed that
higher enrichment in several pathways was associated with poorer
patient outcomes (Fig. 1E and F).
To avoid potential violation of the proportional hazards assumption
caused by late-stage crossover of survival curves in Fig. 1F, survival analysis was restricted
to data collected up to 2018 and statistical significance was
evaluated using the log-rank test. Consistent with this, survival
analysis indicated that samples with high PINK1 expression were
associated with a significantly poorer survival (Fig. 1G). The differential mitochondrial
autophagy-related genes and pathway enrichment scores are provided
in Tables SII and SIII.
Subsequently, the relationship between PINK1
expression and the infiltration scores of 22 immune cell types were
calculated via the CIBERSORT algorithm. PINK1 expression
demonstrated significant correlations with several immune cell
types, including CD8 T cells, activated dendritic cells, memory B
cells and M0 macrophages (Fig. 1H).
Notably, PINK1 showed significant associations with both M1 and M2
macrophage infiltration, with a markedly stronger correlation for
M2 macrophages. This aligns with, rather than challenges, its
canonical role in M2 polarization across different cancer types,
while also hinting at context-specific patterns that may modulate
the strength of these associations (54).
Moreover, the correlations between PINK1 expression
and the expression of characteristic genes of CAFs, M1 macrophages
and M2 macrophages were analyzed. In CAFs, PINK1 exhibited the
strongest positive correlations with PDGFRB, BHLHE40 and COL3A1,
key genes involved in CAF-mediated extracellular matrix remodeling
and tumor progression (Fig.
S2A-C). In M1 macrophages, the highest negative correlations
were observed with CXCL10, IDO1 and CXCL11, which are markers of
inflammatory response and immune activation (Fig. S2D-F). Conversely, in M2
macrophages, PINK1 demonstrated the highest positive correlation
with TGFB1, IL33 and MRC1, markers that contribute to immune
suppression and tissue remodeling (Fig. S2G-I). These findings underscore the
potential role of PINK1 in modulating both immune responses and the
tumor microenvironment, further supporting its dual role in breast
cancer progression.
Collectively, these results support a dual-role
model for PINK1, indicating that it may not only facilitate
metabolic adaptation through mitophagy but may also contribute to
immune evasion, both of which play critical roles in promoting
breast cancer progression.
PINK1 high expression alters the
immune-related transcriptome
Building on evidence that PINK1-driven mitophagy may
promote metabolic remodeling in breast cancer, the transcriptomic
changes associated with high PINK1 expression were investigated.
The DEGs between PINK1-high and PINK1-low samples were analyzed
utilizing TCGA-BRCA data. As illustrated in Fig. S3A, the volcano plot revealed a
significant cohort of DEGs, with red and green dots representing
significantly upregulated and downregulated genes, respectively.
The corresponding heatmap (Fig.
S3B) highlights the top DEGs, with hierarchical clustering
clearly distinguishing the PINK1-high and PINK1-low groups at the
transcriptome level, showcasing distinct expression patterns
between the two groups. Functional enrichment analyses were
performed on the downregulated genes. GO biological process terms
(Fig. S3C) were predominantly
related to immune responses, including ‘immunoglobulin production’,
‘humoral immune activity’ and ‘bacterial defense mechanisms’. The
most enriched terms, with significant P-values, also included
‘immune regulation’ and ‘antigen processing’, underscoring the
potential immunosuppressive roles of PINK1 in breast cancer
progression. Cellular component analysis (Fig. S3D) revealed decreased expression in
‘immunoglobulin complexes’ and ‘blood microparticles’. Molecular
function enrichment (Fig. S3E)
demonstrated significant reductions in ‘antigen binding’, ‘receptor
activity’ and ‘neurotransmitter-related functions’. These findings
suggest that high PINK1 expression may contribute to immune evasion
by downregulating key immune functions such as antigen recognition
and receptor signaling, thereby facilitating breast cancer
progression. Consistent with these findings, KEGG pathway
enrichment (Fig. S3F) identified
several suppressed signaling pathways, including ‘neuroactive
ligand-receptor interaction’, ‘olfactory’ and ‘taste transduction’,
and immune-related processes such as ‘Neutrophil extracellular trap
formation’. These results indicate that high PINK1 expression
fosters an immunosuppressive transcriptional landscape, potentially
aiding immune evasion during tumor progression. The differential
analysis and functional enrichment results of PINK1 single-gene
analysis are provided in Table
SIV.
PINK1-mediated mitophagy
activation
Previous transcriptomic and survival analyses
suggested that PINK1-mediated mitophagy may contribute to breast
cancer progression through metabolic reprogramming. To validate
this mechanism, PINK1 was overexpressed in both luminal MCF-7 and
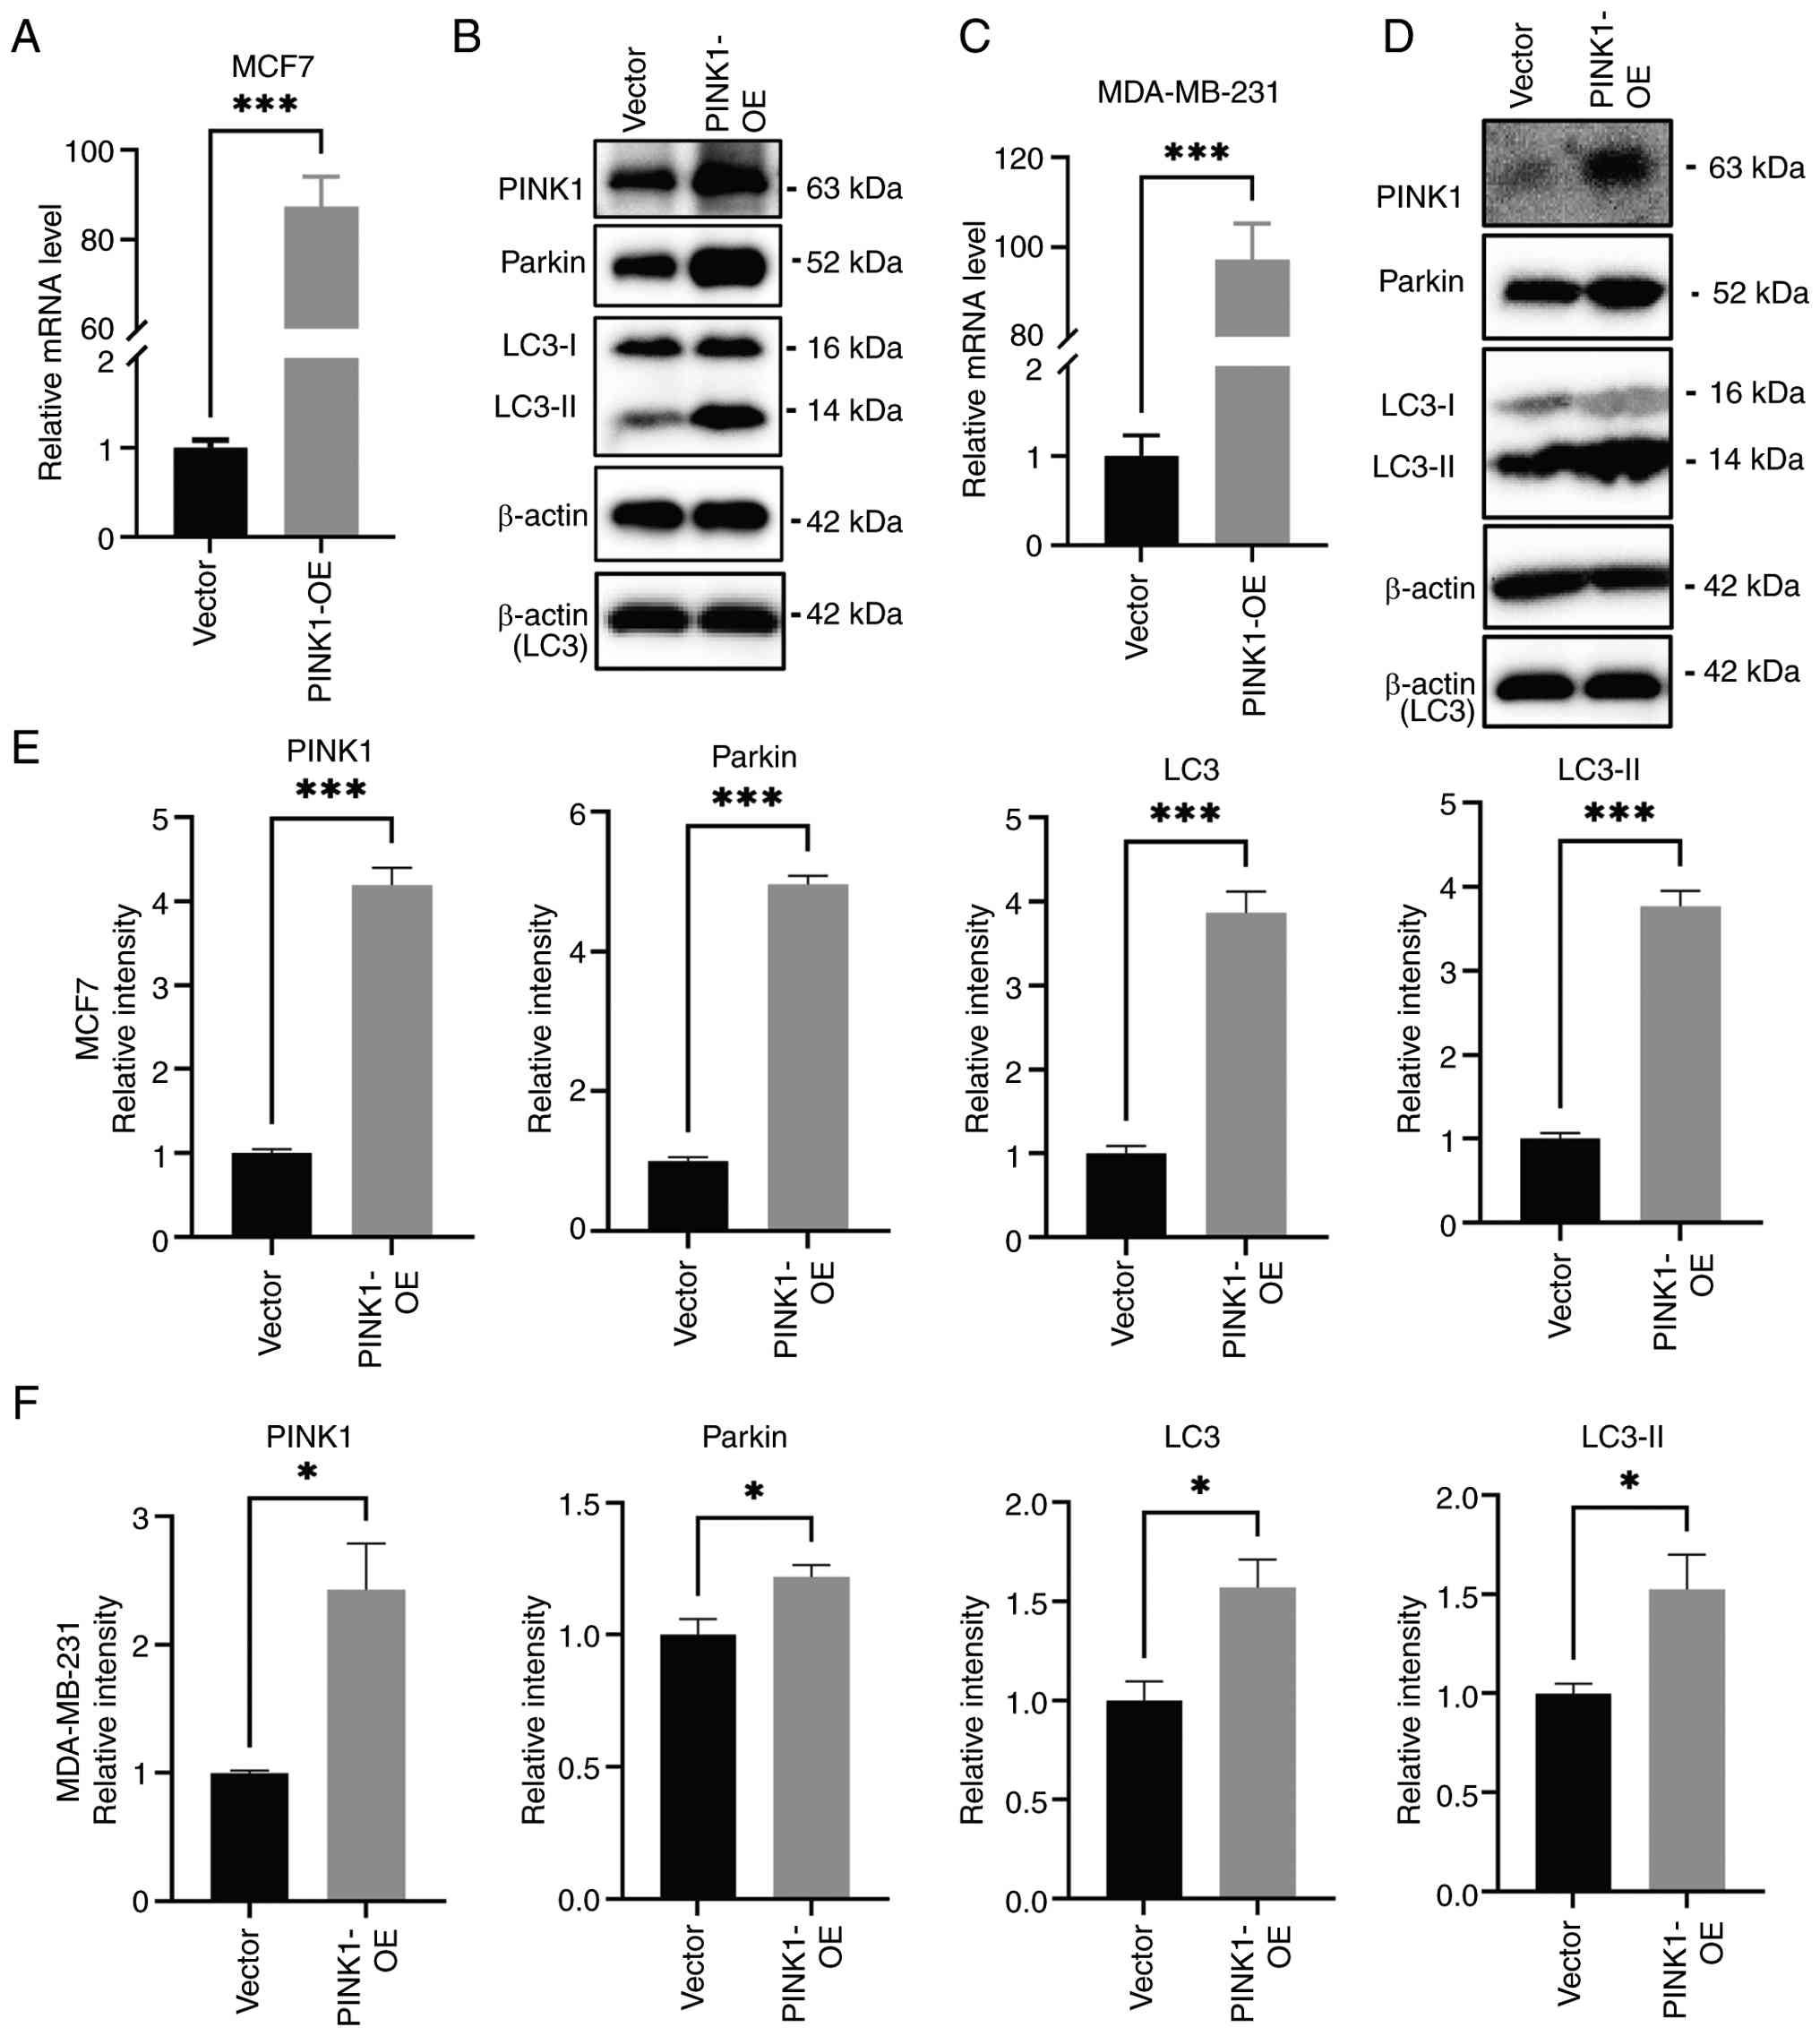
triple-negative MDA-MB-231 cells. In MCF-7 cells, RT-qPCR analysis
demonstrated that PINK1 overexpression resulted in a robust
upregulation increase in PINK1 mRNA levels compared with the vector
control group (Fig. 2A), thereby
confirming effective transcriptional upregulation. Western blot
analysis further indicated a marked increase in PINK1 protein
levels, in conjunction with the elevated expression of its
downstream mitophagy-related targets, Parkin and LC3-II (Fig. 2B). Due to its low molecular weight,
LC3 was resolved on 15% SDS-PAGE gels, with β-actin serving as the
corresponding loading control (Fig. 2B
and D). Densitometric analysis (Fig. 2E) corroborated the statistically
significant increase in all proteins, signifying activation of the
PINK1-Parkin-mediated mitophagy pathway. Similar results were
observed in MDA-MB-231 cells, where PINK1 overexpression
significantly increased mRNA levels (Fig. 2C) and markedly increased the protein
levels of PINK1, Parkin and LC3-I/II (Fig. 2D). Semi-quantitative analysis
(Fig. 2F) further validated the
upregulation of these markers, indicating conserved activation of
mitophagy across both luminal and TNBC subtypes.
Notably, the elevated levels of LC3-II observed in
both cell lines suggest not only enhanced mitophagosome formation
but also increased autophagic flux. These findings provide further
molecular evidence that PINK1 serves as a crucial regulator of
mitochondrial quality control in breast cancer. By facilitating
Parkin-mediated mitophagy, PINK1 may contribute to mitochondrial
quality control in breast cancer cells.
Ultrastructural evidence of mitophagy
activation
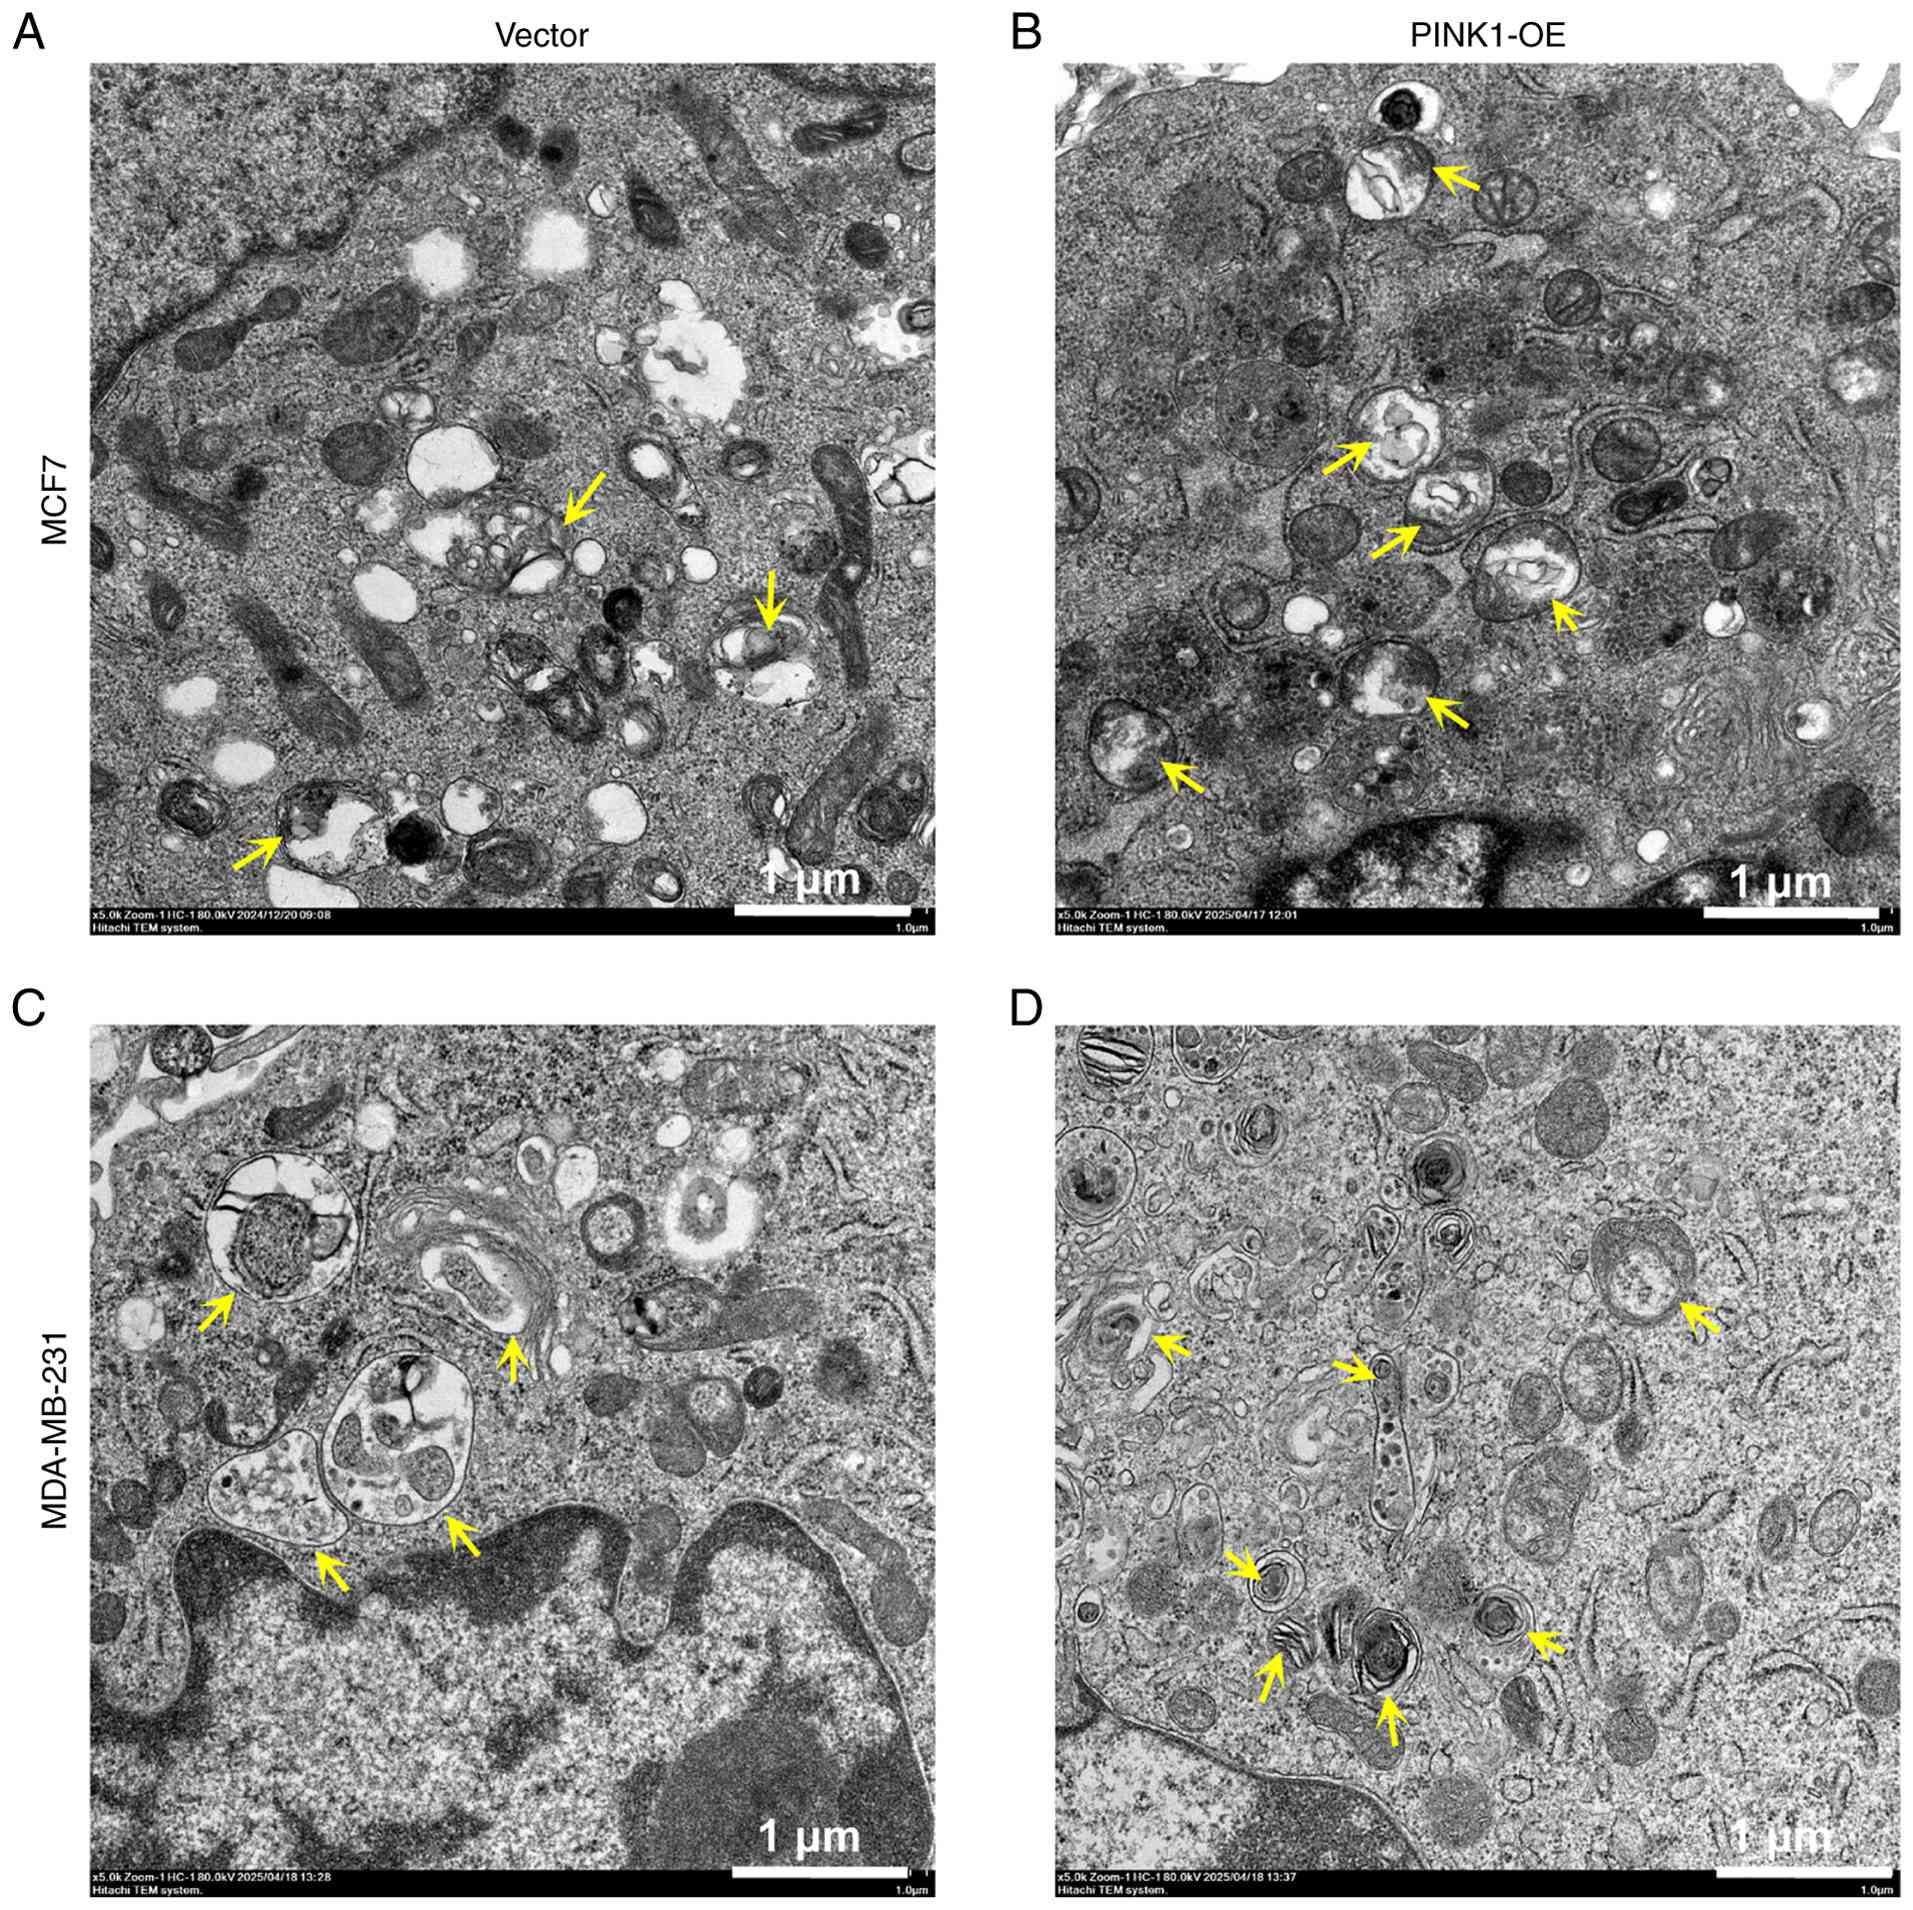
Following biochemical validation of PINK1-induced
mitophagy, TEM was employed to investigate the ultrastructural
changes in MCF-7 and MDA-MB-231 breast cancer cells, with the
objective of determining whether PINK1 overexpression promotes
mitophagy at the organelle level. Representative TEM images
(Fig. 3) illustrated that PINK1-OE
breast cancer cells contained numerous double-membraned
autophagosomes (indicated by yellow arrows), frequently associated
with damaged mitochondria, thereby indicating active mitophagy.
Conversely, control cells display fewer autophagic vesicles,
predominantly intact mitochondria and limited interaction between
autophagosomes and mitochondria, suggesting a low basal level of
mitophagy. TEM images reveal an apparent increase in autophagic
vesicles in PINK1-OE cells, indicating enhanced mitochondrial
clearance (Fig. 3). Mitochondrial
remnants were also observed within autophagosomes. This finding,
supported by the co-localization of mitochondrial and
autophagosomal markers, provides evidence of selective mitophagy as
opposed to non-specific autophagy. These morphological findings
underscore that PINK1 may enhance mitochondrial clearance in both
luminal and TNBC cells. By promoting mitophagy, PINK1 may
facilitate cellular metabolic reprogramming under stress by
preserving mitochondrial function and energy production, thereby
aiding tumor cell survival and proliferation amid metabolic
challenges.
PINK1 overexpression accelerates
breast cancer cell migration
Having established that PINK1 may activate mitophagy
and enhance mitochondrial quality, whether this activity increases
tumor aggressiveness was subsequently investigated. PINK1 was
overexpressed in luminal MCF-7 and triple-negative MDA-MB-231
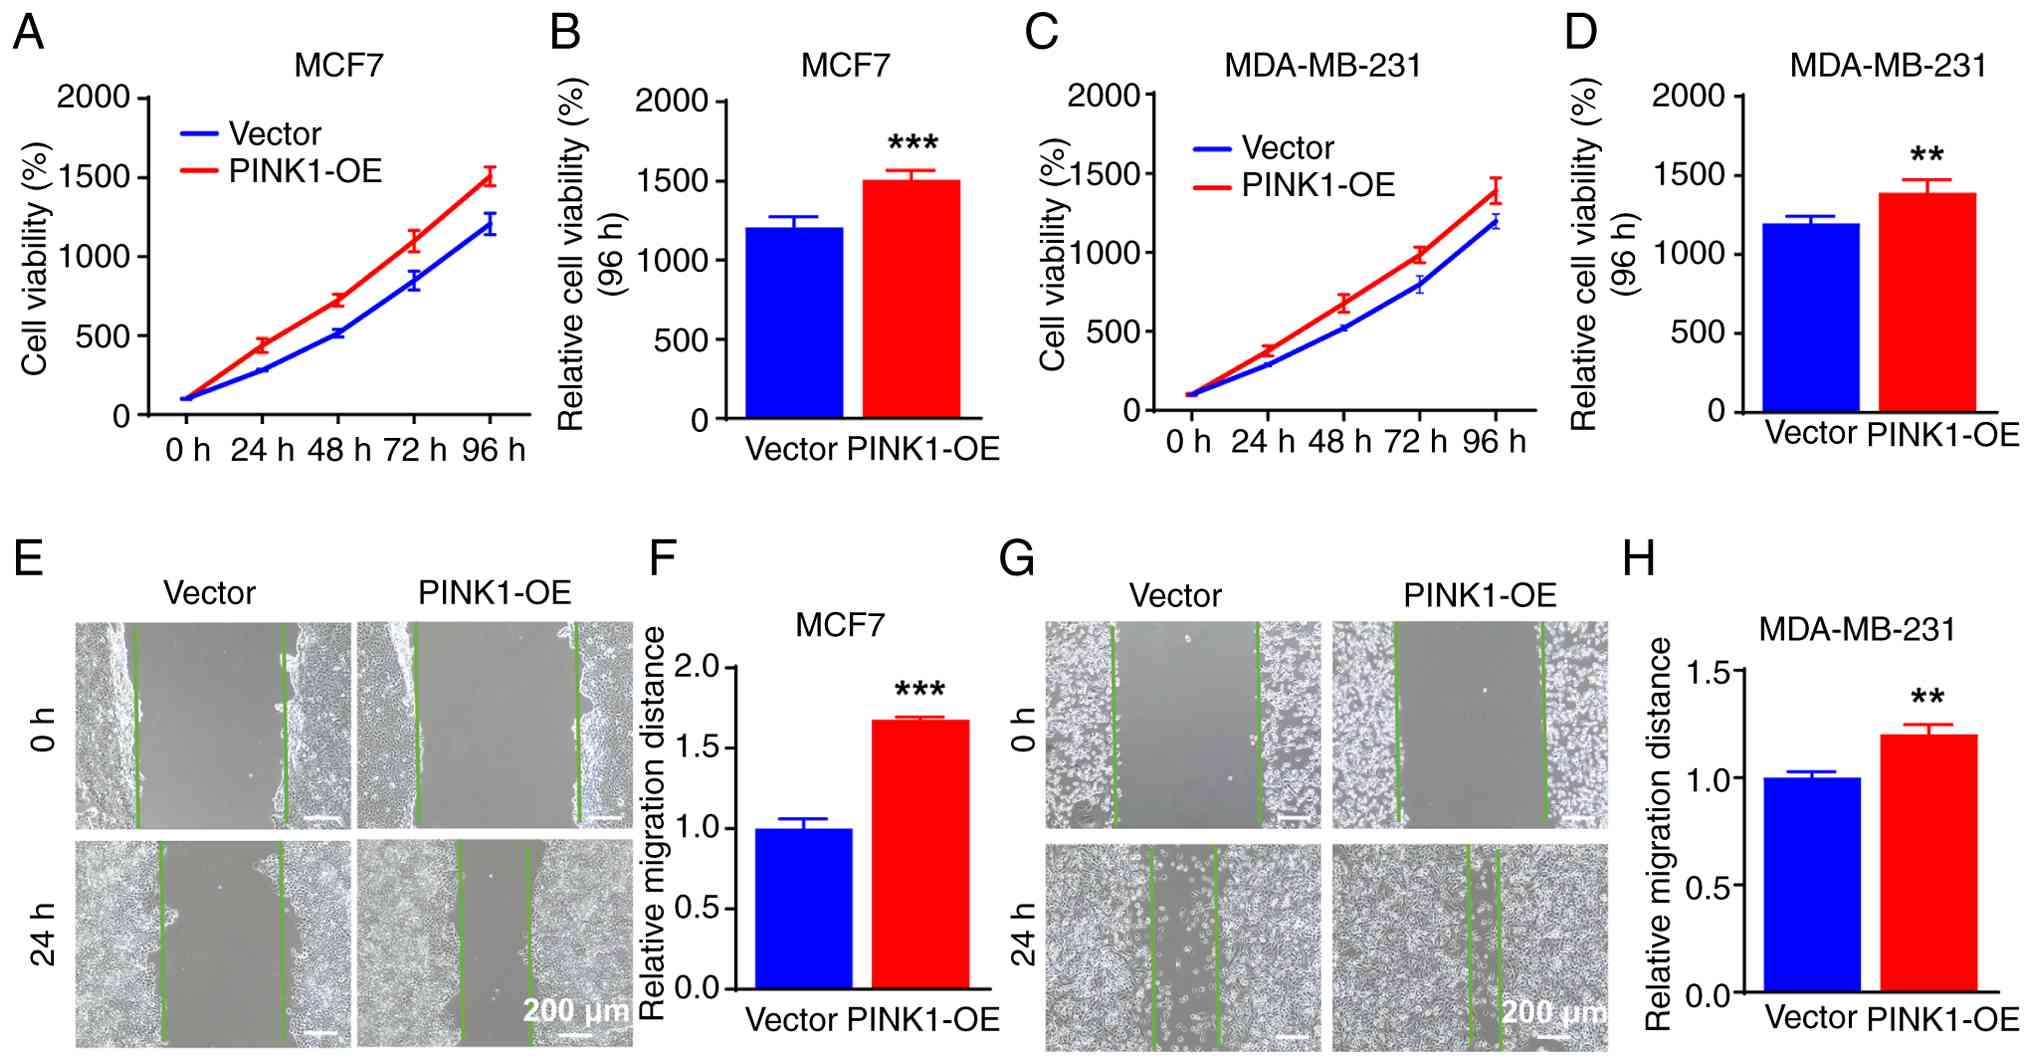
cells, followed by cell viability and migration assays. In MCF-7
cells, PINK1 overexpression resulted in a progressive increase in
cell viability over time. The CCK-8 assay (Fig. 4A) demonstrated that PINK1-OE cells
exhibited enhanced proliferation from 24 to 96 h, with
statistically significant differences noted at the 96-h mark
(Fig. 4B). This proliferative
advantage suggests that PINK1 contributes to the long-term growth
potential of luminal breast cancer cells. Similarly, MDA-MB-231
cells also displayed a significant increase in viability upon
PINK1-OE at 96 h (Fig. 4C and D),
although the magnitude of change was less pronounced than in MCF-7
cells.
To further assess whether PINK1 influences the
migratory behavior of breast cancer cells, wound healing assays
were conducted. As illustrated in Fig.
4E and G, wound closure was significantly accelerated in both
PINK1-OE MCF-7 and MDA-MB-231 cells after 24 h, compared with the
vector-transfected controls. Quantitative analysis of the wound
area revealed an almost 1.68-fold increase in migration distance
for MCF-7 cells (Fig. 4F) and a
significant increase for MDA-MB-231 cells (Fig. 4H). These findings demonstrate that
PINK1 overexpression promoted both the proliferation and migration
of breast cancer cells, extending its functional role beyond the
activation of mitophagy. The enhanced migration may be associated
with metabolic rewiring induced by PINK1-mediated mitochondrial
clearance, which supports tumor cell survival and adaptation to
metabolic stress.
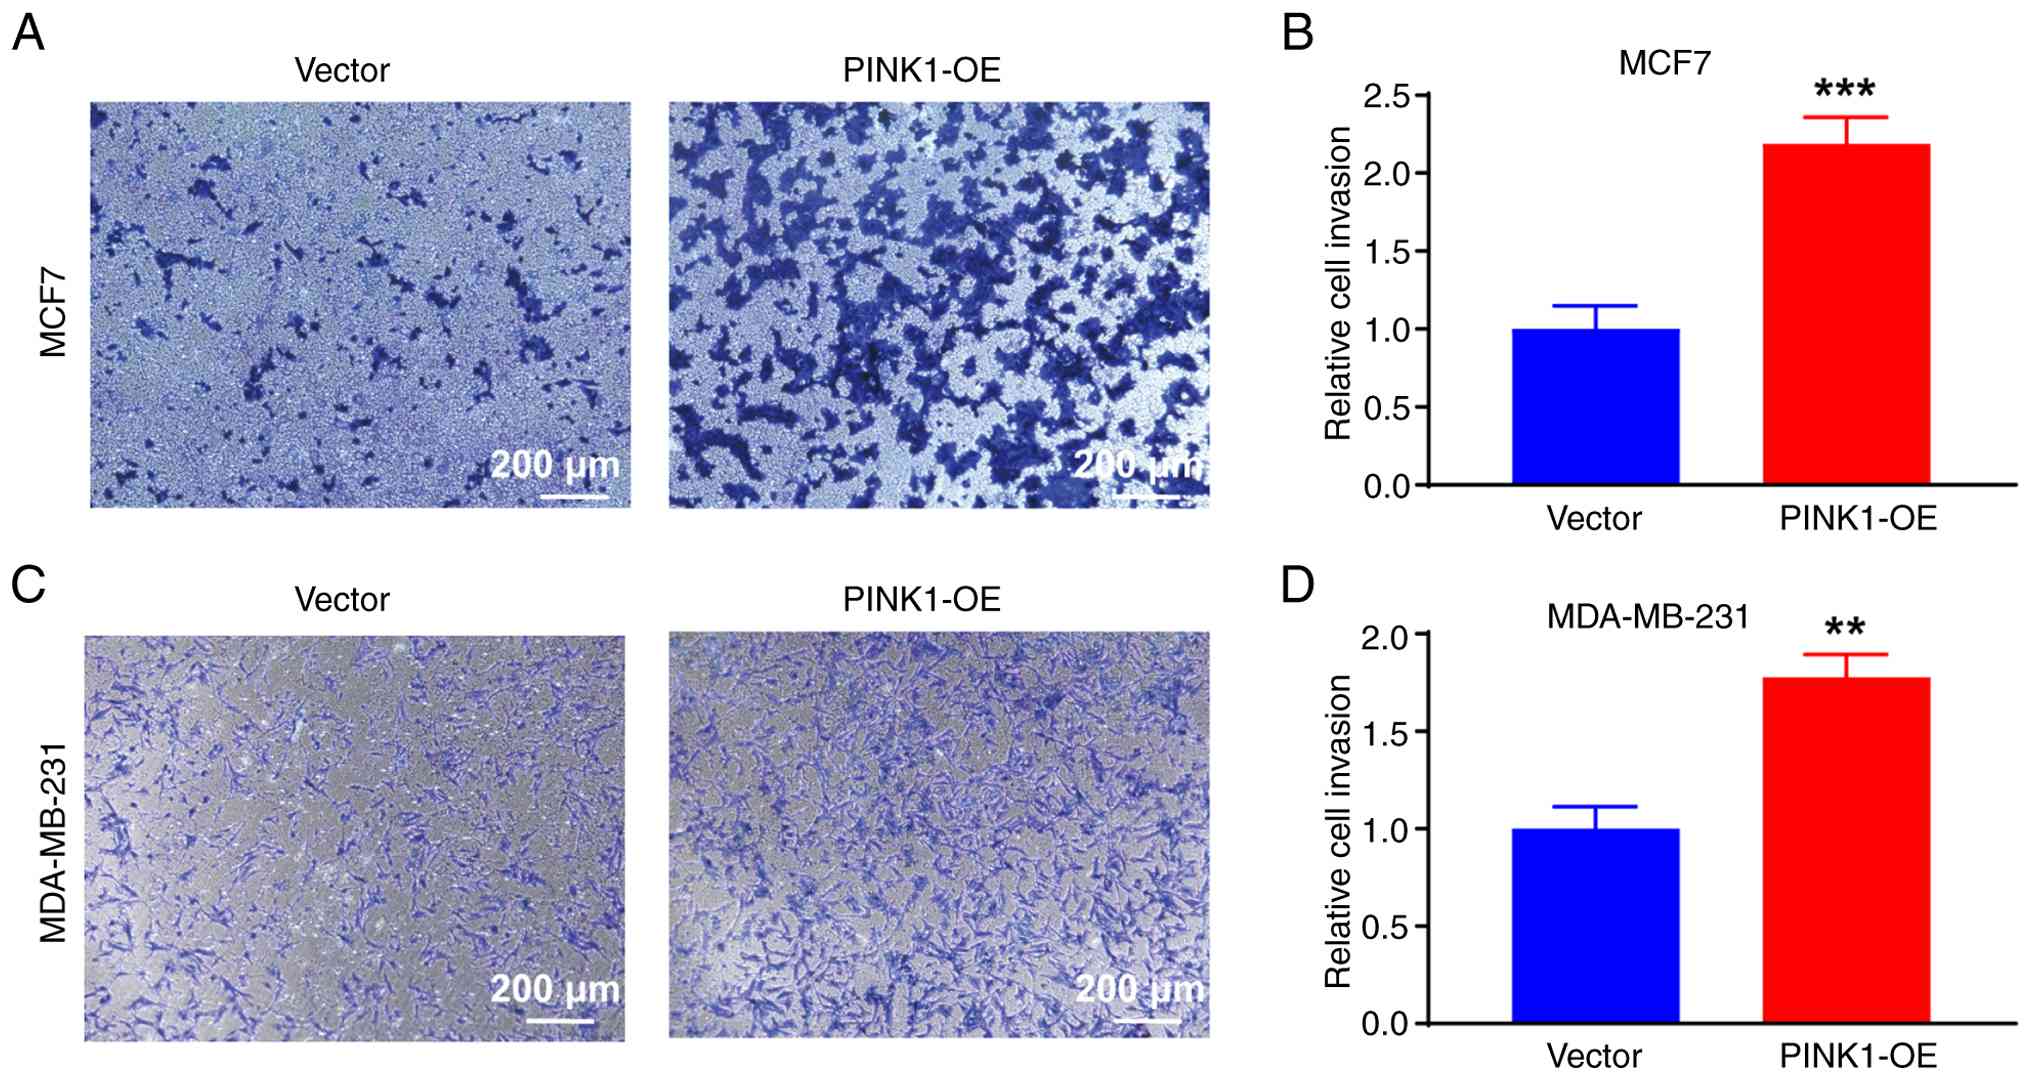
PINK1 enhances the invasive potential
of breast cancer cells
To further elucidate the implications of
PINK1-mediated mitophagy and metabolic remodeling, it was
investigated whether PINK1 promotes breast cancer cell invasion.
Matrigel-coated Transwell assays were conducted to assess the
invasive capacity of both luminal MCF-7 and triple-negative
MDA-MB-231 cells. Representative images revealed that both MCF-7
and MDA-MB-231 cells overexpressing PINK1 exhibited a marked
increase in the number of blue-stained cells that penetrated the
Matrigel barrier compared with their respective vector control
groups (Fig. 5A and B). The cells
were stained with crystal violet to visualize and quantify
invasion, with the number of invaded cells counted across multiple
fields of view. This increase in invasive cells was consistently
observed across multiple replicates, indicating that PINK1
significantly enhanced cellular invasiveness. Quantitative analysis
of the invaded cells demonstrated that PINK1-OE induced
approximately a 2-fold increase in invasive capacity in MCF-7 cells
compared with vector controls (Fig.
5C). In MDA-MB-231 cells, which are inherently more invasive,
PINK1-OE also led to a significant increase in invasion (Fig. 5D), reinforcing the pro-invasive role
of PINK1 across different molecular subtypes of breast cancer.
These findings indicate that PINK1 overexpression markedly enhanced
the invasive potential in both luminal and TNBC subtypes. Beyond
its established role in mitophagy, PINK1 emerges as a key regulator
of tumor cell invasion. These findings indicate that PINK1
overexpression markedly enhanced the invasive potential in both
luminal (MCF-7) and TNBC (MDA-MB-231) subtypes, reinforcing its
pro-invasive role across different breast cancer molecular
subtypes.
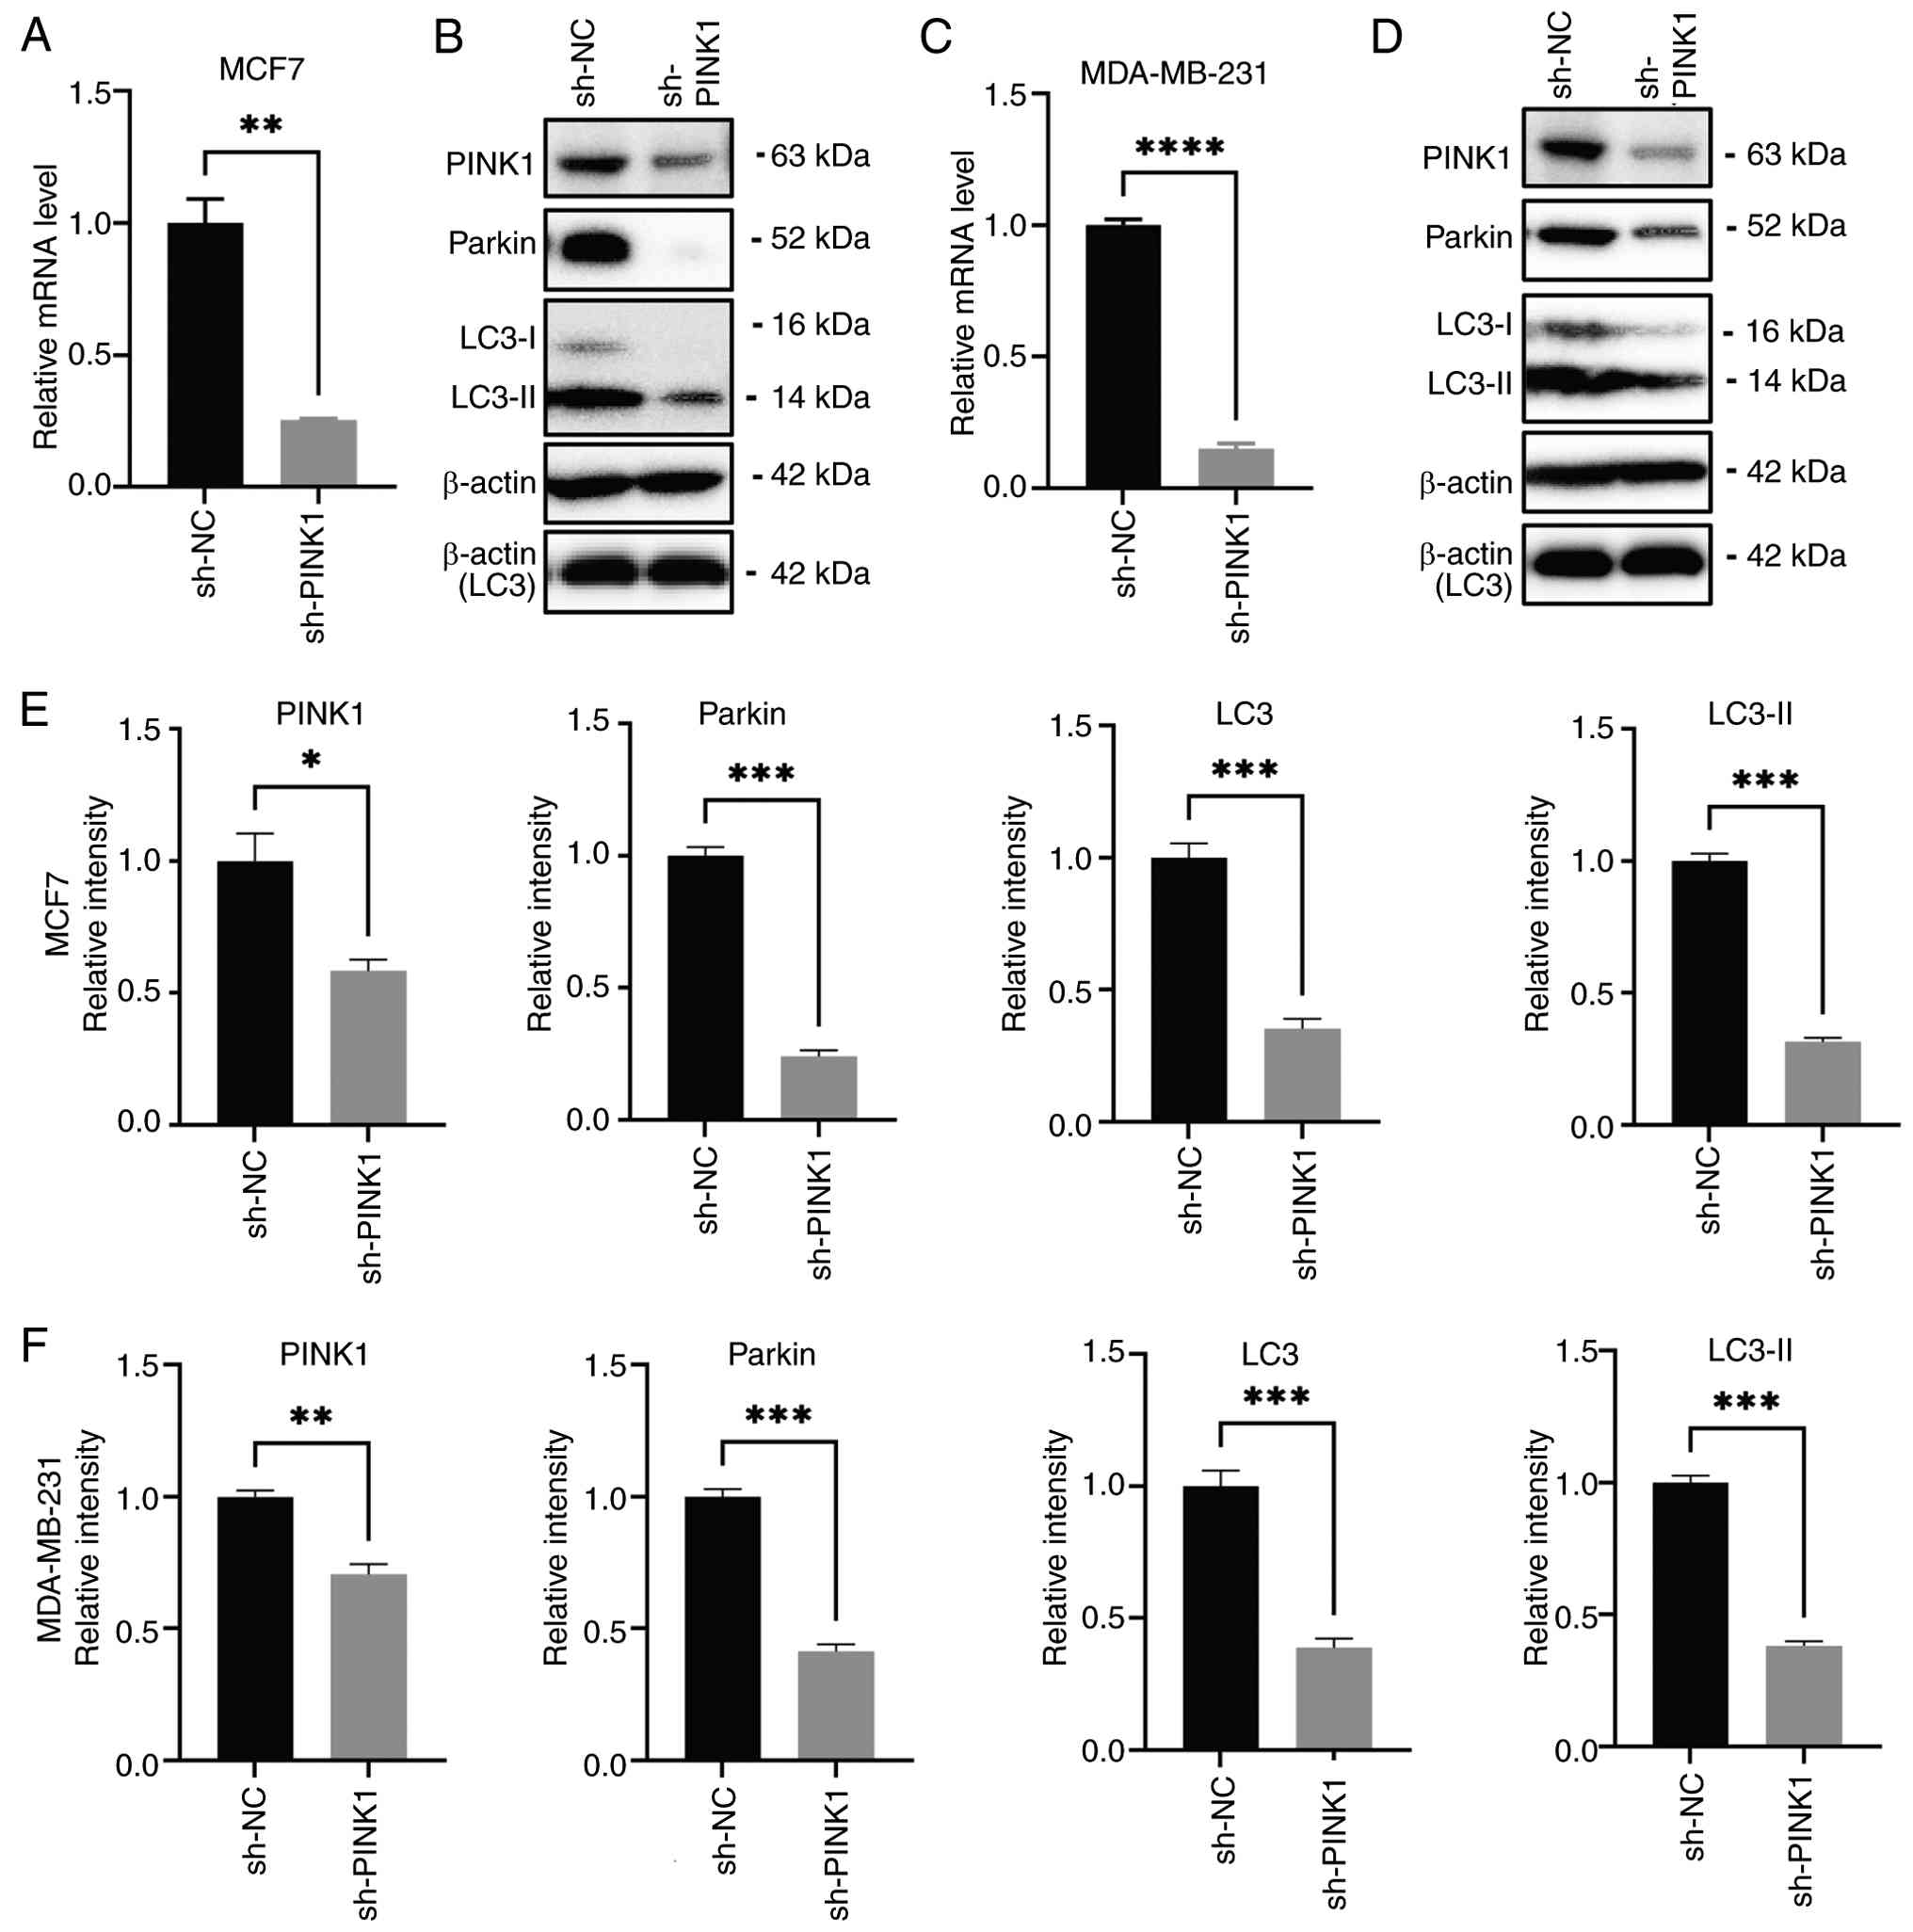
Knocking down PINK1 expression
inhibits tumor growth
The efficacy of knockdown in MCF-7 and MDA-MB-231
cells was confirmed through RT-qPCR and western blot analysis. The
qPCR results demonstrated a significant reduction in PINK1 mRNA
levels in MCF-7 cells (Fig. 6A)
compared with the control, thereby confirming effective knock down.
Western blot analysis further corroborated the downregulation of
PINK1 protein expression (Fig. 6B),
which was associated with notable reductions in Parkin and the
autophagy marker LC3-II (Fig. 6E).
These findings imply that PINK1 knockdown disrupted the mitophagy
machinery, as evidenced by decreased Parkin expression and a lower
LC3-II/LC3-I ratio, a well-established indicator of autophagosome
maturation (55). In MDA-MB-231
cells, a more aggressive subtype of TNBC, a similar pattern was
observed. PINK1 mRNA was significantly downregulated following
shRNA-mediated knockdown (Fig. 6C),
consistent with the results obtained in MCF-7 cells. Protein
analysis revealed consistent reductions in PINK1, Parkin and LC3-II
(Fig. 6D and F), thereby validating
the findings in a second breast cancer cell model. Reduced LC3-II
indicates blocked autophagosome maturation and impaired mitophagy.
The persistent attenuation of both mitophagy markers across two
distinct breast cancer cell lines suggests a conserved role for
PINK1 in maintaining mitochondrial quality control. These results
indicate that PINK1 may be essential for sustaining mitophagic flux
and mitochondrial homeostasis; its depletion disrupts the
PINK1/Parkin axis, inhibiting the autophagic clearance of
dysfunctional mitochondria.
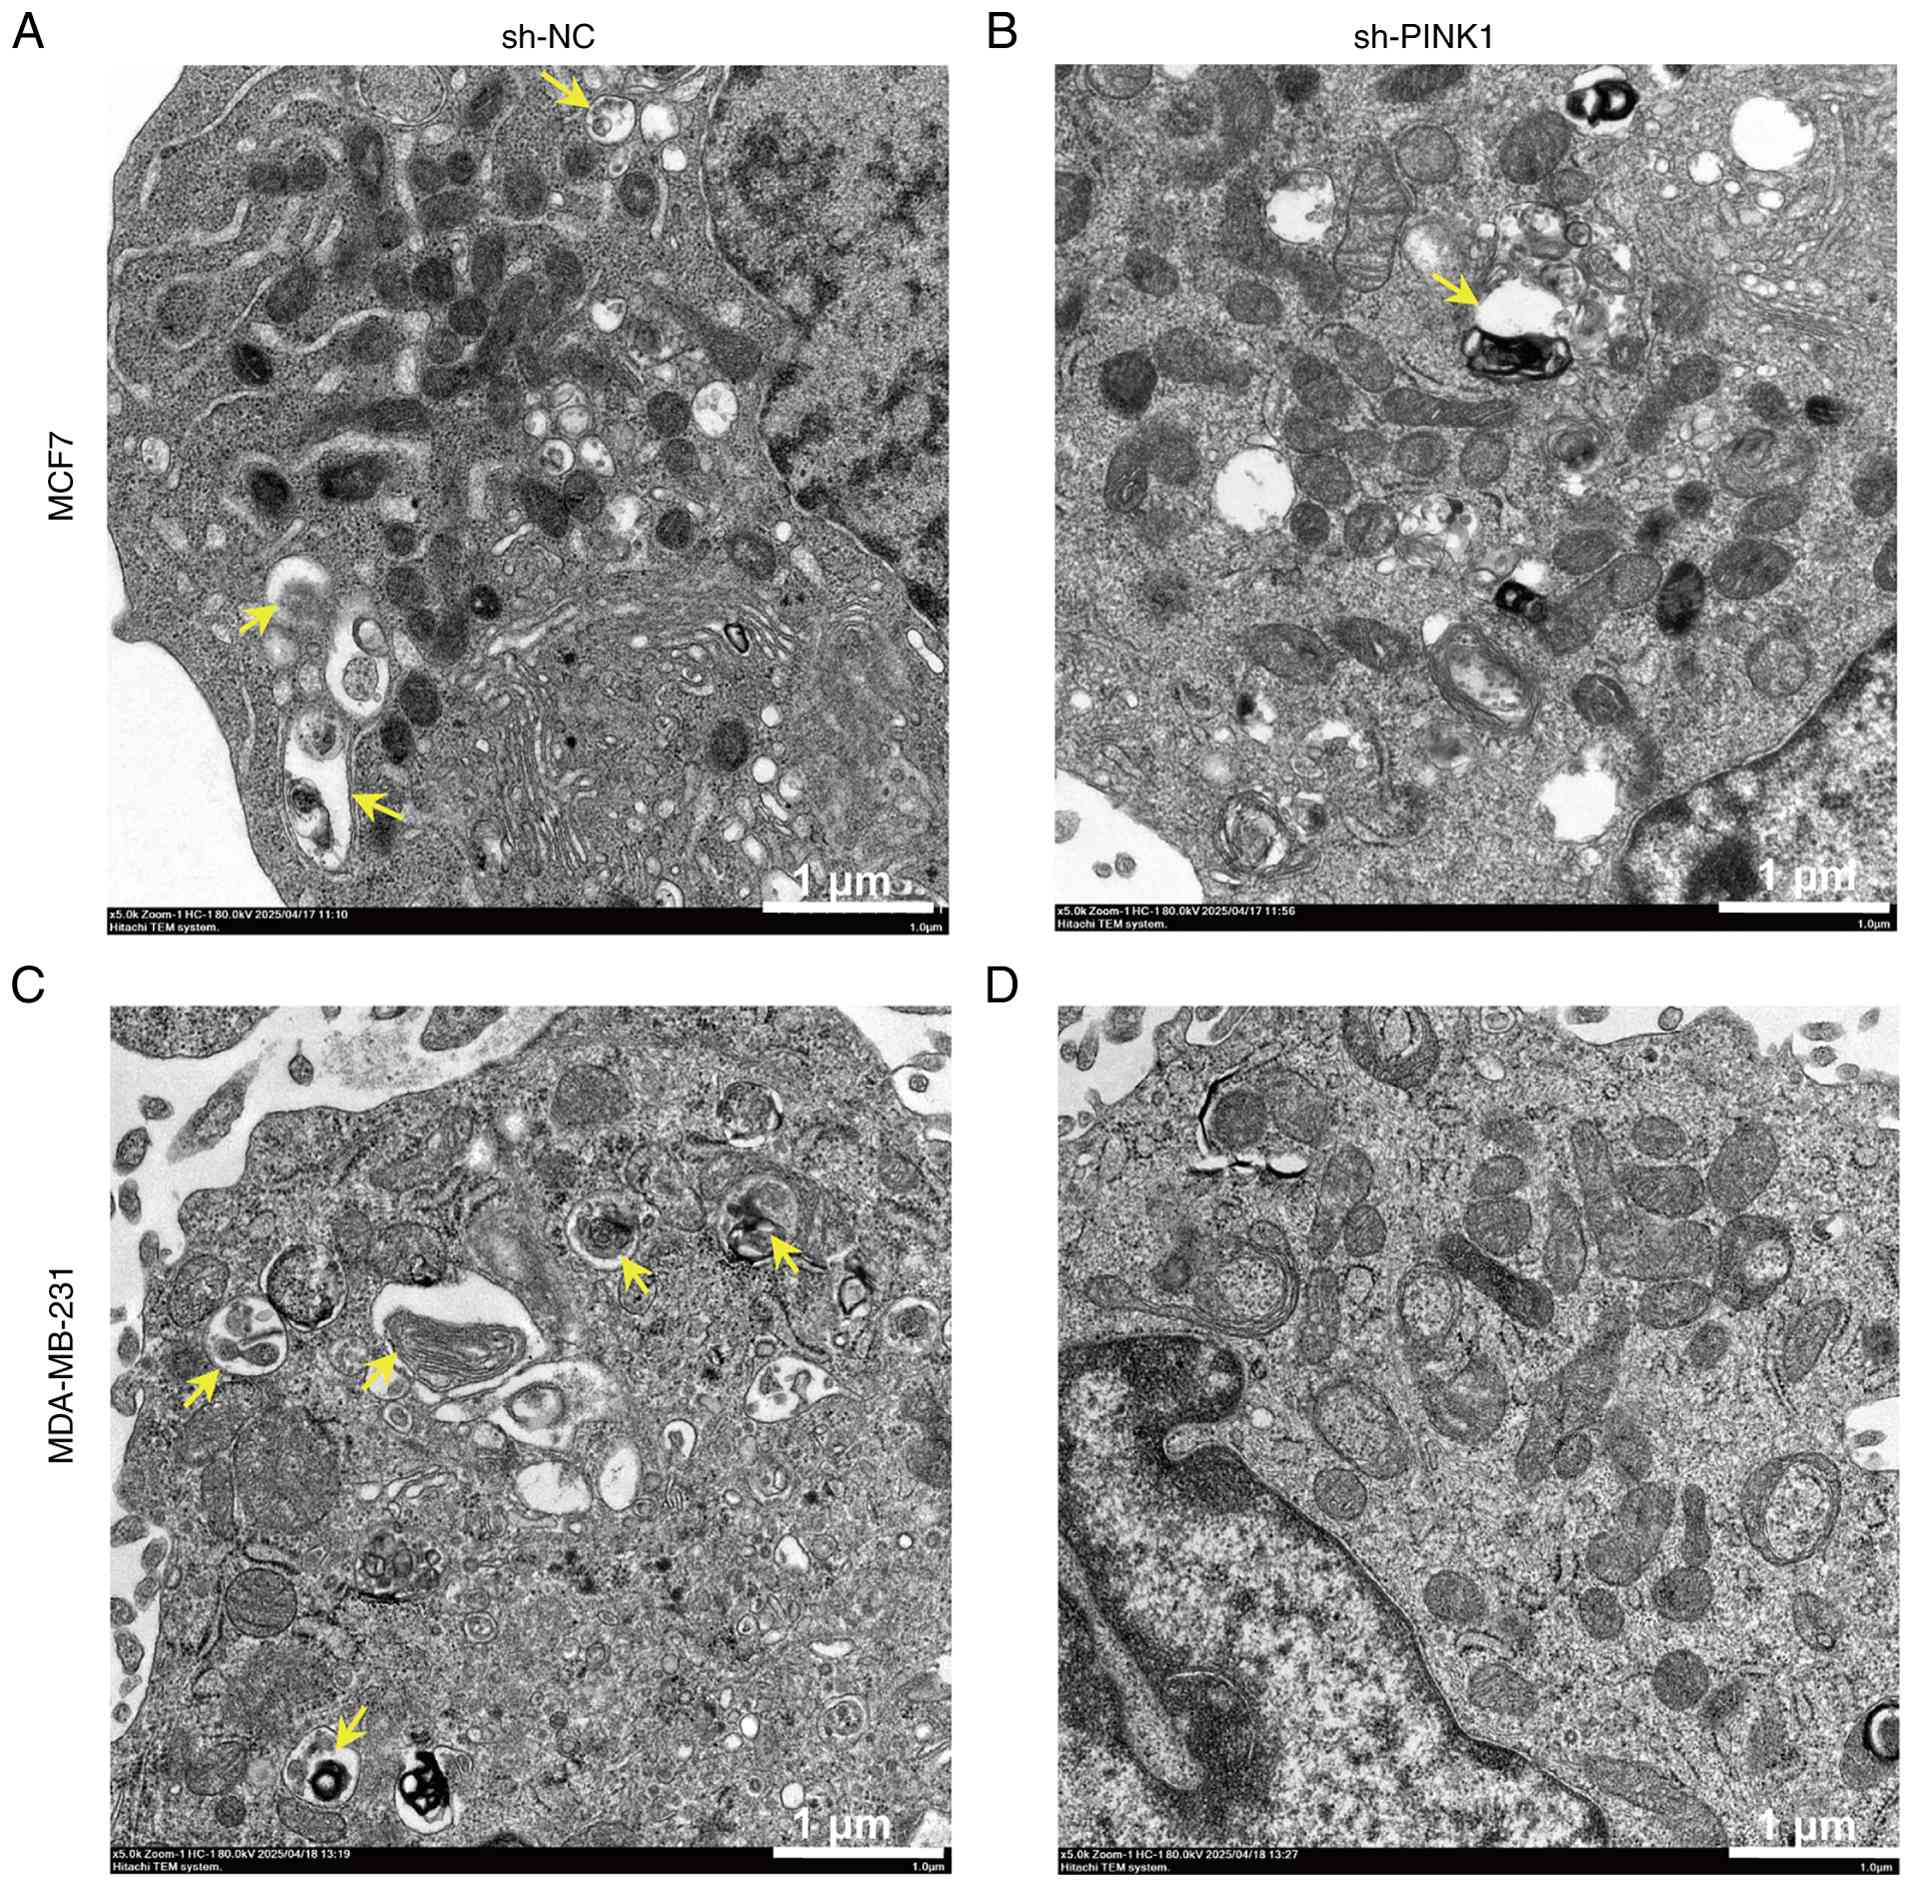
Ultrastructural evidence of mitophagy
suppression
TEM was employed to examine mitophagy at the
ultrastructural level in breast cancer cells following PINK1
knockdown. In control MCF-7 cells (Fig.
7A), numerous double-membrane autophagosomes and autolysosomes
containing degraded mitochondria were observed, indicating active
mitophagy. Quantitative analysis revealed PINK1-knockdown MCF-7
cells exhibited a marked reduction in mitophagic structures
accompanied by an accumulation of morphologically intact
mitochondria in the cytoplasm, compared with the control group
(Fig. 7A and B). This suggests a
failure in the mitophagy process, leading to impaired mitochondrial
turnover. A similar pattern was noted in MDA-MB-231 cells, where
the control group (Fig. 7C)
revealed visible mitophagosomes containing Qualitative assessment
of electron micrographs suggested a reduction in mitophagic
structures in PINK1-knockdown cells (Fig. 7C and D). These ultrastructural
differences provide morphological evidence that PINK1 may be
critical for mitophagosome formation and mitochondrial clearance in
both luminal and TNBC cells. The impairment in mitophagy associated
with PINK1 knockdown may disrupt mitochondrial turnover. This leads
to an accumulation of dysfunctional mitochondria, which compromises
metabolic homeostasis and cellular adaptation to metabolic stress.
Collectively, these findings suggest that PINK1-driven mitophagy
promotes breast cancer progression by preserving mitochondrial
integrity and facilitating metabolic reprogramming.
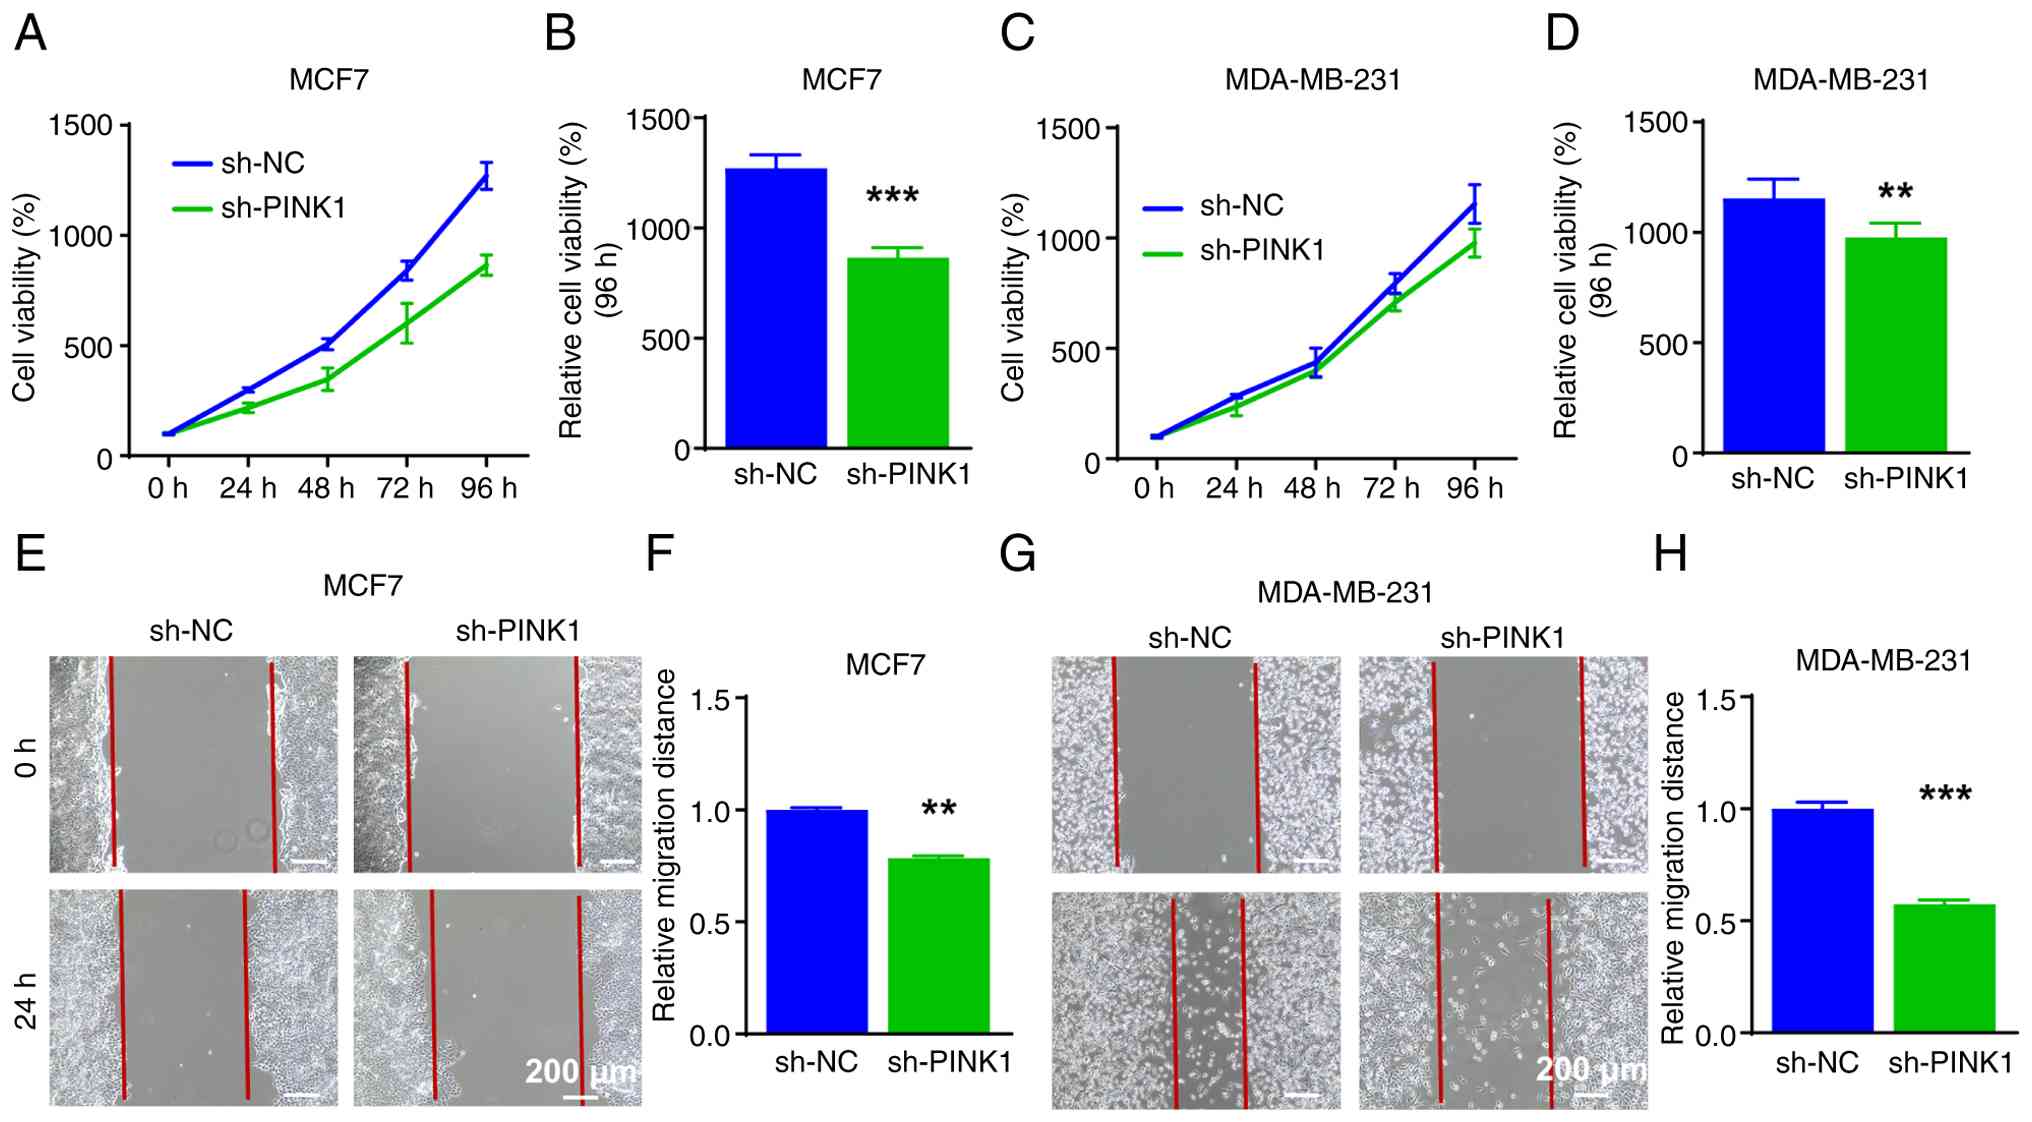
PINK1 knockdown inhibits breast cancer
cell proliferation and migration
Building on previous evidence that PINK1 enhanced
mitophagy, the effects of its depletion on fundamental cellular
behaviors in breast cancer were subsequently investigated.
Utilizing established stable knockdown models of MCF-7 and
MDA-MB-231 cells, alterations in proliferation and migration
capacity were assessed. Cell viability was evaluated using the
CCK-8 assay over a 96-h period. In MCF-7 cells, PINK1 knockdown
markedly decreased viability compared with the negative control,
with the difference becoming more pronounced over time (Fig. 8A). By 96 h, the reduction in cell
viability was statistically significant (Fig. 8B). A similar trend was observed in
MDA-MB-231 cells, although the inhibitory effect was relatively
modest; viability at 96 h was still significantly diminished
(Fig. 8C and D). Wound-healing
assays were conducted to evaluate the impact of PINK1 knock down on
cellular migration. The migration of MCF-7 cells was significantly
impaired after 24 h of PINK1 knockdown, a finding corroborated in
MDA-MB-231 cells, where a noticeable reduction in wound closure was
also observed (Fig. 8E-H).
These results demonstrated that PINK1 may be
essential not only for maintaining mitochondrial quality via
mitophagy but also for supporting the proliferative and migratory
capacities of breast cancer cells. PINK1 knockdown in MCF-7 and
MDA-MB-231 cells led to a reduction in cell viability over time and
impaired wound closure. These findings indicate that PINK1 plays a
role in maintaining basic cellular health in breast cancer
cells.
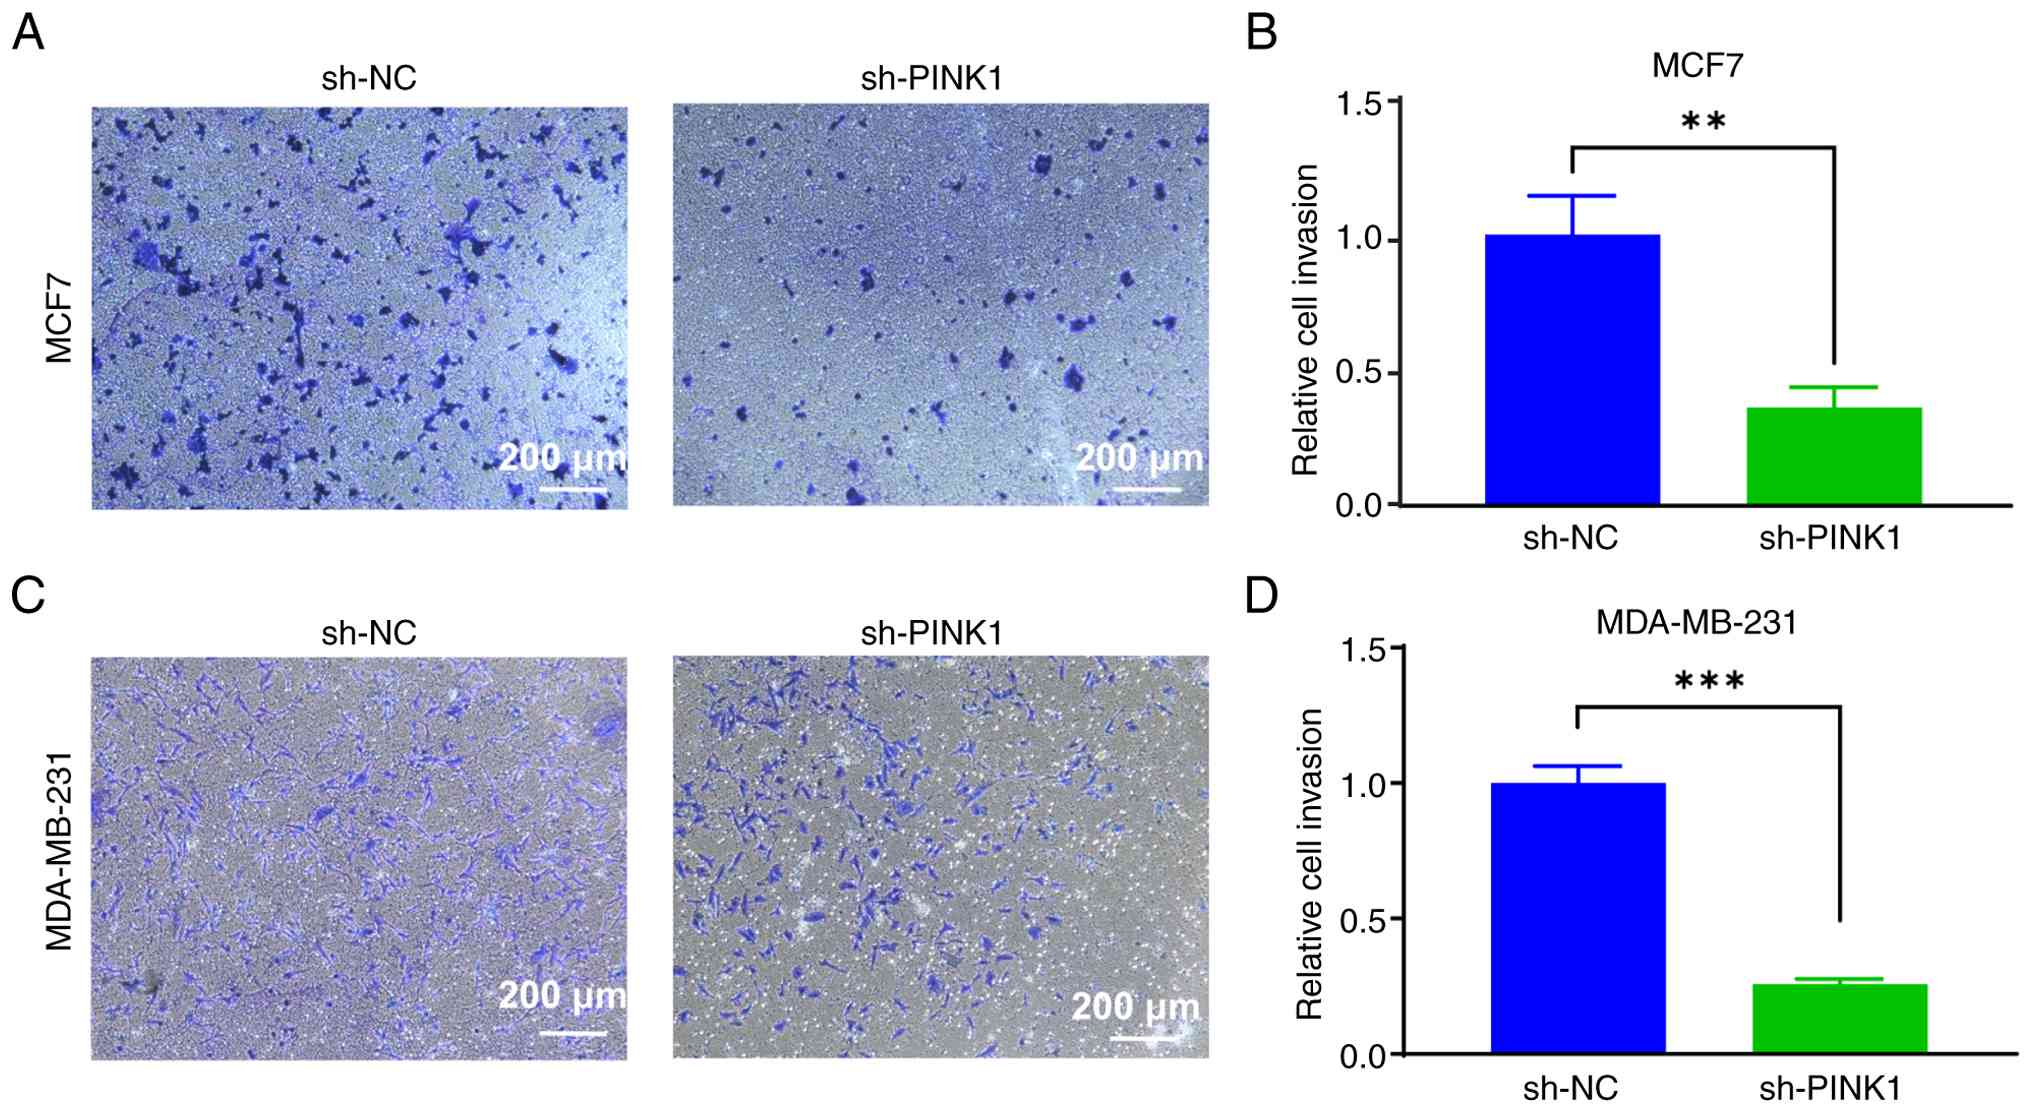
PINK1 knockdown impairs the invasive
capacity of breast cancer cells
Previous findings established that PINK1 may promote
breast cancer cell proliferation and migration, possibly through
mitophagy-mediated metabolic reprogramming. To further evaluate how
PINK1 influences the invasive capacity of breast cancer cells,
Matrigel-coated Transwell invasion assays were conducted. As
illustrated in Fig. 9A, PINK1
knockdown in MCF-7 cells reduced the number of crystal
violet-stained cells that invaded the Matrigel layer compared with
the negative control. Quantitative analysis confirmed this
significant decrease in invasion (Fig.
9C). Similarly, in the highly invasive MDA-MB-231 cells, PINK1
knockdown also resulted in a significant decline in the number of
invasive cells (Fig. 9B and D).
PINK1 knockdown significantly reduced the number of cells invading
through the Matrigel in both the MCF-7 and MDA-MB-231 cell line
models. These results indicate that PINK1 may contribute to the
invasive capacity of breast cancer cells.
PINK1 activates PGK2 to link mitophagy
with glycolytic reprogramming
To investigate the metabolic effects of
PINK1-mediated mitophagy on glycolysis in breast cancer,
bioinformatics alongside experimental validation was utilized. An
intersection analysis between mitophagy-related genes and DEGs in
breast cancer identified 4 significantly differentially expressed
overlapping genes (Fig. 10A). GSEA
of the glycolysis pathway in cancerous and adjacent tissues
revealed a trend toward upregulation of the HALLMARK_GLYCOLYSIS
pathway in the Tumor group, although the P-value was not
statistically significant (Fig.
10B). Prognostic analysis of glycolysis pathway enrichment
scores indicated that higher enrichment was associated with a
poorer patient prognosis, as determined by Kaplan-Meier survival
analysis and log-rank tests (Fig.
10C). Correlation analysis revealed a strong positive
relationship between mitophagy and glycolysis pathway enrichment
scores. Notably, the REACTOME_PINK1_PRKN_MEDIATED_MITOPHAGY pathway
showed high correlation with several glycolysis-related pathways
(Fig. 10D-F). Based on these
results, the correlation between this pathway and differential
glycolysis genes was further analyzed, highlighting those with a
positive correlation coefficient >0 (Fig. 10G). The differential Glyco-DEGs,
pathway enrichment scores and correlation analysis between the
mitochondrial autophagy pathway and Glyco-DEGs are detailed in
Table SV, Table SVI, Table SVII. Western blot analysis
confirmed PINK1 overexpression upregulated PGK2, showing that in
both MCF-7 and MDA-MB-231 cells, PINK1 overexpression increased
PGK2 protein levels, while PINK1 knockdown decreased PGK2
expression (Fig. 10H), with
statistically significant differences.
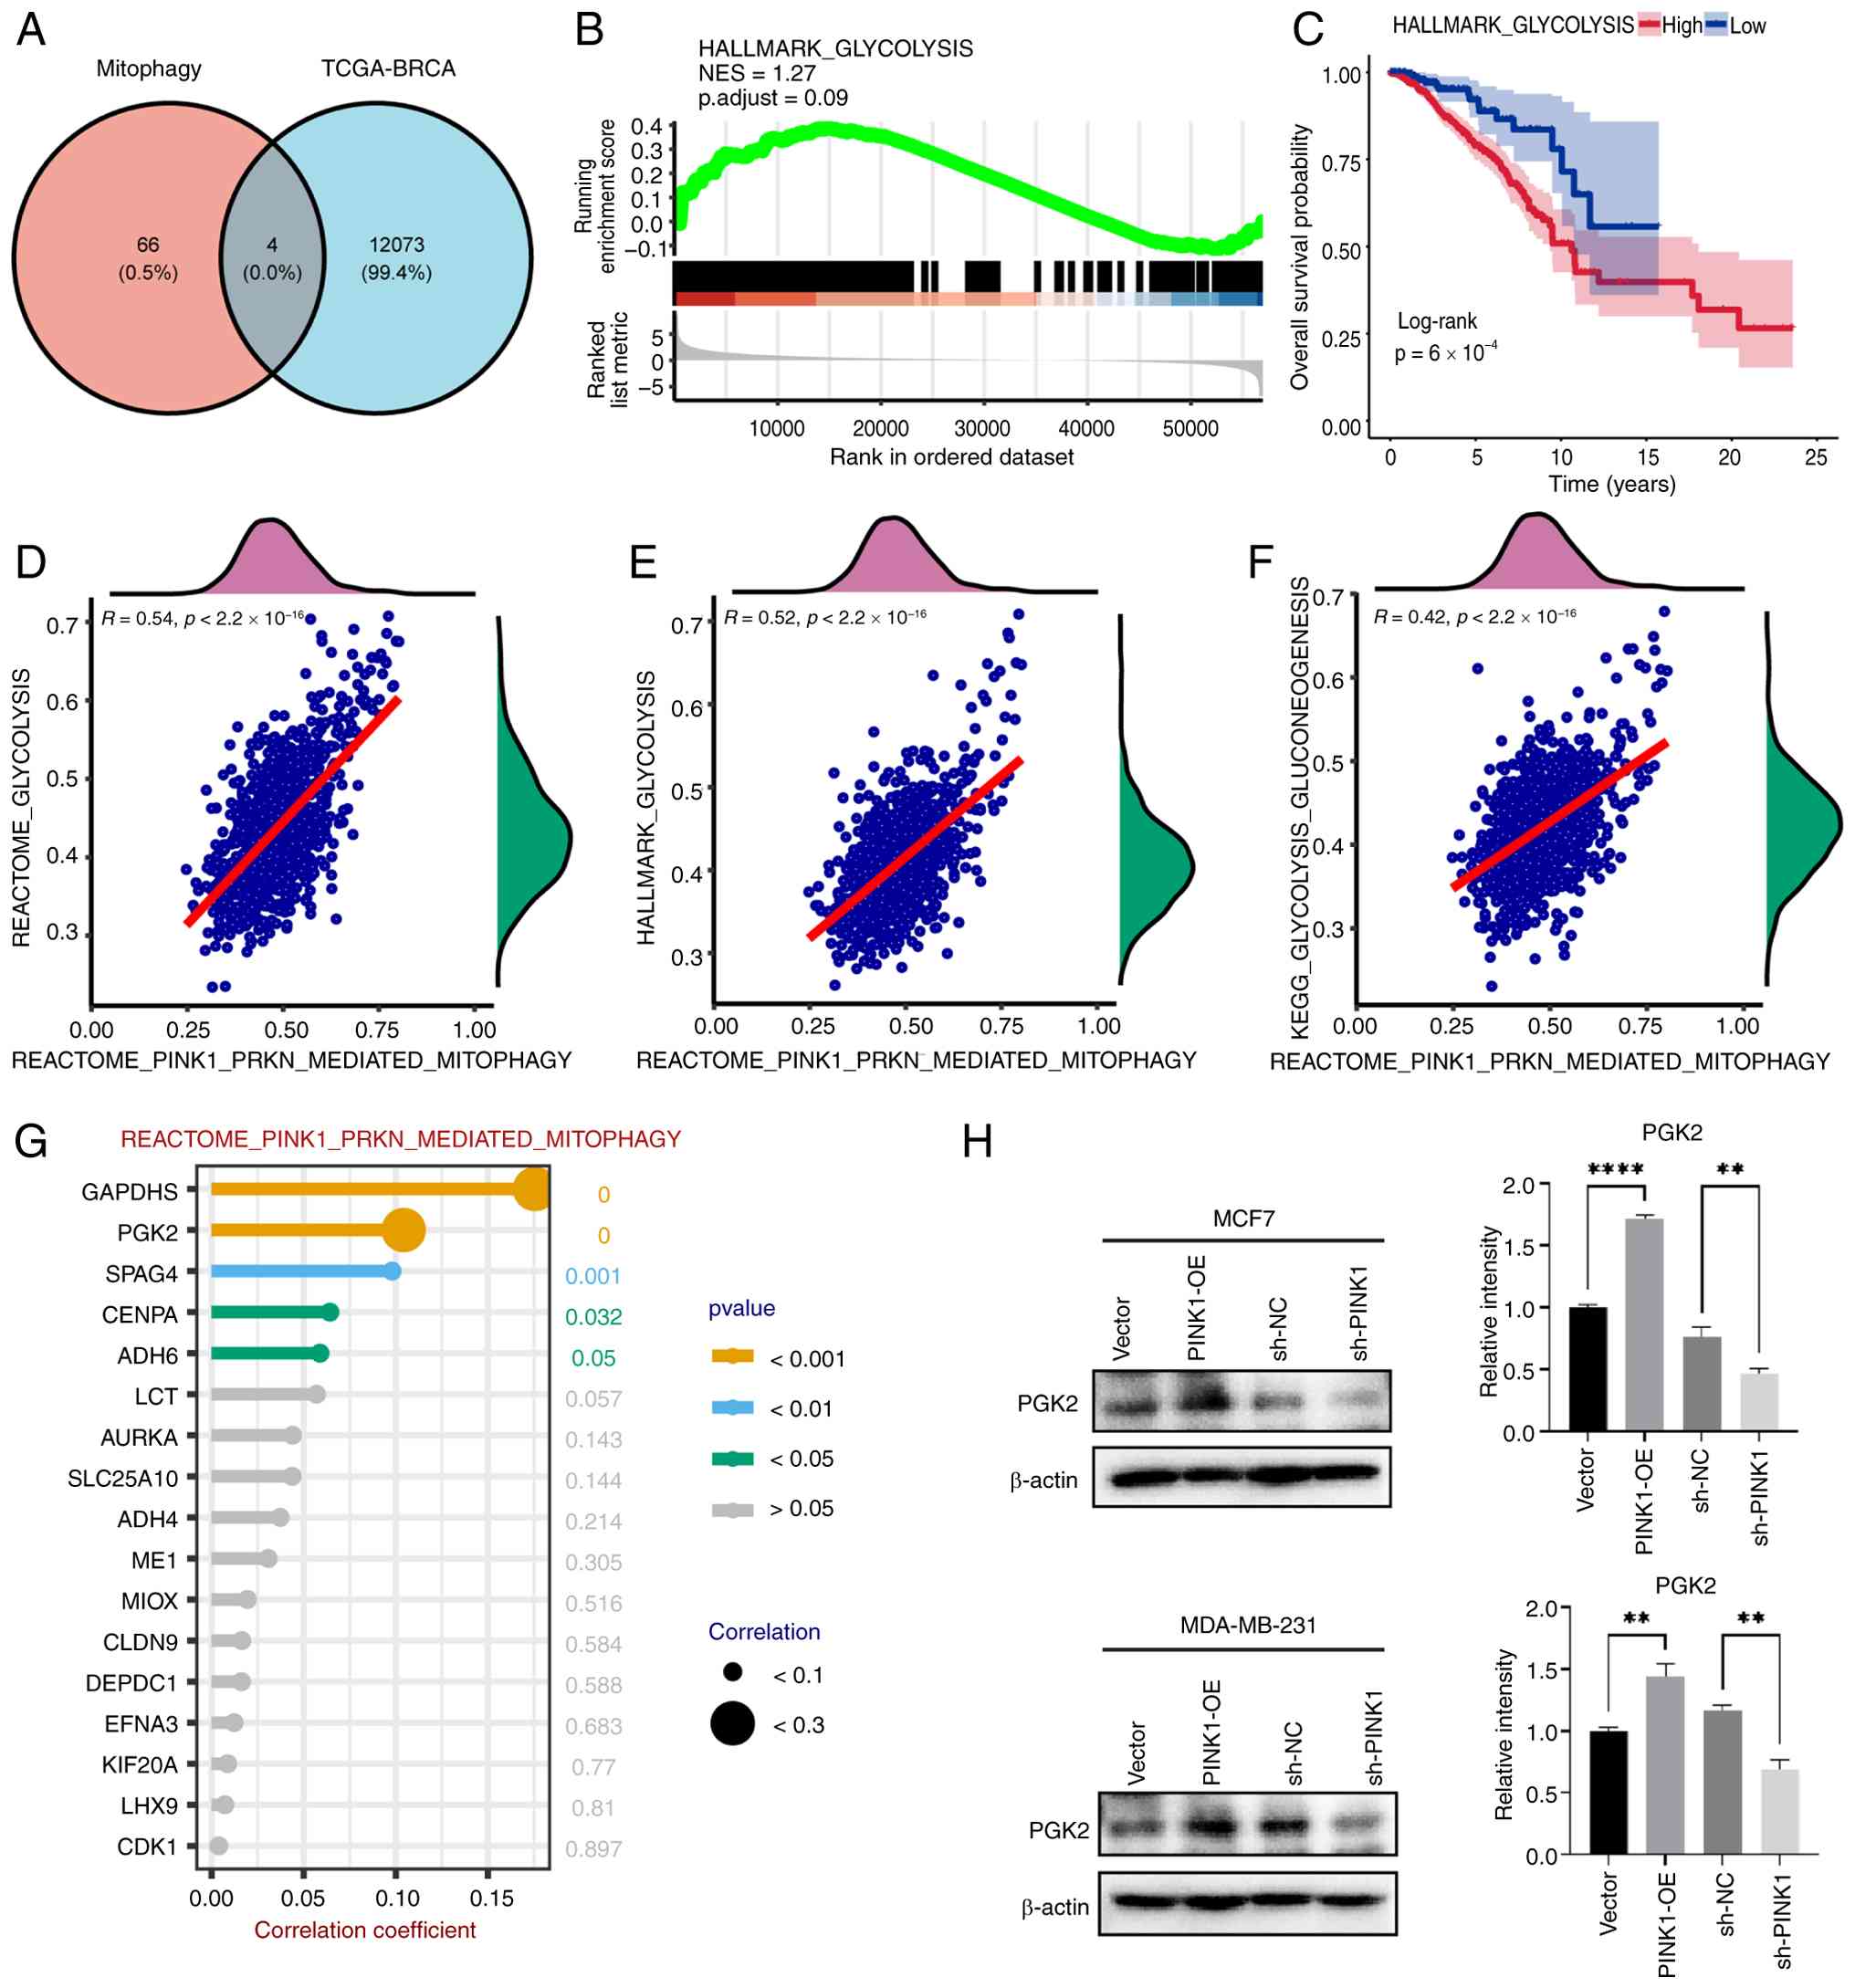 | Figure 10.Correlation analysis of
PINK1-mediated mitophagy with glycolysis and patient prognosis in
breast cancer. (A) Intersection analysis between DEGs and
Glyco-DEGs in the TCGA-BRCA dataset. (B) GSEA analysis of the
glycolysis pathway in the TCGA-BRCA dataset. (C) Prognostic
analysis of the glycolysis pathway activity in the TCGA-BRCA
cohort. (D) Correlation between the glycolysis score and the
activity of the REACTOME_PINK1_PRKN_MEDIATED_MITOPHAGY pathway. (E)
Correlation between the PINK1-mediated mitophagy pathway activity
and hallmark glycolysis gene set activity. (F) Correlation between
the PINK1-mediated mitophagy pathway activity and glycolysis core
signature gene set activity. (G) Correlation analysis between the
PINK1-mediated mitophagy pathway and glycolysis differential genes.
(H) Western blot analysis of PGK2 protein expression in MCF-7 and
MDA-MB-231 cells following PINK1 overexpression or knockdown.
Quantification of PGK2 levels is shown on the right, normalized to
β-actin. Statistical analyses were performed using GSEA, log-rank
test and Spearman correlation for the bioinformatics data, and
unpaired two-tailed Student's t-test for experimental validation.
Data represent means ± SEM from at least three independent
experiments. **P<0.01, ****P<0.0001. PINK1, PTEN-induced
kinase 1; DEGs, differentially expressed genes; Glyco, glycolysis;
TCGA, The Cancer Genome Atlas; BRCA, Breast Invasive Carcinoma;
GSEA, Gene Set Enrichment Analysis; NES, Normalized Enrichment
Score; PGK2, Phosphoglycerate Kinase 2. |
Analysis identified differentially expressed
glycolysis-related genes in breast cancer and correlation analysis
revealed a positive association between PINK1-related mitophagy and
glycolysis pathways. Western blot experiments confirmed that PINK1
overexpression increased PGK2 protein levels, whereas PINK1
knockdown decreased PGK2 expression in both MCF-7 and MDA-MB-231
cells.
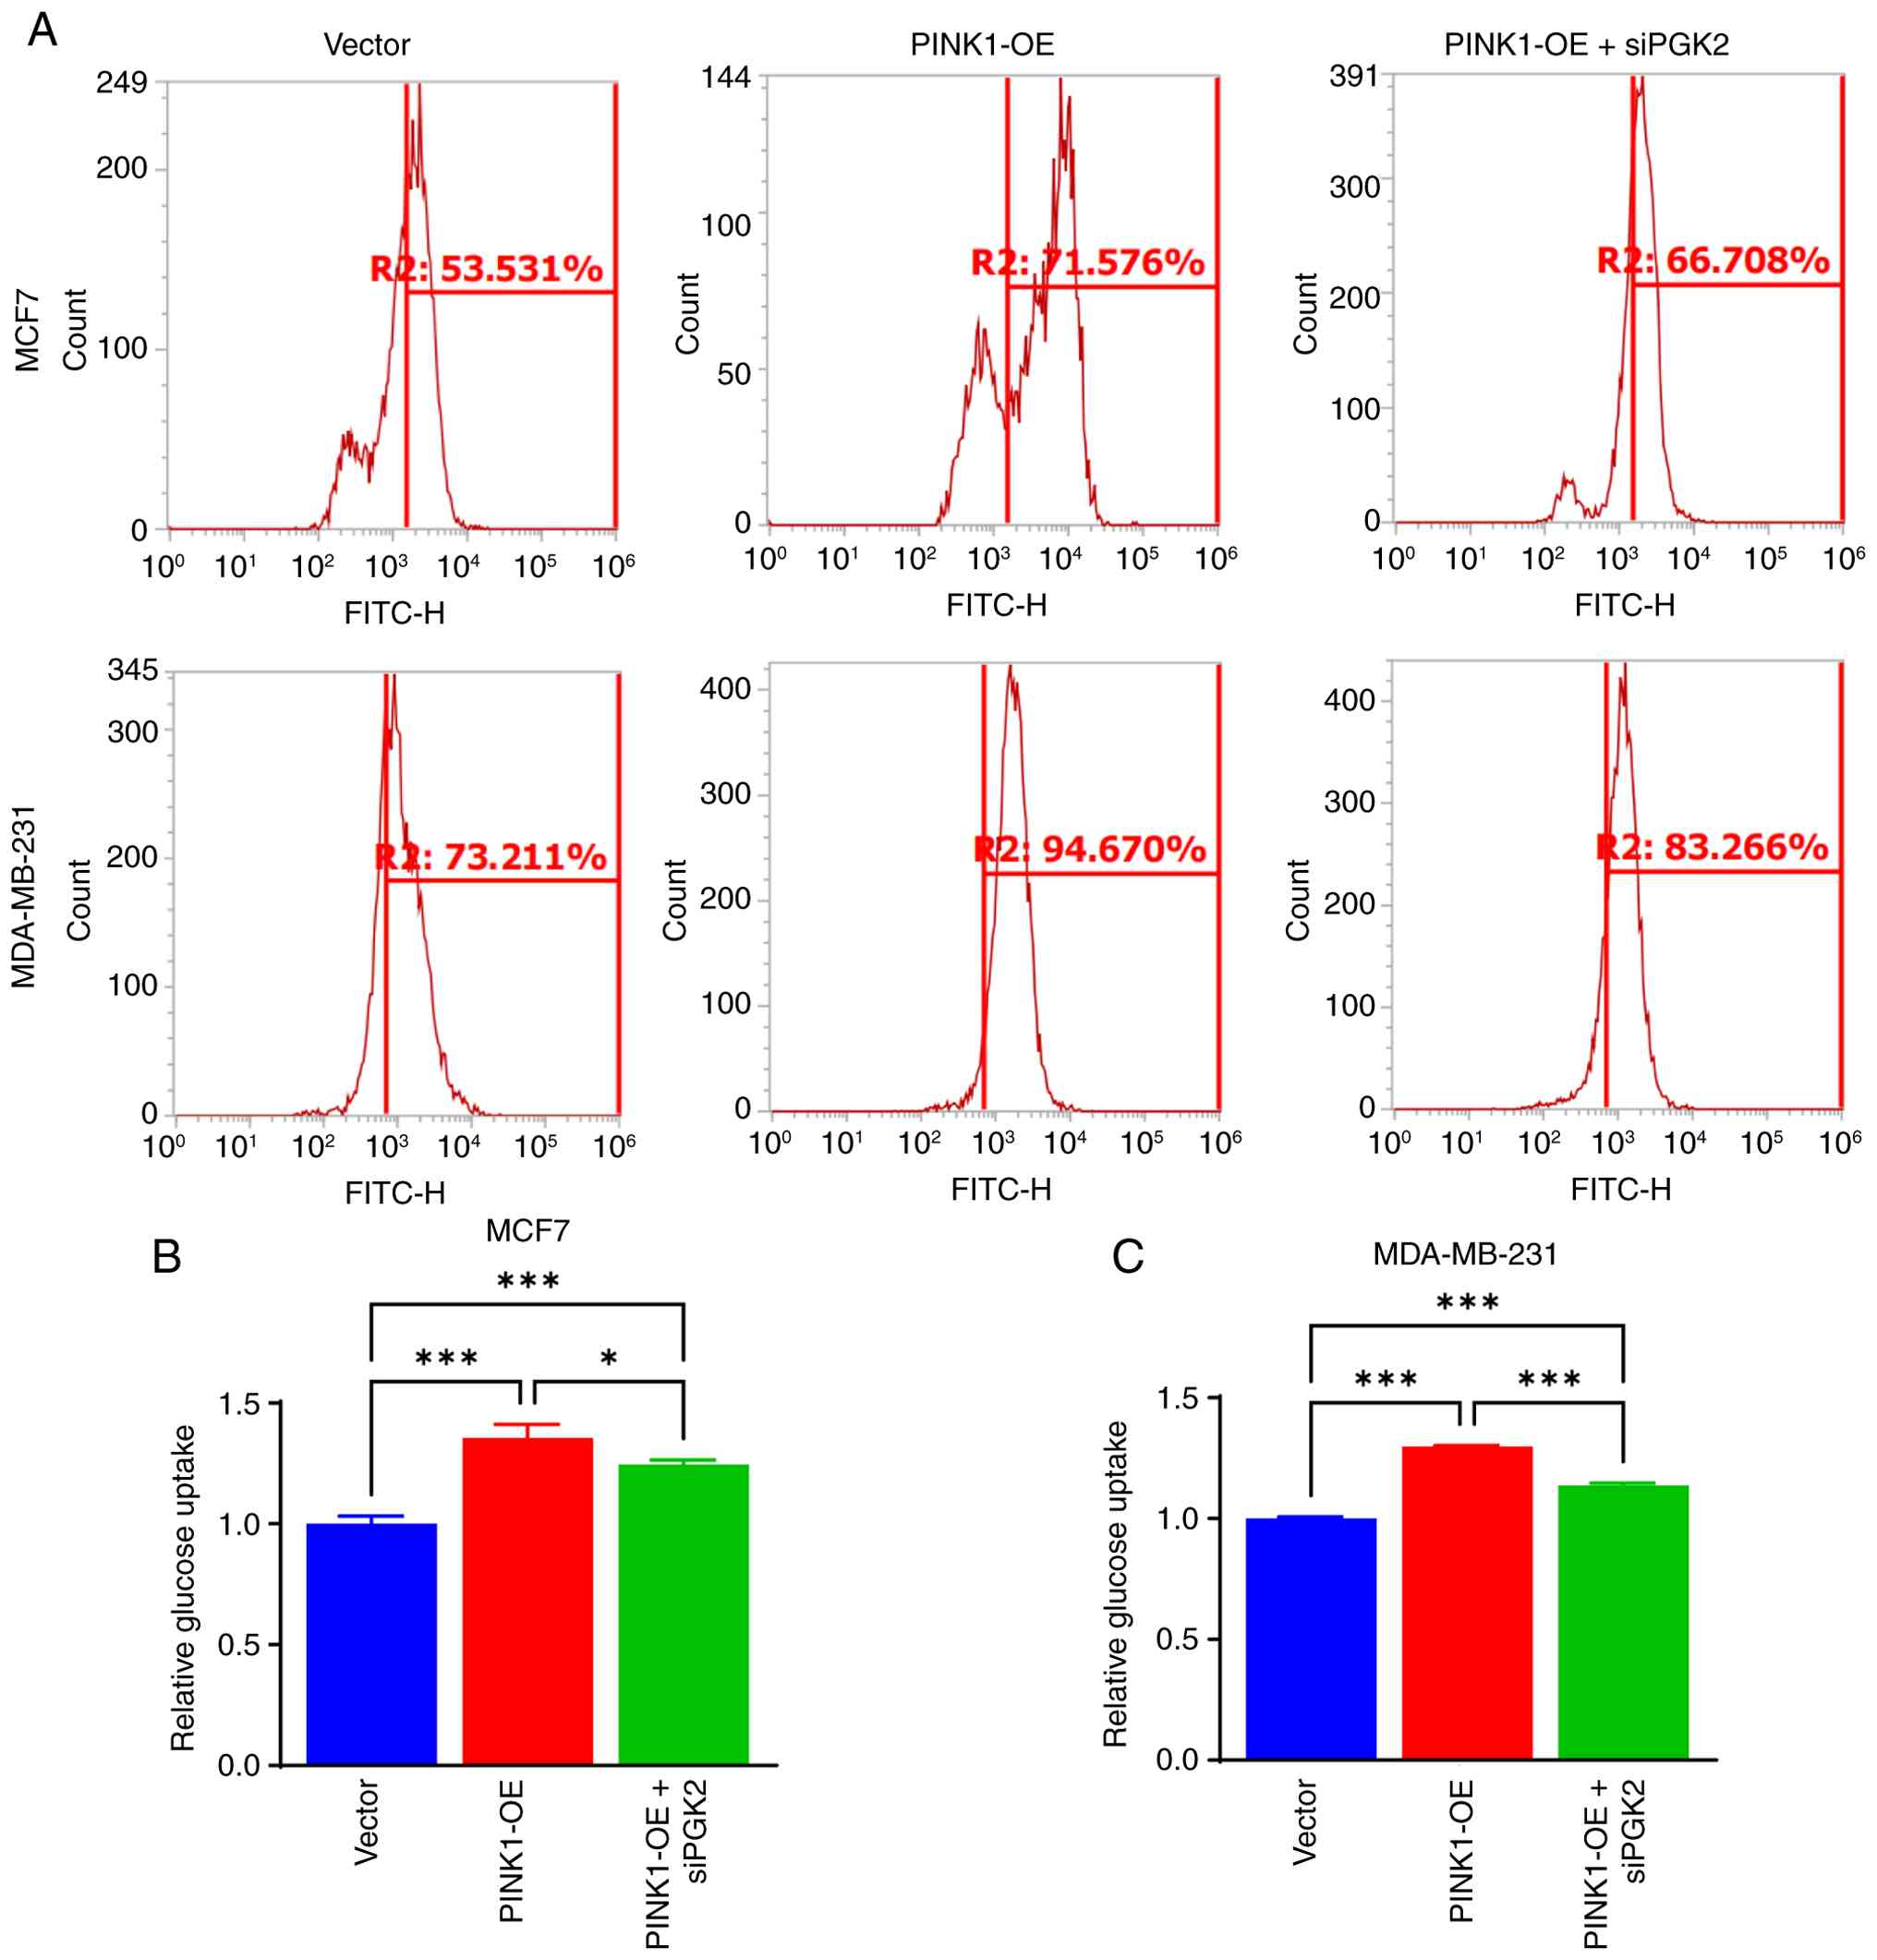
PINK1-driven PGK2 activation enhances
glucose uptake
Building on previous evidence that PINK1 may promote
glycolysis by upregulating PGK2, it was investigated whether this
metabolic shift enhances glucose uptake in breast cancer cells. In
total, two siRNAs targeting PGK2 were designed. siPGK2-2 showed the
best knockdown efficiency and was selected for subsequent
experiments (Fig. S4). Glucose
uptake was quantified using a fluorescent glucose analog and flow
cytometry under three experimental conditions in both MCF-7 and
MDA-MB-231 cells: Control vector, PINK1-OE and PINK1-OE + siPGK2.
As illustrated in Fig. 11A, PINK1
overexpression resulted in a significant increase in
glucose-positive cell populations, rising from 53.53 to 71.57% in
MCF-7 cells and from 73.21 to 94.67% in MDA-MB-231 cells. This
elevation was markedly reduced when PGK2 was knocked down, as shown
by quantitative analyses (Fig. 11B and
C).
These results suggest a potential role for PINK1 in
promoting glycolytic activation in breast cancer cells, possibly
involving PGK2, although direct mechanistic evidence is lacking. By
enhancing glucose utilization, PINK1 facilitates metabolic
reprogramming that supports the high energy demands of rapidly
proliferating and migrating cancer cells. These results indicate
that PINK1 modulates PGK2 expression in breast cancer cells.
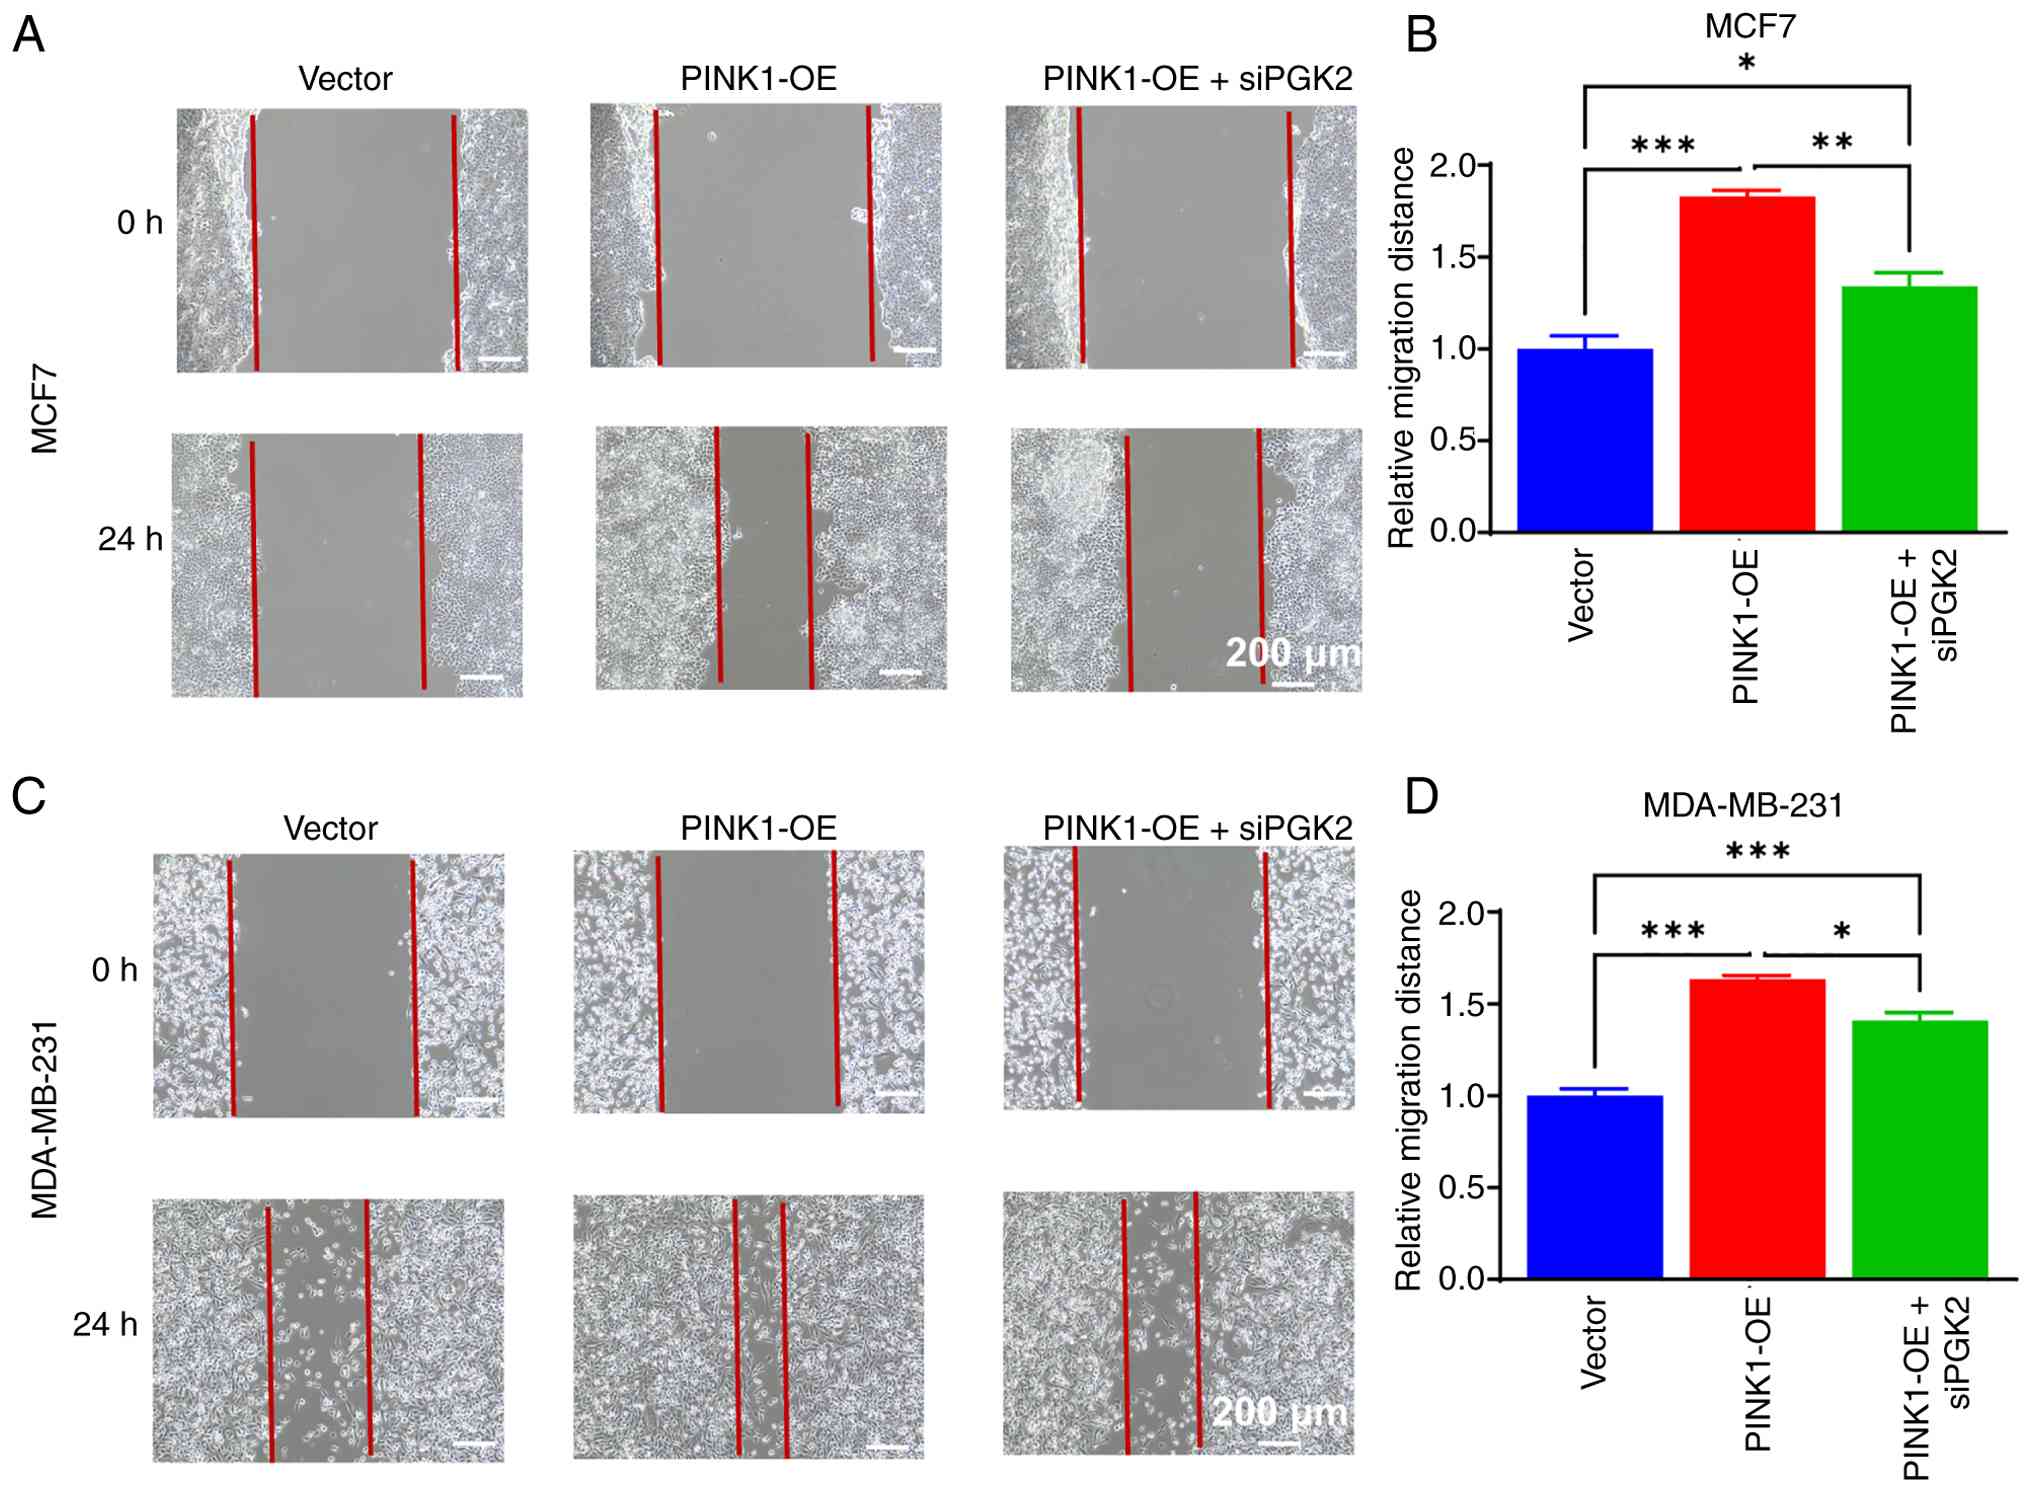
PGK2-dependent migration assay
following PINK1 overexpression
Given the prior findings that PINK1 may enhance
glycolysis and glucose uptake through PGK2 activation, it was next
examined whether this metabolic adaptation contributes to the
migratory behavior of breast cancer cells. Wound-healing assays
were performed using MCF-7 and MDA-MB-231 cells under three
conditions: Control vector, PINK1-OE and PINK1-OE + siPGK2. As
depicted in Fig. 12A and B,
PINK1-OE significantly accelerated wound closure after 24 h in both
cell lines, indicative of enhanced cell migration. Quantitative
analysis substantiated a significant increase in relative migration
distance compared with the control group (Fig. 12C and D). However, co-transfection
with siPGK2 notably diminished this migratory enhancement,
suggesting a critical role for PGK2 in mediating PINK1-induced cell
migration. In MCF-7 cells, PINK1 overexpression resulted in an ~80%
increase in migration compared with the control group, while
co-transfection with siPGK2 mitigated this enhancement by ~28%. A
similar trend was observed in MDA-MB-231 cells, where PINK1-induced
migration was suppressed following PGK2 inhibition. Collectively,
these data provide functional evidence that PINK1 may promote
breast cancer cell migration via a PGK2-dependent metabolic
mechanism. Unlike prior studies that primarily focused on glucose
uptake, this experiment established a link between PINK1-driven
glycolysis and enhanced motility (56,57).
These findings support a broader model wherein PINK1, through
mitophagy-induced metabolic reprogramming, facilitates both energy
production and the acquisition of aggressive phenotypes that drive
breast cancer progression.
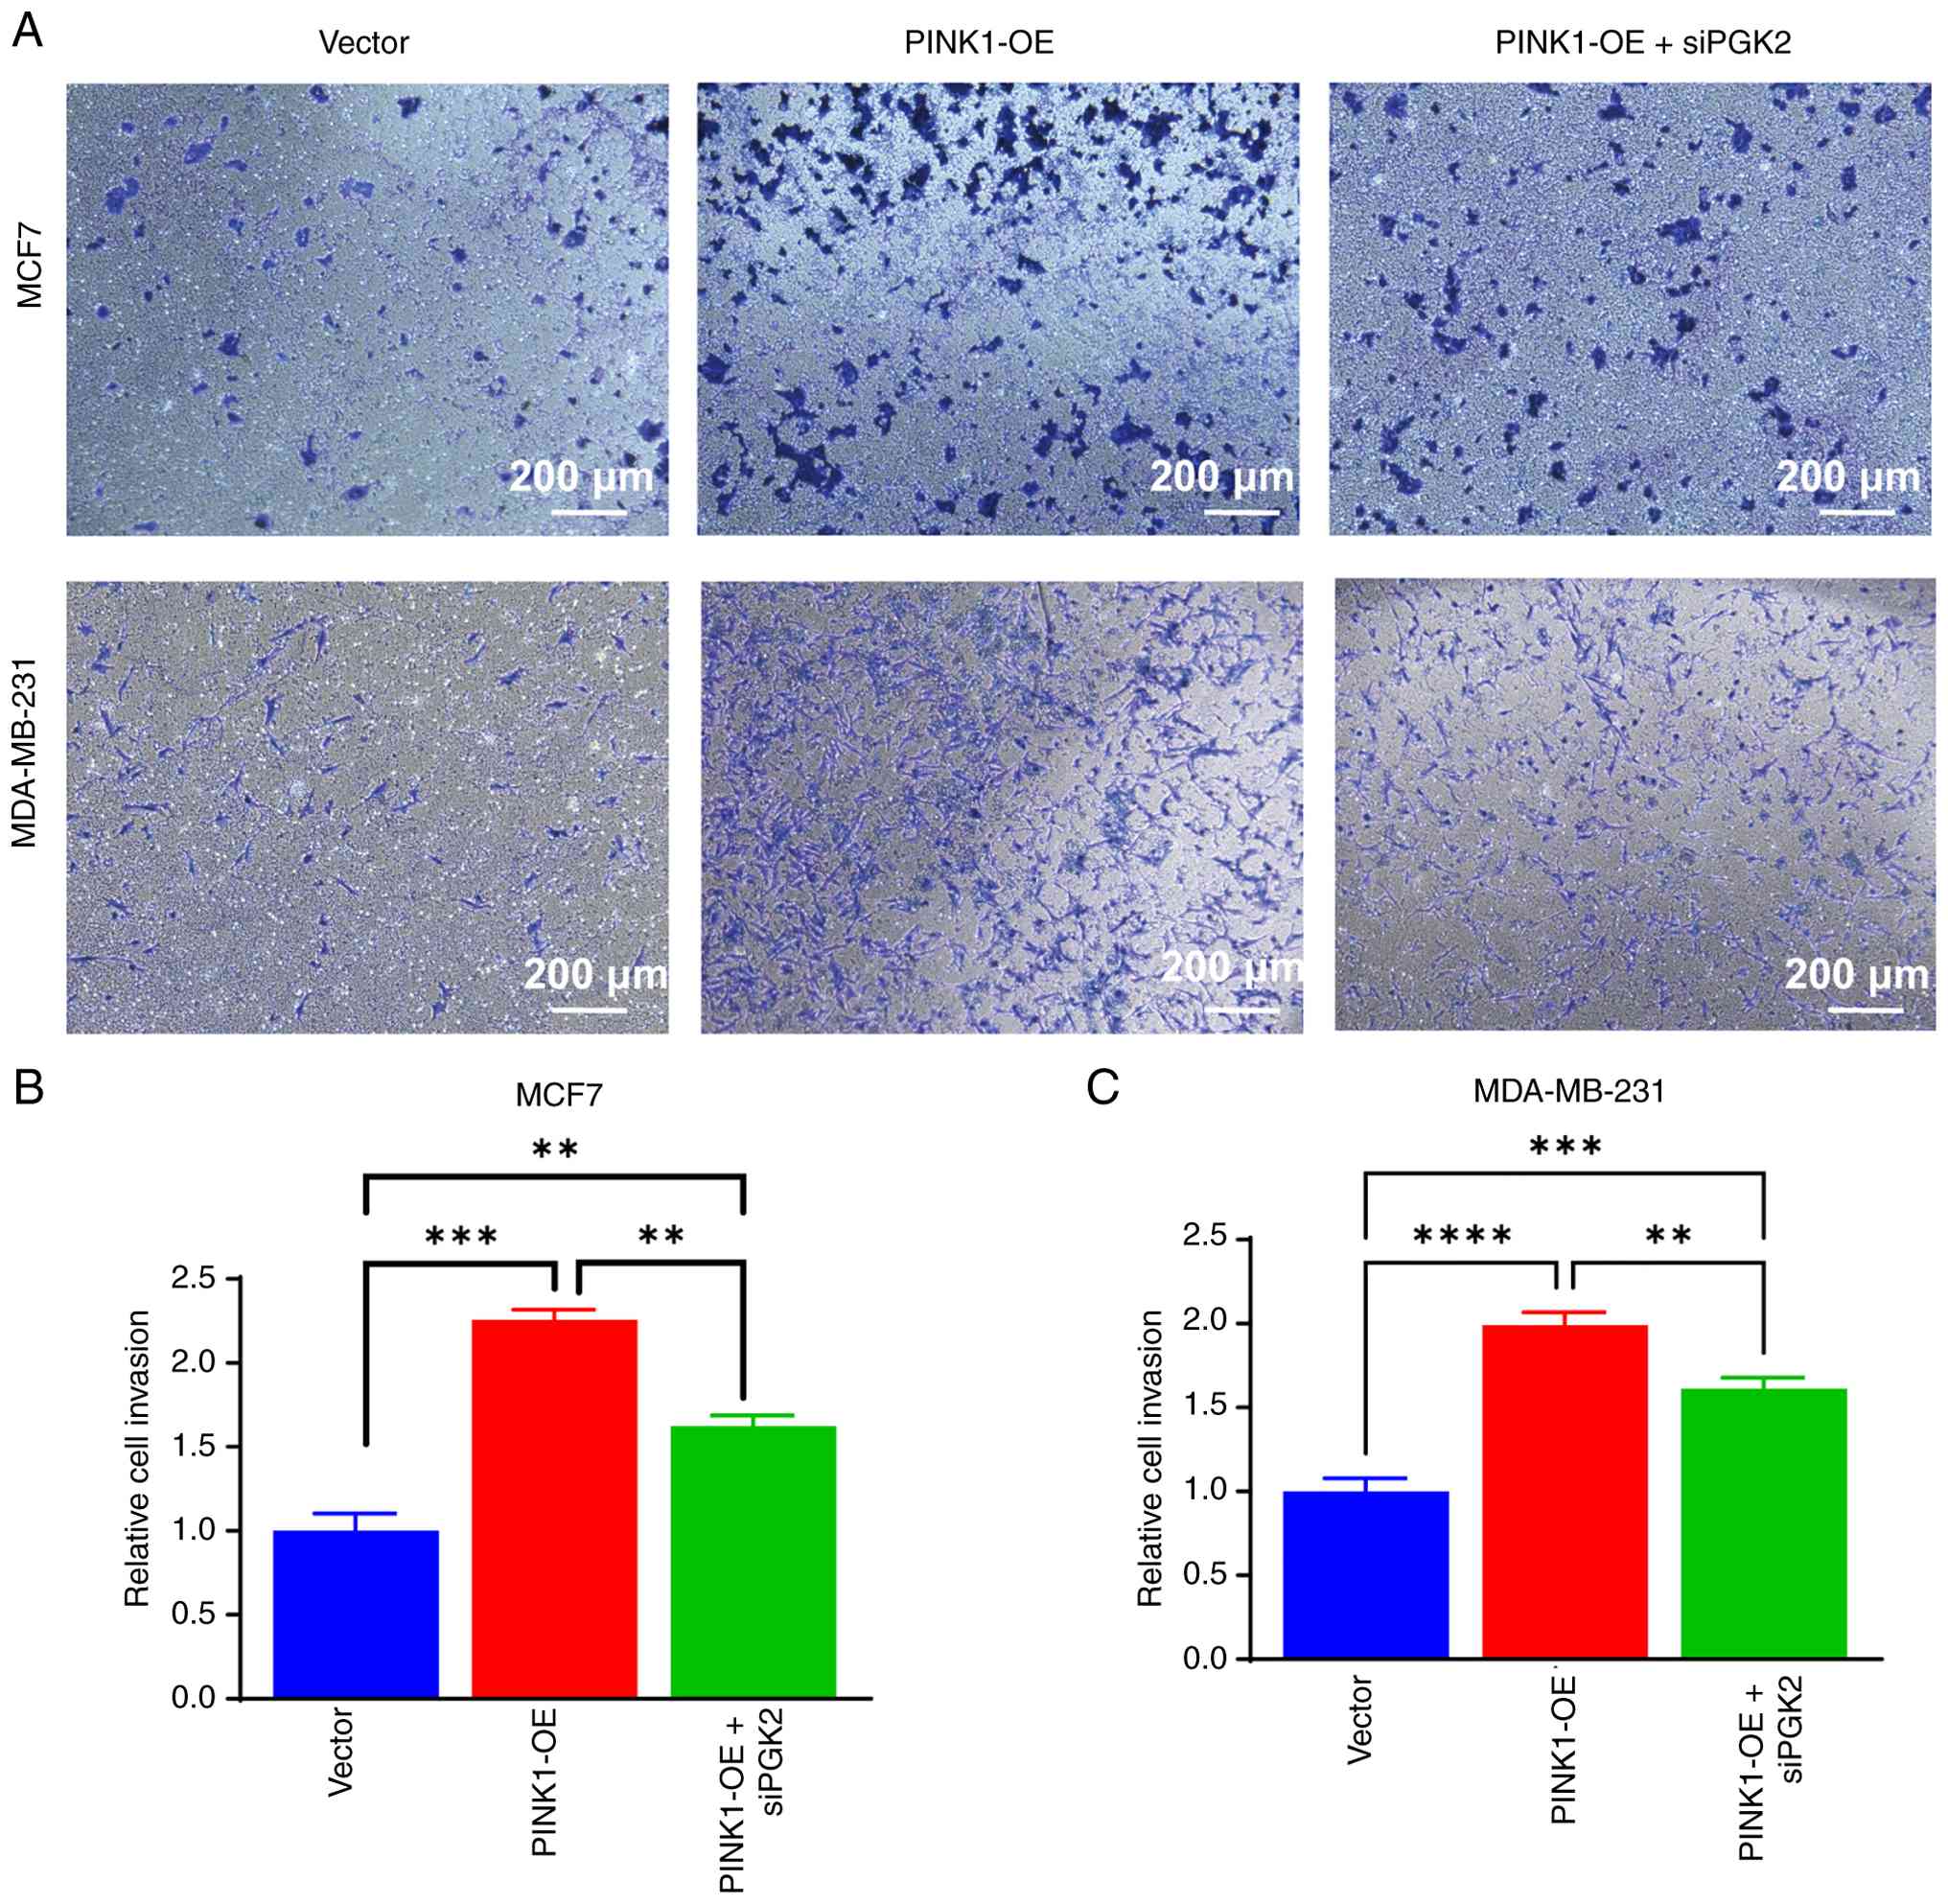
Glycolytic activation by PINK1
promotes invasion
To further elucidate the link between PINK1-induced
metabolic rewiring and invasive potential, Transwell invasion
assays were conducted in both MCF-7 and MDA-MB-231 breast cancer
cells under three experimental conditions: Vector control, PINK1-OE
and PINK1-OE + siPGK2. As shown in Fig. 13, PINK1 overexpression
significantly enhanced the invasive capacity of both MCF-7 and
MDA-MB-231 cells compared with the vector group. Quantitative
analysis demonstrated a significant increase in the number of
invasive cells upon PINK1-OE, confirming that PINK1 promotes cell
invasion. Notably, co-transfection with siPGK2 markedly reduced
this invasive phenotype, indicating that PGK2 may be essential for
PINK1-mediated invasion. In MCF-7 cells, PINK1-OE nearly doubled
the number of invasive cells compared with the control, while PGK2
knock down partially reversed this effect. A similar trend was
observed in MDA-MB-231 cells, where PGK2 knockdown diminished
PINK1-induced invasion.
These findings provide functional evidence that
PINK1 may promote breast cancer invasiveness through PGK2-dependent
glycolytic activation. By linking mitophagy and metabolic
reprogramming, the PINK1-PGK2 axis supplies the energy and
biosynthetic capacity required for tumor invasion and metastasis.
This underscores the potential of targeting PINK1-mediated
metabolic pathways as a therapeutic approach for aggressive breast
cancer subtypes.
PINK1-PGK2 axis elevates the levels of
glycolytic metabolites
Given the possible role of PINK1 in driving
glycolysis and invasion via PGK2, it was next examined how this
regulatory axis may influence key metabolic intermediates,
particularly acetyl-CoA. Acetyl-CoA is central to metabolism,
linking glycolysis to the tricarboxylic acid (TCA) cycle while
serving as a critical molecule for energy production and
biosynthesis; it fuels the TCA cycle for ATP generation and
supports processes such as fatty acid synthesis and protein
acetylation, which affect gene expression and cellular growth.
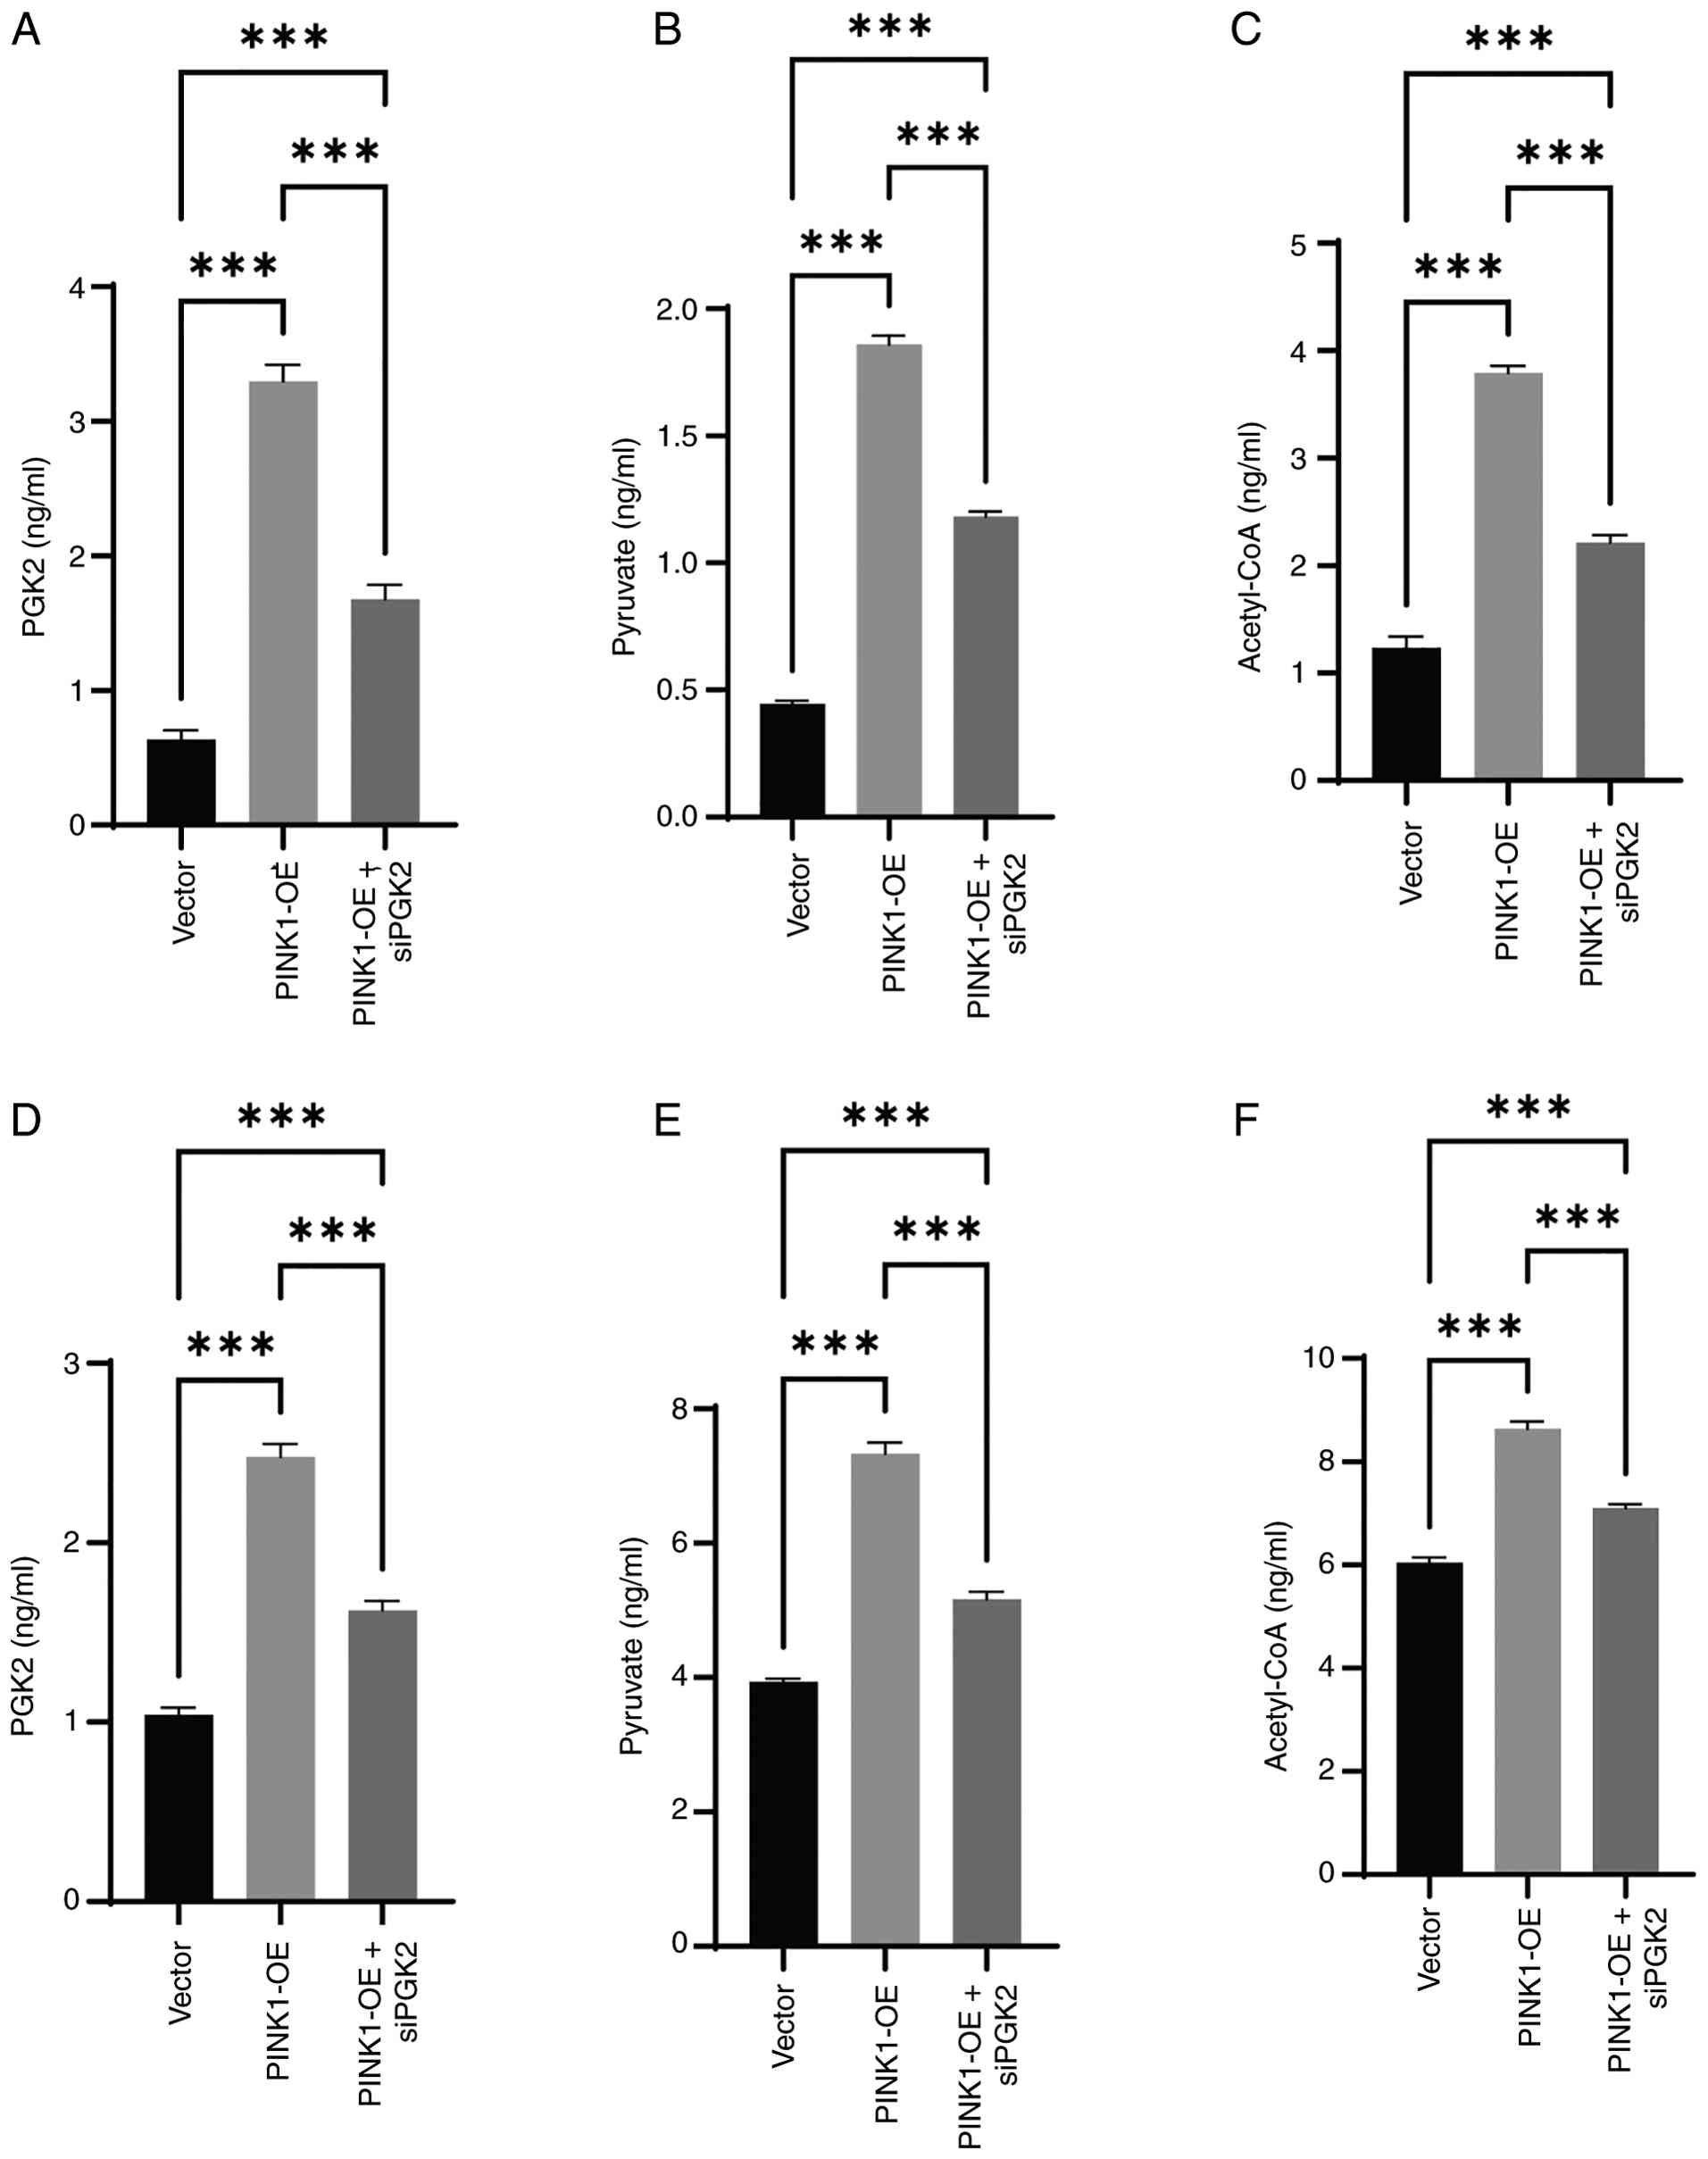
Utilizing ELISA assays, the PGK2, pyruvate and
acetyl-CoA levels in MCF-7 and MDA-MB-231 breast cancer cells were
quantified under three conditions: Vector control, PINK1-OE and
PINK1-OE + siPGK2. In MCF-7 cells (Fig. 14A-C), PINK1-OE significantly
increased PGK2 expression and elevated the levels of pyruvate and
acetyl-CoA, indicating enhanced glycolytic flux and metabolic
activation. Co-transfection with siPGK2 partially reduced these
elevations, confirming the dependence of this effect on PGK2
activity. Consistent results were observed in MDA-MB-231 cells
(Fig. 14D-F), where PINK1-OE
upregulated PGK2 and its downstream metabolites, all of which
decreased upon siPGK2 treatment. These results demonstrate that
PINK1 upregulation enhances glycolytic throughput, leading to the
accumulation of pyruvate and acetyl-CoA, key intermediates that
link cytosolic glycolysis to mitochondrial energy metabolism.
Elevated acetyl-CoA reflects an increased capacity for TCA cycle
activity and biosynthetic processes, supporting tumor cell growth
and metabolic flexibility. Furthermore, PGK2 knockdown partially
suppressed acetyl-CoA accumulation, confirming the dependence of
this metabolic shift on glycolysis. These findings underscore the
PINK1-PGK2 axis as a potentially pivotal regulator of glycolysis
and a link between glycolytic reprogramming and mitochondrial
function.
Overall, the results of the present study indicate
that the PINK1-PGK2 axis may play a central role in metabolic
reprogramming in breast cancer cells, enhancing glycolysis,
mitochondrial function and biosynthesis (Fig. S5). This metabolic flexibility aids
tumor cells in survival and proliferation, rendering this axis a
promising target for future cancer therapies.
Discussion
Breast cancer remains a leading cause of
cancer-related mortality, primarily due to its aggressive nature
and the limited availability of effective targeted therapies
(58). A hallmark of cancer
progression is metabolic reprogramming, characterized by a shift
towards glycolysis (59). However,
the mechanisms linking mitochondrial quality control to metabolism
in TNBC are not yet fully understood (60). A prior study has demonstrated that
PINK1, a critical regulator of mitophagy, is vital for maintaining
mitochondrial integrity (61).
However, the specific role of PINK1 in connecting mitophagy to
glycolytic reprogramming in breast cancer has not, to the best of
our knowledge, been extensively investigated. Elevated PINK1
expression in TNBC correlates with poor prognosis, suggesting its
potential role in tumor progression (62). Recent findings indicate that PINK1
may influence glycolytic flux through enzymes such as PGK2
(63). PGK2, an important enzyme in
the glycolytic pathway, catalyzes the conversion of
1,3-bisphosphoglycerate to 3-phosphoglycerate, thereby facilitating
ATP production (64,65). While glycolysis is recognized as a
central component of tumor metabolism, the exact relationship
between PINK1-mediated mitophagy and glycolytic reprogramming in
breast cancer cells has yet to be thoroughly explored. The present
study aimed to address this gap by elucidating the PINK1-PGK2 axis
as a potential fundamental mechanism linking mitochondrial turnover
to glycolytic reprogramming, thereby promoting aggressive tumor
growth and treatment resistance in TNBC. Targeting this PINK1-PGK2
axis presents a promising therapeutic strategy for exploiting the
metabolic vulnerabilities of aggressive breast cancer. By
inhibiting this pathway, it may be possible to disrupt the
metabolic flexibility that this cancer type utilizes for survival
and progression.
The findings of the present study provide compelling
evidence that PINK1 may play a crucial oncogenic role in breast
cancer by integrating mitochondrial quality control with metabolic
reprogramming, which is essential for meeting the energy demands
and biosynthetic processes necessary for tumor proliferation and
invasion, particularly in aggressive subtypes such as TNBC.
Specifically, the overexpression of PINK1 in both luminal and TNBC
models significantly activated the mitophagy pathway, as evidenced
by elevated levels of Parkin and LC3-II and an increase in
autophagosomal structures observed through TEM. This activation of
mitophagy was not a mere passive response but actively facilitated
cellular proliferation, migration and invasion, thereby reinforcing
the oncogenic adaptation mediated by PINK1.
Furthermore, the present study identified PGK2 as a
glycolytic effector downstream of PINK1. The mechanistic data
indicated that PINK1 overexpression upregulated PGK2, resulting in
enhanced glycolytic flux, increased glucose uptake and the
accumulation of critical metabolites such as pyruvate and
acetyl-CoA. Notably, acetyl-CoA is a central metabolite linking
glycolysis to the TCA cycle and other anabolic pathways; its
increased availability suggests that PINK1 not only augments
glycolysis but also enhances pyruvate dehydrogenase activity,
facilitating the flow of carbon into the TCA cycle (66). This process supports mitochondrial
ATP production and generates citrate for lipid biosynthesis via ATP
citrate lyase. The resulting cytosolic acetyl-CoA fuels de
novo fatty acid synthesis through enzymes such as acetyl-CoA
carboxylase and fatty acid synthase. This process supports membrane
biogenesis in rapidly proliferating cells (67). Therefore, the PINK1-PGK2 axis may
orchestrate a complex metabolic shift that meets energetic and
biosynthetic demands. We hypothesize that this axis also interacts
with other regulatory pathways, such as enhanced histone
acetyltransferase activity and lipogenesis, to establish a
metabolically aggressive and transcriptionally permissive tumor
phenotype. This hypothesis is primarily based on the present
finding that the PINK1-PGK2 axis significantly elevated the levels
of acetyl-CoA, a key precursor for both epigenetic modifications
and lipid synthesis. Consistently, pharmacological inhibition of
PGK2 reversed a number of these oncogenic effects, thereby
confirming that the PINK1-mediated program is critically dependent
on glycolytic flux and the subsequent availability of these
metabolic intermediates. These findings suggest that mitophagy is
not merely a passive degradation process; rather, it actively
contributes to biosynthetic and energetic adaptation in breast
cancer cells, fulfilling the metabolic requirements for rapid tumor
progression.
In addition to metabolic flux, PINK1-driven
mitophagy may influence broader transcriptional environments
associated with glycolytic regulation. First, increased glycolytic
demand and shifts in oxygen/redox states can stabilize
hypoxia-inducible factor 1α, a master regulator of glycolytic gene
expression, which could indirectly favor PGK2 upregulation
(68,69). Second, p53, a key metabolic
gatekeeper that constrains glycolysis (70), has been reported to intersect with
PINK1-associated stress responses, raising the possibility that p53
loss or inhibition may further facilitate PGK2 induction downstream
of PINK1 (66). Based on the
results of the present study, we propose the following testable
hypotheses: i) PINK1 positively regulates PGK2 expression, placing
PGK2 downstream of PINK1 signaling; and ii) restoration of
wild-type p53 activity attenuates PINK1-induced upregulation of
PGK2. To interrogate the functional role of PGK2 in PINK1-mediated
metabolic reprogramming, genetic knockdown of PGK2 provides a
specific and reliable experimental approach. Unlike pharmacologic
inhibitors, which may have off-target effects, PGK2 knockdown
provides a more precise model for studying the direct involvement
of PGK2 in metabolic pathways. The genetic knock down of PGK2
eliminates potential confounding factors, ensuring that observed
changes in pyruvate and acetyl-CoA levels are directly attributable
to PGK2 activity. This approach strengthens the causal link between
PGK2 and metabolic adaptation, offering a clearer understanding of
the role of PGK2 in cellular metabolism under stress conditions.
Future studies should explore whether additional transcriptional
regulators, such as c-Myc and NF-κB, cooperate to fine-tune PGK2
expression in a subtype-specific manner.
PINK1-mediated glycolytic reprogramming not only
enhances cellular proliferation but also promotes aggressive
phenotypes, such as increased migration and invasiveness. This was
demonstrated in the present study through wound healing and
Transwell invasion assays, where cells overexpressing PINK1
exhibited significantly greater migratory and invasive
capabilities. Notably, these effects were diminished by PGK2
knockdown, reinforcing the notion that PINK1 may drive metabolic
alterations that heighten cancer cell aggressiveness. Collectively,
these findings establish the PINK1-PGK2 axis as a potential link
between mitochondrial turnover and the metabolic flexibility
essential for tumor invasiveness.
Supporting the clinical relevance of the findings of
the present study, data mining from TCGA-BRCA cohorts revealed a
robust association between elevated PINK1 expression and poor
patient outcomes, particularly in TNBC subtypes. Future research
should investigate whether targeting PINK1 can modify the immune
microenvironment and enhance the efficacy of immunotherapy. Beyond
metabolic control, the PINK1-PGK2 axis may also influence immune
contexture in breast cancer. Recent single-cell studies of IL27RA
and TMEM71 demonstrated a coordinated reprogramming of metabolic
and immune pathways in breast tumors, linking metabolic alterations
to immune modulation and disease progression (71,72).
These data align with the observation in the present study that
PINK1-driven glycolytic activation may be associated with
immunosuppressive features and adverse outcomes. Furthermore,
systemic immune-inflammatory and nutritional indices independently
predict prognosis in breast cancer, underscoring the systemic
nature of tumor-host metabolic interactions (73). Complementary Mendelian randomization
further supports a causal link between metabolic changes and
immune-related diseases (74).
Collectively, these studies suggest a potential link between
PINK1-related metabolic regulation and immune modulation, implying
that the PINK1-PGK2 axis may connect metabolic function with immune
responses. This positioning suggests that inhibition of this
glycolytic pathway could both restrict tumor growth and recalibrate
antitumor immunity. We propose testing metabolic-immunotherapy
combinations in TNBC, guided by PINK1/PGK2 expression and
immune-nutritional indices, to refine patient selection and
elucidate mechanistic connections. The results of the present study
indicate that PINK1 may contribute to metabolic reprogramming and
immune evasion, complicating the prognosis and treatment of
TNBC.
In conclusion, the present study identified PINK1 as
a potential regulator of breast cancer progression by elucidating
the connection between mitochondrial quality control and metabolic
reprogramming. It was demonstrated that PINK1-mediated mitophagy
upregulated the downstream glycolytic enzyme PGK2. This
upregulation enhanced glucose uptake, pyruvate generation and
acetyl-CoA accumulation. These metabolic alterations facilitated
proliferation, migration and invasion in both luminal and TNBC
cells. Knocking down PINK1 impaired mitophagy, suppressed
glycolysis and diminished malignant characteristics.
Mechanistically, the PINK1-PGK2 axis emerged as a possible
metabolic bridge that promotes energy flow and biosynthetic
activity. Additionally, increased PINK1 expression correlated with
immunosuppressive microenvironments and adverse patient prognosis.
Functionally, knocking down PGK2 effectively counteracted
PINK1-induced tumor progression, underscoring the therapeutic
significance of this pathway. The findings highlighted the dual
oncogenic roles of PINK1 in maintaining mitochondrial integrity and
driving glycolytic adaptation. Targeting the PINK1-PGK2 metabolic
axis may offer promising strategies for addressing aggressive,
metabolically flexible and treatment-resistant breast cancer
subtypes. Furthermore, combining inhibitors of the PINK1-PGK2 axis
with existing chemotherapies or metabolic modulators could yield
synergistic effects and overcome drug resistance. Overall, the
present study provided mechanistic insights into the intersection
of mitophagy and metabolic reprogramming in breast cancer; it
established the PINK1-PGK2 axis as a promising target for
therapeutic intervention, particularly in metabolically adaptable
and treatment-resistant subtypes such as TNBC.
Supplementary Material
Supporting Data
Supporting Data
Supporting Data
Supporting Data
Supporting Data
Supporting Data
Supporting Data
Supporting Data
Acknowledgements
Not applicable.
Funding
This research was supported by the National Natural Science
Foundation of China (grant no. 82303865) and the China Postdoctoral
Science Foundation (grant no. 2024M762040).
Availability of data and materials
The data generated in the present study may be
requested from the corresponding author.
Authors' contributions
ZG contributed to study design, formal analysis and
writing the original draft. QY contributed to conceptualization,
project administration and reviewing and editing the manuscript. RS
contributed to data collection, preprocessing data and writing the
original draft. WL contributed to the statistical analysis of the
present study. HD contributed to conceptualization, supervision,
funding acquisition and reviewing and editing the manuscript. WL
and HD confirm the authenticity of all the raw data. All authors
read and approved the final version of the manuscript.
Ethics approval and consent to
participate
Not applicable.
Patient consent for publication
Not applicable.
Competing interests
The authors declare that they have no competing
interests.
References
|
1
|
Kim J, Harper A, McCormack V, Sung H,
Houssami N, Morgan E, Mutebi M, Garvey G, Soerjomataram I and
Fidler-Benaoudia MM: Global patterns and trends in breast cancer
incidence and mortality across 185 countries. Nat Med.
31:1154–1162. 2025. View Article : Google Scholar : PubMed/NCBI
|
|
2
|
Zhou L and Yu CW: Epigenetic modulations
in triple-negative breast cancer: Therapeutic implications for
tumor microenvironment. Pharmacol Res. 204:1072052024. View Article : Google Scholar : PubMed/NCBI
|
|
3
|
Kumari L, Mishra L, Patel P, Sharma N,
Gupta GD and Kurmi BD: Emerging targeted therapeutic strategies for
the treatment of triple-negative breast cancer. J Drug Target.
31:889–907. 2023. View Article : Google Scholar : PubMed/NCBI
|
|
4
|
Xiong N, Wu H and Yu Z: Advancements and
challenges in triple-negative breast cancer: A comprehensive review
of therapeutic and diagnostic strategies. Front Oncol.
14:14054912024. View Article : Google Scholar : PubMed/NCBI
|
|
5
|
Asleh K, Riaz N and Nielsen TO:
Heterogeneity of triple negative breast cancer: Current advances in
subtyping and treatment implications. J Exp Clin Cancer Res.
41:2652022. View Article : Google Scholar : PubMed/NCBI
|
|
6
|
Zheng X, Ma H, Wang J, Huang M, Fu D, Qin
L and Yin Q: Energy metabolism pathways in breast cancer
progression: The reprogramming, crosstalk, and potential
therapeutic targets. Transl Oncol. 26:1015342022. View Article : Google Scholar : PubMed/NCBI
|
|
7
|
Liu S, Zhang X, Wang W, Li X, Sun X, Zhao
Y, Wang Q, Li Y, Hu F and Ren H: Metabolic reprogramming and
therapeutic resistance in primary and metastatic breast cancer. Mol
Cancer. 23:2612024. View Article : Google Scholar : PubMed/NCBI
|
|
8
|
Warburg O, Posener K and Negelein E: The
metabolism of cancer cells. Biochem Z. 152:319–344. 1924.
|
|
9
|
Monzel AS, Enriquez JA and Picard M:
Multifaceted mitochondria: Moving mitochondrial science beyond
function and dysfunction. Nat Metab. 5:546–562. 2023. View Article : Google Scholar : PubMed/NCBI
|
|
10
|
Chan DC: Mitochondrial dynamics and its
involvement in disease. Annu Rev Pathol. 15:235–259. 2020.
View Article : Google Scholar : PubMed/NCBI
|
|
11
|
Picard M and Shirihai OS: Mitochondrial
signal transduction. Cell Metab. 34:1620–1653. 2022. View Article : Google Scholar : PubMed/NCBI
|
|
12
|
Ashrafi G and Schwarz TL: The pathways of
mitophagy for quality control and clearance of mitochondria. Cell
Death Differ. 20:31–42. 2013. View Article : Google Scholar : PubMed/NCBI
|
|
13
|
Liu Y, Lu S, Wu LL, Yang L, Yang L and
Wang J: The diversified role of mitochondria in ferroptosis in
cancer. Cell Death Dis. 14:5192023. View Article : Google Scholar : PubMed/NCBI
|
|
14
|
Lu Y, Li Z, Zhang S, Zhang T, Liu Y and
Zhang L: Cellular mitophagy: Mechanism, roles in diseases and small
molecule pharmacological regulation. Theranostics. 13:736–766.
2023. View Article : Google Scholar : PubMed/NCBI
|
|
15
|
Kim J, Fiesel FC, Belmonte KC, Hudec R,
Wang WX, Kim C, Nelson PT, Springer W and Kim J: miR-27a and
miR-27b regulate autophagic clearance of damaged mitochondria by
targeting PTEN-induced putative kinase 1 (PINK1). Mol Neurodegener.
11:552016. View Article : Google Scholar : PubMed/NCBI
|
|
16
|
Trempe JF and Gehring K: Structural
mechanisms of mitochondrial quality control mediated by PINK1 and
Parkin. J Mol Biol. 435:1680902023. View Article : Google Scholar : PubMed/NCBI
|
|
17
|
Dai K, Radin DP and Leonardi D:
Deciphering the dual role and prognostic potential of PINK1 across
cancer types. Neural Regen Res. 16:659–665. 2021. View Article : Google Scholar : PubMed/NCBI
|
|
18
|
Goncalves FB and Morais VA: PINK1: A
bridge between mitochondria and Parkinson's disease. Life (Basel).
11:3712021.PubMed/NCBI
|
|
19
|
Wang M, Luan S, Fan X, Wang J, Huang J,
Gao X and Han D: The emerging multifaceted role of PINK1 in cancer
biology. Cancer Sci. 113:4037–4047. 2022. View Article : Google Scholar : PubMed/NCBI
|
|
20
|
Li J, Xu X, Huang H, Li L, Chen J, Ding Y
and Ping J: Pink1 promotes cell proliferation and affects
glycolysis in breast cancer. Exp Biol Med (Maywood). 247:985–995.
2022. View Article : Google Scholar : PubMed/NCBI
|
|
21
|
Shi C, de Wit S, Učambarlić E,
Markousis-Mavrogenis G, Screever EM, Meijers WC, de Boer RA and
Aboumsallem JP: Multifactorial diseases of the heart, kidneys,
lungs, and liver and incident cancer: Epidemiology and shared
mechanisms. Cancers (Basel). 15:7292023. View Article : Google Scholar : PubMed/NCBI
|
|
22
|
Lu D, Li Y, Niu X, Sun J, Zhan W, Shi Y,
Yu K, Huang S, Liu X, Xie L, et al: STAT2/SLC27A3/PINK1-mediated
mitophagy remodeling lipid metabolism contributes to pazopanib
resistance in clear cell renal cell carcinoma. Research (Wash DC).
7:05392024.PubMed/NCBI
|
|
23
|
Li YQ, Zhang F, Yu LP, Mu JK, Yang YQ, Yu
J and Yang XX: Targeting PINK1 using natural products for the
treatment of human diseases. Biomed Res Int. 2021:40458192021.
View Article : Google Scholar : PubMed/NCBI
|
|
24
|
Yin X, Xue R, Wu J, Wu M, Xie B and Meng
Q: PINK1 ameliorates acute-on-chronic liver failure by inhibiting
apoptosis through mTORC2/AKT signaling. Cell Death Discov.
8:2222022. View Article : Google Scholar : PubMed/NCBI
|
|
25
|
Guo J and Chiang WC: Mitophagy in aging
and longevity. IUBMB Life. 74:296–316. 2022. View Article : Google Scholar : PubMed/NCBI
|
|
26
|
De Gaetano A, Gibellini L, Zanini G, Nasi
M, Cossarizza A and Pinti M: Mitophagy and oxidative stress: The
role of aging. Antioxidants (Basel). 10:7942021. View Article : Google Scholar : PubMed/NCBI
|
|
27
|
Deepak K, Roy PK, Das CK, Mukherjee B and
Mandal M: Mitophagy at the crossroads of cancer development:
Exploring the role of mitophagy in tumor progression and therapy
resistance. Biochim Biophys Acta Mol Cell Res. 1871:1197522024.
View Article : Google Scholar : PubMed/NCBI
|
|
28
|
Wu K, Aoki C, Elste A, Rogalski-Wilk AA
and Siekevitz P: The synthesis of ATP by glycolytic enzymes in the
postsynaptic density and the effect of endogenously generated
nitric oxide. Proc Natl Acad Sci USA. 94:13273–13278. 1997.
View Article : Google Scholar : PubMed/NCBI
|
|
29
|
Vishwanatha JK, Jindal HK and Davis RG:
The role of primer recognition proteins in DNA replication:
Association with nuclear matrix in HeLa cells. J Cell Sci.
101:25–34. 1992. View Article : Google Scholar : PubMed/NCBI
|
|
30
|
Popanda O, Fox G and Thielmann HW:
Modulation of DNA polymerases alpha, delta and epsilon by lactate
dehydrogenase and 3-phosphoglycerate kinase. Biochim Biophys Acta.
1397:102–117. 1998. View Article : Google Scholar : PubMed/NCBI
|
|
31
|
Semenza GL: Regulation of mammalian O2
homeostasis by hypoxia-inducible factor 1. Annu Rev Cell Dev Biol.
15:551–578. 1999. View Article : Google Scholar : PubMed/NCBI
|
|
32
|
Liu XX, Zhang H, Shen XF, Liu FJ, Liu J
and Wang WJ: Characteristics of testis-specific phosphoglycerate
kinase 2 and its association with human sperm quality. Hum Reprod.
31:273–279. 2016.PubMed/NCBI
|
|
33
|
Chiarelli LR, Morera SM, Bianchi P, Fermo
E, Zanella A, Galizzi A and Valentini G: Molecular insights on
pathogenic effects of mutations causing phosphoglycerate kinase
deficiency. PLoS One. 7:e320652012. View Article : Google Scholar : PubMed/NCBI
|
|
34
|
Danshina PV, Geyer CB, Dai Q, Goulding EH,
Willis WD, Kitto GB, McCarrey JR, Eddy EM and O'Brien DA:
Phosphoglycerate kinase 2 (PGK2) is essential for sperm function
and male fertility in mice. Biol Reprod. 82:136–145. 2010.
View Article : Google Scholar : PubMed/NCBI
|
|
35
|
Rohozinski J, Anderson ML, Broaddus RE,
Edwards CL and Bishop CE: Spermatogenesis associated retrogenes are
expressed in the human ovary and ovarian cancers. PLoS One.
4:e50642009. View Article : Google Scholar : PubMed/NCBI
|
|
36
|
Wu ST, Liu B, Ai ZZ, Hong ZC, You PT, Wu
HZ and Yang YF: Esculetin inhibits cancer cell glycolysis by
binding tumor PGK2, GPD2, and GPI. Front Pharmacol. 11:3792020.
View Article : Google Scholar : PubMed/NCBI
|
|
37
|
Lingle W, Erickson BJ, Zuley ML, Jarosz R,
Bonaccio E, Filippini J, Net JM, Levi L, Morris EA, Figler GG, et
al: The cancer genome atlas breast invasive carcinoma collection
(TCGA-BRCA). The Cancer Imaging Archive; 2016
|
|
38
|
Hutter C and Zenklusen JC: The cancer
genome atlas: Creating lasting value beyond its data. Cell.
173:283–285. 2018. View Article : Google Scholar : PubMed/NCBI
|
|
39
|
Ogata H, Goto S, Fujibuchi W and Kanehisa
M: Computation with the KEGG pathway database. Biosystems.
47:119–128. 1998. View Article : Google Scholar : PubMed/NCBI
|
|
40
|
Liberzon A, Birger C, Thorvaldsdottir H,
Ghandi M, Mesirov JP and Tamayo P: The molecular signatures
database (MSigDB) hallmark gene set collection. Cell Syst.
1:417–425. 2015. View Article : Google Scholar : PubMed/NCBI
|
|
41
|
Gong W, Kuang M, Chen H, Luo Y, You K,
Zhang B and Liu Y: Single-sample gene set enrichment analysis
reveals the clinical implications of immune-related genes in
ovarian cancer. Front Mol Biosci. 11:14262742024. View Article : Google Scholar : PubMed/NCBI
|
|
42
|
Rosner B, Glynn RJ and Lee MLT:
Incorporation of clustering effects for the Wilcoxon rank sum test:
A large-sample approach. Biometrics. 59:1089–1098. 2003. View Article : Google Scholar : PubMed/NCBI
|
|
43
|
Canzler S and Hackermüller J: multiGSEA: A
GSEA-based pathway enrichment analysis for multi-omics data. BMC
Bioinformatics. 21:5612020. View Article : Google Scholar : PubMed/NCBI
|
|
44
|
Love M, Anders S and Huber W: Differential
analysis of count data-the DESeq2 package. Genome Biol. 15:10–1186.
2014.
|
|
45
|
Kolde R and Kolde MR: Package ‘pheatmap’.
R Package. 1:7902015.
|
|
46
|
Yuan F, Pan X, Chen L, Zhang YH, Huang T
and Cai YD: Analysis of protein-protein functional associations by
using gene ontology and KEGG pathway. Biomed Res Int.
2019:49632892019. View Article : Google Scholar : PubMed/NCBI
|
|
47
|
Chen B, Khodadoust MS, Liu CL, Newman AM
and Alizadeh AA: Profiling tumor infiltrating immune cells with
CIBERSORT. Methods Mol Biol. 1711:243–259. 2018. View Article : Google Scholar : PubMed/NCBI
|
|
48
|
Sedgwick P: Spearman's rank correlation
coefficient. BMJ. 349:g73272014. View Article : Google Scholar : PubMed/NCBI
|
|
49
|
Therneau TM and Lumley T: Package
‘survival’. R Top Doc. 128:28–33. 2015.
|
|
50
|
Santos P, Rezende CP, Piraine R, Oliveira
B, Ferreira FB, Carvalho VS, Calado RT, Pellegrini M and Almeida F:
Extracellular vesicles from human breast cancer-resistant cells
promote acquired drug resistance and pro-inflammatory macrophage
response. Front Immunol. 15:14682292024. View Article : Google Scholar : PubMed/NCBI
|
|
51
|
Livak KJ and Schmittgen TD: Analysis of
relative gene expression data using real-time quantitative PCR and
the 2(−Delta Delta C(T)) method. Methods. 25:402–408. 2001.
View Article : Google Scholar : PubMed/NCBI
|
|
52
|
Onishi M, Yamano K, Sato M, Matsuda N and
Okamoto K: Molecular mechanisms and physiological functions of
mitophagy. EMBO J. 40:e1047052021. View Article : Google Scholar : PubMed/NCBI
|
|
53
|
Pickles S, Vigié P and Youle RJ: Mitophagy
and quality control mechanisms in mitochondrial maintenance. Curr
Biol. 28:R170–R185. 2018. View Article : Google Scholar : PubMed/NCBI
|
|
54
|
Kerneur C, Cano CE and Olive D: Major
pathways involved in macrophage polarization in cancer. Front
Immunol. 13:10269542022. View Article : Google Scholar : PubMed/NCBI
|
|
55
|
Klionsky DJ, Abdel-Aziz AK, Abdelfatah S,
Abdellatif M, Abdoli A, Abel S, Abeliovich H, Abildgaard MH, Abudu
YP, Acevedo-Arozena A, et al: Guidelines for the use and
interpretation of assays for monitoring autophagy (4th
edition)1. Autophagy. 17:1–382. 2021. View Article : Google Scholar : PubMed/NCBI
|
|
56
|
Bertolin G, Ferrando-Miguel R, Jacoupy M,
Traver S, Grenier K, Greene AW, Dauphin A, Waharte F, Bayot A,
Salamero J, et al: The TOMM machinery is a molecular switch in
PINK1 and PARK2/PARKIN-dependent mitochondrial clearance.
Autophagy. 9:1801–1817. 2013. View Article : Google Scholar : PubMed/NCBI
|
|
57
|
Requejo-Aguilar R, Lopez-Fabuel I,
Fernandez E, Martins LM, Almeida A and Bolaños JP: PINK1 deficiency
sustains cell proliferation by reprogramming glucose metabolism
through HIF1. Nat Commun. 5:45142014. View Article : Google Scholar : PubMed/NCBI
|
|
58
|
Fahad Ullah M: Breast cancer: Current
perspectives on the disease status. Adv Exp Med Biol. 1152:51–64.
2019. View Article : Google Scholar : PubMed/NCBI
|
|
59
|
Faubert B, Solmonson A and DeBerardinis
RJ: Metabolic reprogramming and cancer progression. Science.
368:eaaw54732020. View Article : Google Scholar : PubMed/NCBI
|
|
60
|
Lin HY and Chu PY: Advances in
understanding mitochondrial MicroRNAs (mitomiRs) on the
pathogenesis of triple-negative breast cancer (TNBC). Oxid Med Cell
Longev. 2021:55177772021. View Article : Google Scholar : PubMed/NCBI
|
|
61
|
Chu CT: A pivotal role for PINK1 and
autophagy in mitochondrial quality control: Implications for
Parkinson disease. Hum Mol Genet. 19:R28–R37. 2010. View Article : Google Scholar : PubMed/NCBI
|
|
62
|
Chang G, Zhang W, Ma Y and Wen Q: PINK1
expression is associated with poor prognosis in lung
adenocarcinoma. Tohoku J Exp Med. 245:115–121. 2018. View Article : Google Scholar : PubMed/NCBI
|
|
63
|
Alizadeh J, Kavoosi M, Singh N, Lorzadeh
S, Ravandi A, Kidane B, Ahmed N, Mraiche F, Mowat MR and Ghavami S:
Regulation of autophagy via carbohydrate and lipid metabolism in
cancer. Cancers (Basel). 15:21952023. View Article : Google Scholar : PubMed/NCBI
|
|
64
|
Rojas-Pirela M, Andrade-Alviárez D, Rojas
V, Kemmerling U, Cáceres AJ, Michels PA, Concepción JL and Quiñones
W: Phosphoglycerate kinase: Structural aspects and functions, with
special emphasis on the enzyme from Kinetoplastea. Open Biol.
10:2003022020. View Article : Google Scholar : PubMed/NCBI
|
|
65
|
Brito-Arias M: Enzymes involved in
glycolysis, fatty acid and amino acid biosynthesis: Active site
mechanism and inhibition. Bentham Science Publishers; 2020,
View Article : Google Scholar
|
|
66
|
Yin K, Lee J, Liu Z, Kim H, Martin DR, Wu
D, Liu M and Xue X: Mitophagy protein PINK1 suppresses colon tumor
growth by metabolic reprogramming via p53 activation and reducing
acetyl-CoA production. Cell Death Differ. 28:2421–2435. 2021.
View Article : Google Scholar : PubMed/NCBI
|
|
67
|
Icard P, Wu Z, Fournel L, Coquerel A,
Lincet H and Alifano M: ATP citrate lyase: A central metabolic
enzyme in cancer. Cancer Lett. 471:125–134. 2020. View Article : Google Scholar : PubMed/NCBI
|
|
68
|
Kierans SJ and Taylor CT: Regulation of
glycolysis by the hypoxia-inducible factor (HIF): Implications for
cellular physiology. J Physiol. 599:23–37. 2021. View Article : Google Scholar : PubMed/NCBI
|
|
69
|
Kung-Chun Chiu D, Pui-Wah Tse A, Law CT,
Ming-Jing Xu I, Lee D, Chen M, Kit-Ho Lai R, Wai-Hin Yuen V,
Wing-Sum Cheu J, Wai-Hung Ho D, et al: Hypoxia regulates the
mitochondrial activity of hepatocellular carcinoma cells through
HIF/HEY1/PINK1 pathway. Cell Death Dis. 10:9342019. View Article : Google Scholar : PubMed/NCBI
|
|
70
|
Maddocks OD and Vousden KH: Metabolic
regulation by p53. J Mol Med (Berl). 89:237–245. 2011. View Article : Google Scholar : PubMed/NCBI
|
|
71
|
Chen Y, Anwar M, Wang X, Zhang B and Ma B:
Integrative transcriptomic and single-cell analysis reveals IL27RA
as a key immune regulator and therapeutic indicator in breast
cancer. Discov Oncol. 16:9772025. View Article : Google Scholar : PubMed/NCBI
|
|
72
|
Li B, Lin R, Hua Y, Ma B and Chen Y:
Single-cell RNA sequencing reveals TMEM71 as an immunomodulatory
biomarker predicting immune checkpoint blockade response in breast
cancer. Discov Oncol. 16:12562025. View Article : Google Scholar : PubMed/NCBI
|
|
73
|
Li K, Chen Y, Zhang Z, Wang K, Sulayman S,
Zeng X, Ababaike S, Guan J and Zhao Z: Preoperative
pan-immuno-inflammatory values and albumin-to-globulin ratio
predict the prognosis of stage I–III colorectal cancer. Sci Rep.
15:115172025. View Article : Google Scholar : PubMed/NCBI
|
|
74
|
Zeng X, Wu Z, Pan Y, Ma Y, Chen Y and Zhao
Z: Effects of micronutrients and macronutrients on risk of allergic
disease in the European population: A Mendelian randomization
study. Food Agric Immunol. 35:24423692024. View Article : Google Scholar
|