Introduction
Esophageal cancer (EC) is a highly aggressive
malignancy with a poor prognosis and represents a major cause of
cancer-related mortality worldwide (1). Its incidence varies markedly across
geographic regions, and EC is histologically classified into two
major subtypes: Esophageal squamous cell carcinoma (ESCC) and
esophageal adenocarcinoma (2,3). In
Asia, more than 90% of EC cases are those of ESCC (4). China has a high incidence of ESCC.
Based on 2022 statistics, EC is the fifth leading cause of
cancer-related mortality in China and accounts for ~187,500 deaths
annually (5). Despite advances in
surgical resection, chemotherapy and immunotherapy, the 5-year
overall survival (OS) rate among patients with ESCC remains below
30%, largely because of early lymph-node metastasis, distant
invasion, and the lack of effective prognostic biomarkers and
therapeutic targets (6,7). This poor outcome is also attributable
to the absence of specific early symptoms during the early stages
of the disease, as only ~20% of patients are diagnosed at an early
stage. However, the 5-year survival rate can reach 85% among
patients diagnosed at an early stage (8). Therefore, elucidating the molecular
mechanisms underlying ESCC initiation and progression and
identifying novel tumor suppressors or oncogenes with clinical
translational potential are essential for improving the diagnosis
and treatment of ESCC (9).
Sphingosine-1-phosphate phosphatase 1 (SGPP1) is a
membrane-associated phosphatase involved in sphingolipid metabolism
and is known to catalyze the dephosphorylation of
sphingosine-1-phosphate to sphingosine (10), which involves multiple biological
processes (BPs), including cell proliferation, apoptosis, migration
and invasion (11,12). Numerous studies have demonstrated
that SGPP1 acts as a tumor suppressor in several malignancies,
including breast cancer (BC) (13,14),
gastric cancer (GC) (10) and
prostate cancer (PC) (15). In BC,
higher SGPP1 expression is a favorable prognostic indicator of
survival outcomes in patients receiving systemic treatment,
particularly those with triple-negative BC (14). In GC, positive SGPP1 expression is
significantly associated with longer OS and progression-free
survival and serves as an independent prognostic factor (10). In PC, SGPP1 deficiency results in
smaller necrotic areas in subcutaneous xenografts following
radiotherapy, a higher Ki-67-positive rate, and increased
microvascular density, indicating that reduced SGPP1 expression can
raise promote tumor angiogenesis and radioresistance. However,
SGPP1 can exert oncogenic effects in other cancer types, such as
colorectal cancer (16) and glioma
(17), indicating that its function
is highly tissue- and cancer-type specific. The expression pattern,
biological function and underlying molecular mechanisms of SGPP1 in
ESCC remain largely unknown, representing an important lacuna in
molecular research on ESCC.
The present study investigated the expression and
function of SGPP1 in ESCC. It assessed its tumor-suppressive role
and examines the underlying molecular mechanisms. The findings
provide new mechanistic insights into the role of SGPP1 in ESCC and
its potential clinical applications.
Materials and methods
Cell culture and transient
transfection
The ESCC cell lines TE13 and KYSE30 were kindly
provided by the laboratory of Professor Gao Xianshu at Peking
University First Hospital. The ECA109 and KYSE150 cell lines were
purchased from Shanghai Saibai Kang Biotechnology Co., Ltd. and
Zhong Qiao Xin Zhou Biotechnology Co., Ltd., respectively. ECA109
and KYSE150 cells were authenticated by short tandem repeat (STR)
analysis before experimental use. The cells were cultured in
RPMI-1640 medium supplemented with 10% fetal bovine serum, 100
µg/ml streptomycin, and 100 U/ml penicillin and incubated at 37°C
in a humidified incubator containing 5% CO2. The
SGPP1-overexpression plasmid and its corresponding control plasmid
were obtained from General Biosystems, whereas small interfering
RNA (siRNA) targeting SGPP1 (siSGPP1) and the corresponding
negative control (siNC) were obtained from Guangzhou RiboBio Co.,
Ltd. Transient transfection was performed using Lipofectamine 3000
(Thermo Fisher Scientific, Inc.) according to the manufacturer's
instructions. Briefly, 2.5 µg of nucleic acid was used for
transfection; the transfection mixture was removed and fresh
culture medium was replaced at 6 h post-transfection. Total RNA was
harvested at 24 h post-transfection, and total protein was
extracted at 48 h post-transfection for subsequent assays. The
target sequence of siSGPP1 was 5′-GAACTTCCTTATCGGTATA-3′. The siNC
(cat. no. siN0000001; Guangzhou RiboBio Co., Ltd.) was a
commercially available non-targeting control siRNA, and its exact
nucleotide sequence is proprietary and was not disclosed by the
manufacturer.
RNA extraction and reverse
transcription-quantitative polymerase chain reaction (RT-qPCR)
Total RNA was extracted from the ESCC cells using
TRIzol Universal Reagent (Tiangen Biotech Co., Ltd.) based on the
manufacturer's instructions. Complementary DNA was synthesized
using Oligo(dT)18 Primer (Thermo Fisher Scientific,
Inc.) with Moloney Murine Leukemia Virus (M-MLV) reverse
transcriptase, 5X reaction buffer, dNTP mixture, and RNase
inhibitor. The reverse transcription protocol was: 65°C for 5 min,
followed by 42°C for 60 min, 70°C for 5 min, and then held at 4°C.
qPCR was performed in triplicate using PowerUp™
SYBR™ Green Master Mix (Thermo Fisher Scientific, Inc.)
with a CFX Connect real-time system (Bio-Rad Laboratories, Inc.).
The qPCR thermocycling conditions were: initial denaturation at
95°C for 10 min; 40 cycles of denaturation at 95°C for 10 sec,
annealing at 60°C for 20 sec, extension at 72°C for 15 sec;
followed by melting curve analysis (95°C for 30 sec, 25°C for 30
sec). The primer sequences used in the present study are provided
in Table SI. GAPDH was used as the
endogenous control. Relative gene expression, normalized to GAPDH,
was calculated using the 2−ΔΔCq method (18), where ΔCt=Ct target
gene-Ct GAPDH and ΔΔCt=ΔCt experimental
group-ΔCt control group.
Western blotting
The cells were lysed in RIPA buffer (Beyotime
Institute of Biotechnology) supplemented with protein phosphatase
inhibitor (Beijing Solarbio Science & Technology Co., Ltd.).
Protein concentration was determined using the BCA method with
bovine serum albumin as the standard. Equal amounts of protein (20
µg) were separated by 10% SDS-PAGE and transferred onto Immobilon-P
membranes (MilliporeSigma). After blocking with 5% skim milk in
Tris-buffered saline containing 0.1% Tween-20 (TBST) for 1 h at
room temperature, the membranes were incubated overnight at 4°C
with primary antibodies against SGPP1 (1:200; cat. no. ab129253;
Abcam), UGT1A9 (1:1,000; cat. no. YP-Ab-07897; http://www.upingbio.com/), UGT2B28 (1:1,000; cat. no.
P32315; ProMab Biotechnologies, Inc.) and GAPDH (1:10,000; cat. no.
10494-1-AP; Proteintech Group, Inc.). The membranes were then
washed three times with TBST for 10 min per wash and incubated with
the appropriate secondary antibodies [HRP-conjugated Goat
Anti-Rabbit IgG (H+L); 1:8,000; cat. no. SA00001-2; Proteintech
Group, Inc.] for 1 h at room temperature. Protein bands were
visualized using an enhanced chemiluminescence substrate kit
(Biosharp Life Sciences) and an ECL detection system (Bio-Rad
Laboratories, Inc.). Protein levels were normalized exclusively to
the corresponding loading control on the same membrane. GAPDH
optical-density values were quantified in each independent western
blot experiment to evaluate the stability of GAPDH as a reference
gene under fluctuating SGPP1 expression (Table SII).
Colony formation assay
Cell proliferation was evaluated using a colony
formation assay. The cells were counted, seeded into 6-well plates
at a density of 50 cells per well, and incubated at 37°C incubator
for 14 days without disturbance. Following fixation with methanol
and staining with 0.1% crystal violet, colonies containing at least
50 cells were counted under a light microscope.
Cell Counting Kit-8 (CCK-8) assay
Cell proliferation was evaluated using the CCK-8
assay (MedChemExpress). A total of 3×10³ cells per well
were seeded into 96-well plates in triplicate, and 10 µl of CCK-8
solution was added to each well at seven designated time points.
Following incubation for 1.5 h incubation at 37°C, absorbance at
450 nm was measured using an Infinite M200 Pro NanoQuant instrument
(Tecan Group, Ltd.). Cell viability was calculated using the
following formula: OD of the experimental group/OD of the control
group ×100%.
5-Ethynyl-2′-deoxyuridine (EdU)
incorporation assay
EdU incorporation was assessed using a Cell-Light
EdU DNA Cell Proliferation Kit (Guangzhou RiboBio Co., Ltd.) based
on the manufacturer's instructions. Briefly, the treated cells were
seeded into 24-well plates at a density of 2×10⁴ cells per well and
cultured for 48 h. The cells were then stained for EdU
incorporation at 37°C for 2 h based on the manufacturer's protocol.
Fluorescence images were acquired using an inverted fluorescence
microscope, and the percentage of EdU-positive cells was quantified
as an indicator of cell proliferation.
Terminal deoxynucleotidyl transferase
dUTP nick-end labeling (TUNEL) assay
The treated cells were seeded into 48-well plates at
a density of 1×10⁴ cells per well and incubated for 24 h. Apoptosis
was assessed using a TUNEL apoptosis detection kit (Nanjing KeyGen
Biotech Co., Ltd.) based on the manufacturer's instructions. The
nuclei were counterstained with DAPI (0.001 mg/ml, blue), whereas
apoptotic cells were identified based on green fluorescence. Images
were acquired using an inverted fluorescence microscope.
Transwell migration and invasion
assay
Transwell chambers with 8-µm pores (Corning, Inc.)
were utilized to perform migration and invasion assays. Before the
assays, the cells were serum-starved in FBS-free RPMI-1640 medium
for 24 h. For the invasion assays, the upper chambers were
precoated with Matrigel (BD Biosciences) and incubated at 37°C for
6 h, whereas this step was omitted for migration assays. After the
Matrigel had solidified, 2×10⁴ cells for the migration assays or
4×10⁴ cells for the invasion assays were suspended in 150 µl of
serum-free medium and seeded into the upper chambers. The lower
chambers were filled with 600 µl of medium containing 10% FBS as a
chemoattractant. After 48 h, the cells remaining on the upper
surface of the membrane were removed using a cotton swab, and the
migratory or invasive cells were stained with crystal violet
(Beijing Solarbio Science & Technology Co., Ltd.). The cells
were counted in three randomly selected fields per well, and the
mean number of cells per field was calculated.
Monolayer cell migration scratch
assay
Cells were seeded in 6-well plates and cultured to
80–90% confluence. A uniform scratch wound was generated across the
cell monolayer using a sterile pipette tip. After the cells were
washed with PBS, the culture medium was replaced with serum-free
medium. Images of three randomly selected fields per well were
acquired at 0, 12 and 24 h. Wound closure was quantified using
ImageJ software (v2.9.0; National Institutes of Health).
Bioinformatics analysis of The Cancer
Genome Atlas (TCGA)-ESCC RNA-sequencing (RNA-seq) data
Based on data obtained from TCGA database
(https://portal.gdc.cancer.gov/), the
RNA-seq data for esophageal carcinoma (ESCA) and the corresponding
clinicopathological information were acquired. ESCC samples were
selected based on histological type. Only samples classified as
squamous cell carcinoma in the clinical information were retained,
whereas samples without corresponding clinical information were
excluded. A total of 82 ESCC samples were ultimately included in
differentially expressed gene (DEG) analysis, SGPP1 correlation
analysis, and the Pearson correlation analyses. All subsequent
bioinformatics analyses and statistical evaluations were performed
using R software (version 4.2.1; http://www.r-project.org/). The samples were
stratified into subgroups using the median SGPP1 expression level
as the cutoff value. Differential expression analysis was
subsequently performed using DESeq2 version 1.36.0 with the
filtering criteria of |log2 fold change (FC)|>1, P<0.05 and
adjusted P<0.05. This analysis identified 271 upregulated DEGs
(up-DEGs) and 435 downregulated DEGs (down-DEGs). In addition, gene
correlation analysis was performed using Pearson correlation
analysis in R version 4.2.1, and P values were adjusted using the
Benjamini-Hochberg method. The threshold for the correlation
coefficient was set at |Cor|>0.3, resulting in the
identification of 516 genes positively correlated with SGPP1
expression and 569 genes negatively correlated with SGPP1
expression.
For functional annotation of the candidate genes,
the intersection between up-DEGs and SGPP1-positively correlated
genes and the intersection between down-DEGs and SGPP1-negatively
correlated genes, were separately subjected to Gene Ontology (GO)
functional enrichment analysis and Kyoto Encyclopedia of Genes and
Genomes (KEGG) pathway enrichment analysis. In parallel, gene set
enrichment analysis (GSEA) based on the KEGG database was performed
for the ESCC dataset. Before GO/KEGG enrichment analysis, all input
gene lists underwent ID conversion, followed by enrichment analysis
using clusterProfiler version 4.4.4 (https://yulab-smu.top/clusterProfiler-book/). GOplot
version 1.0.2 (http://cran.r-project.org/web/packages/GOplot) was
utilized to calculate term z-scores from gene-level metrics to
indicate the overall trends in gene upregulation or downregulation
for each enriched entry, whereas ggplot2 version 3.4.4 was employed
to visualize all GO and KEGG enrichment results. GSEA was performed
using clusterProfiler version 4.4.4. Genes were annotated using
org.Hs.eg.db, and the analysis employed the KEGG gene set
c2.cp.kegg.v7.5.1.symbols.gmt imported through msigdbr. The results
were visualized using ggplot2 version 3.4.4. GSEA was performed
using clusterProfiler version 4.4.4 in R version 4.2.1. Genes were
ranked according to the log2FC between the SGPP1-high and SGPP1-low
groups. Gene identifiers were annotated using org.Hs.eg.db, and the
KEGG gene set c2.cp.kegg.v7.5.1.symbols.gmt, obtained through
msigdbr, was used as the reference gene-set collection. GSEA was
performed with 1,000 permutations, with the minimum and maximum
gene-set sizes set to 15 and 500, respectively. Pathways with a
nominal P<0.05, FDR q-value <0.25, and |NES|>1.5 were
considered significant. GSEA results were visualized using ggplot2
version 3.4.4 (https://ggplot2.tidyverse.org/).
Core signaling pathways were ultimately identified
by intersecting the pathways enriched in the KEGG analysis of the
intersecting gene sets with those identified through GSEA-KEGG
analysis. This approach facilitated the identification of molecular
pathways potentially underlying the effects of SGPP1 on ESCC cell
behavior.
Immunohistochemical (IHC) validation
of SGPP1 protein expression
After baking at 65°C for 4 h, ESCC tissue sections
were deparaffinized in xylene (3×10 min) and rehydrated through a
graded ethanol series (100, 95, 85, and 75%; 8 min per step).
Antigen retrieval was performed out in 1X EDTA buffer in a 95°C
water bath for 1 h, and endogenous peroxidase activity was blocked
using 3% H2O2 for 30 min at room temperature.
The sections were incubated overnight at 4°C with an anti-SGPP1
primary antibody (1:50), followed by incubation with an
HRP-conjugated goat anti-mouse/rabbit IgG polymer detection system
(ready-to-use; cat. no. PV-9000; OriGene Technologies, Inc.) for 1
h at 37°C. DAB development was monitored microscopically and
terminated after 1 min. The slides were counterstained with
hematoxylin, dehydrated through a graded ethanol series, cleared,
and cover-slipped using a neutral mounting medium. Staining
intensity was quantified using ImageJ. IHC staining was
semi-quantitatively scored based on staining intensity and the
percentage of positive cells. Staining intensity was classified as
absent, pale yellow, brownish yellow, or dark brown and assigned
scores of 0, 1, 2, and 3, respectively. The percentage of
positively stained cells was scored as follows: 0%=0, 5–25%=1,
26–50%=2, 51–75%=3, and >75%=4. The final score was calculated
as the sum of the staining intensity score and the percentage
score. A summed score <6 was employed to define the
low-expression group, whereas a score ≥6 was utilized to define the
high-expression group. For each section, three randomly selected
fields were examined at ×400 magnification; staining intensity and
the percentage of positive cells were scored in each field, and the
mean score was calculated. Two pathologists independently evaluated
the IHC staining in a double-blind manner.
Patients and samples
This single-center, retrospective, tissue-based
cohort study included patients with primary ESCC identified through
the pathology archive and clinical follow-up system of the Second
Hospital of Hebei Medical University between January 2010 and
December 2024. The inclusion criteria were as follows: i)
pathologically confirmed primary ESCC; ii) a Karnofsky Performance
Status (KPS) score>70; iii) receipt of radical radiotherapy at a
total dose (DT) ≥50 Gy; iv) availability of sufficient
formalin-fixed, paraffin-embedded tumor tissue for SGPP1 IHC; v)
complete clinicopathological, treatment, and OS follow-up data; and
vi) ethical approval and informed consent. The exclusion criteria
were as follows: i) non-squamous or mixed histology; ii) a history
of another malignancy; iii) insufficient tissue or non-evaluable
IHC staining; and iv) missing key clinical variables or follow-up
information. A total of 68 patients were included in the study,
including 39 males and 29 females, with a median age of 69 years
(range, 24–87 years). A detailed patient enrollment flowchart has
been provided (Fig. S1). Tissue
specimens were fixed in 4% formalin at room temperature for 24–48 h
and embedded in paraffin. Samples were obtained with patient
consent under approval from the Ethics Committee of The Second
Hospital of Hebei Medical University (approval no. 2024-R393;
Shijiazhuang, China). OS was defined as the interval from the date
of pathological diagnosis to death or the last confirmed follow-up.
Patients who remained alive at the follow-up cutoff date were
censored at their last confirmed follow-up date.
Statistical analysis
All experiments were conducted at least three times.
Data are presented as the mean ± SD. Statistical analyses were
performed using GraphPad Prism 8.0 software (Dotmatics). Paired or
unpaired Student's t-tests and one-way or two-way analyses of
variance (ANOVA) followed by Bonferroni's post hoc test were
applied as appropriate. Survival curves were generated using the
Kaplan-Meier method and compared using a two-sided log-rank test.
Cox proportional hazards regression models were used for univariate
and multivariate analyses. The proportional hazards assumption was
assessed and was satisfied. P<0.05 was considered to indicate a
statistically significant difference.
Results
Verification of SGPP1 knockdown and
overexpression efficiency
Western blotting and RT-qPCR analyses revealed
distinct SGPP1 expression patterns among the four EC cell lines
(TE13, KYSE150, ECA109 and KYSE30). SGPP1 mRNA expression was
significantly higher in ECA109 and KYSE30 cells than in TE13 and
KYSE150 cells (Fig. 1A). At the
protein level, SGPP1 expression was relatively high in ECA109 and
KYSE30 cells and comparatively low in TE13 and KYSE150 cells, with
KYSE150 cells exhibiting the lowest protein expression among the
four cell lines (Fig. 1B). Based on
these expression profiles, KYSE150 cells, which exhibited
relatively low endogenous SGPP1 expression, were utilized to
establish a stable SGPP1-overexpression model (OE), whereas ECA109
cells, which exhibited relatively high endogenous SGPP1 expression,
were used for transient SGPP1 knockdown with siRNA (siSGPP1).
RT-qPCR analysis confirmed that SGPP1 mRNA levels were
significantly increased in the OE group (P<0.0001 vs.
Vector/Blank) and significantly decreased in siSGPP1 cells
(P=0.001, vs. Blank; P=0.0023 vs. NC). No significant differences
were observed between the corresponding control groups (Fig. 1C and D). Western blotting and
densitometric analyses further confirmed significant upregulation
of SGPP1 protein in the OE group compared with the Blank (P=0.0345)
and Vector (P=0.0417) groups (Fig. 1E
and F), as well as significant downregulation in the siSGPP1
group compared with the NC group (P=0.0349; Fig. 1G and H). These results confirmed the
successful establishment of the SGPP1-OE model in KYSE150 cells and
efficient SGPP1 knockdown in ECA109 cells.
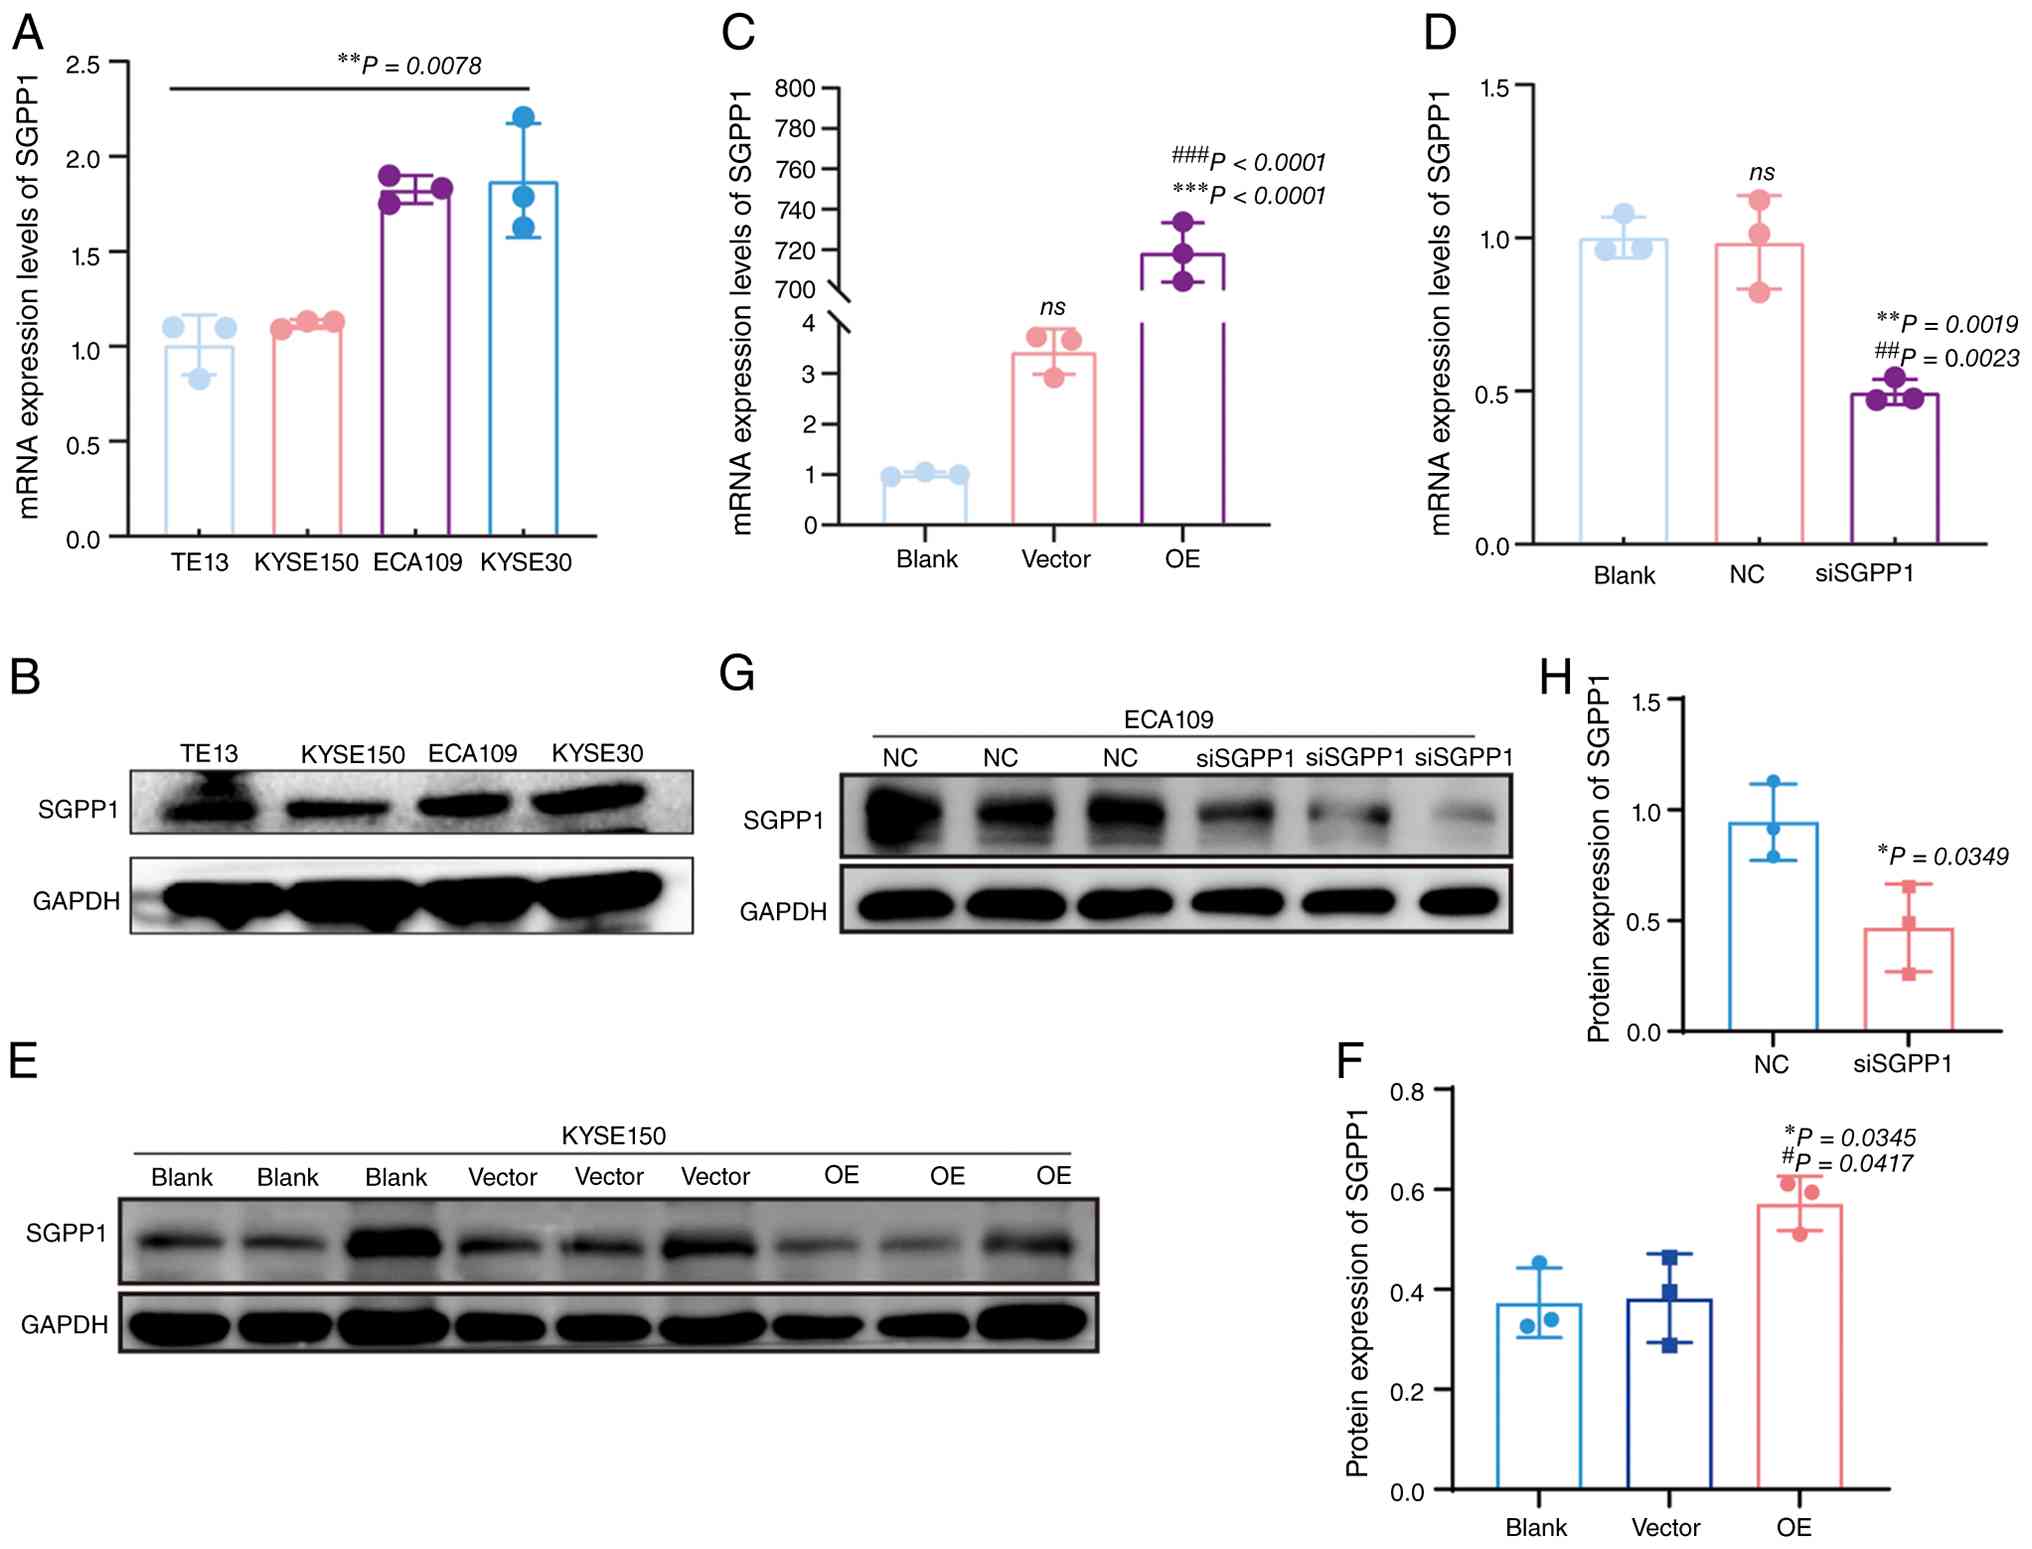 | Figure 1.Verification of SGPP1 knockdown and
overexpression efficiency. (A and B) SGPP1 expression in four
esophageal cancer cell lines (TE13, KYSE150, ECA109 and KYSE30) was
assessed by (A) RT-qPCR and (B) western blotting. (C and D) RT-qPCR
validation of (C) SGPP1 overexpression in KYSE150 cells (Blank,
Vector, and OE groups) and (D) SGPP1 knockdown in ECA109 cells
(Blank, NC, and siSGPP1 groups). (E and F) The results of (E)
western blots and (F) densitometric quantification of SGPP1 protein
expression in KYSE150 cells after SGPP1 overexpression. (G and H)
The results of (G) western blots and (H) densitometric
quantification of SGPP1 protein expression in ECA109 cells after
SGPP1 knockdown. SGPP1, sphingosine-1-phosphate phosphatase 1;
RT-qPCR, reverse transcription-quantitative PCR; si-, small
interfering; OE, overexpression; NC, negative control; ns, not
significant. |
Effects of SGPP1 on the proliferation
and apoptosis of EC cells
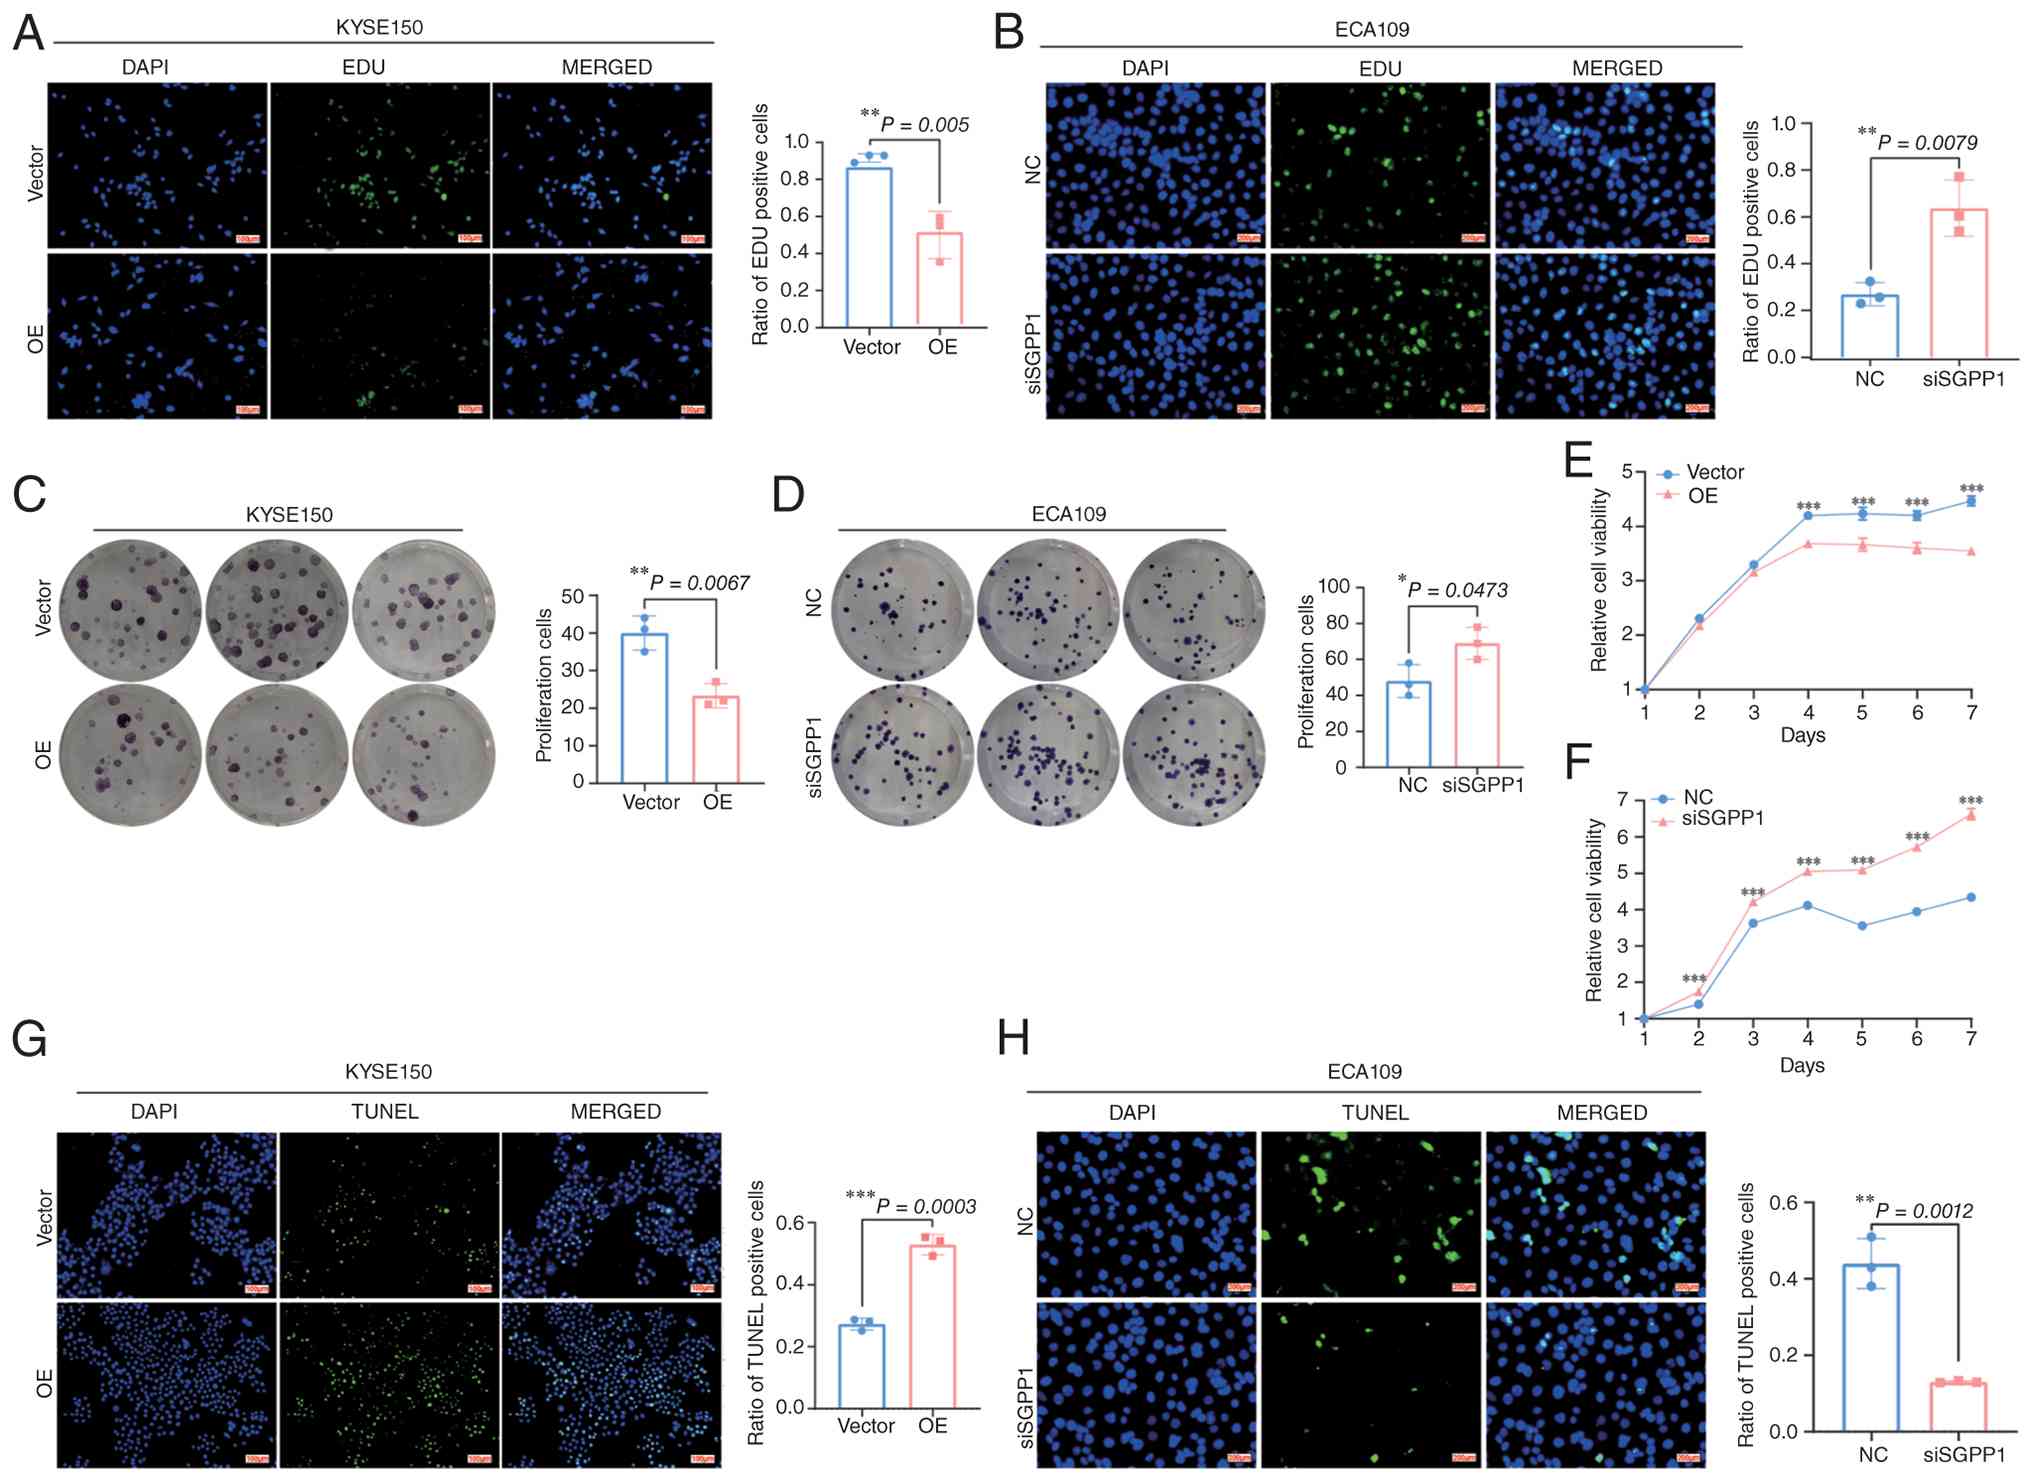
EdU immunofluorescence staining was performed to
evaluate ESCC cell proliferation. In KYSE150 cells, the percentage
of EdU-positive cells was significantly lower in the SGPP1-OE group
than in the Vector group (Fig. 2A,
P=0.005). By contrast, SGPP1 silencing in ECA109 cells
significantly increased the percentage of EdU-positive cells
compared with the NC group (Fig.
2B, P=0.0079). These results indicated that SGPP1
inhibited ESCC cell proliferation. Colony formation assays were
performed to evaluate long-term proliferative capacity of ESCC
cells. In KYSE150 cells, the OE group formed significantly fewer
colonies than the Vector group (Fig.
2C, P=0.0067). In ECA109 cells, SGPP1 knockdown significantly
increased colony formation compared with the NC group (Fig. 2D, P=0.0473). These findings further
demonstrated that SGPP1 suppressed the long-term proliferative
capacity of ESCC cells. CCK-8 assays were performed to monitor cell
viability over time. In KYSE150 cells, SGPP1 overexpression reduced
optical density values throughout the 7-day culture period. Cell
viability was slightly lower in the OE group than in the Vector
group on days 2 and 3, although these differences were not
statistically significant. From days 4 to 7, cell viability
remained significantly lower in the OE group (Fig. 2E, P<0.001). In ECA109 cells, cell
viability was significantly higher in the siSGPP1 group than in the
NC group from days 2 to 7 (Fig. 2F,
P<0.001). Collectively, these findings indicated that SGPP1
suppresses ESCC cell proliferation over time.
TUNEL staining was performed to assess apoptosis in
ESCC cells. In KYSE150 cells, the percentage of TUNEL-positive
apoptotic cells was significantly higher in the OE group than in
the Vector group (Fig. 2G,
P=0.0003). In ECA109 cells, the apoptotic rate was significantly
lower in the siSGPP1 group than in the NC group (Fig. 2H, P=0.0012). These results indicated
that SGPP1 increases apoptosis-associated DNA fragmentation in ESCC
cells.
Effects of SGPP1 on the migration and
invasion of EC cells
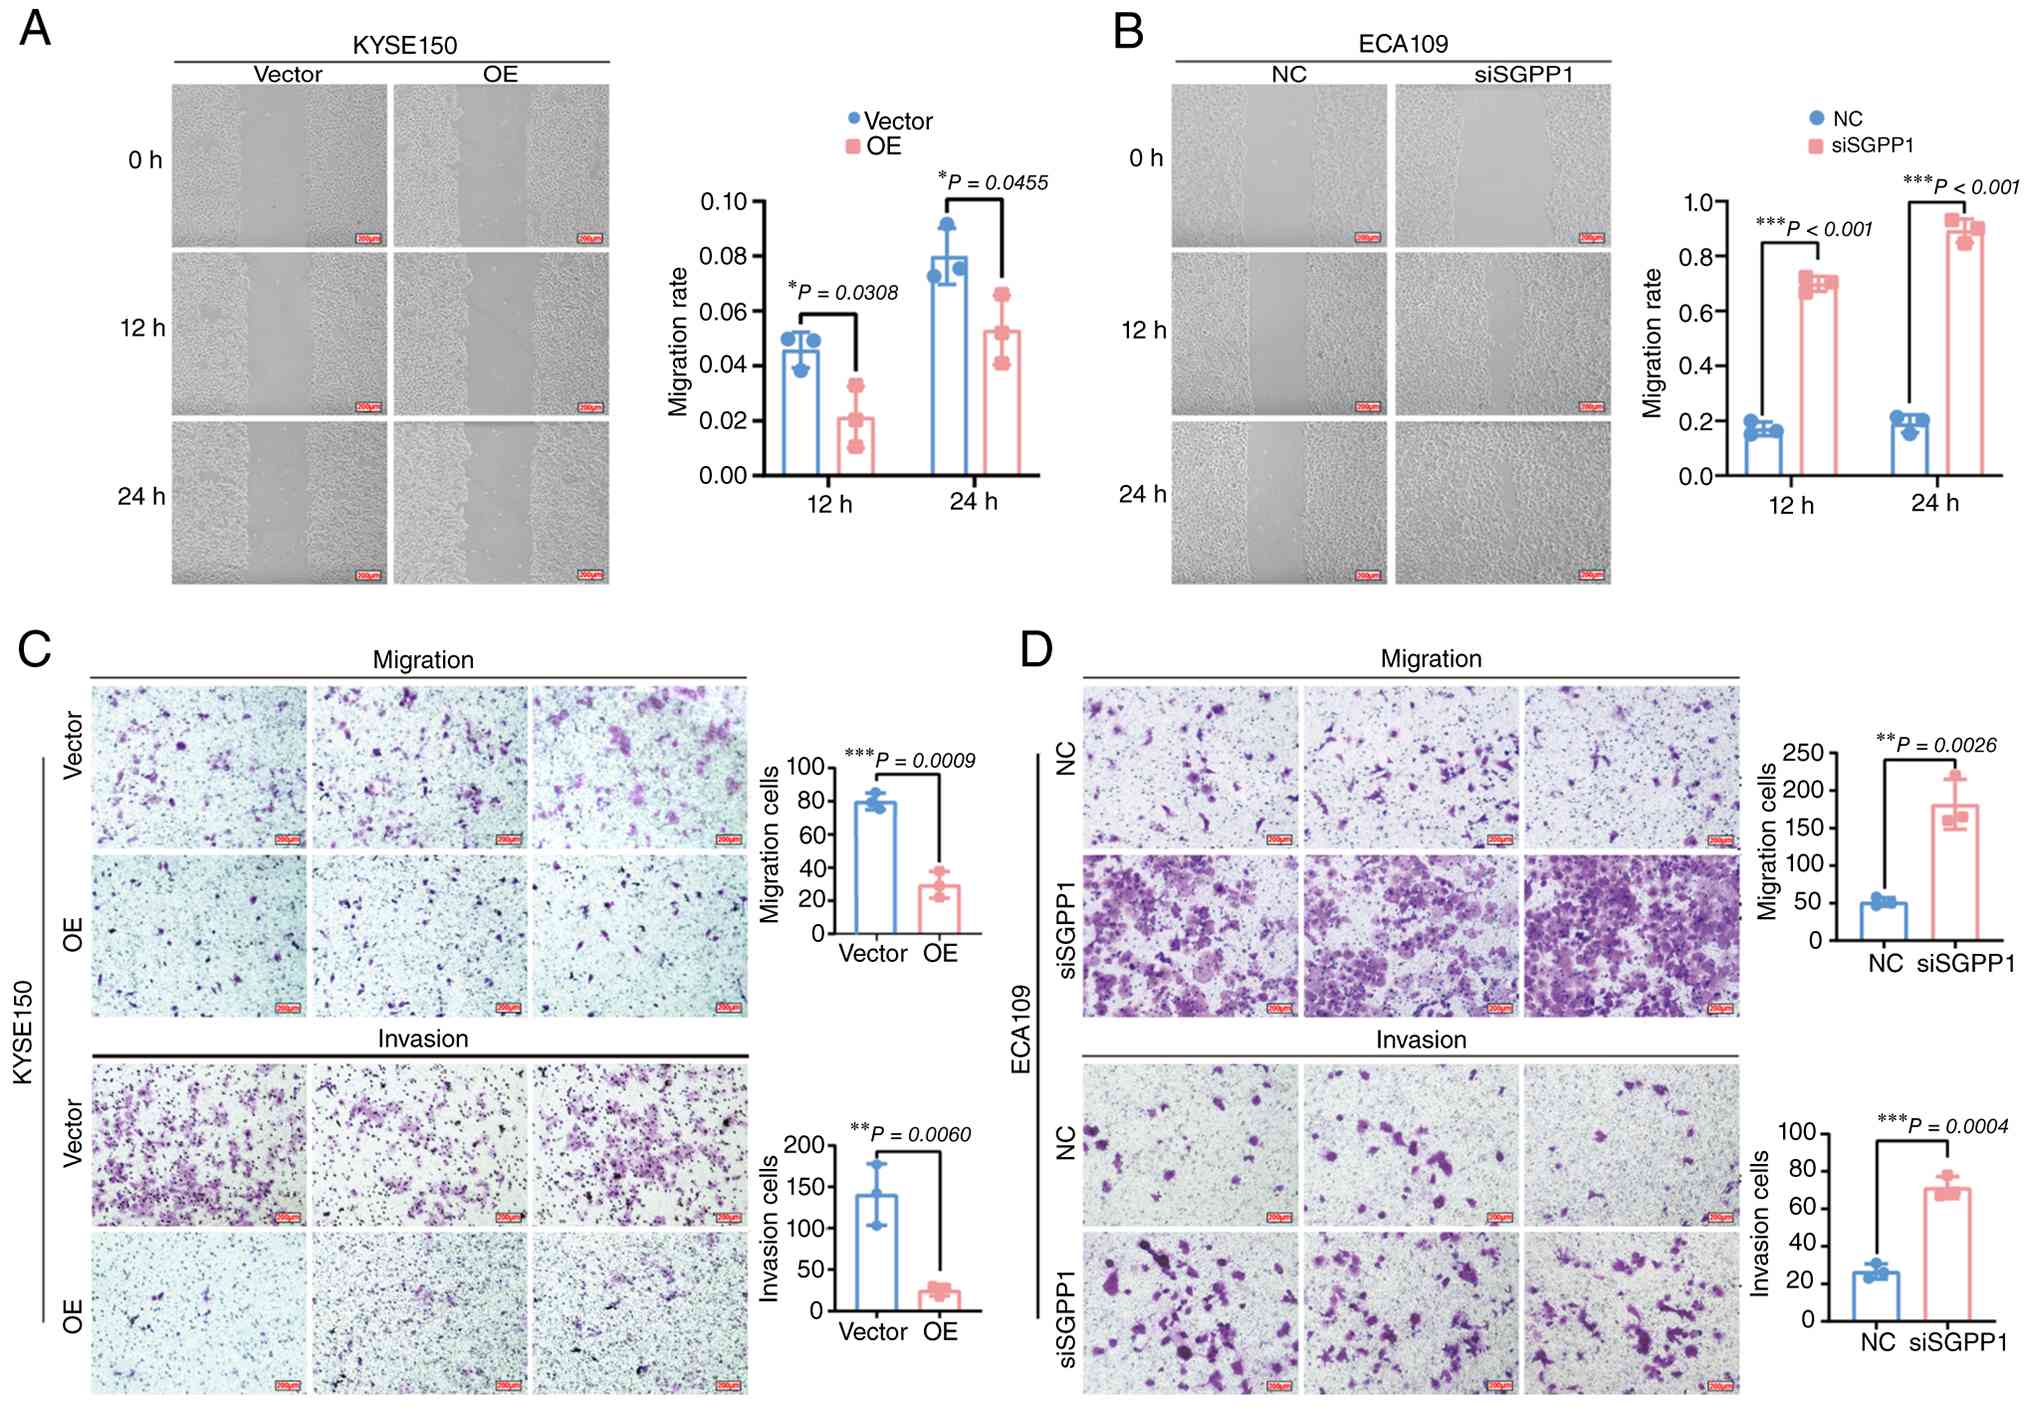
The effects of SGPP1 on ESCC cell migration and
invasion were evaluated in KYSE150 and ECA109 cells using
wound-healing and Transwell assays. In KYSE150 cells, the migration
rate in the OE group was significantly lower than that in the
Vector group at 12 h (P=0.0308) and 24 h (P=0.0455) in the
wound-healing assay, indicating that SGPP1 overexpression inhibited
cell migration (Fig. 3A). By
contrast, the wound-closure rate was significantly higher in the
siSGPP1 group than in the NC group at 12 and 24 h (P<0.001),
indicating that SGPP1 knockdown raised ECA109 cell migration
(Fig. 3B). Under the experimental
conditions, KYSE150 cells exhibited lower basal migratory activity
than ECA109 cells, resulting in a lower wound-closure rate over the
24 h observation period. Therefore, the apparent differences in
migration rates between KYSE150 and ECA109 cells primarily
reflected their intrinsic biological characteristics. Transwell
assays further showed that the numbers of migratory and invasive
KYSE150 cells were significantly lower in the OE group than that in
the Vector group (Fig. 3C;
migration, P=0.0009; invasion, P=0.0060). By contrast, the numbers
of migratory and invasive ECA109 cells were significantly higher in
the siSGPP1 group than in the NC group (Fig. 3D; migration, P=0.0026; invasion,
P=0.0004). These results indicated that SGPP1 can improve the
migration and invasion abilities of ECA109 cells. These findings
therefore indicated that SGPP1 negatively regulates the migratory
and invasive properties of ESCC cells.
Molecular regulatory mechanisms of
SGPP1 in EC
Using the ESCC subset of the TCGA-ESCA cohort
(n=82), a volcano plot was generated to identify significantly
upregulated (red), downregulated (blue) and non-significant (black)
DEGs based on the thresholds |log2FC|>1, P<0.05 and
adjusted P<0.05 (Fig. 4A).
Integration of the differential expression results with the
correlation analysis identified the core gene sets. The
intersection of up-DEGs and positively correlated genes
(Cor-positive) comprised 102 genes (Fig. 4B), whereas the intersection of
down-DEGs and negatively correlated genes (Cor-negative) comprised
122 genes (Fig. 4C). These gene
sets were separately subjected to GO functional enrichment
analysis. For the upregulated and downregulated gene sets, the top
five molecular function (MF) and BP terms were displayed; cellular
component terms were not presented because no meaningful enrichment
was identified. The upregulated intersecting genes were
significantly enriched in extracellular matrix (ECM)-related BPs,
including ECM organization, extracellular structure organization,
and external encapsulating structure organization. Enriched MFs
included signaling receptor activator activity,
metallo-endopeptidase activity, heparin binding, and cytokine
activity, whereas the enriched BPs also included positive
regulation of calcium ion transport into the cytosol. These
findings indicated that higher SGPP1 expression is associated with
ECM remodeling and cytokine-mediated signaling (Fig. 4D). The downregulated intersecting
genes were predominantly enriched in xenobiotic metabolism and
stimulus-response processes, including xenobiotic metabolic
process, cellular response to xenobiotic stimulus, and response to
xenobiotic stimulus. Enriched MFs included iron ion binding,
arachidonic acid monooxygenase activity, arachidonic acid
epoxygenase activity, neuropeptide receptor binding, and retinoic
acid 4-hydroxylase activity. Retinoid and olefinic compound
metabolic process were also enriched. These findings indicated that
higher SGPP1 expression is associated with the suppression of
pathways involved in xenobiotic detoxification and retinoid and
arachidonic acid metabolism (Fig.
4E).
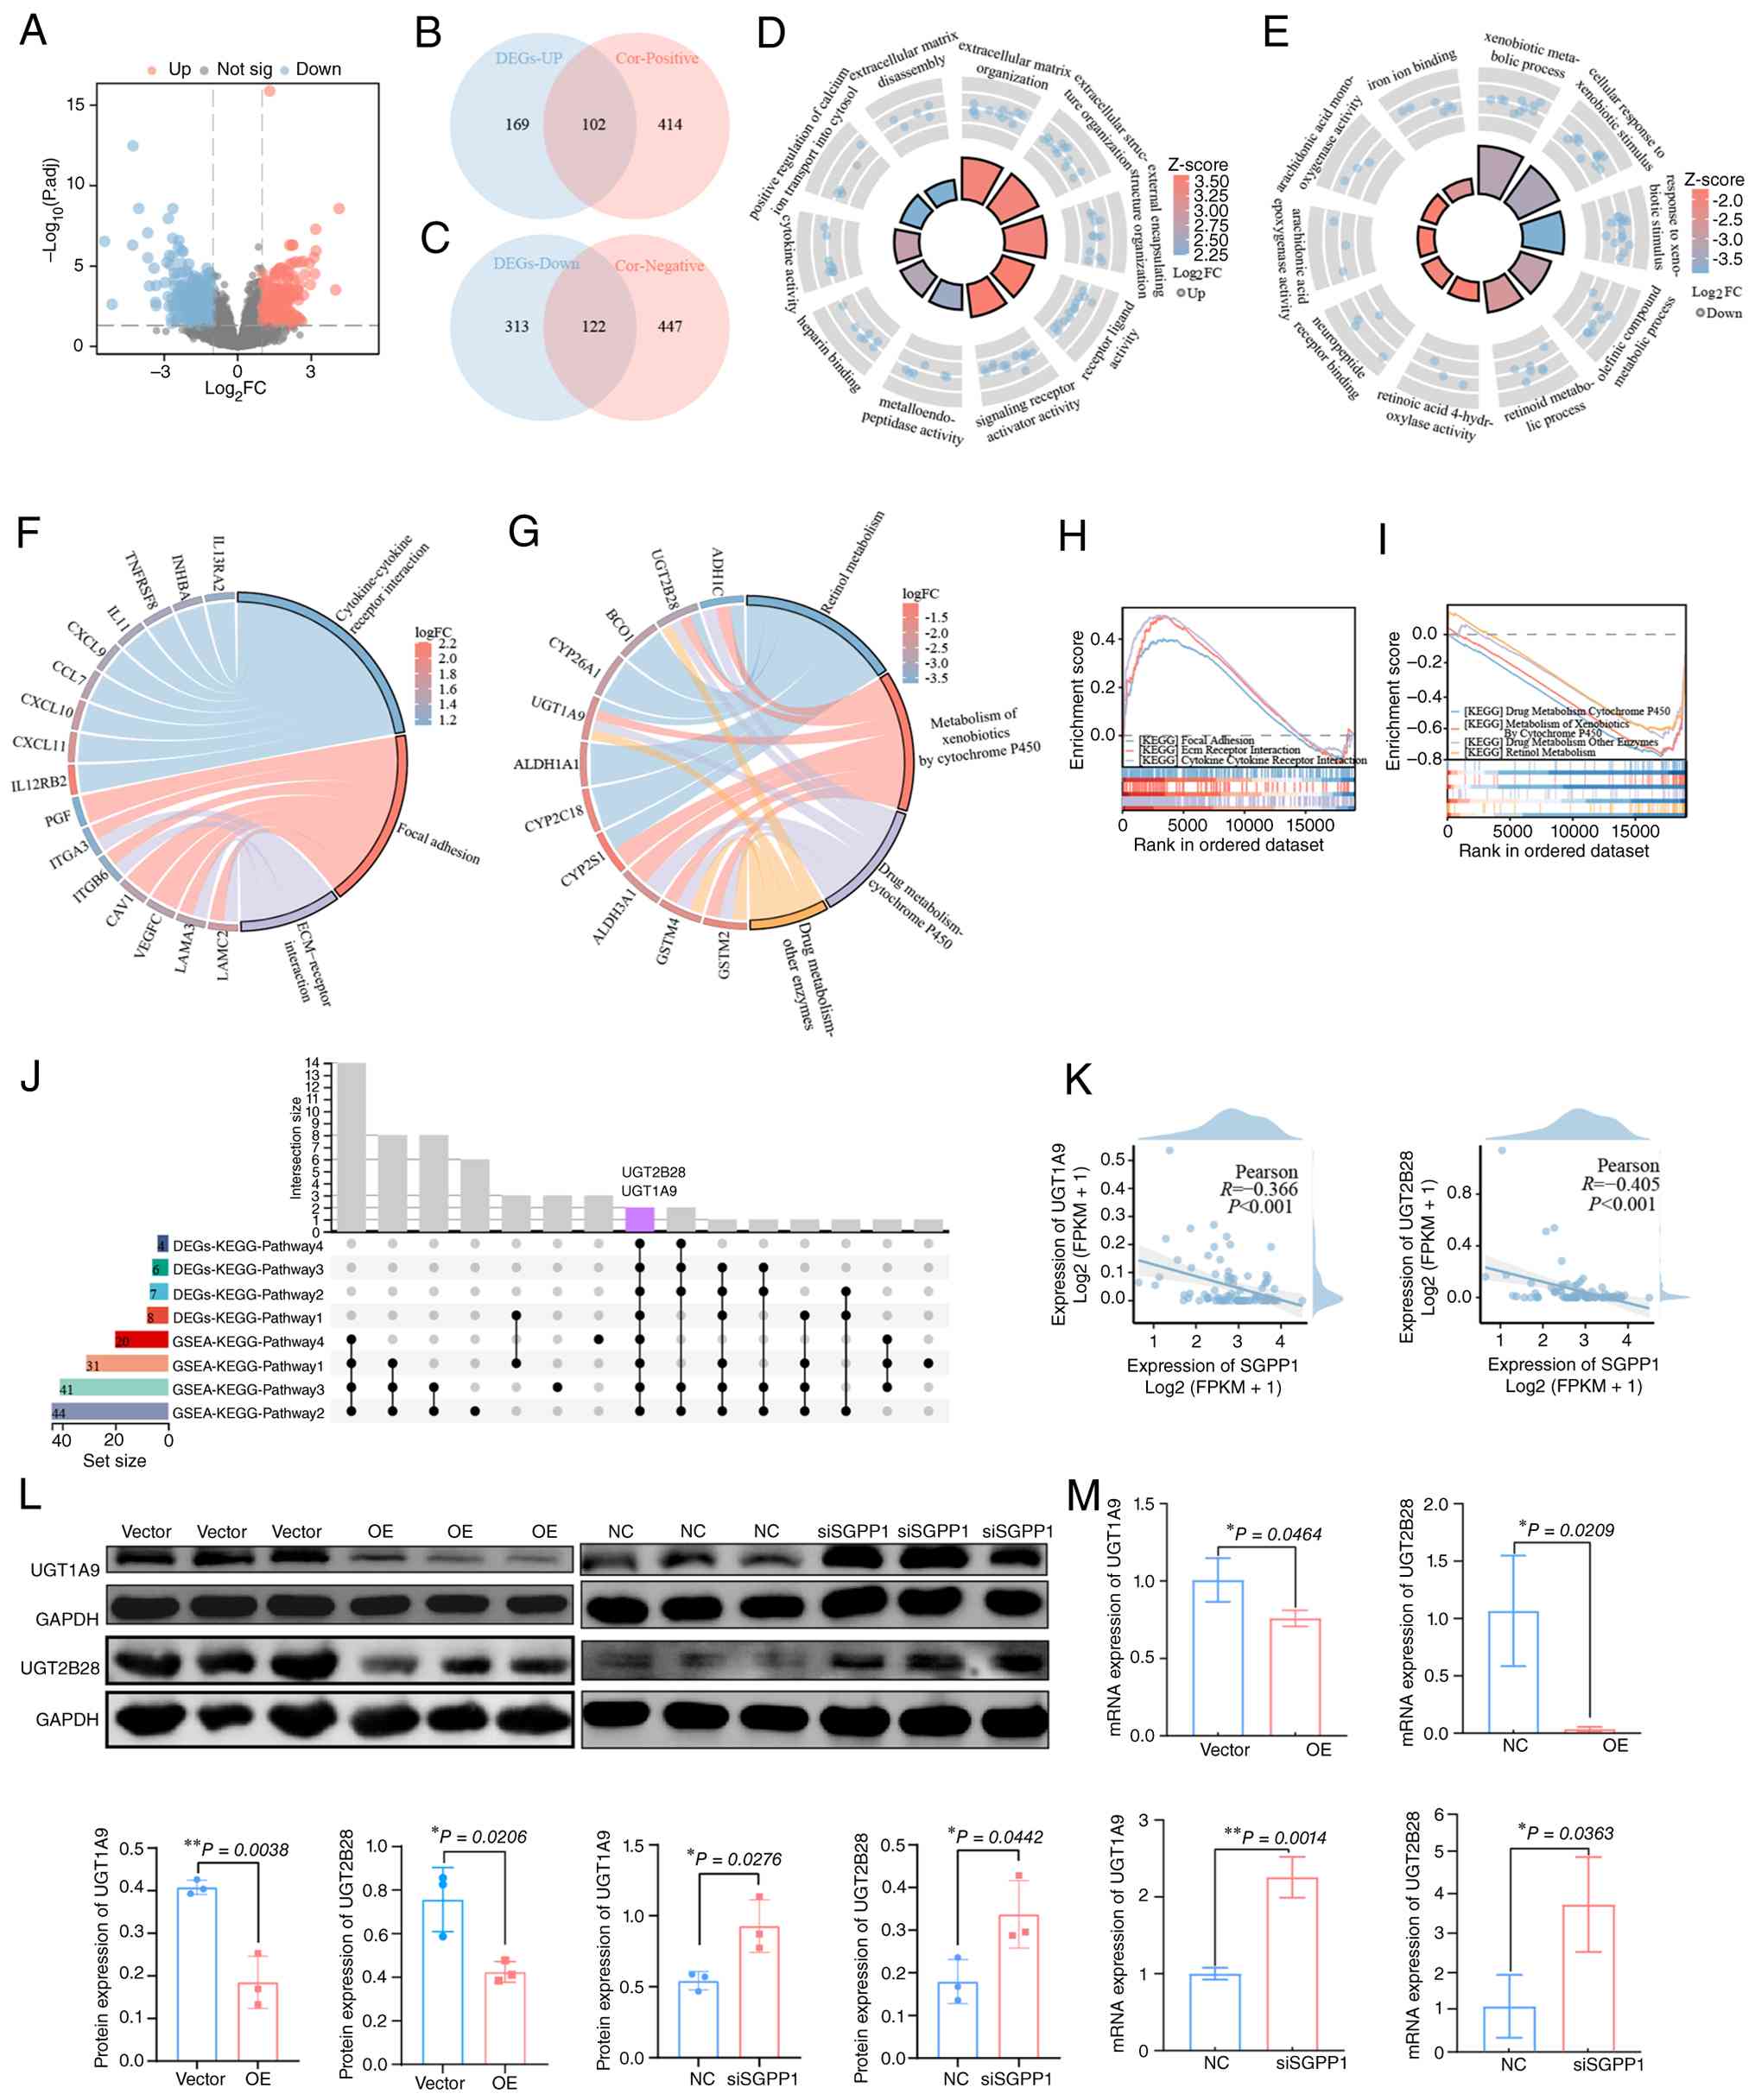 | Figure 4.Molecular regulatory mechanisms of
SGPP1 in esophageal cancer. (A) Volcano plot of DEGs identified
according to SGPP1 expression in TCGA-ESCC dataset; red, blue, and
gray dots represent significantly upregulated, downregulated and
non-significant genes, respectively. (B) Venn diagram showing the
intersection of upregulated DEGs and genes positively correlated
with SGPP1 in the TCGA-ESCC dataset. (C) Venn diagram showing the
intersection of downregulated DEGs and genes negatively correlated
with SGPP1 in the TCGA-ESCC dataset. (D and E) Gene Ontology
enrichment analyses of the (D) 102 upregulated intersecting genes
and (E) 122 downregulated intersecting genes. (F and G) KEGG
pathway enrichment analyses of the (F) 102 upregulated intersecting
genes and (G) 122 downregulated intersecting genes. (H and I)
Intersections of GSEA-KEGG results with the (H) up-DEGs-KEGG and
(I) down-DEGs-KEGG results. (J) UpSet plot showing genes shared
among 4 down-DEGs-KEGG pathways and 4 GSEA-KEGG pathways. (K)
Correlations of SGPP1 expression with UGT1A9 and UGT2B28 expression
in the TCGA-ESCC dataset. (L) Western blotting and quantitative
analyses of UGT1A9 and UGT2B28 protein expression in KYSE150 cells
after SGPP1 overexpression (Vector vs. OE) and in ECA109 cells
after SGPP1 knockdown (NC vs. siSGPP1). (M) Reverse
transcription-quantitative PCR analysis of UGT1A9 and UGT2B28 mRNA
expression in KYSE150 cells after SGPP1 overexpression and in
ECA109 cells after SGPP1 knockdown. SGPP1, sphingosine-1-phosphate
phosphatase 1; DEGs, differentially expressed genes; TCGA, The
Cancer Genome Atlas; ESCC, esophageal squamous cell carcinoma;
KEGG, Kyoto Encyclopedia of Genes and Genomes; GSEA, gene set
enrichment analysis; OE, overexpression; si-, small interfering;
NC, negative control; up-DEGs, upregulated DEGs; down-DEGs,
downregulated DEGs. |
KEGG enrichment analysis was performed separately
for the 102 upregulated and 122 downregulated intersecting genes
(Fig. 4F and G). GSEA was performed
to validate the pathways identified through KEGG enrichment
analysis (Fig. 4H and I). In the
upregulated direction, four significant DEG-KEGG pathways were
identified, three of which overlapped with the GSEA-KEGG results:
Focal adhesion, ECM-receptor interaction, and cytokine-cytokine
receptor interaction (Fig. 4H). In
the downregulated direction, five significant DEG-KEGG pathways
were identified, four of which overlapped with the GSEA-KEGG
results: Drug metabolism cytochrome P450, metabolism of xenobiotics
by cytochrome P450, drug metabolism-other enzymes and retinol
metabolism (Fig. 4I).
A gene-level intersection analysis was performed
using the KEGG enrichment results for the downregulated core DEGs
and the transcriptomic signatures obtained through GSEA, and the
results were visualized using an UpSet plot (Fig. 4J) to identify the core signaling
network regulated by SGPP1. The UpSet plot summarized the overlap
between the DEG-KEGG and GSEA-KEGG pathways and facilitated the
identification of genes consistently enriched across all
downregulated pathways. UGT1A9 and UGT2B28 were the only genes
present across all overlapping downregulated pathways and were
therefore prioritized for correlation analysis and mRNA- and
protein-level validation. Pearson correlation analysis of TCGA-ESCC
transcriptomic data (n=82) revealed modest inverse correlations
between SGPP1 and UGT1A9 (Pearson R=−0.366, R2=0.134,
P<0.001) and between SGPP1 and UGT2B28 (Pearson R=−0.405,
R2=0.164, P<0.001) (Fig.
4K). Western blotting and densitometric quantification analyses
(Fig. 4L) were performed to assess
the relationship between SGPP1 and UGT1A9/UGT2B28 in ESCC cell
lines. In KYSE150 cells, SGPP1 overexpression significantly
decreased UGT1A9 (P=0.0038) and UGT2B28 (P=0.0206) protein levels
relative to those in the Vector group. In ECA109 cells, SGPP1
knockdown significantly increased the protein levels of UGT1A9
(P=0.0276) and UGT2B28 (P=0.0442) compared with those in the NC
group. RT-qPCR analysis (Fig. 4M)
consistently demonstrated that SGPP1 overexpression significantly
reduced UGT1A9 and UGT2B28 mRNA expression in KYSE150 cells
(UGT1A9, P=0.0464; UGT2B28, P=0.0209), whereas SGPP1 knockdown
significantly increased their mRNA expression in ECA109 cells
(UGT1A9, P=0.0014; UGT2B28, P=0.0363). These gain- and
loss-of-function data demonstrated that SGPP1 negatively regulates
UGT1A9 and UGT2B28 expression at the mRNA and protein levels,
consistent with the inverse correlations observed in the TCGA-ESCC
cohort. The TCGA-ESCC correlation analysis and in vitro
validation support UGT1A9 and UGT2B28 as candidate downstream
mediators of SGPP1 in ESCC.
SGPP1 association with survival and
prognosis in patients with EC
The follow-up cutoff date for this cohort was
December 31, 2025. All 68 patients completed follow-up,
corresponding to a follow-up rate of 100%. The follow-up duration
ranged from 2 to 119 months, with a median duration of 19.5 months.
IHC was performed to evaluate SGPP1 protein expression in tumor
tissues obtained from 68 patients with ESCC. SGPP1 protein
expression varied markedly among the tumor samples, indicating a
heterogeneous expression pattern within the cohort. The general
clinicopathological characteristics of the patients and the results
of the univariate and multivariate Cox regression analyses are
listed in Table I.
 | Table I.Association of SGPP1 expression with
clinicopathological characteristics and univariate and multivariate
Cox regression analyses of overall survival in 68 patients with
esophageal squamous cell carcinoma. |
Table I.
Association of SGPP1 expression with
clinicopathological characteristics and univariate and multivariate
Cox regression analyses of overall survival in 68 patients with
esophageal squamous cell carcinoma.
|
|
| Univariate
analysis | Multivariate
analysis |
|---|
|
|
|
|
|
|---|
|
Characteristics | Total (n=68) | HR (95% CI) | P-value | HR (95% CI) | P-value |
|---|
| Age, years |
|
|
|
|
|
|
≥60 | 51 | Reference |
|
|
|
|
<60 | 17 | 0.897
(0.488–1.649) | 0.727 |
|
|
| Sex | 68 |
|
|
|
|
|
Male | 39 | Reference |
|
|
|
|
Female | 29 | 1.362
(0.799–2.322) | 0.256 |
|
|
| Lesion
location | 68 |
|
|
|
|
| Middle
+ lower thoracic segments | 41 | Reference |
|
|
|
|
Cervical + upper thoracic
segments | 27 | 0.691
(0.399–1.196) | 0.187 |
|
|
| Lesion length,
cm | 68 |
|
|
|
|
|
<5 | 30 | Reference |
|
|
|
| ≥5 | 38 | 1.207
(0.704–2.069) | 0.495 |
|
|
| Clinical stage | 68 |
|
|
|
|
| I +
II | 43 | Reference |
|
|
|
| III +
IV | 25 | 0.671
(0.382–1.178) | 0.164 |
|
|
| Lymphatic
invasion | 68 |
|
|
|
|
| No | 20 | Reference |
|
|
|
|
Yes | 48 | 1.198
(0.670–2.144) | 0.542 |
|
|
| Concurrent
chemoradiotherapy | 68 |
|
|
|
|
| No | 37 | Reference |
| Reference |
|
|
Yes | 31 | 0.482
(0.277–0.837) | 0.010 | 0.319
(0.180–0.567) | <0.001 |
| Expression of
SGPP1 | 68 |
|
|
|
|
| High
(≥6) | 31 | Reference |
| Reference |
|
| Low
(<6) | 37 | 4.297
(2.322–7.952) | <0.001 | 6.016
(3.143–11.513) | <0.001 |
Among the 68 patients with ESCC, 51 were aged ≥60
years and 17 were aged <60 years; 39 were male and 29 were
female. Lesions were located in the middle or lower thoracic
segments in 41 patients and in the cervical or upper thoracic
segments in 27 patients. Lesion length was <5 cm in 30 patients
and ≥5 cm in 38 patients. In total, 43 patients had clinical stage
I or II disease, whereas 25 had stage III or IV disease. Lymphatic
invasion was present in 48 patients and absent in 20 patients. A
total of 31 patients received concurrent chemoradiotherapy, whereas
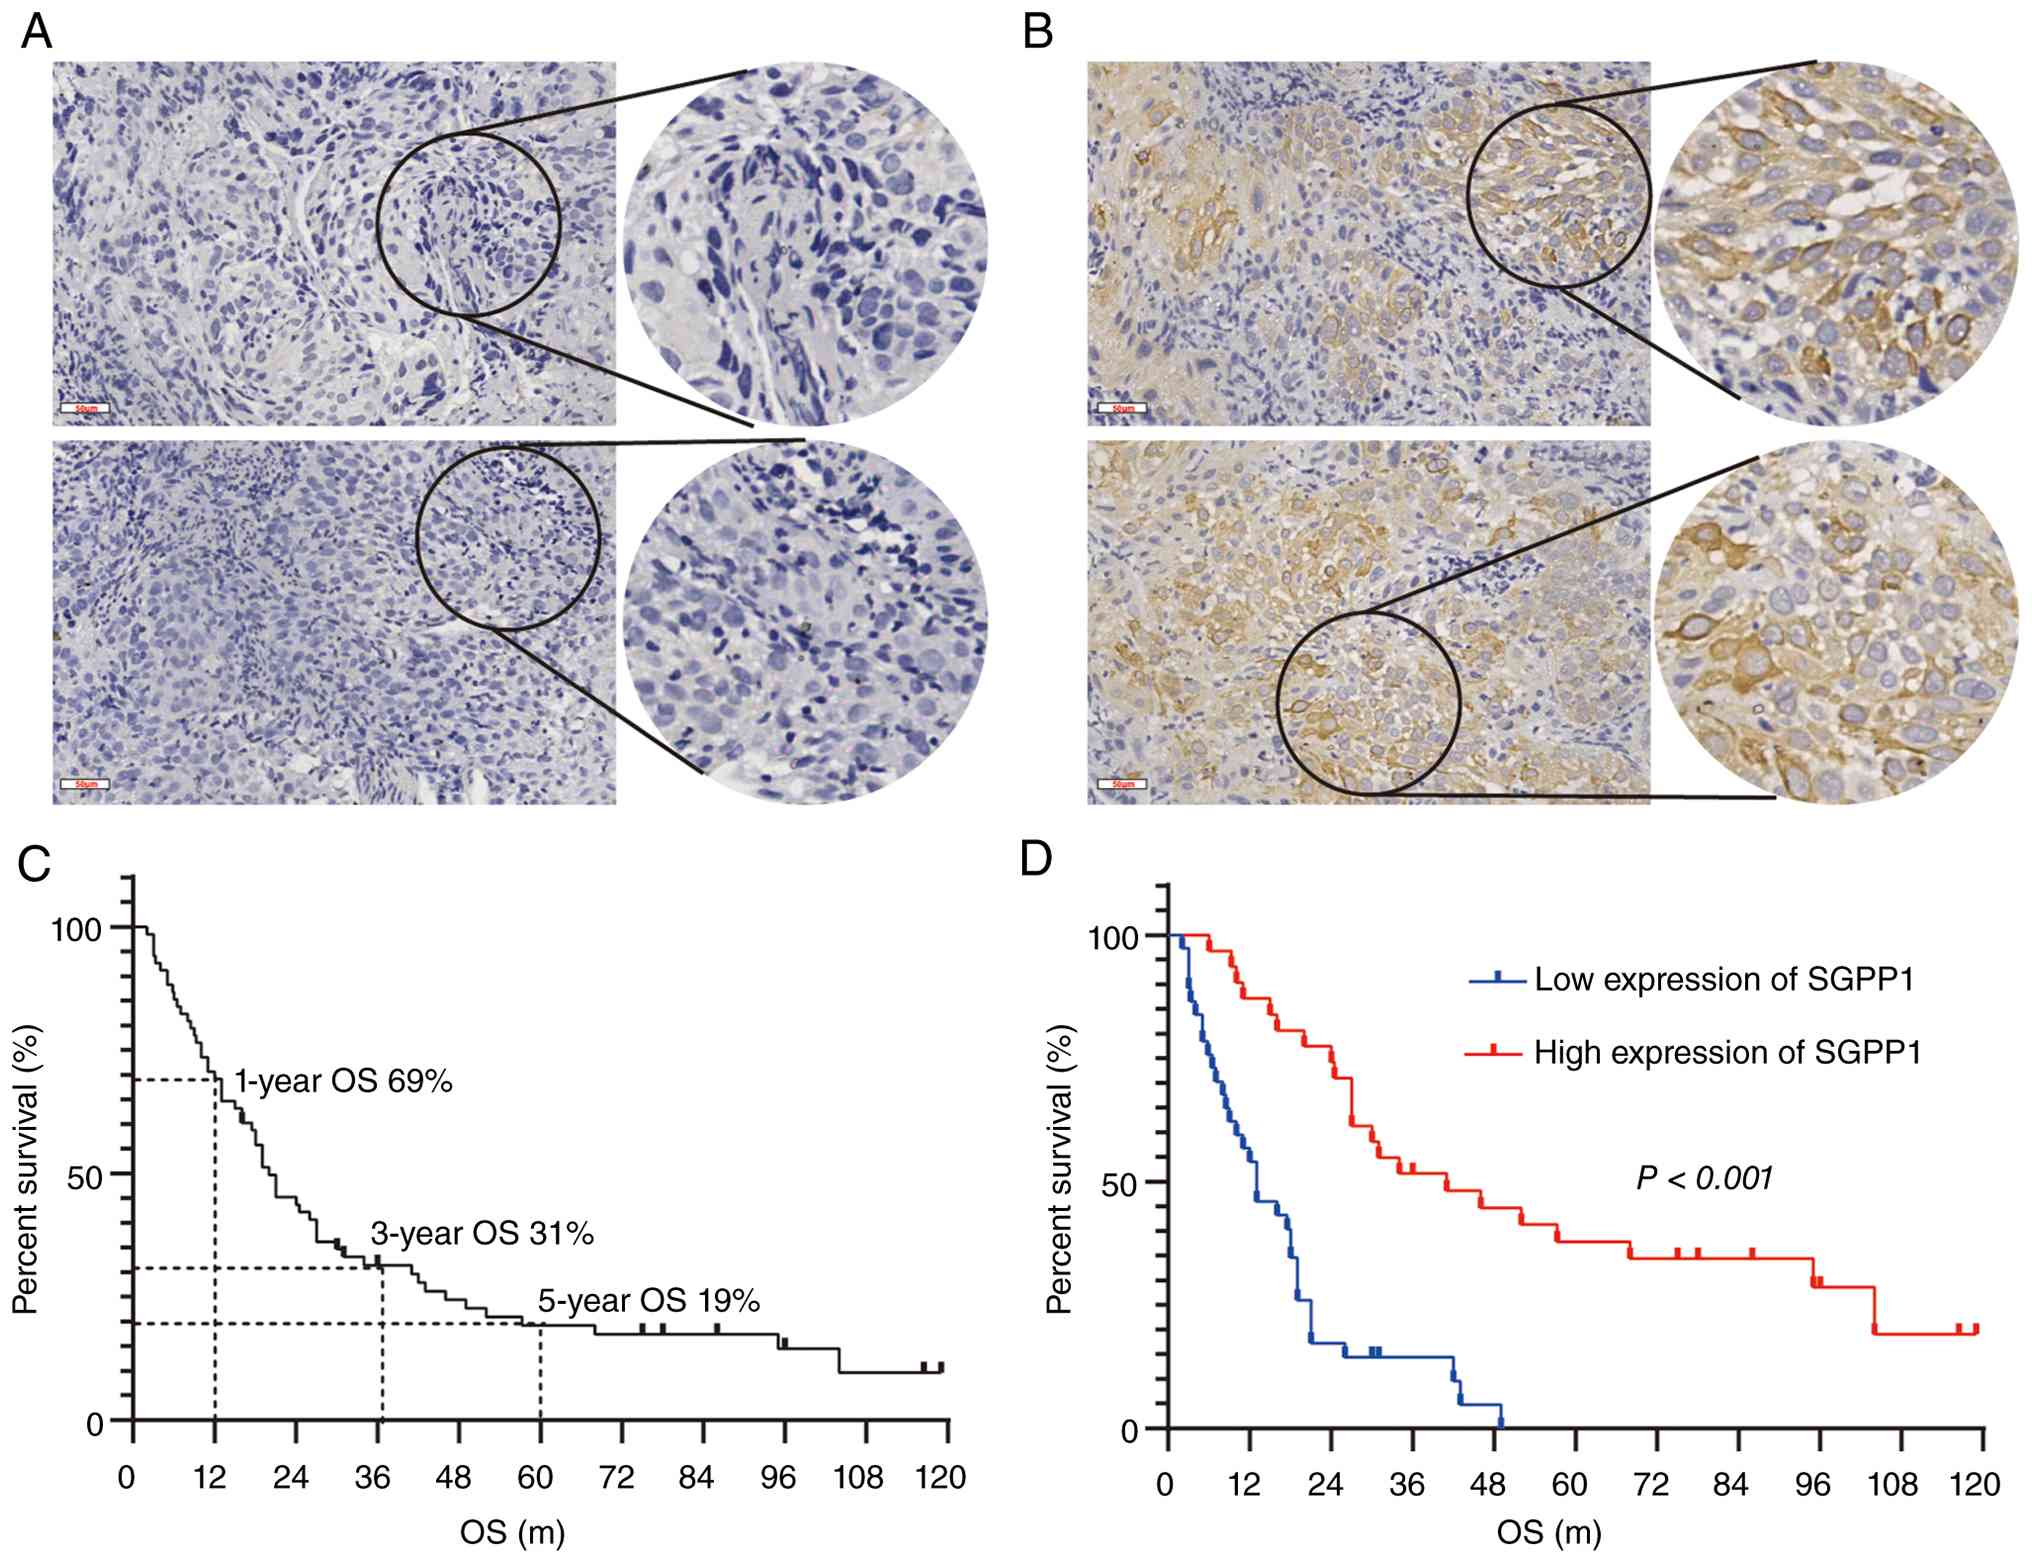
37 received radiotherapy alone. Representative IHC images
demonstrated the heterogeneous SGPP1 expression pattern in clinical
ESCC specimens. A representative tumor with low or negative SGPP1
expression, characterized by weak or absent cytoplasmic
immunoreactivity is shown in Fig.
5A, whereas a representative tumor with high or positive SGPP1
expression, characterized by strong and distinct cytoplasmic
staining, is demonstrated in Fig.
5B. The 1-, 3- and 5-year OS rates among the 68 patients in
this group were 69, 31 and 19%, respectively (Fig. 5C). Based on the IHC scores, 31
tumors exhibited high SGPP1 expression (score ≥6), whereas 37
tumors exhibited had low SGPP1 expression (score <6). Univariate
Cox regression analysis showed that concurrent chemoradiotherapy
(HR=0.482, 95% CI: 0.277–0.837, P=0.010) and SGPP1 expression level
(HR=4.297, 95% CI: 2.322–7.952, P<0.001) were significantly
associated with OS. Age, sex, lesion location, lesion length,
clinical stage and lymphatic invasion were not significantly
associated with prognosis (all P>0.05). Variables that were
significant in the univariate analysis were entered into the
multivariate Cox regression model. Concurrent chemoradiotherapy was
independently associated with a favorable prognosis (HR=0.319, 95%
CI: 0.180–0.567, P<0.001), whereas low SGPP1 expression was an
independent risk factor for the poor prognosis (HR=6.016, 95% CI:
3.143–11.513, P<0.001) (Table
I). Patients in the high-SGPP1 expression group had
significantly longer OS than those in the low expression group
(P<0.001) (Fig. 5D).
Discussion
The present study systematically investigated the
biological functions and molecular mechanisms of SGPP1 in ESCC and
identified SGPP1 as a tumor suppressor whose low expression is
associated with poor prognosis. The findings demonstrated that
SGPP1 inhibits ESCC cell proliferation, viability, migration and
invasion while promoting apoptosis. Mechanistically, SGPP1 can
exert its tumor-suppressive effects by negatively regulating UGT1A9
and UGT2B28 expression and modulating ECM remodeling and xenobiotic
metabolic pathways. In addition, SGPP1 expression was identified as
an independent prognostic factor in patients with ESCC, supporting
its potential utility as a prognostic biomarker and therapeutic
target.
These findings are consistent with the
tumor-suppressive role of SGPP1 reported in several solid tumors,
including BC (13), GC (10) and PC (15). In the present study, it was
demonstrated that SGPP1 expression was heterogeneous among the ESCC
cell lines examined, with relatively low endogenous expression in
KYSE150 cells and relatively high expression in ECA109 cells. Gain-
and loss-of-function experiments using cell lines with different
endogenous SGPP1 levels consistently demonstrated that SGPP1
suppresses malignant ESCC cell behavior. SGPP1 overexpression
inhibited the proliferation, migration and invasion of KYSE150
cells and promoted apoptosis, whereas SGPP1 knockdown enhanced
these malignant phenotypes in ECA109 cells. Although SGPP1
participates in sphingolipid metabolism in other tumor contexts,
the canonical SGPP1-S1P metabolic axis was not directly examined.
Instead, subsequent transcriptomic and experimental analyses
focused on identifying downstream regulatory molecules associated
with SGPP1-mediated ESCC progression. SGPP1 has previously been
identified as a negative regulator of malignant cell proliferation
(19). With respect to metastatic
properties, SGPP1 overexpression suppressed KYSE150 cell migration
and invasion in wound-healing and Transwell assays, whereas SGPP1
knockdown enhanced the migratory and invasive potential of ECA109
cells. This finding is consistent with observations in GC, in which
SGPP1 knockdown leads to S1P accumulation, a 2- to 5-fold increase
in the migratory capacity of AGS and HGC27 cells, and a notable
increase in invasive capacity (10). However, SGPP1 can exert an opposing
role in certain cancers by promoting tumor progression. For
instance, in glioma, SGPP1 knockdown markedly inhibited
PAK1-induced glioma cell migration and resistance, indicating that
SGPP1 cooperates with PAK1 to raise malignant tumor behavior
(17). SGPP1 has also been reported
to enhance oral cancer cell survival by regulating endoplasmic
reticulum stress and autophagy; aberrant SGPP1 overexpression can
raise the dedifferentiation of oral epithelial cells and thereby
contribute to carcinogenesis (20).
Thus, the function of SGPP1 appears to be highly context-dependent
and can be influenced by the tumor microenvironment, cell type and
upstream signaling pathways. Because the role of SGPP1 in ESCC has
not previously been reported, further investigation of its
tumor-suppressive mechanisms can facilitate the identification of
novel therapeutic targets for this disease.
Identifying key regulators of metabolic
reprogramming in ESCC is essential for understanding the
limitations of current treatment strategies (21). A central finding of the present
study is that SGPP1 can exert its effects through the regulation of
UDP-glucuronosyltransferase (UGT)-mediated metabolic reprogramming.
The KEGG pathways associated with downregulated DEGs were
intersected with the GSEA-KEGG pathways using UpSet analysis to
identify candidate downstream mediators of SGPP1. UGT1A9 and
UGT2B28 were the only genes enriched across all overlapping
downregulated pathways. TCGA-ESCC analysis revealed moderate
inverse correlations between SGPP1 and UGT1A9/UGT2B28 at the mRNA
level, whereas in vitro experiments demonstrated that SGPP1
negatively regulates the mRNA and protein expression of UGT1A9 and
UGT2B28 in ESCC cells. UGT1A9 and UGT2B28 are members of the UGT
superfamily, which comprises important phase II metabolic enzymes
involved in the metabolism, inactivation and detoxification of
endogenous and exogenous compounds through glucuronidation.
Abnormal expression of these enzymes contributes to tumor metabolic
reprogramming (22). UGT enzymes
catalyze glucuronidation reactions and participate in drug
metabolism, hormone inactivation and toxin elimination (22,23,24).
Abnormal expression of UGT1A9 and UGT2B28 expression was associated
with cancer progression and treatment response. In BC, resveratrol
was reported to inhibit tumor cell proliferation by upregulating
NRF2 and UGT1A9 expression, promoting estrogen metabolism in
vivo, and reducing cellular damage caused by toxic estrogen
metabolites (25). In patients with
liver cancer treated with sorafenib after surgery, high UGT1A9
expression was associated with an improved prognosis, possibly
because enhanced sorafenib glucuronidation improves treatment
efficacy (26). UGT2B28 also
affects steroid hormone metabolism in BC (27). In PC, UGT2B28 regulates steroid
hormone metabolism and modulates testosterone and
dihydrotestosterone levels. Elevated androgen levels upregulate
UGT2B28, forming a feedback loop, and UGT2B28 can predict the risk
and progression of PC (28). The
findings of the present study link SGPP1 to UGT1A9/UGT2B28 and
indicate that SGPP1 can alter the metabolic state of ESCC cells and
suppress their growth and metastasis by inhibiting UGT-mediated
metabolic pathways, including xenobiotic and retinol metabolism.
These results expand the current understanding of the
tumor-suppressive mechanisms of SGPP1 and the functions of the UGT
family in ESCC.
From a clinical translational perspective, the
findings of the present study suggest that SGPP1 may have
prognostic value in ESCC. IHC demonstrated heterogeneous
SGPP1expression in tumor tissues from 68 patients with ESCC,
including 31 tumors with high SGPP1 expression and 37 with low
SGPP1 expression. In this cohort, low SGPP1 expression remained
significantly associated with poorer OS in the multivariable Cox
model. Kaplan-Meier analysis further demonstrated that patients
with high SGPP1 expression had a considerably longer OS than those
with low SGPP1 expression. Collectively, these results support the
clinical potential of SGPP1 as a candidate prognostic biomarker for
ESCC, but the association should be interpreted cautiously pending
validation in larger, independent cohorts.
A major strength of the present study is its
comprehensive investigation of the biological functions and
molecular mechanisms of SGPP1 in ESCC. Through the integration of
in vitro cell experiments with clinical sample validation,
UGT1A9 and UGT2B28 were identified for the first time as candidate
downstream targets of SGPP1. The combined application of multiple
bioinformatics approaches, including differential gene screening,
GO, KEGG, GSEA and UpSet plots, together with experimental
validation using western blotting, RT-qPCR and IHC, enhanced the
robustness of the findings. Cox regression analysis suggested a
potential prognostic association of SGPP1 in this cohort; however,
this finding requires confirmation in larger independent
cohorts.
Several limitations of the present study should be
acknowledged. First, the clinical cohort used for the prognostic
analysis of ESCC clinical samples was relatively small (n=68) and
restricted to patients receiving radical radiotherapy, which
limited statistical power and may have introduced selection bias;
therefore, larger multicenter clinical studies are required to
validate the prognostic value of SGPP1. Second, the four
overlapping downregulated KEGG pathways were all related to
xenobiotic, drug, or retinoid metabolism, and UGT family members
serve as shared phase II conjugating enzymes across these pathway
annotations. This annotation structure can therefore increase the
likelihood of identifying UGT genes at the intersection of all
pathways. Third, the relationship between SGPP1 and UGT1A9/UGT2B28
was examined only at the mRNA and protein levels. The specific
regulatory mechanisms underlying this relationship, including
potential regulation through transcription factors or
post-translational modifications, require further investigation.
Fourth, only in vitro cell experiments were performed;
therefore, in vivo studies, such as xenograft experiments in
nude mice, are required to validate the tumor-suppressive effects
of SGPP1 and the regulatory roles of UGT1A9/UGT2B28. Fifth, SGPP1
overexpression and knockdown were performed in only one ESCC cell
line each (KYSE150 and ECA109, respectively). Although the
reciprocal phenotypes support the functional role of SGPP1,
cell-line-specific effects cannot be excluded, and validation in
additional ESCC cell lines is warranted. Finally, SGPP1 knockdown
efficiency was confirmed at both the mRNA and protein levels;
however, only one siSGPP1 sequence was used. Although the
loss-of-function phenotypes observed in ECA109 cells were
directionally opposite to the gain-of-function phenotypes observed
in KYSE150 cells, supporting the functional involvement of SGPP1 in
ESCC cells, future studies using additional independent siRNAs or
stable shRNA systems are required to strengthen the evidence for
knockdown specificity. Moreover, the basal SGPP1 expression profile
across ESCC cell lines shown in Fig.
1B was obtained as part of an exploratory cell-line screening
experiment and was not quantitatively assessed in three independent
biological replicates. Thus, the observed differences in basal
SGPP1 protein expression among these cell lines should be
interpreted qualitatively rather than as statistically validated
quantitative differences.
The present study identified SGPP1 as a tumor
suppressor in ESCC. SGPP1 negatively regulates UGT1A9 and UGT2B28
expression, modulates ECM remodeling and xenobiotic metabolic
pathways, inhibits ESCC cell proliferation, migration and invasion,
and increases apoptosis-associated DNA fragmentation. Low SGPP1
expression is associated with poor prognosis in this cohort and may
have value as a prognostic biomarker. These findings broaden the
current understanding of the molecular mechanisms underlying ESCC
progression and provide a rationale for further evaluation of SGPP1
as a diagnostic, prognostic and therapeutic target.
Supplementary Material
Supporting Data
Supporting Data
Acknowledgements
Not applicable.
Funding
The present study was supported by the Hebei Natural Science
Foundation (grant no. H2022206572), the Medical Science Research
Project of Hebei (grant no. 20250042) and the Hebei
Medical-Research-Enterprise Joint Innovation Special Project
Program (grant no. LH20250063).
Availability of data and materials
The data generated in the present study may be
requested from the corresponding author.
Authors' contributions
LS, LH and XH conceived and conducted the
experiments, analyzed the data, prepared the figures and/or tables,
and drafted and/or verified the manuscript. GZ, JL, YW and YH
contributed to data analysis and manuscript revision. HZ designed
the experiments and drafted or critically reviewed the manuscript.
XX supervised the whole study and critically revised the
manuscript. HZ and XX confirm the authenticity of all the raw data.
All authors read and approved the final version of the
manuscript.
Ethics approval and consent to
participate
All procedures involving human participants were
conducted in accordance with the 1964 Declaration of Helsinki and
its subsequent amendments and with the ethical standards of the
institutional research committee. The study was approved by the
Ethics Committee of The Second Hospital of Hebei Medical University
(approval no. 2024-R393; Shijiazhuang, China), and written informed
consent was obtained from all participants.
Patient consent for publication
Not applicable.
Competing interests
The authors declare that they have no competing
interests.
Use of artificial intelligence tools
During the preparation of this work, artificial
intelligence tools were used to improve the readability and
language of the manuscript or to generate images, and subsequently,
the authors revised and edited the content produced by the
artificial intelligence tools as necessary, taking full
responsibility for the ultimate content of the present
manuscript.
References
|
1
|
Bray F, Laversanne M, Sung H, Ferlay J,
Siegel RL, Soerjomataram I and Jemal A: Global cancer statistics
2022: GLOBOCAN estimates of incidence and mortality worldwide for
36 cancers in 185 countries. CA Cancer J Clin. 74:229–263.
2024.PubMed/NCBI
|
|
2
|
Yang J, Nie J, Xing S, Jiang K and Huang
A: Minimally invasive resection of synchronous esophageal cancer
and giant thymoma: A case report. Oncol Transl Med. July
9–2025.(Epub ahead of print).
|
|
3
|
Lyu G and Li D: ZNF165: A pan-cancer
biomarker with prognostic and therapeutic potential. Protein Pept
Lett. 32:206–223. 2025. View Article : Google Scholar : PubMed/NCBI
|
|
4
|
Hou L, Hao Z, Zhang G, Li J, Wang Y, Xue X
and Zhou H: CD9 regulates proliferation, invasion, migration and
radioresistance of esophageal squamous cell carcinoma by activating
AKT/GSK3β signaling pathway. Front Oncol. 15:16251202025.
View Article : Google Scholar : PubMed/NCBI
|
|
5
|
Han B, Zheng R, Zeng H, Wang S, Sun K,
Chen R, Li L, Wei W and He J: Cancer incidence and mortality in
China, 2022. J Natl Cancer Cent. 4:47–53. 2024.PubMed/NCBI
|
|
6
|
Pan S, Hao Y, Ke Y, Zhang R, Zhao X, Ma X,
Guo W, Wang X and Ma H: Albumin-to-globulin ratio as a prognostic
indicator in elderly patients with esophageal squamous cell
carcinoma undergoing radical radiotherapy. Oncol Transl Med.
12:101–107. 2026. View Article : Google Scholar
|
|
7
|
Yi Y, Cao Q, Zhang H, Zhang B, Zhang R, Li
X, Kong L and Li B: Efficacy of neoadjuvant chemoimmunotherapy in
locally advanced resectable esophageal cancer. J Cancer Res Ther.
21:934–940. 2025. View Article : Google Scholar : PubMed/NCBI
|
|
8
|
Zhao YX, Zhao HP, Zhao MY, Yu Y, Qi X,
Wang JH and Lv J: Latest insights into the global epidemiological
features, screening, early diagnosis and prognosis prediction of
esophageal squamous cell carcinoma. World J Gastroenterol.
30:2638–2656. 2024. View Article : Google Scholar : PubMed/NCBI
|
|
9
|
Jiang H, Jin X, Gu H, Li B, Li Z and Sun
Y: SPC25 upregulates CCND1 to promote the progression of esophageal
squamous cell carcinoma by inhibiting MDM2-mediated E2F1
ubiquitination. Transl Oncol. 53:1023002025. View Article : Google Scholar : PubMed/NCBI
|
|
10
|
Gao XY, Li L, Wang XH, Wen XZ, Ji K, Ye L,
Cai J, Jiang WG and Ji JF: [Corrigendum] Inhibition of
sphingosine-1-phosphate phosphatase 1 promotes cancer cells
migration in gastric cancer: Clinical implications. Oncol Rep.
39:20512018.PubMed/NCBI
|
|
11
|
Sattar RSA, Sumi MP, Nimisha Apurva Kumar
A, Sharma AK, Ahmad E, Ali A, Mahajan B and Saluja SS: S1P
signaling, its interactions and cross-talks with other partners and
therapeutic importance in colorectal cancer. Cell Signal.
86:1100802021. View Article : Google Scholar : PubMed/NCBI
|
|
12
|
Ogretmen B: Sphingolipid metabolism in
cancer signalling and therapy. Nat Rev Cancer. 18:33–50. 2018.
View Article : Google Scholar : PubMed/NCBI
|
|
13
|
Zhao J, Tian XC, Zhang JQ, Li TT, Qiao S
and Jiang SL: Tribulus terrestris L. induces cell apoptosis of
breast cancer by regulating sphingolipid metabolism signaling
pathways. Phytomedicine. 120:1550142023. View Article : Google Scholar : PubMed/NCBI
|
|
14
|
Nema R and Kumar A:
Sphingosine-1-phosphate catabolizing enzymes predict better
prognosis in triple-negative breast cancer patients and correlates
with tumor-infiltrating immune cells tumor-infiltrating immune
cells. Front Mol Biosci. 8:6979222021. View Article : Google Scholar : PubMed/NCBI
|
|
15
|
Huang X, Taeb S, Jahangiri S, Emmenegger
U, Tran E, Bruce J, Mesci A, Korpela E, Vesprini D, Wong CS, et al:
miRNA-95 mediates radioresistance in tumors by targeting the
sphingolipid phosphatase SGPP1. Cancer Res. 73:6972–6986. 2013.
View Article : Google Scholar : PubMed/NCBI
|
|
16
|
He J, Zhao H, Liu X, Wang D, Wang Y, Ai Y
and Yang J: Sevoflurane suppresses cell viability and invasion and
promotes cell apoptosis in colon cancer by modulating
exosome-mediated circ-HMGCS1 via the miR-34a-5p/SGPP1 axis. Oncol
Rep. 44:2429–2442. 2020. View Article : Google Scholar : PubMed/NCBI
|
|
17
|
Kim JH, Seo Y, Jo M, Jeon H, Kim YS, Kim
EJ, Seo D, Lee WH, Kim SR, Yachie N, et al: Interrogation of kinase
genetic interactions provides a global view of PAK1-mediated signal
transduction pathways. J Biol Chem. 295:16906–16919. 2020.
View Article : Google Scholar : PubMed/NCBI
|
|
18
|
Livak KJ and Schmittgen TD: Analysis of
relative gene expression data using real-time quantitative PCR and
the 2(−Delta Delta C(T)) method. Methods. 25:402–408. 2001.
View Article : Google Scholar : PubMed/NCBI
|
|
19
|
Petrusca DN, Mulcrone PL, Macar DA, Bishop
RT, Berdyshev E, Suvannasankha A, Anderson JL, Sun Q, Auron PE,
Galson DL and Roodman GD: GFI1-dependent repression of SGPP1
increases multiple myeloma cell survival. Cancers (Basel).
14:7722022. View Article : Google Scholar : PubMed/NCBI
|
|
20
|
Vishwakarma S, Joshi D, Pandey R, Das S,
Mukhopadhyay S, Rai R, Singhal R, Kapoor N and Kumar A:
Downregulation of lipid phosphate phosphatase 3 correlates with
tumor-infiltrating immune cells in oral cancer. Cureus.
14:e235532022.PubMed/NCBI
|
|
21
|
Zhang GC, Yu XN, Guo HY, Sun JL, Liu ZY,
Zhu JM, Liu TT, Dong L, Shen XZ and Yin J: PRP19 enhances
esophageal squamous cell carcinoma progression by reprogramming
SREBF1-dependent fatty acid metabolism. Cancer Res. 83:521–537.
2023. View Article : Google Scholar : PubMed/NCBI
|
|
22
|
Liu W, Li J, Zhao R, Lu Y and Huang P: The
uridine diphosphate (UDP)-glycosyltransferases (UGTs) superfamily:
The role in tumor cell metabolism. Front Oncol. 12:10884582023.
View Article : Google Scholar : PubMed/NCBI
|
|
23
|
Stresser DM and Zientek MA:
UDP-Glucuronosyl transferase mediated drug-drug interactions: An
Industry perspective on recommended in vitro studies. Drug Metab
Pharmacokinet. 67:1015262026. View Article : Google Scholar : PubMed/NCBI
|
|
24
|
Zeng X, Jiang W, He B, Li L, Wu T, Fu F,
Yao H, Liao G, Wang C and Wu D: Tissue-derived extracellular
vesicles-mediated delivery of a hepatic enzyme living panorama
(HELP) for treating multifactorial liver diseases. J
Nanobiotechnology. 24:3102026. View Article : Google Scholar : PubMed/NCBI
|
|
25
|
Thibaudeau J, Lépine J, Tojcic J, Duguay
Y, Pelletier G, Plante M, Brisson J, Têtu B, Jacob S, Perusse L, et
al: Characterization of common UGT1A8, UGT1A9, and UGT2B7 variants
with different capacities to inactivate mutagenic 4-hydroxylated
metabolites of estradiol and estrone. Cancer Res. 66:125–133. 2006.
View Article : Google Scholar : PubMed/NCBI
|
|
26
|
Ge Y, Chen S, Mu W, Ba Q, Li J, Chen P,
Wang X and Wang H: Epigenetic regulation of
UDP-Glucuronosyltransferase by microRNA-200a/-183: Implications for
responses to sorafenib treatment in patients with hepatocellular
carcinoma. Cancer Lett. 454:14–25. 2019. View Article : Google Scholar : PubMed/NCBI
|
|
27
|
Cao Q, Chen X, Wu X, Liao R, Huang P, Tan
Y, Wang L, Ren G, Huang J and Dong C: Inhibition of UGT8 suppresses
basal-like breast cancer progression by attenuating sulfatide-αVβ5
axis. J Exp Med. 215:1679–1692. 2018. View Article : Google Scholar : PubMed/NCBI
|
|
28
|
Belledant A, Hovington H, Garcia L, Caron
P, Brisson H, Villeneuve L, Simonyan D, Têtu B, Fradet Y, Lacombe
L, et al: The UGT2B28 sex-steroid inactivation pathway is a
regulator of steroidogenesis and modifies the risk of prostate
cancer progression. Eur Urol. 69:601–609. 2016. View Article : Google Scholar : PubMed/NCBI
|