Introduction
Intrahepatic cholangiocarcinoma (ICC) is a primary
liver cancer characterized by frequent recurrence and limited
treatment options (1–7). Metabolic adaptation is also a
prominent feature of this disease (8–14).
Such adaptation may help malignant cells tolerate nutrient
limitation and treatment-related stress. Defining how
tumor-suppressor alterations reshape these metabolic responses may
improve our understanding of ICC progression.
Polybromo-1 (PBRM1) forms part of the PBAF branch of
the SWI/SNF chromatin-remodeling machinery and participates in
transcriptional and cell-cycle regulation (15–18).
In clear cell renal cell carcinoma, Tang et al (19) linked PBRM1 deficiency to AKT-mTOR
activation and enhanced aerobic glycolysis. PBAF loss has also been
associated with defective maintenance of the DNA-damage checkpoint
(20). These observations arise
from biological contexts distinct from ICC. Nevertheless, they
raise the question of whether PBRM1 perturbation has comparable
metabolic consequences in cholangiocarcinoma. This possibility
needs to be tested directly because downstream effects of PBRM1 are
likely to depend on tumor context.
Glycolysis provides ATP and biosynthetic
intermediates for cancer cells (8–14).
Several glycolytic enzymes can also contribute to tumor adaptation.
In the present study, aldolase, fructose-bisphosphate A (ALDOA)
showed a prominent change among the measured glycolysis-related
genes following PBRM1 knockdown. Nuclear factor erythroid 2-related
factor 2 (NRF2) is best known as a regulator of oxidative-stress
responses, but it also participates in metabolic control. The
present study therefore examined whether NRF2 contributes to ALDOA
regulation in the PBRM1-knockdown setting.
Accordingly, the present study combined descriptive
public-dataset analysis with functional and metabolic experiments
in HCCC-9810 cells and an HCCC-9810-derived xenograft model. The
present study examined whether PBRM1 knockdown altered
tumor-associated phenotypes and glucose-metabolism readouts and
then evaluated the contributions of ALDOA and NRF2 to these
responses.
Materials and methods
Bioinformatic analysis of PBRM1
mutations in ICC
The present study interrogated cBioPortal for Cancer
Genomics for somatic-variant information from intrahepatic
cholangiocarcinoma (21). The
cohort comprised 203 pathologically defined ICC cases with
available mutation profiles; cases lacking somatic-variant data and
duplicate tumor specimens were excluded. The descriptive summary
covered mutation classes and types, single-nucleotide changes, the
number of variants in each sample, commonly altered genes, and the
positions of PBRM1 variants across its protein domains. Mutation
frequencies were summarized for the cohort as a whole without
survival or treatment-response modeling.
Cell culture and viral
transduction
HCCC-9810 human ICC cells were obtained from Procell
Life Science & Technology Co., Ltd. (cat. no. CL-0095). Routine
culture used RPMI-1640 (Gibco; Thermo Fisher Scientific, Inc.)
containing 10% fetal bovine serum and 1% penicillin-streptomycin.
Cells were kept at 37°C in humidified 5% CO2. The
standard RPMI-1640 formulation contained 2.0 g/l D-glucose,
equivalent to ~11.1 mM (22). For
experiments that altered glucose supply, the actual concentration
is stated with the corresponding assay.
For viral transduction, 5×10³ cells were
plated and allowed to attach for 18 h before exposure to the
lentiviral constructs. A third-generation lentiviral packaging
system was used. The 293T cells used for lentiviral packaging were
obtained from ATCC (cat. no. CRL-3216). For transfection, 24 µg of
lentiviral transfer plasmid was used, and the ratio of the
lentiviral transfer, packaging and envelope plasmids was 12:4:4:4.
Prepackaged short hairpin (sh)RNAs directed against the coding
regions of PBRM1 (Sh-PBRM1), ALDOA (Sh-ALDOA), and NRF2/NFE2L2
(Sh-NRF2) were used, with a non-targeting construct serving as
Sh-NC. Sh-PBRM1 or control virus was applied at a multiplicity of
infection of 20–40 together with 2 µg/ml polybrene. The culture
medium was renewed 24 h later, followed by a further 48 h of
culture. GFP fluorescence provided the transduction-efficiency
check, and downstream experiments were conducted 72 h after
transduction when the transduction efficiency was >80%. NRF2
gain-of-function experiments used an overexpression (OE)-NRF2
construct and its matched empty-vector control (OE-NC). Samples for
reverse transcription-quantitative PCR (RT-qPCR) and immunoblotting
were collected at 0, 12, 24, and 48 h. Successful NRF2 knockdown
and overexpression in cells transfected with Sh-NRF2 or OE-NRF2
alone, respectively, were verified by RT-qPCR and western blotting
without additional treatments (Fig.
S1). Table I summarizes the
shRNA constructs, targeted regions and targeting sequences.
 | Table I.Lentiviral shRNA constructs used for
gene silencing. |
Table I.
Lentiviral shRNA constructs used for
gene silencing.
| Construct | Target gene | Targeted region
Targeting sequence (5′-3′) | Experimental
role |
|---|
| Sh-PBRM1 | PBRM1 | Coding region
(CDS) | PBRM1
knockdown |
|
|
|
TCCAATCTTCCAACTGTAGAT |
|
| Sh-ALDOA | ALDOA | Coding region
(CDS) | ALDOA
knockdown |
|
|
|
TCTACCTGGAAGGCACCTTGC |
|
| Sh-NRF2 | NRF2 | Coding region
(CDS) | NRF2 knockdown |
|
|
|
ACGGTATGCAACAGGACATTG |
|
| Sh-NC | None | Non-targeting
control sequence | Negative
control |
|
|
|
TTCTCCGAACGTGTCACGT |
|
Immunoblotting
Cells were lysed in RIPA buffer (Beyotime
Biotechnology; cat. no. P0013E) containing protease inhibitors, and
protein concentrations were determined using the BCA method with a
BCA Protein Assay Kit (Beyotime Biotechnology; cat. no. P0010).
Equal amounts of protein (20 µg per lane) were resolved by 8–12%
SDS-PAGE and transferred onto PVDF membranes. Membranes were
blocked in 5% non-fat milk for 1 h at room temperature and then
exposed overnight at 4°C to the relevant primary antibodies: ALDOA
(Affinity Biosciences; cat no. BF8051; 1:1,000), ENO1 (Affinity
Biosciences; cat no. DF6191; 1:1,000), GLUT1 (Affinity Biosciences;
cat no. AF5462; 1:1,000), NRF2 (Affinity Biosciences; cat no.
AF0639; 1:1,000), GAPDH (Affinity Biosciences; cat no. T0004;
1:5,000), PBRM1 (Abcam; cat no. ab196022; 1:5,000) or Tubulin
(Abcam; cat no. ab7291; 1:5,000), as required by the experiment.
Following three rinses with TBST containing 1% (v/v) Tween-20, the
appropriate HRP-linked goat anti-rabbit IgG (Bioss; cat no.
bs-0295G-HRP; 1:3,000) or goat anti-mouse IgG (Bioss; cat no.
bs-0296G-HRP; 1:3,000) was applied for 1 h at room temperature.
Chemiluminescent signals were captured with a ChemiScope Mini 3300
system (Clinx Science Instruments Co., Ltd.). Quantity One software
(version 4.6.8; Bio-Rad Laboratories, Inc.) was used for
densitometry. Protein-band values were first normalized to the
corresponding loading control and were then expressed relative to
the designated control condition.
CCK-8 cell viability
For the CCK-8 assay, logarithmically growing Sh-NC
and Sh-PBRM1 HCCC-9810 cells were distributed into 96-well plates
at 1,000 cells in 100 µl per well and six wells were used for each
group. Absorbance-based viability was assessed at 0, 24, 48, 72,
and 96 h. At each measurement, 10 µl of CCK-8 reagent was added and
the plate was incubated at 37°C for 1 h before the optical density
at 450 nm was recorded. The glucose-concentration experiments
followed the same procedure under the specified glucose
conditions.
Clonogenic assay
For clonogenic assessment, stable Sh-NC or Sh-PBRM1
cells were placed in 6-cm dishes at 1,500 cells per dish in 4 ml
complete RPMI-1640. Cultures were maintained for 7–10 days, and
fresh medium was supplied every 2–3 days. After colonies had
formed, the dishes were rinsed with PBS and fixed in 4%
paraformaldehyde for 10 min. The colonies were then stained with
0.1% crystal violet, washed, air-dried, images captured and the
colonies counted. Only discrete colonies containing ≥50 cells were
included; diffuse background staining was excluded from the
count.
Scratch-wound assay
Scratch assays were initiated when control and
PBRM1-shRNA cultures reached 90–100% confluence. A sterile 10-µl
pipette tip was used to create a linear wound. Detached material
was removed with two PBS rinses, after which serum-free RPMI-1640
was added. Phase-contrast images were taken immediately and again
at 24 h. ImageJ (National Institutes of Health) was used to measure
scratch width. Wound closure (%) was calculated as [(initial
width-width at 24 h)/initial width] ×100.
Transwell migration and invasion
Transwell assays were used to assess cell migration
and invasion. For migration, a suspension containing 5×10⁴ cells/ml
in serum-free medium was prepared, and 200 µl was placed in the
upper compartment. The lower compartment received 600 µl complete
medium. After 48 h, cells that had migrated were fixed in 4%
paraformaldehyde for 10 min at room temperature (RT; 20–25°C) and
stained with 0.1% crystal violet for 10 min at RT; three randomly
chosen microscopic fields were counted. For invasion experiments,
40 µl Matrigel was added to the upper chamber and allowed to set at
37°C for 5 h before the cells were introduced; all later steps
matched the migration protocol.
F-actin immunofluorescence
Phalloidin staining was used to characterize F-actin
morphology. HCCC-9810 cells were cultured overnight and rinsed
twice with PBS. The cells were fixed in 4% paraformaldehyde for 10
min at room temperature (RT; 20–25°C), permeabilized with 0.5%
Triton X-100 for 5 min at RT, and blocked with 3% BSA for 30 min at
37°C. FITC-conjugated phalloidin (100 nM; Sigma-Aldrich) was then
applied for 30 min at 37°C in the dark. After three PBS washes,
samples were mounted in antifade medium and imaged at a
magnification of ×400.
Measurement of intracellular reactive
oxygen species (ROS)
Intracellular ROS was quantified with a fluorescent
probe kit from Nanjing Jiancheng Bioengineering Institute (cat. no.
E004-1-1). HCCC-9810 cells were detached with trypsin and pelleted
at 300 × g for 5 min at room temperature (RT; 20–25°C). The cells
were incubated with 10 µM DCFH-DA (4.87 µg/ml) at 37°C for 30 min
with gentle intermittent mixing and were subsequently washed three
times with PBS to clear extracellular probe. Fluorescence was
acquired on a BD FACSCanto II flow cytometer (BD Biosciences) and
processed in FlowJo software (version 10.10.1; BD Biosciences).
Mean fluorescence intensity served as the ROS measure.
ATP assay
ATP was determined with the Nanjing Jiancheng
Bioengineering Institute ATP assay kit (cat. no. A095-1-1).
HCCC-9810 cells were plated at 1×10⁴ cells/well and maintained for
48 h. Each well was extracted with 400 µl ice-cold lysis buffer.
Lysates remained on ice for 10 min and were then centrifuged at
12,000 × g for 10 min at 4°C. The resulting supernatant was mixed
with the kit reaction solution and processed according to the
manufacturer's procedure. Absorbance was read at 650 nm. Values
were interpolated from the standard curve and expressed relative to
total protein as µmol/g protein.
Lactate assay
Lactate was assayed with kit A019-2-1 (Nanjing
Jiancheng Bioengineering Institute Co., Ltd.). HCCC-9810 cells were
seeded at 1×10⁴ cells/well and incubated for 48 h. Cell extracts
were prepared in 200 µl extraction buffer and clarified by
centrifugation at 12,000 × g for 10 min at 4°C. A 50-µl aliquot of
sample supernatant or standard was mixed with 100 µl working
reagent. After incubation at 37°C for 10–15 min, absorbance was
recorded at 530 nm. Lactate concentrations were derived from the
calibration curve and normalized to the total protein content.
Pyruvate assay
Pyruvate was measured after 48 h of culture.
HCCC-9810 cells were collected and extracted with the assay buffer
provided in the pyruvate kit. After centrifugation at 12,000 × g
for 10 min at 4°C, 50 µl of sample supernatant or standard was
reacted with 100 µl chromogenic solution. The reaction proceeded
for 30 min at 37°C, and absorbance was then read at 520 nm. Sample
concentrations were obtained from the corresponding standard
curve.
RT-qPCR
Total RNA was extracted from 1×10⁶ cells using
TRIzol® reagent (Invitrogen; Thermo Fisher Scientific,
Inc.). RNA quantity and purity were checked on a NanoDrop 2000
spectrophotometer (Thermo Fisher Scientific, Inc.), while
agarose-gel electrophoresis was used to examine RNA integrity. For
reverse transcription, 2 µg of RNA from each sample was processed
with the PrimeScript RT Reagent Kit (Takara Biotechnology Co.,
Ltd.). qPCR reactions used TB Green Premix Ex Taq II (Takara
Biotechnology Co., Ltd.) on either a Bio-Rad CFX96 or ABI 7500
platform. RNA extraction, cDNA synthesis and qPCR were performed
according to the respective manufacturers' protocols. The PCR
cycling conditions were 95°C for 5 min, followed by 40 cycles of
denaturation at 94°C for 30 sec, annealing at 60°C for 30 sec and
extension at 72°C for 30 sec. Relative transcript abundance was
determined by the 2−ΔΔCq method (23), using TUBB as the reference gene.
RT-qPCR experiments were performed in six independent biological
samples. The primer sequences used for RT-qPCR are listed in
Table II.
| Table II.Primer sequences for reverse
transcription-quantitative PCR. |
Table II.
Primer sequences for reverse
transcription-quantitative PCR.
| Gene | Direction | Sequence
(5′-3′) | Product length
(bp) |
|---|
| GLUT1 | Forward |
TCCTATCTGAGCATCGTGGC | 204 |
|
| Reverse |
GTAGGGACCACACAGTTGCT |
|
| GPI | Forward |
GTGACTTCCTCATCCCGGTC | 213 |
|
| Reverse |
TGGTTGGGCGATTTCCTTCA |
|
| PFK | Forward |
GGCATCTTCGACAGCAGGAA | 227 |
|
| Reverse |
TCAGCCACTGGTTGGAAGAC |
|
| ALDOA | Forward |
CTTGCTGAAGCCCAACATGG | 197 |
|
| Reverse |
GCAGGGGGCACTTGTTAATG |
|
| GAPDH | Forward |
GACCACAGTCCATGCCATCA | 213 |
|
| Reverse |
GTCAGGTCCACCACTGACAC |
|
| PGK | Forward |
AGAGGGAGCCAAGATTGTCA | 227 |
|
| Reverse |
ACACAATCTGCTTAGCCCGA |
|
| ENO1 | Forward |
ACCCAAAGAGGATCGCCAAG | 215 |
|
| Reverse |
AGTCTTGATCTGCCCAGTGC |
|
| TUBB | Forward |
TGTTCACTGGTACGTTGGGG | 171 |
|
| Reverse |
AGCAGCACCTTTGTGACGTT |
|
Apoptosis analysis by flow
cytometry
At 48 h, cells were prepared for Annexin
V-FITC/propidium iodide (PI) staining using the Beyotime apoptosis
kit (Beyotime Biotechnology; cat. no. C1062). After two washes with
cold PBS, cells were adjusted to ~1×10⁶ cells/ml in 500 µl
precooled 1X binding buffer. Annexin V-FITC (5 µl) was added for 15
min at room temperature (RT; 20–25°C), followed by 2.5 µl PI for a
further 5 min at RT in darkness. A minimum of 10,000 events was
acquired for each sample using a BD FACSCanto II flow cytometer (BD
Biosciences). FlowJo software (version 10.10.1; BD Biosciences) was
used for analysis and the reported total apoptotic fraction
combined early- and late-apoptotic populations.
JC-1 assessment of mitochondrial
membrane potential
For JC-1 imaging, HCCC-9810 cells were grown on
sterile coverslips in 24-well plates until they reached 60–70%
confluence. Following 48 h of treatment, the cells were rinsed with
PBS and exposed to 500 µl JC-1 working solution for 20 min at 37°C
in the dark. Two washes with JC-1 buffer were performed before
mounting in DAPI-containing antifade medium. Images were acquired
immediately on a Zeiss Axio Imager fluorescence microscope (Carl
Zeiss AG). The relative appearance of red aggregates and green
monomers was used qualitatively to assess mitochondrial
membrane-potential status.
Immunohistochemical staining and image
quantification
Tumor tissues were fixed in 4% paraformaldehyde,
dehydrated through graded ethanol, cleared, embedded in paraffin
and sectioned at 4 µm. Sections were deparaffinized in xylene and
rehydrated through graded ethanol. No permeabilization step was
performed. Sections were exposed to 3% hydrogen peroxide for 15 min
at room temperature (RT; 20–25°C) to suppress endogenous peroxidase
activity, followed by heat-mediated antigen retrieval in citrate
buffer (pH 6.0) for 10 min. After blocking with goat serum
(Beyotime Biotechnology; cat. no. C0265) for 30 min at RT, slides
were incubated at 4°C overnight with anti-ALDOA (Affinity
Biosciences; cat no. BF8051; 1:100) or anti-Ki67 (Abcam; cat no.
ab16667; 1:200). The slides were then washed in PBS and incubated
for 30 min at RT with HRP-conjugated goat anti-mouse IgG(H+L)
(Beyotime Biotechnology; cat. no. A0216; 1:50) or HRP-conjugated
goat anti-rabbit IgG(H+L) (Beyotime Biotechnology; cat. no. A0208;
1:50), as appropriate. Staining was developed using an Enhanced DAB
Horseradish Peroxidase Color Development Kit (Beyotime
Biotechnology; cat. no. P0201S), followed by hematoxylin
counterstaining for 10 min at RT. Images were captured using a
light microscope at ×400 magnification with unchanged microscope
and camera settings. From each section, five non-overlapping fields
at ×400 magnification were randomly sampled within viable tumor
tissue; areas showing necrosis, hemorrhage, folding, or tissue
edges were omitted. Semi-automated quantification was carried out
in Image-Pro Plus 6.0 (Media Cybernetics, Inc.). For each marker,
one color-segmentation threshold was defined and kept constant for
all images in the same staining batch. Viable tumor tissue
constituted the region of interest (ROI). Integrated optical
density (IOD) within that ROI was divided by ROI area for group
comparison, in line with optical-density-based IHC quantification
methods (24). Then, five-field
values were averaged to obtain one result per tumor and the mouse
was the biological replicate.
Subcutaneous xenograft model
Male BALB/c nude mice aged 5 weeks (17–19 g; n=12)
were obtained from Beijing Vital River Laboratory Animal Technology
Co., Ltd. and housed under specific-pathogen-free conditions at
22±2°C and 55±5% relative humidity on a 12-h light/dark cycle, with
free access to food and water. Mice were acclimated for 7 days
before the experiment and allocated to two groups (n=6 per group).
HCCC-9810 cells carrying stable Sh-NC or Sh-PBRM1 were prepared at
1×10⁵ cells and implanted subcutaneously in the dorsal flank.
Caliper monitoring began once tumors were palpable. Tumor volume
was calculated as 0.5 × length × width2 (25). The maximum tumor volume observed
during the study was 454 mm3, and the maximum measured
tumor diameter was 12 mm. For procedures requiring anesthesia
during the experiment, anesthesia was induced with 3% isoflurane in
an induction chamber and maintained with 1.5% isoflurane via a nose
cone; anesthetic depth was monitored by the toe-pinch reflex. At
the predefined endpoint, mice were deeply anesthetized by
intraperitoneal injection of sodium pentobarbital (150 mg/kg).
Following loss of the toe-pinch reflex, cervical dislocation was
immediately performed to ensure death before tissue collection.
Excised tumors were weighed and allocated for immunoblotting and
immunohistochemistry. The protocol complied with institutional
animal-care requirements and was approved by the Animal Ethics
Committee of Shandong Medical and Pharmaceutical University
Hospital (approval no. 2024-G013-01).
Statistical methods
GraphPad Prism 10.1.2 (Dotmatics) was used for data
analysis and figure preparation. Unless specified otherwise,
results are reported as mean ± SD from three independent biological
experiments. Simple end-point comparisons between two independent
groups used two-sided unpaired Student's t-tests. For the CCK-8
time series in Fig. 1K, treatment
and time were entered as factors in a two-way ANOVA, followed by
Šídák-adjusted pairwise comparisons. The glucose experiments in
Fig. 2A-C were evaluated with a
second two-way ANOVA using PBRM1 status and glucose concentration
as factors, again with Šídák adjustment. In Fig. 3B, control and Sh-PBRM1 values were
compared separately for each glycolysis-related gene using multiple
unpaired Student's t-tests followed by Holm-Šídák
multiple-comparison correction. The four-group analyses in Figs. 3E-G, 4B-E, H, and 6A-C used one-way ANOVA with Šídák
correction for the prespecified contrasts displayed in the figures.
For the NRF2 overexpression and knockdown time courses in Fig. 5, one-way ANOVA was followed by
Dunnett comparisons against 0 h. Xenograft end points in Fig. 7 were assessed with two-sided
unpaired Student's t-tests. P<0.05 was considered to indicate a
statistically significant difference.
 | Figure 6.NRF2 knockdown attenuates ALDOA
upregulation associated with PBRM1 knockdown. (A) RT-qPCR analysis
of ALDOA, NRF2 and PBRM1 mRNA in Sh-NC, Sh-NRF2, Sh-PBRM1 and
combined Sh-PBRM1/Sh-NRF2 groups. (B) Representative western
blotting and (C) densitometric quantification of ALDOA, NRF2 and
PBRM1 in the same groups. Tubulin served as the loading control.
For each analyte, one-way ANOVA followed by Šídák's
multiple-comparisons test was used for the prespecified comparisons
shown. Data are mean ± SD from three independent biological
experiments. *P<0.05; **P<0.01. NRF2, nuclear factor
erythroid 2-related factor 2; ALDOA, aldolase,
fructose-bisphosphate A; PBRM1, polybromo-1; RT-qPCR, reverse
transcription-quantitative PCR; Sh, short hairpin; NC, negative
control. |
Results
PBRM1 mutation profiling and
PBRM1-knockdown phenotypes in HCCC-9810 cells
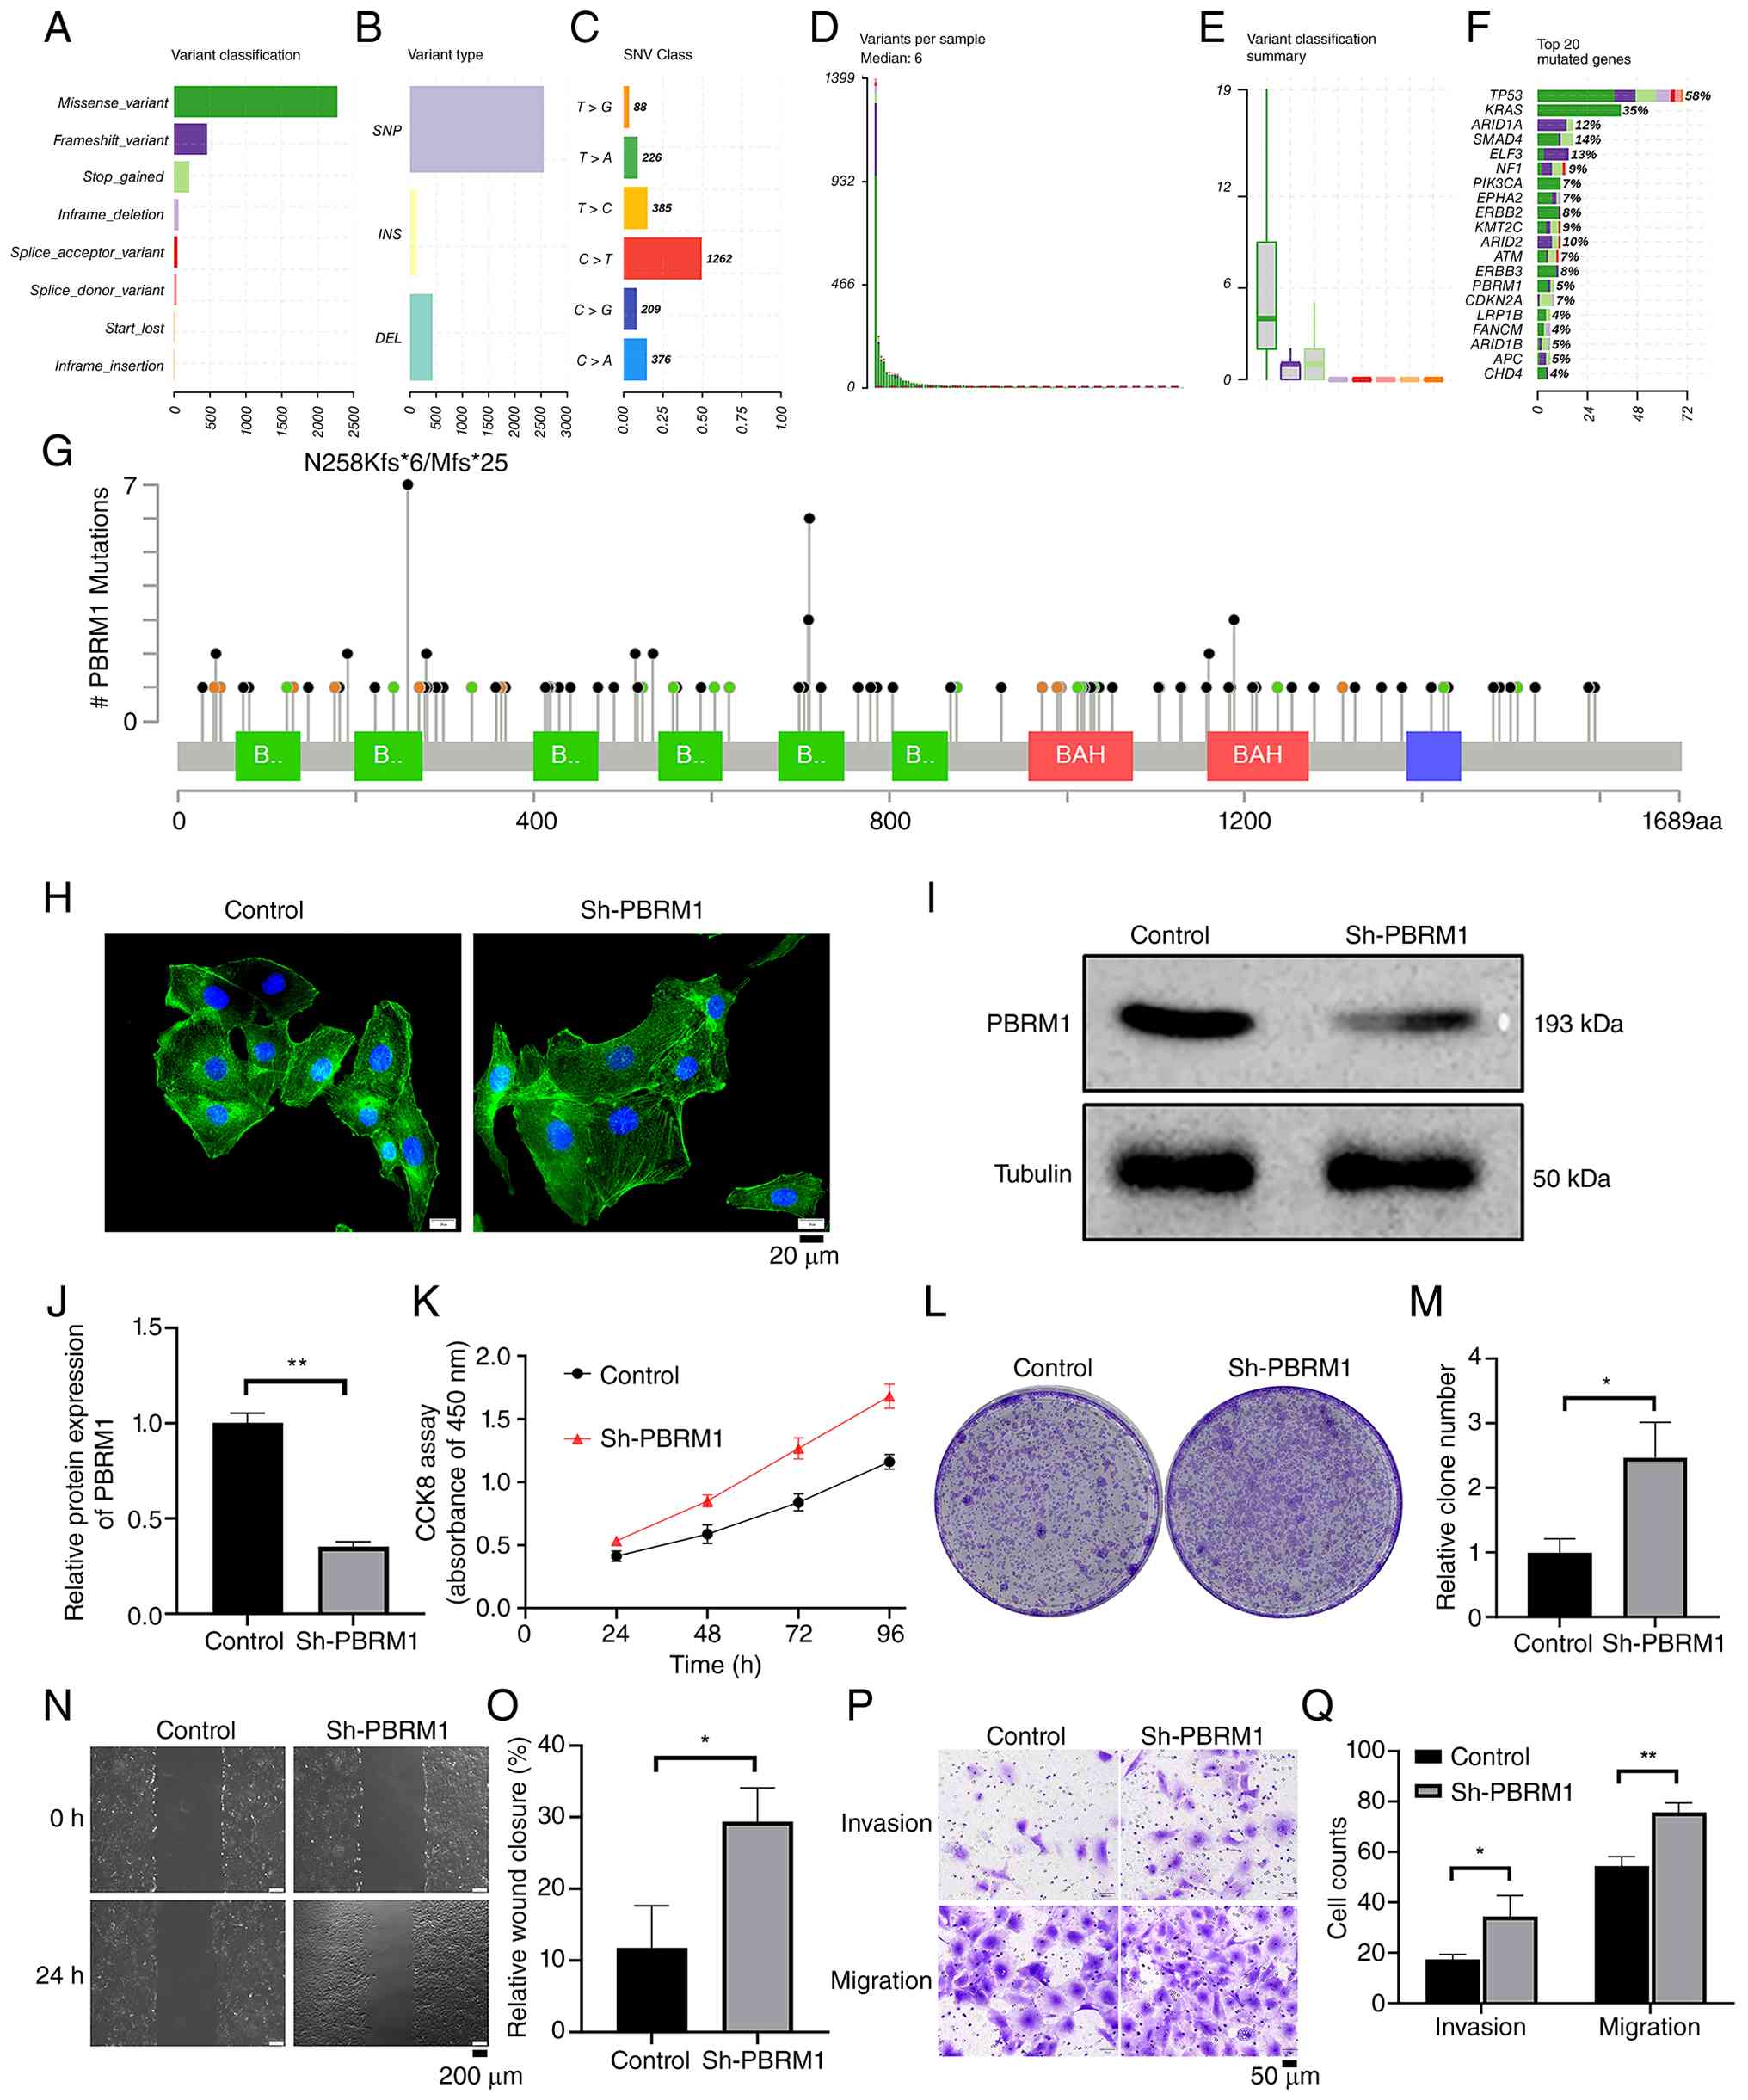
Fig. 1A-G presents
the mutation profile of the 203-case public ICC cohort. Panels A-E
summarize the overall distribution of mutation classes, variant
types, single-nucleotide substitutions, variants per case, and
related classification frequencies. The 20 most commonly altered
genes are shown in panel F; PBRM1 alterations occurred in ~5% of
the cohort. Panel G maps the detected PBRM1 variants across the
protein domain structure.
Immunoblotting and densitometry confirmed lower
PBRM1 abundance after Sh-PBRM1 transduction (Fig. 1I and J). Fig. 1H shows F-actin morphology in control
and PBRM1-knockdown cells. Compared with Sh-NC cells,
PBRM1-knockdown cells had higher CCK-8 signals, formed more
colonies, showed greater 24-h wound closure, and displayed
increased migration and invasion in Transwell assays (Fig. 1K-Q). Together, these assays indicate
enhanced proliferative and motile behavior in HCCC-9810 cells
following PBRM1 knockdown.
PBRM1 knockdown is associated with
altered glucose-metabolism readouts in HCCC-9810 cells
Control and PBRM1-knockdown HCCC-9810 cells were
studied under 11.1, 5, 0.5 or 0 mM glucose. PBRM1 knockdown
increased CCK-8 viability signals under reduced-glucose conditions
(Fig. 2A), with the clearest
separation at 0.5 and 0 mM glucose. ROS was analyzed as an
additional redox readout. In Fig.
2B, significant increases in the Sh-PBRM1 group were observed
at 0.5 and 0 mM glucose.
ATP levels also differed between groups at the
glucose concentrations marked as significant in Fig. 2C. PBRM1-knockdown cells showed
higher lactate and pyruvate levels than control cells (Fig. 2D-E). These results indicated altered
glucose-dependent viability and metabolic end points after PBRM1
knockdown.
PBRM1 knockdown is associated with
increased ALDOA expression
RT-qPCR of the glycolysis-related genes shown in
Fig. 3A and B demonstrated higher
ALDOA and ENO1 mRNA levels in PBRM1-knockdown cells, whereas the
other measured transcripts did not show significant changes.
Western blotting showed corresponding increases in ALDOA and ENO1
protein, while GAPDH and GLUT1 were not notably changed (Fig. 3C and D). These findings identified
ALDOA as a candidate downstream factor associated with PBRM1
knockdown in HCCC-9810 cells.
ALDOA-targeting shRNA reduced ALDOA mRNA and protein
in the PBRM1-knockdown setting (Fig.
3E-G). These experiments supported a functional association
between PBRM1 knockdown and ALDOA expression.
ALDOA knockdown attenuates phenotypes
associated with PBRM1 knockdown
ALDOA was co-silenced in PBRM1-knockdown HCCC-9810
cells to assess its contribution to the observed phenotype.
Compared with PBRM1 knockdown alone, co-silencing ALDOA reduced
colony formation and attenuated the increases in lactate, ROS and
ATP shown in Fig. 4A-E. These
findings indicated that ALDOA contributes to several metabolic and
growth-related changes associated with PBRM1 knockdown.
JC-1 imaging revealed a shift in the relative red
and green signals among the experimental groups (Fig. 4F), consistent with altered
mitochondrial membrane-potential status. Annexin V/PI analysis
provided a separate apoptosis readout. The reduced apoptotic
fraction observed after PBRM1 knockdown increased after ALDOA
co-silencing (Fig. 4G and H).
Together, these findings supported a functional contribution of
ALDOA to the metabolic and survival-related phenotype associated
with PBRM1 knockdown.
NRF2 perturbation alters ALDOA
expression in HCCC-9810 cells
Prior to assessing ALDOA responses, successful NRF2
knockdown and overexpression were confirmed in HCCC-9810 cells
transfected with Sh-NRF2 or OE-NRF2 alone, respectively. RT-qPCR
and western blotting showed lower NRF2 abundance following Sh-NRF2
transfection and higher NRF2 abundance after OE-NRF2 transfection
compared with their corresponding controls (Fig. S1). To examine whether NRF2
regulates ALDOA expression, ALDOA mRNA and protein were measured
following NRF2 overexpression or knockdown. NRF2 overexpression
produced a time-dependent increase in ALDOA mRNA and protein,
whereas NRF2 knockdown progressively reduced ALDOA expression
(Fig. 5A-F). Together, these
results supported an association between NRF2 activity and ALDOA
expression in HCCC-9810 cells.
NRF2 knockdown attenuates ALDOA
upregulation associated with PBRM1 knockdown
RT-qPCR showed that PBRM1 knockdown was associated
with increased NRF2 and ALDOA mRNA levels, whereas NRF2 knockdown
reduced ALDOA expression (Fig. 6A).
When NRF2 and PBRM1 were co-silenced, the increase in ALDOA
observed with PBRM1 knockdown alone was attenuated. Western
blotting showed the same overall pattern at the protein level
(Fig. 6B and C): PBRM1 knockdown
was associated with higher NRF2 and ALDOA abundance, whereas NRF2
co-silencing reduced ALDOA. These findings supported an
NRF2-dependent contribution to ALDOA upregulation in
PBRM1-knockdown HCCC-9810 cells, but they did not define the
upstream mechanism responsible for the increase in NRF2.
PBRM1 knockdown is associated with
increased tumor growth and higher ALDOA and Ki67 expression in
vivo
HCCC-9810-derived xenografts with stable PBRM1
knockdown showed greater tumor weight and volume than control
xenografts (Fig. 7A-C).
Tumor-tissue western blotting showed lower PBRM1 and higher ALDOA
abundance in the PBRM1-knockdown group (Fig. 7D and E). IHC also showed higher
ALDOA and Ki67 staining (Fig. 7F and
G). Semi-automated analysis of five non-overlapping
viable-tumor fields per tumor showed higher normalized IOD for both
markers. NRF2 was not measured in xenograft tissues; therefore,
these in vivo data do not test or establish a PBRM1-NRF2
relationship.
Discussion
The present study showed that PBRM1 knockdown is
associated with a tumor-promoting metabolic phenotype in HCCC-9810
ICC cells. ALDOA contributes to several of these changes. NRF2
perturbation altered ALDOA expression, and NRF2 co-silencing
attenuated the ALDOA increase associated with PBRM1 knockdown.
These findings supported an NRF2-dependent component of ALDOA
regulation in this experimental model.
Evidence from clear cell renal cell carcinoma
motivated the assessment of PBRM1-associated metabolism. Tang et
al (19) showed that loss of
PBRM1 in that tumor setting coincided with activation of AKT-mTOR
signaling and greater aerobic glycolysis. The present study asked a
related question in an ICC model without assuming that the same
mechanism would apply across tumor types. In HCCC-9810 cells, PBRM1
knockdown modified viability during glucose restriction and altered
ATP, lactate, pyruvate and ROS measurements. These observations are
compatible with metabolic reprogramming, although they do not
provide a direct measurement of metabolic flux.
Among the glycolysis-related genes examined, ALDOA
showed a prominent increase after PBRM1 knockdown. ALDOA is a
canonical glycolytic enzyme. In the present study, ALDOA knockdown
attenuated several growth, metabolic, mitochondrial and
apoptosis-related changes associated with PBRM1 knockdown. ALDOA
therefore represents one functional contributor to the
PBRM1-knockdown phenotype in this experimental system.
NRF2 coordinates cellular responses to oxidative
stress and can also influence metabolic pathways (26–30).
Manipulating NRF2 alone changed ALDOA expression, indicating that
the NRF2-ALDOA relationship was not restricted to the PBRM1
co-knockdown experiment. Reducing NRF2 also attenuated the ALDOA
increase observed after PBRM1 knockdown. The upstream basis for
increased NRF2 following PBRM1 knockdown remains unresolved and may
involve transcriptional regulation, KEAP1-dependent protein
stabilization, chromatin accessibility, or other mechanisms. The
present data therefore established only that NRF2 abundance
increased following PBRM1 knockdown; they do not distinguish among
these potential upstream mechanisms.
Taken together, the data supported a model-specific
relationship in which NRF2 contributes to ALDOA upregulation in
PBRM1-knockdown HCCC-9810 cells, while other transcriptional and
signaling inputs may also participate; they do not establish a
linear or fully resolved PBRM1-NRF2-ALDOA mechanism.
PBRM1-dependent chromatin regulation at the NRF2 or ALDOA loci was
not directly examined.
Clinical interpretation should remain limited at
this stage. The present study did not analyze patient survival,
treatment response, or other outcome-linked clinical variables.
Consequently, the present data do not establish PBRM1, NRF2, or
ALDOA as prognostic or predictive biomarkers in ICC. Their
potential clinical value will require testing in ICC cohorts with
detailed annotation and in additional preclinical systems.
The study has several limitations. Mechanistic
experi-ments were performed in a single ICC cell line and used one
PBRM1-targeting shRNA. Accordingly, the PBRM1- associated
NRF2/ALDOA findings should be interpreted as model-specific
observations in HCCC-9810 cells rather than as a general mechanism
of ICC and validation in independent ICC models and with
complementary genetic approaches is warranted. The upstream
mechanism linking PBRM1 knockdown to increased NRF2 remains to be
defined and direct NRF2 occupancy at the ALDOA promoter was not
assessed using a DNA-binding assay. In addition, NRF2 protein was
not quantified in xenograft tissues; accordingly, the PBRM1-NRF2
relationship is not extended to the in vivo setting, and the
xenograft conclusions are limited to the endpoints directly
measured: tumor growth, PBRM1, ALDOA and Ki67. The public mutation
cohort was clinically heterogeneous and was analyzed descriptively
rather than for prognostic or predictive associations.
Overall, PBRM1 knockdown in HCCC-9810 cells enhanced
tumor-associated behaviors and altered glucose-related metabolic
readouts. ALDOA contributed functionally to part of this phenotype,
and NRF2 manipulation supported an NRF2-dependent component of
ALDOA regulation. Together, these findings supported a
model-specific association among PBRM1 knockdown, increased NRF2
abundance and NRF2-dependent ALDOA regulation in HCCC-9810 cells,
rather than a generalized or fully resolved PBRM1-NRF2-ALDOA
mechanism in ICC and provided a basis for validation in additional
ICC systems.
Supplementary Material
Supporting Data
Acknowledgements
Not applicable.
Funding
Funding was provided by the National Natural Science Foundation
of China (grant no. 31640052) and the Natural Science Fund Project
of Shandong Province (grant no. ZR2014BH031).
Availability of data and materials
The data generated in the present study may be
requested from the corresponding author.
Authors' contributions
LZ was responsible for study conception and design.
DZ and DL carried out the experiments and acquired the data. Data
analysis and figure preparation were performed by DZ, SY and ZZ. DZ
and XZ prepared the initial manuscript draft. LZ and FZ provided
critical intellectual revision. DZ, DL and LZ confirm the
authenticity of all the raw data. All authors reviewed and approved
the final manuscript.
Ethics approval and consent to
participate
The Animal Ethics Committee of Shandong Medical and
Pharmaceutical University Hospital approved the animal protocol
(approval no. 2024-G013-01). All procedures were performed under
the institution's requirements for laboratory-animal care and
use.
Patient consent for publication
Not applicable.
Competing interests
The authors declare that they have no competing
interests.
References
|
1
|
Chung T and Park YN: Up-to-date pathologic
classification and molecular characteristics of intrahepatic
cholangiocarcinoma. Front Med (Lausanne). 9:8571402022. View Article : Google Scholar : PubMed/NCBI
|
|
2
|
Krenzien F, Nevermann N, Krombholz A,
Benzing C, Haber P, Fehrenbach U, Lurje G, Pelzer U, Pratschke J,
Schmelzle M and Schöning W: Treatment of intrahepatic
cholangiocarcinoma-A multidisciplinary approach. Cancers (Basel).
14:3622022. View Article : Google Scholar : PubMed/NCBI
|
|
3
|
Kupietzky A and Ariche A: Surgical aspects
of intrahepatic cholangiocarcinoma. Cancers (Basel). 14:62652022.
View Article : Google Scholar : PubMed/NCBI
|
|
4
|
Ma QJ, Wang FH, Yang NN, Wei HL and Liu F:
Rare primary squamous cell carcinoma of the intrahepatic bile duct:
A case report and review of literature. World J Clin Oncol.
15:936–944. 2024. View Article : Google Scholar : PubMed/NCBI
|
|
5
|
O'Bryan J, Sadagopan N, Winslow E, Radkani
P, Fishbein T, Banovac F, Cohen E, Hartley ML and He AR: Surgical
resection criteria and neoadjuvant therapies for intrahepatic
cholangiocarcinoma. Clin Adv Hematol Oncol. 21:584–591.
2023.PubMed/NCBI
|
|
6
|
Li XH, Zhao CY, Zhou EL and Lin XJ:
Efficacy and safety of adjuvant chemotherapy in T1N0M0 intrahepatic
cholangiocarcinoma after radical resection. BMC Cancer.
22:11592022. View Article : Google Scholar : PubMed/NCBI
|
|
7
|
Bekki Y, Von Ahrens D, Takahashi H,
Schwartz M and Gunasekaran G: Recurrent intrahepatic
cholangiocarcinoma-review. Front Oncol. 11:7768632021. View Article : Google Scholar : PubMed/NCBI
|
|
8
|
Phan LM, Yeung SC and Lee MH: Cancer
metabolic reprogramming: Importance, main features, and potentials
for precise targeted anti-cancer therapies. Cancer Biol Med.
11:1–19. 2014.PubMed/NCBI
|
|
9
|
Faubert B, Solmonson A and DeBerardinis
RJ: Metabolic reprogramming and cancer progression. Science.
368:eaaw54732020. View Article : Google Scholar : PubMed/NCBI
|
|
10
|
Nong S, Han X, Xiang Y, Qian Y, Wei Y,
Zhang T, Tian K, Shen K, Yang J and Ma X: Metabolic reprogramming
in cancer: Mechanisms and therapeutics. MedComm (2020). 4:e2182023.
View Article : Google Scholar : PubMed/NCBI
|
|
11
|
Raggi C, Taddei ML, Rae C, Braconi C and
Marra F: Metabolic reprogramming in cholangiocarcinoma. J Hepatol.
77:849–864. 2022. View Article : Google Scholar : PubMed/NCBI
|
|
12
|
Hao L, Li S, Peng Q, Zhang J, Deng J and
Hu X: Targeting glycolytic reprogramming in cholangiocarcinoma: A
novel approach for metabolic therapy. J Inflamm Res. 17:9665–9681.
2024. View Article : Google Scholar : PubMed/NCBI
|
|
13
|
Pant K, Richard S, Peixoto E and Gradilone
SA: Role of glucose metabolism reprogramming in the pathogenesis of
cholangiocarcinoma. Front Med (Lausanne). 7:1132020. View Article : Google Scholar : PubMed/NCBI
|
|
14
|
Yang SM, Kim J, Lee JY, Lee JS and Lee JM:
Regulation of glucose and glutamine metabolism to overcome
cisplatin resistance in intrahepatic cholangiocarcinoma. BMB Rep.
56:600–605. 2023. View Article : Google Scholar : PubMed/NCBI
|
|
15
|
Cai W, Su L, Liao L, Liu ZZ, Langbein L,
Dulaimi E, Testa JR, Uzzo RG, Zhong Z, Jiang W, et al: PBRM1 acts
as a p53 lysine-acetylation reader to suppress renal tumor growth.
Nat Commun. 10:58002019. View Article : Google Scholar : PubMed/NCBI
|
|
16
|
Aili A, Wen J, Xue L and Wang J:
Mutational analysis of PBRM1 and significance of PBRM1 mutation in
anti-PD-1 immunotherapy of clear cell renal cell carcinoma. Front
Oncol. 11:7127652021. View Article : Google Scholar : PubMed/NCBI
|
|
17
|
Zimmer K, Kocher F, Untergasser G, Kircher
B, Amann A, Baca Y, Xiu J, Korn WM, Berger MD, Lenz HJ, et al:
PBRM1 mutations might render a subtype of biliary tract cancers
sensitive to drugs targeting the DNA damage repair system. NPJ
Precis Oncol. 7:642023. View Article : Google Scholar : PubMed/NCBI
|
|
18
|
Ho PJ, Kweon J, Blumensaadt LA, Neely AE,
Kalika E, Leon DB, Oh S, Stringer CWP, Lloyd SM, Ren Z and Bao X:
Multi-omics integration identifies cell-state-specific repression
by PBRM1-PIAS1 cooperation. Cell Genom. 4:1004712024. View Article : Google Scholar : PubMed/NCBI
|
|
19
|
Tang Y, Jin YH, Li HL, Xin H, Chen JD, Li
XY and Pan YF: PBRM1 deficiency oncogenic addiction is associated
with activated AKT-mTOR signalling and aerobic glycolysis in clear
cell renal cell carcinoma cells. J Cell Mol Med. 26:3837–3849.
2022. View Article : Google Scholar : PubMed/NCBI
|
|
20
|
Feng H, Lane KA, Roumeliotis TI, Jeggo PA,
Somaiah N, Choudhary JS and Downs JA: PBAF loss leads to DNA
damage-induced inflammatory signaling through defective G2/M
checkpoint maintenance. Genes Dev. 36:790–806. 2022.(Epub ahead of
print). View Article : Google Scholar : PubMed/NCBI
|
|
21
|
Cerami E, Gao J, Dogrusoz U, Gross BE,
Sumer SO, Aksoy BA, Jacobsen A, Byrne CJ, Heuer ML, Larsson E, et
al: The cBio cancer genomics portal: An open platform for exploring
multidimensional cancer genomics data. Cancer Discov. 2:401–404.
2012. View Article : Google Scholar : PubMed/NCBI
|
|
22
|
Moore GE, Gerner RE and Franklin HA:
Culture of normal human leukocytes. JAMA. 199:519–524. 1967.
View Article : Google Scholar : PubMed/NCBI
|
|
23
|
Livak KJ and Schmittgen TD: Analysis of
relative gene expression data using real-time quantitative PCR and
the 2(−Delta Delta C(T)) method. Methods. 25:402–408. 2001.
View Article : Google Scholar : PubMed/NCBI
|
|
24
|
Seyed Jafari SM and Hunger RE: IHC optical
density score: A new practical method for quantitative
immunohistochemistry image analysis. Appl Immunohistochem Mol
Morphol. 25:e12–e13. 2017. View Article : Google Scholar : PubMed/NCBI
|
|
25
|
Tomayko MM and Reynolds CP: Determination
of subcutaneous tumor size in athymic (nude) mice. Cancer Chemother
Pharmacol. 24:148–154. 1989. View Article : Google Scholar : PubMed/NCBI
|
|
26
|
Ngo V and Duennwald ML: Nrf2 and oxidative
stress: A general overview of mechanisms and implications in human
disease. Antioxidants (Basel). 11:23452022. View Article : Google Scholar : PubMed/NCBI
|
|
27
|
Ma Q: Role of Nrf2 in oxidative stress and
toxicity. Annu Rev Pharmacol Toxicol. 53:401–426. 2013. View Article : Google Scholar : PubMed/NCBI
|
|
28
|
Esteras N, Blacker TS, Zherebtsov EA,
Stelmashuk OA, Zhang Y, Wigley WC, Duchen MR, Dinkova-Kostova AT
and Abramov AY: Nrf2 regulates glucose uptake and metabolism in
neurons and astrocytes. Redox Biol. 62:1026722023. View Article : Google Scholar : PubMed/NCBI
|
|
29
|
Tan VWT, Salmi TM, Karamalakis AP,
Gillespie A, Ong AJS, Balic JJ, Chan YC, Bladen CE, Brown KK,
Dawson MA and Cox AG: SLAM-ITseq identifies that Nrf2 induces liver
regeneration through the pentose phosphate pathway. Dev Cell.
59:898–910.e6. 2024. View Article : Google Scholar : PubMed/NCBI
|
|
30
|
Tripathi A, Dasgupta D, Dahabieh MS,
Griffard-Smith R, Pant A, Bugbee A, Yellapu NK, Burt E, Choi BHY,
Ellis AE, et al: Nrf2 drives activation-driven expansion of
CD4+T cells by modulating glucose and glutamine
metabolism. Cell Rep. 44:1161772025. View Article : Google Scholar : PubMed/NCBI
|