Introduction
Left-sided portal hypertension is a rare clinical
syndrome. While left-sided portal hypertension can be caused by
every disease entity involving extrahepatic portal vein system
obstruction or stricture, pancreatic diseases, such as pancreatitis
and pancreatic neoplasm are reported to be major etiologies
(1-4).
Left-sided portal hypertension can induce various clinical
manifestations, including abdominal pain and gastrointestinal
bleeding. An enlarged spleen is often observed in patients with
portal hypertension, although the incidence of an enlarged spleen
in left-sided portal hypertension has not yet been described, at
least to the best of our knowledge.
In solid tumors, an enlarged spleen or splenomegaly
is often observed following the administration of certain types of
chemotherapeutic agents (5,6).
Among these agents, oxaliplatin (L-OHP) is a well-known inducer of
splenic enlargement due to sinusoidal injury. Moreover, it has been
reported that the splenic volume prior to L-OHP treatment is
related to thrombocytopenia, as well as to prognosis. The increased
incidence of thrombocytopenia may be attributed to the splenic
sequestration of platelets, as well as to the direct suppression of
the bone marrow by the drug (6).
More recently, Aarnink et al evaluated the prognostic role
of splenic volume in patients with pancreatic cancer (PC) treated
with an L-OHP-containing regimen (FOLFIRINOX) [combination of
L-OHP, irinotecan (CPT-11) and fluorouracil (5-FU)] (7). In their study, they found that a
large pre-treatment splenic volume was an independent prognostic
indicator, together with other indicators, such as performance
status, liver metastasis and baseline tumour markers; however, the
mechanisms underlying the poor prognosis of patients with a large
splenic volume have not been clearly described. Moreover, the
clinical role of an enlarged spleen in patients with PC treated
with other chemotherapeutic regimens has not yet been evaluated, at
least to the best of our knowledge.
To determine this involvement, the present study
investigated the association between splenic volume and prognosis
in patients with PC treated with various chemotherapeutic
regimens.
Patients and methods
Study design and patient
treatment
A retrospective cohort study was conducted,
reviewing data from patients diagnosed with PC, including locally
advanced and metastatic disease, at Fukushima Medical University
between April, 2014 and December, 2019. Patients with
histopathologically confirmed PC with sufficient imaging data for
3D reconstruction and splenic volume measurement were included,
whereas those who were assumed to have PC based on imaging findings
or serum tumour marker levels were excluded from the study.
Patients who had a known diagnosis of chronic liver disease
(hepatitis, liver cirrhosis and hepatocellular carcinoma) were also
excluded. Additionally, patients with rare primary pancreatic
neoplasms, including acinar cell carcinoma or neuroendocrine
carcinoma, were excluded. Patients who underwent conversion surgery
were excluded. All patients were chemotherapy-naïve and standard
treatment with gemcitabine (GEM), S-1, gemcitabine plus S-1,
gemcitabine plus radiation therapy, gemcitabine plus nab-paclitaxel
(GnP) therapy or FOLFIRINOX (FFX) was initiated. Treatment with
gemcitabine or S-1 alone was defined as monotherapy, and the other
regimens were defined as combination therapy.
Adverse events were graded according to the Common
Terminology Criteria for Adverse Events version 5.0 (CTCAE ver.5)
(8). Severe hematotoxicity was
defined as adverse events of a grade >3 according to the CTCEA
ver.5. Treatment discontinuation was defined as the discontinuation
of treatment due to severe hematotoxicity at least once during the
treatment.
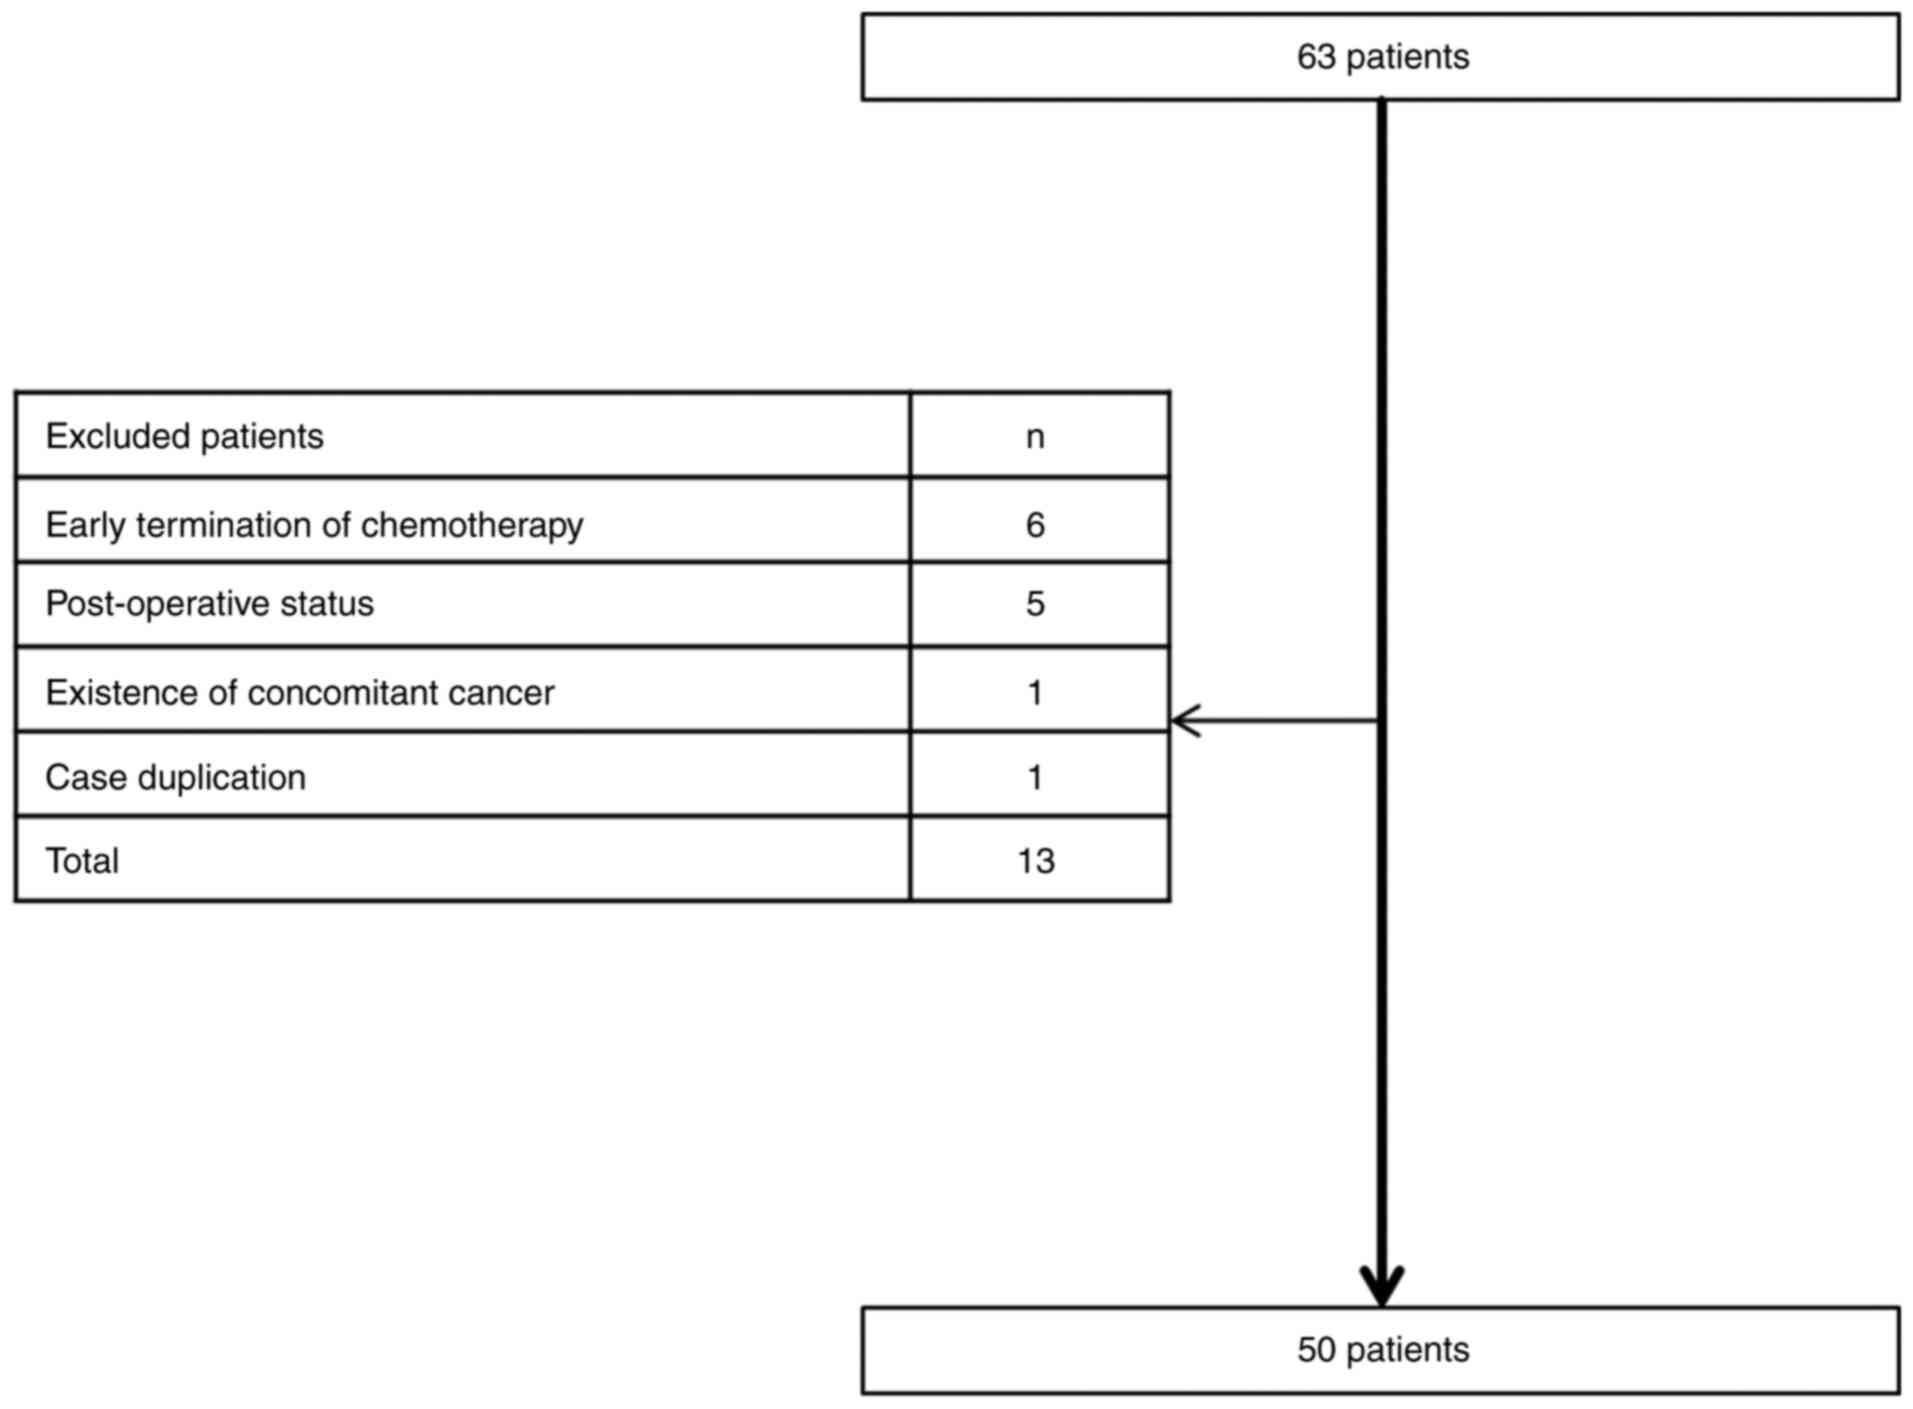
Splenic volume was first evaluated in 63 patients
who met the inclusion criteria mentioned above. Among the 63
patients, 13 patients were excluded from the evaluation due to the
following reasons: Early termination of the 1st cycle of
chemotherapy in 6 patients, post-operative status in 5 patients,
concomitant existence of another cancer in 1 patient and data
duplication in 1 patient (Fig. 1).
Ultimately, 50 patients were included in the present study. The
clinical background of the patients is summarized in Table I. Briefly, the median age was 66.0
years (range, 42.0-85.0 years), the median height was 150.5 cm
(range, 138.6-178.0 cm) and the median body weight was 48.7 kg
(range, 34.4-78.0 kg). The patients included 22 males and 28
females. A total of 23 were diagnosed with clinical stage III
disease (46.0%). The treatments included 1st-line chemotherapy with
gemcitabine monotherapy in 16 patients, S-1 monotherapy in 4
patients, GnP in 20 patients, FFX in 8 patients, gemcitabine plus
radiation therapy in 1 patient and gemcitabine plus S-1 in 1
patient.
 | Table IClinical characteristics of the
included patients. |
Table I
Clinical characteristics of the
included patients.
| Variables | Number of patients
(n=50) |
|---|
| Age, years | 66.0 (42.0-85.0) |
| Height (cm) | 159.5
(138.6-178.0) |
| Body weight (kg) | 48.7 (34.4-78.0) |
| Sex, male, n (%) | 22 (44.0) |
| Location of disease,
Ph, n (%) | 33 (66.0) |
| cStage, I-III, n
(%) | 23 (46.0) |
| Treatment | |
|
GEM | 16 |
|
S-1 | 4 |
|
GnP | 20 |
|
FFX | 8 |
|
GEM +
RT | 1 |
|
GS | 1 |
| Splenic volume
(cm3) | 138.2
(39.7-343.7) |
All clinicopathological data, including age, sex,
height, body weight, location of the disease, clinical stage, serum
levels of carcinoembryonic antigen (CEA) and carbohydrate antigen
19-9 (CA19-9), white blood cell counts, red blood cell counts,
platelet counts, the neutrophil-to-lymphocyte ratio (NLR), and
serum levels of aspartate aminotransferase (AST) and alanine
aminotransferase (ALT), were measured immediately prior to the
initial chemotherapy. Clinical stage was determined according to
the American Joint Committee on Cancer (AJCC)/Union for
International Cancer (UICC) staging system, version 8(9). The percentage of planned drug
intensity delivered for each drug was also calculated and reported
as the relative drug intensity (RDI). In a previous study, splenic
volume measured by CT scan was reported to be 127.4+62.9
cm3 (mean + 1 standard deviation) in the Japanese
population (10). Therefore, this
value was utilized to divide the patients into 2 groups as follows:
Group 1 (splenic size <127.4+62.9 cm3) and group 2
(splenic size ≥127.4+62.9 cm3).
The study protocol conformed to the ethical
guidelines of the 1975 Declaration of Helsinki and was approved by
the Institutional Review Board of Fukushima Medical University (IRB
#29254). The institutional review board waived the need for written
informed patient consent due to the retrospective and
non-interventional nature of the study.
CT imaging protocols
Abdominal CT examinations were performed with or
without contrast enhancement, with single- or triple-phase
scanning. The acquisition parameters were as follows: 64- and
320-channel multidetector row scanners (Aquilion 64 and Aquilion
one, Toshiba Medical Systems), helical scan mode, tube voltage of
135 kVp, variable tube current (in mA; autoexposure), 0.5
sec/rotation, 0.5 mm collimation, and a pitch of 41 for Aquilion 64
and 51 for Aquilion one. Images were reconstructed at a contiguous
axial 1 mm thickness. Contrast material was administered by an
intravenous injection of 100 ml using a power injector
(Nemotokyorindo) at a rate of 3.3 ml/sec with acquisition delays of
30 sec, 45 sec and 120 sec in dynamic CT or a rate of 1 ml/sec with
a 150-sec delay in single-phase CT.
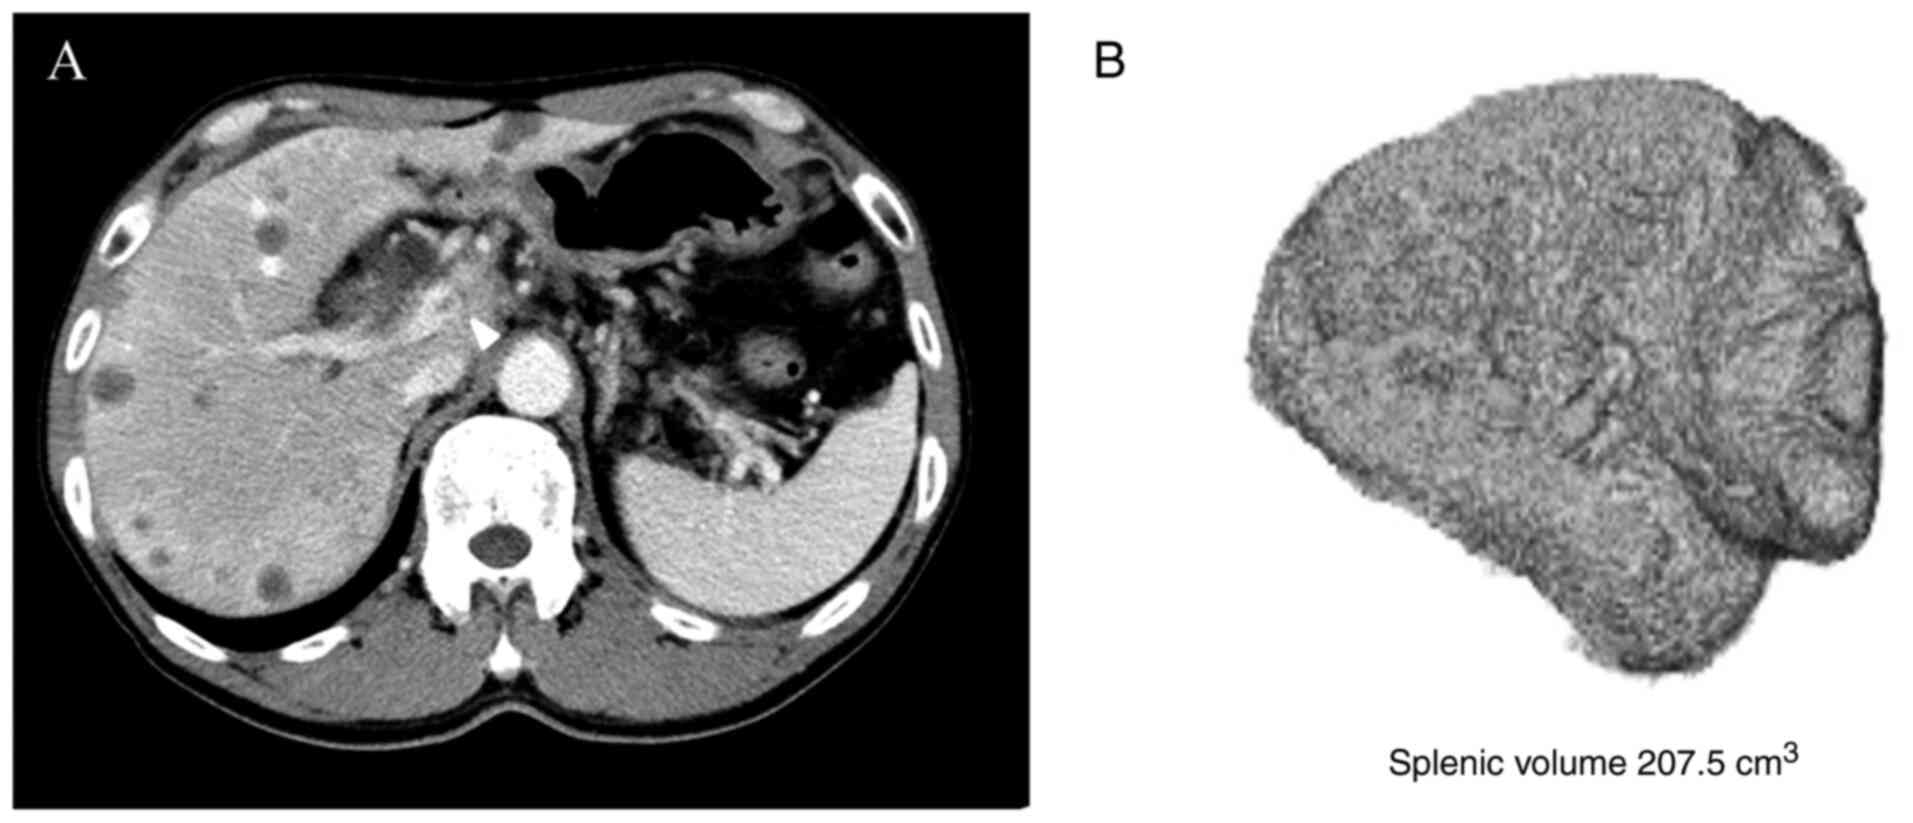
3D reconstruction and splenic volume
measurement
CT images obtained at the authors' institution and
before chemotherapy was commenced were included in the evaluation,
and the splenic volume was measured in 63 patients. The volume of
the spleen was measured with the volume rendering technique from a
1-mm slice of CT data using ziostation2 (Ziosoft Inc.). When the
correct image of the spleen was selected, the volume of the spleen
was calculated automatically (Fig.
2).
Assessment of vascular invasion
Invasion of the portal vein, supra mesenteric vein
and splenic vein was evaluated by board-certified radiologists with
19 years of experience in CT imaging. CT images were interpreted
using a multiplanar reformation tool that allows the assessment of
axial and coronal source images. The reader of the CT scan was also
blinded to all other information except the purpose of the present
study. To quantify the extent of vascular invasion, 0 points were
scored for no vascular involvement, 1 point for mild stricture of
vessels or contact without stricture, 2 points for severe stricture
and 3 points for vascular obstruction at the portal vein, supra
mesenteric vein and splenic vein, and the scores were added to
obtain the portal vein system invasion score (invasion score,
range, 0-9 points).
Statistical analyses
Continuous variables (i.e., age, height, body
weight, body surface area, CEA, CA19-9, WBC and platelets counts,
hemoglobin, NLR, AST, ALT and splenic volume) are reported as the
median and range and were compared using a Mann-Whitney test.
Categorical variables (i.e., sex, location of disease, cStage,
treatment and portal vein system invasion) were determined using
Fisher's exact test. Correlations between splenic volume and other
clinical variables were evaluated using Spearman's correlation
analysis. Progression-free survival (PFS) and overall survival (OS)
were calculated from the date of the initial day of chemotherapy to
the date of disease progression or any cause of mortality,
respectively. The association of each clinicopathological parameter
(age, sex, disease stage, serum levels of CEA and CA 19-9 and
splenic volume) with PFS and OS was investigated. Survival analysis
was performed using the Kaplan-Meier method with the log-rank test
in univariate analysis. Forward stepwise multivariate analysis was
performed to determine the influence of clinicopathological
variables. Cox regression analysis was used for multivariate
analysis, and hazard ratios (HRs) were calculated. Statistical
analyses were performed using SPSS version 26.0 for Windows (SPSS
Inc.), and figures were generated using Prism 7 (GraphPad, Inc.). A
P-value <0.05 was considered to indicate a statistically
significant difference.
Results
Clinical differences associated with
splenic volume
The patients were divided into group 1 (n=34) and
group 2 (n=16). The comparison of clinical characteristics between
the 2 groups revealed that invasion of the portal vein system
(portal vein, supra mesenteric vein and splenic vein) was more
frequently observed in group 2 than in group 1 (group 1 vs. group
2: Portal vein invasion, 26.4 vs. 62.5%, P=0.01; supra mesenteric
vein invasion, 32.3 vs. 75.0%, P=0.005; splenic vein invasion, 29.4
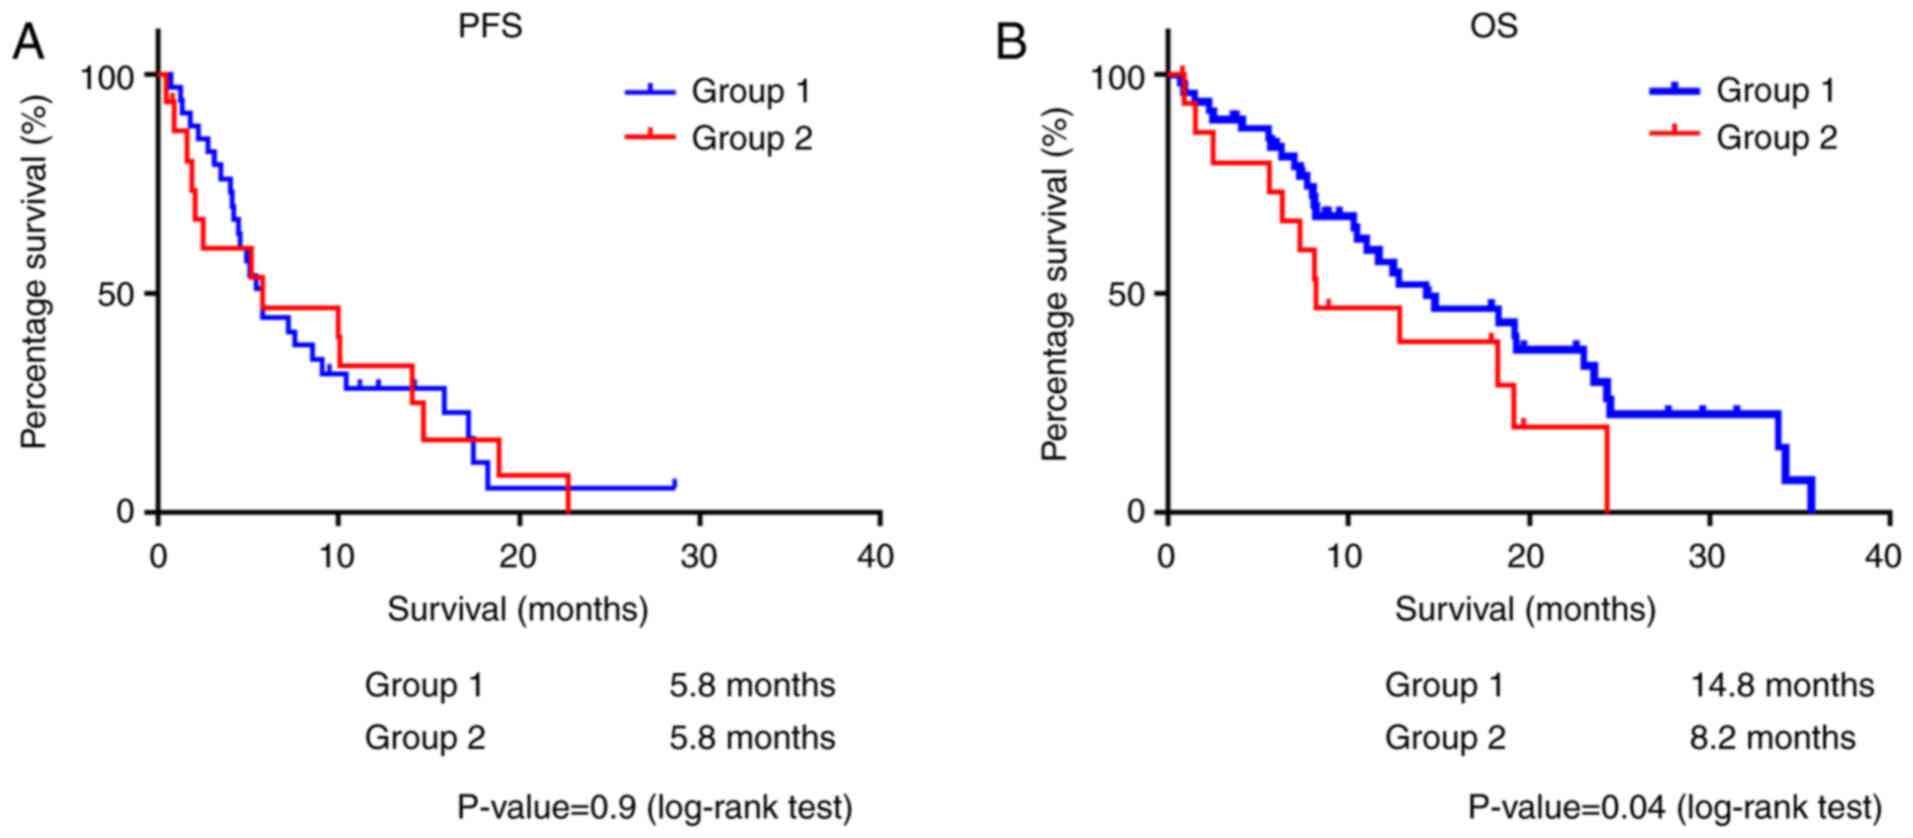
vs. 62.5%, P=0.02). Additionally, splenic volume was larger in
group 2 than in group 1 (median of 102.2 vs. 227.9 cm3,
P<0.001). No significant differences were observed in the other
variables (Table II). In the
survival analysis, splenic volume was related to a poor OS, while
no association with PFS was observed (group 1 vs. group 2: PFS, 5.8
vs. 5.8 months, P=0.9; OS, 14.8 vs. 8.2 months, P=0.04) (Fig. 3).
| Table IIComparison of clinical characteristics
between patients in groups 1 and 2. |
Table II
Comparison of clinical characteristics
between patients in groups 1 and 2.
| Variables | Group 1 (n=34) | Group 2 (n=16) | P-value |
|---|
| Age, years | 66.5 (42.0-85.0) | 63.5 (45.0-79.0) | 0.15 |
| Height (cm) | 159.5
(138.6-178.0) | 160.3
(146.0-177.6) | 0.98 |
| Body weight (kg) | 46.9 (34.4-72.4) | 54.5 (36.5-78.0) | 0.32 |
| Body surface area
(m2) | 1.5 (1.2-1.8) | 1.6 (1.3-1.9) | 0.35 |
| Sex, male, n (%) | 18 (52.9) | 10 (62.5) | 0.55 |
| Location of disease,
Ph, n (%) | 24 (70.5) | 9 (56.5) | 0.32 |
| cStage, I-III, n
(%) | 18 (52.9) | 7 (43.7) | 0.76 |
| Treatment,
monotherapy (%) | 13 (38.2) | 9 (56.2) | 0.36 |
| T-stage, T1-3
(%) | 11 (32.3) | 5 (31.2) | .99 |
| N-stage, N0 (%) | 6 (17.6) | 1 (6.2) | 0.40 |
| M-stage, M0 (%) | 13 (38.2) | 9 (56.2) | 0.36 |
| Portal vein invasion,
n (%) | 9 (26.4) | 10 (62.5) | 0.01 |
| Supra mesenteric vein
invasion, n (%) | 11 (32.3) | 12 (75.0) | 0.005 |
| Splenic vein
invasion, n (%) | 10 (29.4) | 10 (62.5) | 0.02 |
| CEA (ng/ml) | 4.3 (1.4-80.3) | 3.1
(1.2-1,738.0) | 0.05 |
| CA19-9 (U/ml) | 1,390.0
(0.3-69,527) | 185.3
(0.9-60,300) | 0.07 |
| WBCs
(/mm3) | 6,050.0
(3,500-14,900) | 5,100.0
(3,100.0-10,500.0) | 0.18 |
| Neutrophils
(/mm3) | 4,230.0
(2,052.0-12,814.0) | 3,417.0
(1,395.0-8,610.0) | 0.28 |
| Haemoglobin | 12.5
(8.1-15.1) | 13.0
(8.9-14.1) | 0.19 |
| Platelets
(x104/mm3) | 20.4
(8.6-48.0) | 18.8
(6.5-54.2) | 0.40 |
| NLR | 3.6 (1.4-9.6) | 3.7 (1.0-9.3) | 0.88 |
| AST (U/ml) | 20.0
(10.0-106.0) | 21.0
(16.0-220.0) | 0.44 |
| ALT (U/ml) | 20.5
(7.0-238.0) | 25.0
(8.0-213.0) | 0.50 |
| Splenic volume
(cm3) | 102.2
(39.7-175.3) | 227.9
(190.1-343.7) | <0.001 |
Prognostic indicators in PC
To clarify the role of splenic volume as a
prognostic indicator in PC, uni- and multivariate analyses were
conducted using several clinical variables together with splenic
volume. First, univariate Kaplan-Meier survival analysis of PFS and
OS was conducted. In terms of PFS, treatment (monotherapy vs.
combination therapy, median of 4.5 vs. 9.1 months, P=0.009) and
M-stage (M0 vs. M1, median of 10.4 vs. 4.6 months, P=0.01) were
found to be related to prognosis. In terms of OS, treatment
(monotherapy vs. combination therapy, median of 7.7 vs. 23.0
months, P=0.00006), N-stage (N0 vs. N1-2, median of 18.3 vs. 8.2
months, P=0.03), M-stage (M0 vs. M1, median of 23.0 vs. 10.5
months, P=0.01) and splenic volume (group 1 vs. group 2, median of
14.8 vs. 8.2 months, P=0.04) were related to prognosis (Table III).
| Table IIIResults of survival analysis. |
Table III
Results of survival analysis.
| | PFS | OS |
|---|
| | 95% CI | | | 95% CI | |
|---|
| Variables | Median | Lower limit | Upper limit | P-value | Median | Lower limit | Upper limit | P-value |
|---|
| Age, years | | | | 0.93 | | | | 0.35 |
|
≤65.0 | 5.8 | 2.7 | 8.8 | | 18.3 | 10.5 | 26.1 | |
|
>65.0 | 5.8 | 2.0 | 8.8 | | 12.5 | 6.7 | 18.2 | |
| Sex | | | | 0.10 | | | | 0.64 |
|
Male | 5.8 | 5.1 | 6.4 | | 18.3 | 9.4 | 27.2 | |
|
Female | 4.6 | 0.0 | 10.6 | | 14.3 | 6.6 | 21.9 | |
| Treatment | | | | 0.009 | | | | 0.00006 |
|
Monotherapy | 4.5 | 3.4 | 5.6 | | 7.7 | 6.3 | 9.0 | |
|
Combination
therapy | 9.1 | 5.6 | 12.6 | | 23.0 | 17.9 | 28.9 | |
| Location | | | | 0.91 | | | | 0.91 |
|
Pbt | 7.2 | 3.1 | 11.7 | | 10.5 | 0.00 | 22.1 | |
|
Ph | 5.2 | 4.1 | 6.2 | | 14.3 | 7.5 | 21.0 | |
| T-stage | | | | 0.96 | | | | 0.86 |
|
T1-3 | 5.4 | 3.2 | 7.5 | | 19.2 | 6.0 | 32.3 | |
|
T4 | 5.8 | 2.9 | 8.6 | | 14.2 | 9.3 | 19.2 | |
| N-stage | | | | 0.87 | | | | 0.03 |
|
N0 | 5.8 | 2.8 | 8.7 | | 18.3 | 10.2 | 26.3 | |
|
N1-2 | 4.9 | 0.0 | 10.2 | | 8.2 | 5.7 | 10.6 | |
| M-stage | | | | 0.01 | | | | 0.01 |
|
M0 | 10.4 | 5.6 | 15.2 | | 23.0 | 16.1 | 29.8 | |
|
M1 | 4.6 | 3.4 | 5.7 | | 10.5 | 6.5 | 13.4 | |
| CEA (ng/ml) | | | | 0.16 | | | | 0.39 |
|
≤5.0 | 5.2 | 3.2 | 7.2 | | 12.8 | 3.7 | 21.8 | |
|
>5.0 | 5.8 | 3.0 | 8.6 | | 14.8 | 13.6 | 15.9 | |
| CA19-9 (U/ml) | | | | 0.65 | | | | 0.57 |
|
≤37.0 | 5.8 | 0.0 | 12.8 | | | Not determined | | |
|
>37.0 | 5.8 | 3.2 | 8.4 | | 14.3 | 7.4 | 21.1 | |
| Splenic volume | | | | 0.95 | | | | 0.04 |
|
Group 1 | 5.8 | 4.5 | 7.0 | | 14.8 | 3.6 | 25.9 | |
|
Group 2 | 5.8 | 0.00 | 15.2 | | 8.2 | 1.6 | 14.7 | |
The results of multivariate Cox regression analysis
confirmed that treatment (P=0.007) and M-stage (P=0.009) were
significantly associated with PFS (Table IV). Additionally, treatment
(P=0003), N-stage (P=0.0001), M-stage (P=0.0001) and splenic volume
(P=0.001) were significantly associated with OS. Splenic volume was
considered an independent prognostic factor for OS in PC (Table IV).
| Table IVResults of multivariate Cox
regression analysis. |
Table IV
Results of multivariate Cox
regression analysis.
| | PFS |
|---|
| | 95% CI | |
|---|
| Variables | HR | Lower limit | Upper limit | P-value |
|---|
| Chemotherapeutic
regimen | | | | 0.007 |
|
Monotherapy | 1 | | | |
|
Combination
therapy | 0.38 | 0.18 | 0.76 | |
| M-stage, M0
(%) | | | | 0.009 |
|
M1 | 1 | | | |
|
M0 | 0.40 | 0.20 | 0.79 | |
| | OS |
| | 95% CI | |
| Variables | HR | Lower limit | Upper limit | P-value |
| Chemotherapeutic
regimen | | | | 0.0003 |
|
Monotherapy | 1 | | | |
|
Combination
therapy | 0.14 | 0.05 | 0.35 | |
| N-stage, N0
(%) | | | | 0.0001 |
|
N1-2 | 1 | | | |
|
N0 | 0.35 | 0.14 | 0.91 | |
| M-stage, M0
(%) | | | | 0.0001 |
|
M1 | 1 | | | |
|
M0 | 0.17 | 0.07 | 0.42 | |
| Splenic volume | | | | 0.001 |
|
Group 2 | 1 | | | |
|
Group 1 | 0.25 | 0.11 | 0.58 | |
Clinical variables related to splenic
volume
To elucidate the mechanisms through which splenic
volume affects prognosis in PC, clinical variables related to
splenic volume were investigated. First, the results of the
correlation analysis revealed that splenic volume positively
correlated to body weight (r=0.33, P=0.02) and the portal system
invasion score (r=0.5, P=0.0002), but negatively correlated with
the WBC count (r=-0.39). No significant correlation was observed
between the systemic inflammation marker, NLR, and splenic volume
(P=0.49) (Table V and Fig. S1). In a comparative analysis of
severe hematotoxicity, severe thrombocytopenia was more frequently
observed in group 2 than in group 1 (8.8 vs. 37.5%, P=0.02)
(Table VI). As consequence,
treatment discontinuation was more frequently observed in group 2
compared with group 1 (78% vs. 47%, P<0.0001). Finally, the RDI
was compared between the 2 groups, and it was found that the RDI of
nab-PTX was significantly lower in group 2 than in group 1 (median
of 59.7 vs. 25.2%, P=0.009). As regards other chemotherapeutic
agents, no significant differences were observed between the 2
groups (Table VII).
| Table VCorrelation of splenic volume and
other clinical variables. |
Table V
Correlation of splenic volume and
other clinical variables.
| | Age | Height | Weight | WBCs | NLR | CRP | Invasion score |
|---|
| Spearman's r | -0.18 | -0.03 | 0.33 | -0.39 | -0.01 | 0.08 | 0.5 |
| P-value
(two-tailed) | 0.21 | 0.84 | 0.02 | 0.0049 | 0.49 | 0.58 | 0.0002 |
| Table VIComparison of severe hematotoxicity
between group 1 and group 2. |
Table VI
Comparison of severe hematotoxicity
between group 1 and group 2.
| | Group 1 (%) | Group 2 (%) | P-value |
|---|
| Leukopenia | 17.6 | 22.2 | 0.72 |
| Neutropenia | 20.6 | 18.8 | 0.99 |
| Anaemia | 0 | 0 | 1.00 |
|
Thrombocytopenia | 8.8 | 37.5 | 0.02 |
| Table VIIRelative dose intensity of
chemotherapeutic agents. |
Table VII
Relative dose intensity of
chemotherapeutic agents.
| | Group 1 (%) | Group 2 (%) | P-value |
|---|
| GEM | 64.5 | 55.8 | 0.31 |
| Nab-PTX | 59.7 | 25.2 | 0.009 |
| L-OHP | 74.0 | 55.0 | 0.39 |
| CPT-11 | 84.0 | 62.0 | 0.57 |
| 5-FU | 84.0 | 93.0 | 0.78 |
Discussion
In the present study, it was demonstrated that a
large splenic volume was an independent prognostic indicator of the
OS of patients with PC, which may be attributed to an increased
incidence of severe thrombocytopenia and a reduced RDI of nab-PTX.
To the best of our knowledge, the present study is the first to
clarify the prognostic role of splenic volume in patients with PC
treated with chemotherapy and elucidate the potential underlying
mechanism.
PC is one of the most lethal malignancies worldwide,
as the majority of PC cases are not indicated for curative
resection at the time of diagnosis and are treated with palliative
chemotherapy (11,12). At the present time, several
regimens are considered to be standard treatments, and
practitioners can select one of these as an initial treatment
considering the patient's general condition (13-15).
With combination therapy, such as FFX or GnP, the median OS period
can be expected to be almost 1 year even in patients with
metastatic disease; however, the management of severe
hematotoxicity, febrile neutropenia or spontaneous bleeding caused
by severe thrombocytopenia is important for physicians to obtain
the maximum benefit of chemotherapy. Currently, UGT1A1 polymorphism
is the only marker utilized in routine practice to predict adverse
events in patients who are treated with a CPT-11-containing regimen
such as FOLFIRINOX (16,17). On the other hand, UGT1A1
polymorphism is not useful in other regimens, and no predictive
factor exists at this time.
Splenic volume in patients with solid tumors may be
influenced by sex, age and underlying chronic inflammation
(10,18). Chronic inflammation has been
considered to be linked to tumor progression in various types of
cancer, since it can promote cancer growth and negatively affect
the immune system by inducing the activation of immune suppressor
cells (19-22).
However, the present study could not find an association between
splenic volume and systemic inflammation indices (e.g., WBC, CRP
and NLR). On the other hand, splenic volume positively correlated
with the invasion score, which indicated that an enlarged splenic
volume may be derived from left-sided portal hypertension caused by
PC vascular invasion. As a consequence of splenic sequestration,
severe thrombocytopenia was considered to be frequently observed in
patients with an enlarged splenic volume, which may influence the
decreased RDI of chemotherapeutic agents. Considering the decreased
RDI for the 1st line treatment, it was hypothesized that PFS may be
affected by splenic volume. However, splenic volume was shown to be
an independent prognostic indicator for OS, but not for PFS. Since
there were no significant differences in most of the clinical
variables between the 2 groups, the mechanisms through which
splenic volume influences OS are not clear. Perhaps non-hematologic
adverse events were more frequently observed in patients with
larger splenic volumes during 1st-line treatment, and the patients
eventually could not tolerate further treatment after treatment
failure.
The present study had several limitations. First,
the present study was conducted at a single referral center, and
the results may not be generalizable to all patients with PC. The
small sample size also limited the reliability of our statistical
analysis. Second, the present study could not evaluate the
prognostic role of splenic volume for each chemotherapeutic regimen
since the number of patients was limited. Therefore, additional
studies including a larger number of patients with various clinical
backgrounds are warranted.
In conclusion, splenic volume may be a predictive
factor for severe thrombocytopenia and may be a long-term
prognostic indicator for patients with PC.
Supplementary Material
Results of correlation analysis
between splenic volume and other clinical variables are shown.
Acknowledgements
The authors gratefully acknowledge the work of past
and present members of the Department of Gastroenterology,
Fukushima Medical University School of Medicine, Fukushima,
Japan.
Funding
No funding was received.
Availability of data and material
All data generated or analyzed during the present
study are included in the published article.
Authors' contributions
RS designed the study. RS and SI wrote the
manuscript. RS, SI and HW analyzed the data. RS, SI, HW, TT, MS,
YS, JN, MT, TK, MH, TH, HI and HO contributed to patient care. All
authors read and approved the final manuscript.
Ethics approval and consent to
participate
The study protocol conformed to the ethical
guidelines of the 1975 Declaration of Helsinki and was approved by
the institutional Review Committee of Fukushima Medical University
(Fukushima, Japan; IRB #29254). The institutional review board
waived the need for written informed patient consent because of the
retrospective and non-interventional nature of the study.
Patient consent for publication
Not applicable.
Competing of interests
The authors declare that they have no competing
interests.
References
|
1
|
Hwang TL, Jan YY, Jeng LB, Chen MF, Hung
CF and Chiu CT: The different manifestation and outcome between
pancreatitis and pancreatic malignancy with left-sided portal
hypertension. Int Surg. 84:209–212. 1999.PubMed/NCBI
|
|
2
|
Koklu S, Yuksel O, Arhan M, Coban S, Başar
O, Yolcu OF, Uçar E, Ibiş M, Ertugrul I and Sahin B: Report of 24
left-sided portal hypertension cases: A single-center prospective
cohort study. Dig Dis Sci. 50:976–982. 2005.PubMed/NCBI View Article : Google Scholar
|
|
3
|
Sakorafas GH, Sarr MG, Farley DR and
Farnell MB: The significance of sinistral portal hypertension
complicating chronic pancreatitis. Am J Surg. 179:129–133.
2000.PubMed/NCBI View Article : Google Scholar
|
|
4
|
Turrill FL and Mikkelsen WP: ‘Sinistral’
(left-sided) extrahepatic portal hypertension. Arch Surg.
99:365–368. 1969.PubMed/NCBI View Article : Google Scholar
|
|
5
|
Hubert C, Sempoux C, Humblet Y, van den
Eynde M, Zech F, Leclercq I and Gigot JF: Sinusoidal obstruction
syndrome (SOS) related to chemotherapy for colorectal liver
metastases: Factors predictive of severe SOS lesions and protective
effect of bevacizumab. HPB (Oxford). 15:858–864. 2013.PubMed/NCBI View Article : Google Scholar
|
|
6
|
Overman MJ, Maru DM, Charnsangavej C,
Loyer EM, Wang H, Pathak P, Eng C, Hoff PM, Vauthey JN, Wolff RA
and Kopetz S: Oxaliplatin-mediated increase in spleen size as a
biomarker for the development of hepatic sinusoidal injury. J Clin
Oncol. 28:2549–2555. 2010.PubMed/NCBI View Article : Google Scholar
|
|
7
|
Aarnink A, Richard C, Truntzer C, Vincent
J, Bengrine L, Vienot A, Borg C and Ghiringhelli F: Baseline
splenic volume as a surrogate marker of FOLFIRINOX efficacy in
advanced pancreatic carcinoma. Oncotarget. 9:25617–25629.
2018.PubMed/NCBI View Article : Google Scholar
|
|
8
|
Common Terminology Criteria for Adverse
Events(CTCAE), version 5.0. US Department of Health and Human
Services, 2017. urihttps://ctep.cancer.gov/protocoldevelopment/electronic_applications/docs/CTCAE_v5_Quick_Reference_5x7.pdfsimplehttps://ctep.cancer.gov/protocoldevelopment/electronic_applications/docs/CTCAE_v5_Quick_Reference_5x7.pdf.
Accessed November 27, 2017.
|
|
9
|
Kamarajah SK, Burns WR, Frankel TL, Cho CS
and Nathan H: Validation of the American joint commission on cancer
(AJCC) 8th edition staging system for patients with pancreatic
adenocarcinoma: A surveillance, epidemiology and end results (SEER)
analysis. Ann Surg Oncol. 24:2023–2030. 2017.PubMed/NCBI View Article : Google Scholar
|
|
10
|
Harris A, Kamishima T, Hao HY, Kato F,
Omatsu T, Onodera Y, Terae S and Shirato H: Splenic volume
measurements on computed tomography utilizing automatically
contouring software and its relationship with age, gender, and
anthropometric parameters. Eur J Radiol. 75:e97–e101.
2010.PubMed/NCBI View Article : Google Scholar
|
|
11
|
Global Burden of Disease Cancer
Collaboration. Fitzmaurice C, Abate D, Abbasi N, Abbastabar H, Abd
Allah F, Abdel Rahman O, Abdelalim A, Abdoli A, Abdollahpour I, et
al: Global, regional, and national cancer incidence, mortality,
years of life lost, years lived with disability, and
disability-adjusted life-years for 29 cancer groups, 1990 to 2017:
A systematic analysis for the global burden of disease study. JAMA
Oncol. 5:1749–1768. 2019.PubMed/NCBI View Article : Google Scholar
|
|
12
|
Siegel RL, Miller KD and Jemal A: Cancer
statistics, 2019. CA Cancer J Clin. 69:7–34. 2019.PubMed/NCBI View Article : Google Scholar
|
|
13
|
Conroy T, Desseigne F, Ychou M, Bouché O,
Guimbaud R, Bécouarn Y, Adenis A, Raoul JL, Gourgou Bourgade S, de
la Fouchardière C, et al: FOLFIRINOX versus gemcitabine for
metastatic pancreatic cancer. N Engl J Med. 364:1817–1825.
2011.PubMed/NCBI View Article : Google Scholar
|
|
14
|
Von Hoff DD, Ervin T, Arena FP, Chiorean
EG, Infante J, Moore M, Seay T, Tjulandin SA, Ma WW, Saleh MN, et
al: Increased survival in pancreatic cancer with nab-paclitaxel
plus gemcitabine. N Engl J Med. 369:1691–1703. 2013.PubMed/NCBI View Article : Google Scholar
|
|
15
|
Ueno H, Ioka T, Ikeda M, Ohkawa S,
Yanagimoto H, Boku N, Fukutomi A, Sugimori K, Baba H, Yamao K, et
al: Randomized phase III study of gemcitabine plus S-1, S-1 alone,
or gemcitabine alone in patients with locally advanced and
metastatic pancreatic cancer in Japan and Taiwan: GEST study. J
Clin Oncol. 31:1640–1648. 2013.PubMed/NCBI View Article : Google Scholar
|
|
16
|
Shirasu H, Todaka A, Omae K, Fujii H,
Mizuno N, Ozaka M, Ueno H, Kobayashi S, Uesugi K, Kobayashi N, et
al: Impact of UGT1A1 genetic polymorphism on toxicity in
unresectable pancreatic cancer patients undergoing FOLFIRINOX.
Cancer Sci. 110:707–716. 2019.PubMed/NCBI View Article : Google Scholar
|
|
17
|
Takahara N, Nakai Y, Isayama H, Sasaki T,
Satoh Y, Takai D, Hamada T, Uchino R, Mizuno S, Miyabayashi K, et
al: Uridine diphosphate glucuronosyl transferase 1 family
polypeptide A1 gene (UGT1A1) polymorphisms are associated with
toxicity and efficacy in irinotecan monotherapy for refractory
pancreatic cancer. Cancer Chemother Pharmacol. 71:85–92.
2013.PubMed/NCBI View Article : Google Scholar
|
|
18
|
Prassopoulos P, Daskalogiannaki M,
Raissaki M, Hatjidakis A and Gourtsoyiannis N: Determination of
normal splenic volume on computed tomography in relation to age,
gender and body habitus. Eur Radiol. 7:246–248. 1997.PubMed/NCBI View Article : Google Scholar
|
|
19
|
Gabrilovich DI: Myeloid-derived suppressor
cells. Cancer Immunol Res. 5:3–8. 2017.PubMed/NCBI View Article : Google Scholar
|
|
20
|
Kumar V, Patel S, Tcyganov E and
Gabrilovich DI: The nature of myeloid-derived suppressor cells in
the tumor microenvironment. Trends Immunol. 37:208–220.
2016.PubMed/NCBI View Article : Google Scholar
|
|
21
|
Padoan A, Plebani M and Basso D:
Inflammation and pancreatic cancer: Focus on metabolism, cytokines,
and immunity. Int J Mol Sci. 20(676)2019.PubMed/NCBI View Article : Google Scholar
|
|
22
|
Shalapour S and Karin M: Pas de Deux:
Control of anti-tumor immunity by cancer-associated inflammation.
Immunity. 51:15–26. 2019.PubMed/NCBI View Article : Google Scholar
|