Introduction
Tyrosine O-sulfation was first described approximately 70 years ago as a post-translational modification of fibrinogen. At the beginning of the 1980s, it was found to be a common modification where a sulfate group is added to a tyrosine moiety in eukaryotes (1,2). It has then been reported that approximately 1% of proteins undergo tyrosine O-sulfation, a post-translational modification catalyzed by enzymes termed tyrosyl protein sulfotransferases (TPSTs) in the trans-Golgi network (3).
The biological function of tyrosine sulfation includes the modulation of protein-protein interaction, proteolytic processing and the secretion rates of secretory proteins (4-7). It has been reported that tyrosine-sulfated proteins play an important role in infectious diseases, cancer, atherosclerosis and autoimmune diseases (4,8-10). Given the importance of modification, much effort has been paid to the detection of protein tyrosine sulfation and to the identification of the sulfation sites that establish effects on protein activity (11-13). However, the development of detection methods is hindered due to the lack of available antibodies and the lability of this modification in proteins (14-18).
Recently, the serum level of O-sulfotyrosine, one of the sulfated metabolites with molecular weight of 261 kDa, was reported to be associated with a decline in renal function, independent of the relevant clinical covariates in patients with type 1 diabetes with impaired kidney function (19). This revealed an association between the serum O-sulfotyrosine level and the pathological state, and suggests a potential diagnostic value of serum O-sulfotyrosine for certain diseases. The method for determining the O-sulfotyrosine levels has not yet been well reported, at least to the best of our knowledge. The present study describes a sensitive and reproducible method for the relative quantitative analysis of human plasma O-sulfotyrosine levels using high performance liquid chromatography (HPLC)-tandem mass spectrometry (MS/MS), which may be the basis for future studies.
Materials and methods
Standards, reagents and solvents
The O-sulfotyrosine standard was purchased from Bachem (E-3645.0001). The chemical structure of O-sulfotyrosine is presented in Fig. 1. HPLC-grade methanol (MeOH) was purchased from Thermo Fisher Scientific, Inc. HPLC-grade acetonitrile (ACN) was purchased from Sigma-Aldrich; Merck KGaA. HPLC-grade formic acid (FA) was obtained from Honeywell.
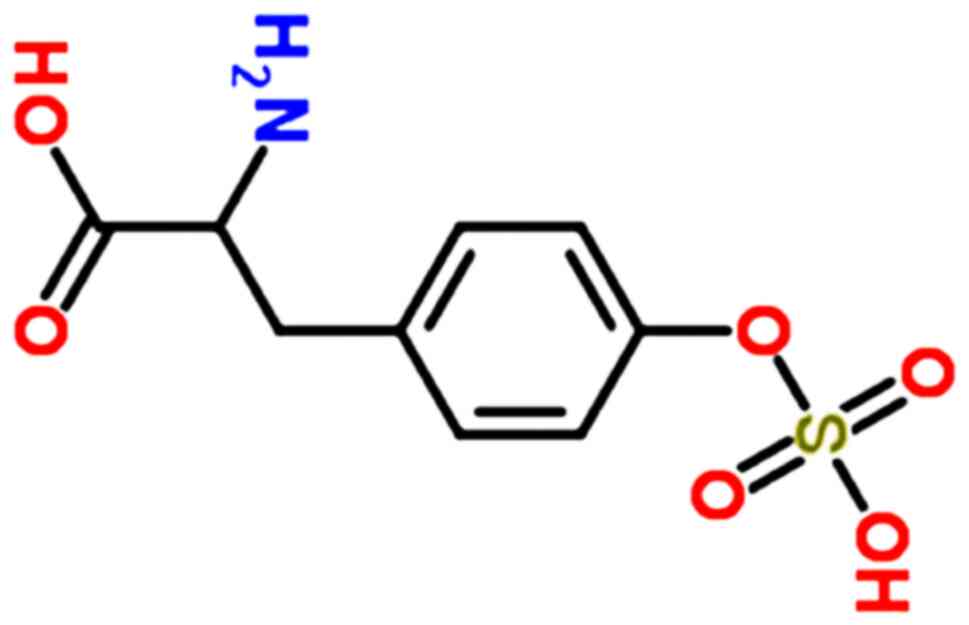 |
Figure 1
Chemical structure of O-sulfotyrosine.
|
Plasma collection and quality control sample
Blood samples from patients with (n=5) or without (n=3) chronic kidney disease (CKD) were collected from patients at Ruijin Hospital, Shanghai Jiaotong University School of Medicine, to confirm the application of the method in question. Samples were processed as described below. The study protocol was approved by the Ethics Committee of Ruijin Hospital, Shanghai Jiaotong University School of Medicine (no. 2018-60). Written informed consent was obtained from all participants.
Pooled plasma samples were used as the quality control (QC) sample. QC samples were applied for extraction repeatability and inter-day/intraday precision validation.
Plasma sample processing
Peripheral venous blood was collected according to standard procedures in tubes containing an anticoagulant (2.5% EDTA). Following centrifugation at 14,000 x g for 10 min at +4˚C, platelet-poor plasma was obtained. Samples were then aliquoted and stored at -80˚C until analysis.
A total of 50 µl of plasma samples or QC samples were deproteinized by the addition of 250 µl pre-cooled methanol followed by incubation at -20˚C for 20 min. Following centrifugation at 14,000 x g for 15 min at +4˚C, the supernatant was collected. The supernatant was dried using a vacuum drier (Savant Speed-Vac; Thermo Fisher Scientific Inc.) to change the solvent, and the dried deposit was then re-dissolved in 100 µl ultrapure water. Following centrifugation at 14,000 x g for 15 min at +4˚C, 4 µl of supernatant were used for further analysis.
Stock solutions, calibrators and samples for the lower limit of quantification (LLOQ) and limit of detection (LOD)
A stock solution of O-sulfotyrosine standard was prepared at a concentration of 10 mg/ml in ultrapure water and was kept at -20˚C until use. Working solutions for calibrators and QC samples were made on the test day.
The calibration standard working solutions were prepared by diluting the stock solution to the final concentrations of 500, 400, 300, 200, 100, 50, 25, 10, 5, 2, 1 and 0.5 ng/ml.
Standard working solutions for LOD were prepared at final concentrations of 2, 1, 0.5, 0.2, 0.1 and 0.05 ng/ml. Working solutions for LLOQ were prepared at concentrations of 10, 5, 2, 1, 0.5, 0.2, 0.1 and 0.05 ng/ml. A total of 4 µl of working solutions were used for each test in later analyses.
Samples for the matrix effect
Samples for the extraction effect detection were prepared by dissolving O-sulfotyrosine standard in 50 µl QC sample to final concentrations of 500, 400, 300, 200, 100, 50 and 25 ng/ml. A blank QC sample was used as a corrective sample. Samples were deproteinized by the addition of 250 µl pre-cooled methanol followed by incubation at -20˚C for 20 min. Following centrifugation at 14,000 x g for 15 min at +4˚C, the supernatant was collected and dried using a vacuum drier, and the dried deposit was then re-dissolved in 100 µl ultrapure water.
Another set of O-sulfotyrosine standard calibration samples was prepared in ultrapure water at concentrations of 500, 400, 300, 200, 100, 50 and 25 ng/ml.
Samples for extraction recovery
A total of 250 µl of working solutions of O-sulfotyrosine standard samples for recovery detection were prepared in methanol at concentrations of 400, 200 and 100 ng/ml. A total of 50 µl QC samples were then added to each working solution tube, followed by incubation at -20˚C for 20 min. Following centrifugation at 14,000 x g for 15 min at +4˚C, the supernatant was collected and dried using a vacuum drier. The deposit was then re-dissolved in 250 µl ultrapure water. Following centrifugation at 14,000 x g for 15 min at +4˚C, 4 µl of supernatant were used for further analysis.
LC-MS/MS conditions
Chromatographic separation was performed using a Waters® ACQUITY UPLC I-Class system (Waters Corporation) with a Waters ACQUITY UPLC HSS T3 (2.1x100 mm, 1.8 µm) column, maintained at 45˚C. The autosampler was maintained at 8˚C, and the flow rate was set at 1 ml/min. The analytical separation was run for 4 min using a gradient elution composed of solvent A (99.9% H2O/0.1% FA) and solvent B (acetonitrile) as follows: The gradient was 10% B to 30% B in 2 min (0-2 min), to 90% B in 0.5 min (2-2.5 min), at 90% B for 1 min (2.5-3.5 min), to 10% B in 0.01 min (3.5-3.51 min), at 10% B for 0.49 min (3.51-4 min). The sample injection volume was 4 µl.
The HPLC system was coupled with a SCIEX™ x 5500 QTrap® mass spectrometer (AB SCIEX, LLC) equipped with electrospray ionization (ESI) ion source operating in a negative mode. The source parameters were optimized as follows: Source temperature, +550˚C; ion source gas 1 (Gas1), 55 psi; ion source gas 2 (Gas2), 55 psi; curtain gas (CUR) pressure, 35 psi; and ionspray voltage floating (ISVF), 4500 V. Analysis was performed in a multiple reaction monitoring (MRM) mode by monitoring the ion transitions (Table I).
 |
Table I
Parameters for method validation.
|
Table I
Parameters for method validation.
| Ion pair and voltage by MRM mode |
| Analyte |
Q1 (m/z) |
Q3 (m/z) |
DP (V) |
CE (eV) |
CXP (V) |
EP (V) |
| O-Sulfotyrosine |
260.2a |
180.0a |
-65 |
-26 |
-9 |
-10 |
| |
260.2 |
199 |
-60 |
-23 |
-14 |
-10 |
| |
260.2 |
119.1 |
-55 |
-33 |
-13 |
-10 |
| Parameters of the standard curve |
| Analyte |
Linear range (ng/ml) |
Linear curve |
R2 value |
| O-Sulfotyrosine |
0.5-500 |
y=13823x-1693.3 |
0.9991 |
| Extraction recovery analysis |
| Sample name |
Theoretical concentration (ng/ml) |
Concentration (ng/ml) |
Recovery rate |
| QC-O-sulfotyrosine-100 |
100 |
75.55135 |
75.55% |
| QC-O-sulfotyrosine-200 |
200 |
139.8574 |
69.93% |
| QC-O-sulfotyrosine-400 |
400 |
279.6056 |
69.90% |
Method validation
System suitability, LLOQ and LOD. Five consecutive runs of the QC sample were used to evaluate the system suitability, which was acceptable when the relative standard deviation (RSD%) was <15%. LOD was defined as the concentration at which the signal-to-noise ratio (S/N) was at least 3:1. LLOQ was defined as the concentration at which the S/N was at least 10:1.
Matrix effect (ME) and extraction recovery. Linear associations of responses of standard dissolved in QC sample (Sm) or ultrapure water (Ss) were made to validate the matrix effect. ME was defined as (1 - Sm/Ss) x 100%. A ME <20% was considered acceptable.
The extraction recovery was determined by comparing the peak area of QC samples in triplicate to the peak area of processed QC samples spiked with standard at 400, 200 and 100 ng/ml concentrations. The percentage recoveries were calculated for each spiked concentration.
Intraday precision and interday repeatability. Intraday precision was assessed by analyzing the QC sample in 5 replicates on the same day and was expressed as RSD%. The repeatability of the method (interday) was examined, calculating the RSD% in triplicate on 3 days. The performance of the assay was acceptable if the intraday and interday precisions were ≤15%.
Linear model generation
Triplicates of the sample readings were averaged and the reading of the blank control sample was deducted. A linear model was then made. The R2 value was calculated to determine the overall goodness of fit. For that portion of the curve where the association of the concentration to read out exhibited a linear relation, R2 values >0.99 represented a good fit.
Statistical analysis
The peak area of O-sulfotyrosine was extracted using Analyst software 1.6.3. The Student's t-test was used to evaluate differences between 2 groups. A two-tailed P-value of <0.05 was considered to indicate a statistically significant difference. Statistical analysis was performed using SPSS 16.0 for Windows (SPSS, Inc.).
Results and Discussion
The present study focused on developing an easy, rapid and cost-effective assay for the determination of plasma O-sulfotyrosine concentrations to facilitate basic and clinical studies.
Method development
Analysis was performed in MRM mode by monitoring the ion transitions in the present study. An extracted ion chromatogram (XIC) was generated to extract the peak area of selected product ions with predefined m/z. The schematic diagram of MRM and XIC for sulfotyrosine is presented in Fig. 2. The product ions with an m/z of 180.0 was selected as quantitative ion pair according to its stability and repeatability.
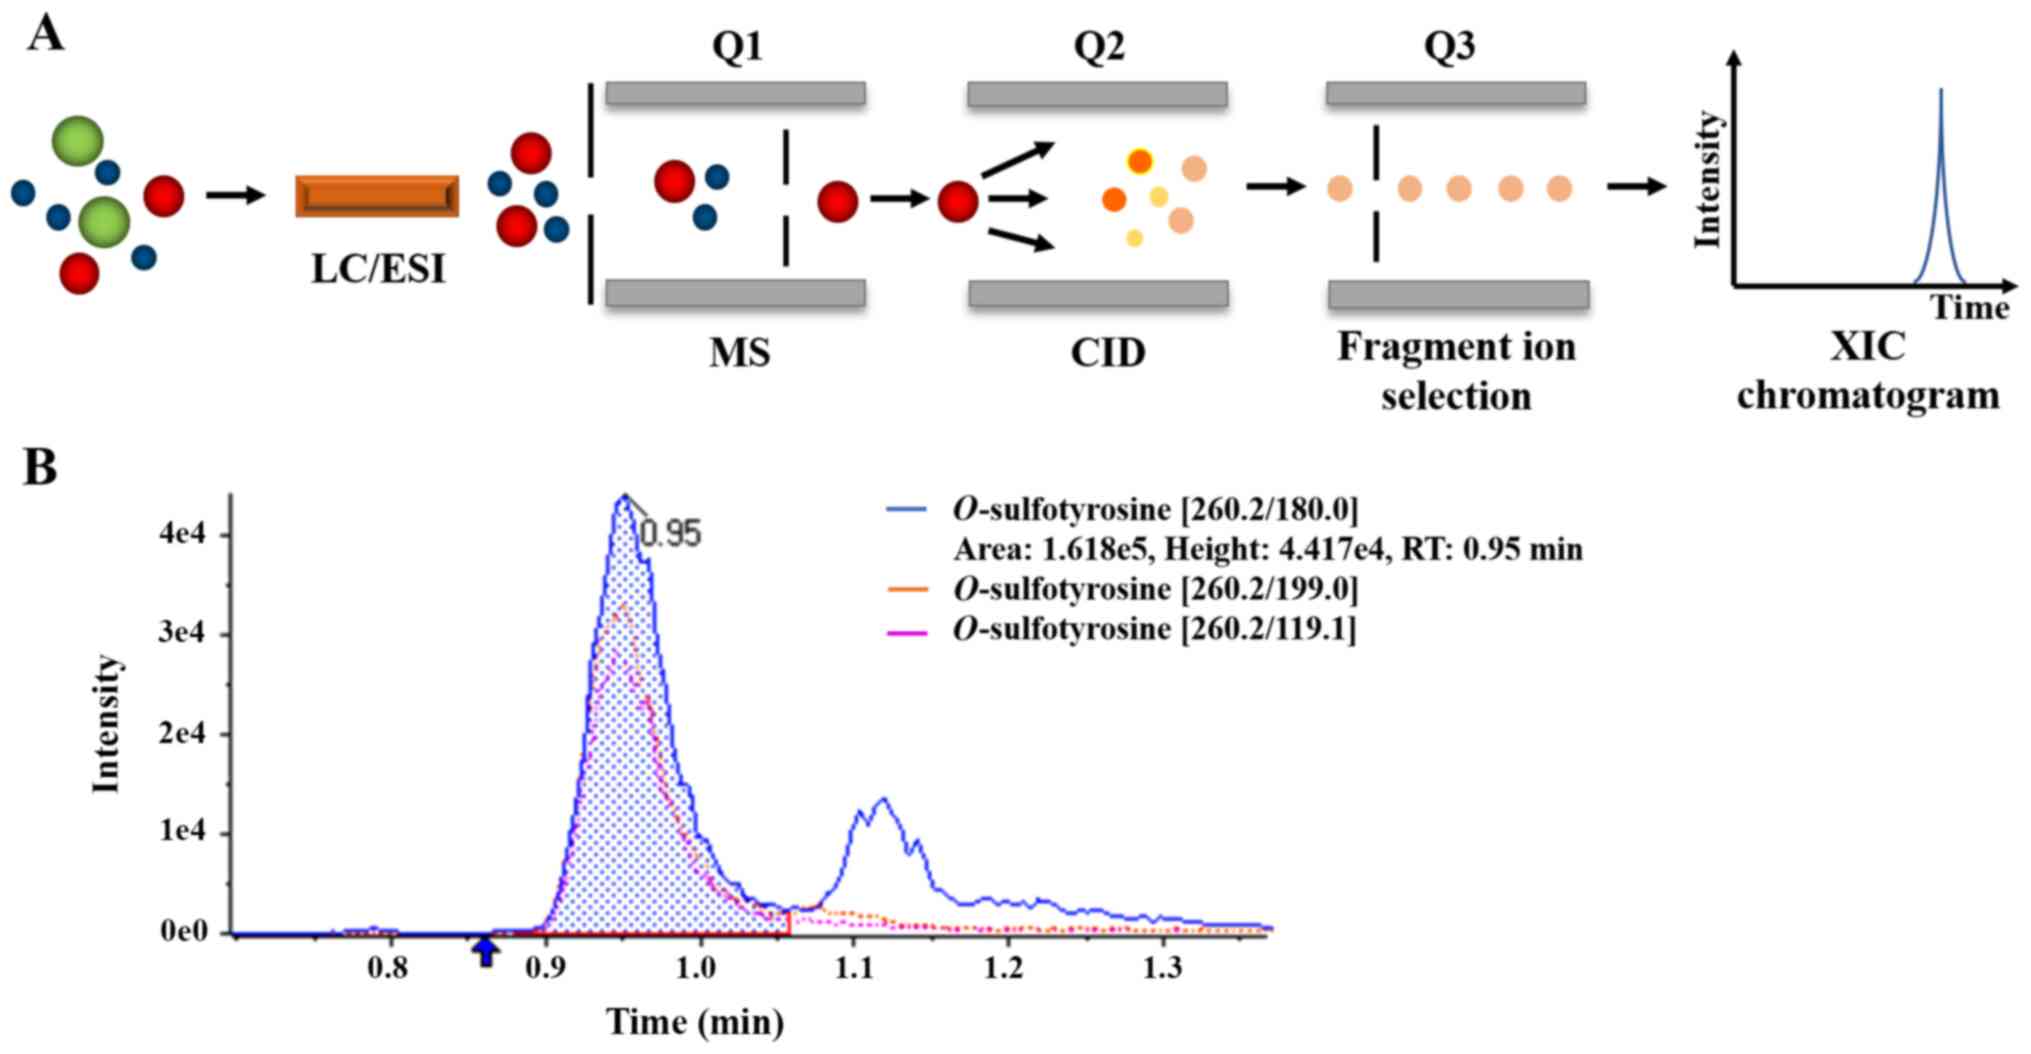 |
Figure 2
(A) Schematic diagram and (B) extracted ion chromatogram of multiple reaction monitoring for O-sulfotyrosine.
|
The MRM mode can be briefly described as follows, based on the predesigned transition lists, the first quadrupole (Q1) of the MS is able to select and transmit to the second quadrupole (Q2) for further fragmentation. The resultant product ions are transmitted to the third quadrupole (Q3), which detects only product ions with selected predefined m/z (180.0). The detected signals are recorded as a XIC chromatogram for the precursor-fragment ion pair.
MeOH denaturation was selected as the deproteinization method for plasma samples for ideal sample preparation as it is cost-effective, rapid and useful for multiple analyses at simultaneously (20), allowing for the translation of this MRM method to the clinical chemistry routine.
Mass spectrometric analysis in the negative mode can provide a more direct approach to detecting tyrosine sulfation based on the greater stability of sulfopeptides as gas-phase anions (21). Although the sulfate ester bond is considered as labile and particularly susceptible to acidic hydrolysis, tyrosine sulfate is often used to withstand the pH in the range of 1-3 and during reversed-phase chromatography and mass spectrometry, which is possible when the temperature is kept at room temperature or below and the exposure time is limited (18). The typically extracted ion chromatograms of blank pure water, O-sulfotyrosine standard, a plasma sample obtained from a patient with CKD, and a QC sample are illustrated in Fig. 3. Each run lasted 4 min. A narrow LC peak width (measured as the full width at half maximum) smaller than 10 sec was observed.
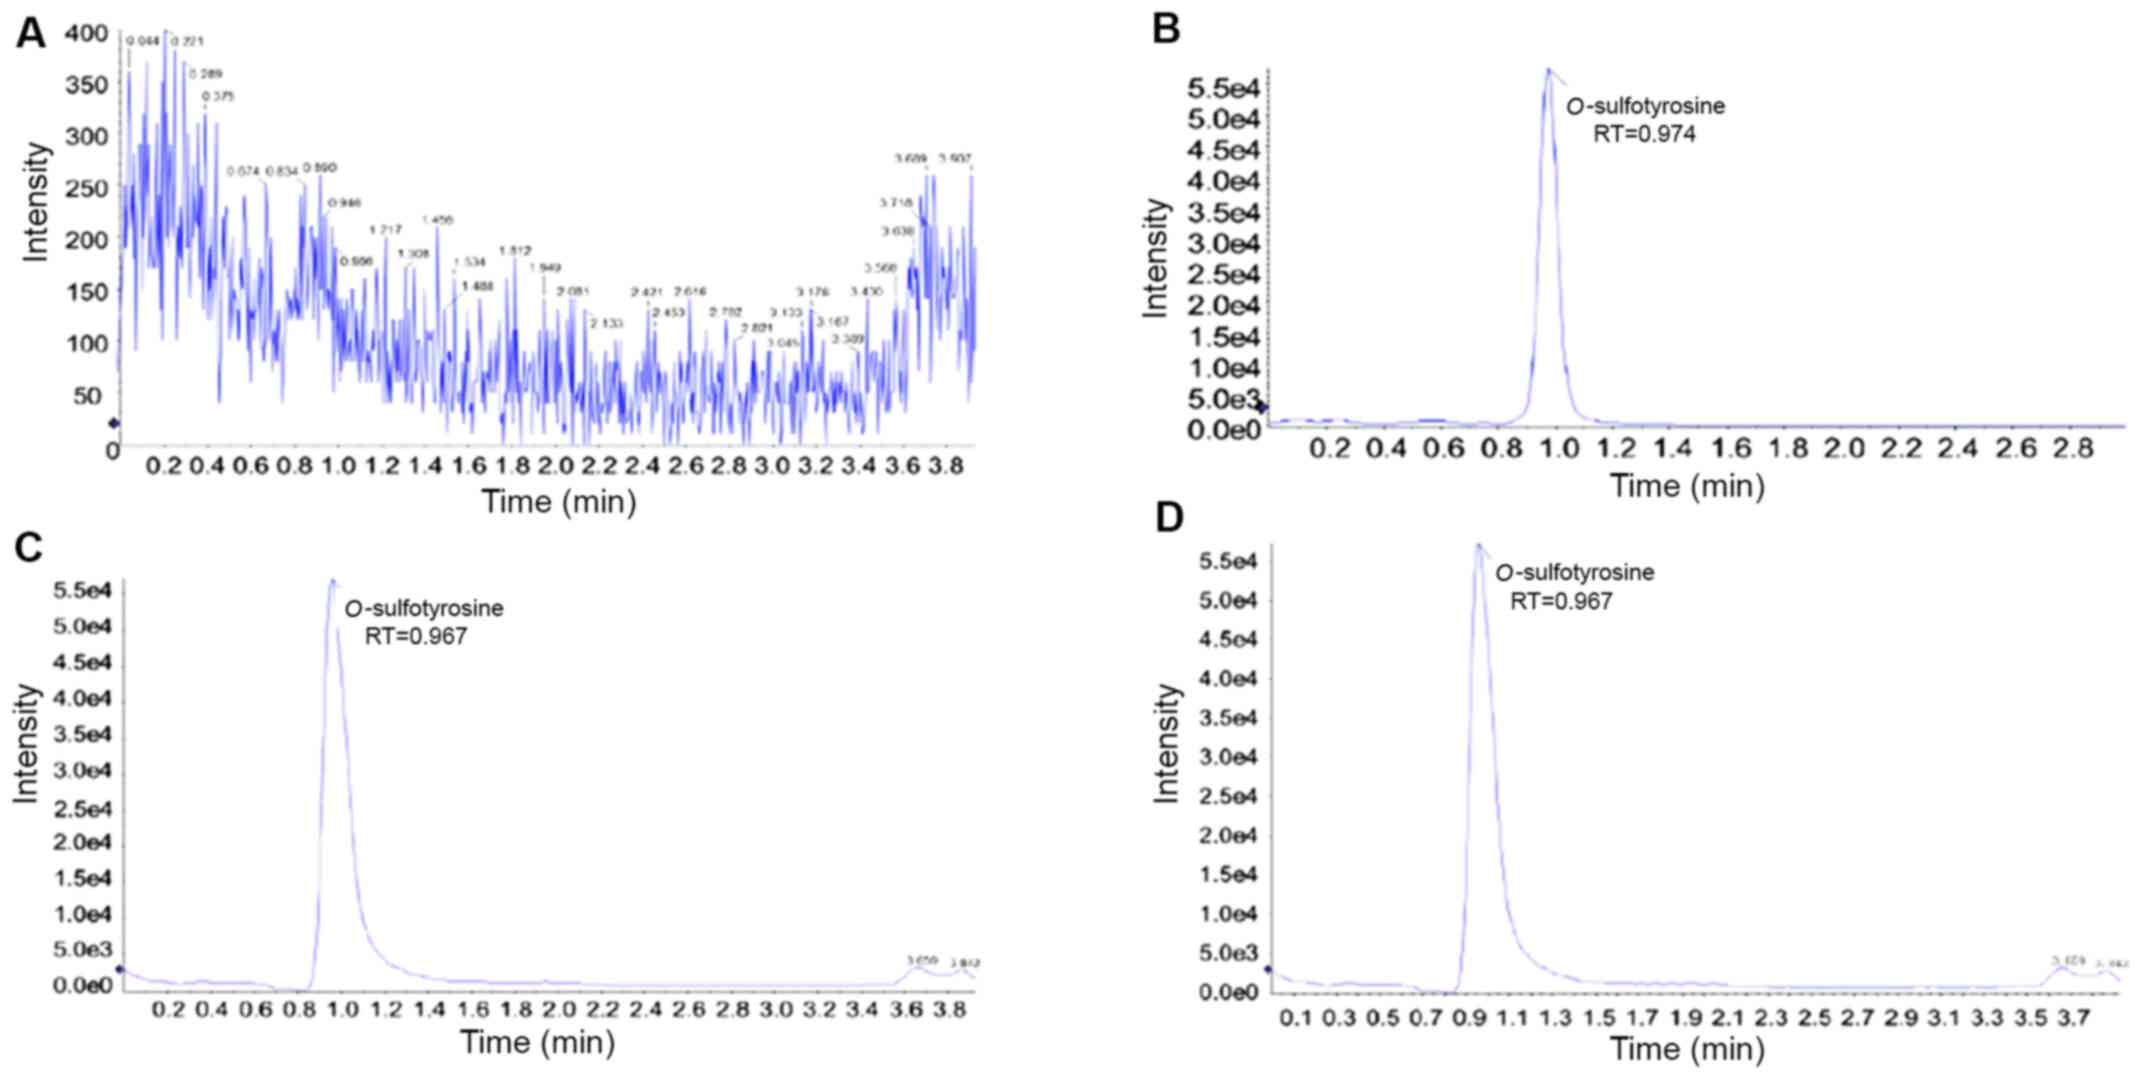 |
Figure 3
Extracted ion chromatograms for (A) pure solvent, (B) O-sulfotyrosine standard, (C) plasma sample, and (D) quality control sample. RT, retention time.
|
Method validation
Calibration curve and LLOQ and LOD. The relevant parameters of the standard curve are shown in Table I and Fig. 4. The LOD was 0.2 ng/ml when defined as the concentration at which the signal-to-noise ratio was at least 3:1. The LLOQ was 0.5 ng/ml when defined as the concentration at which the signal-to-noise ratio was at least 10:1.
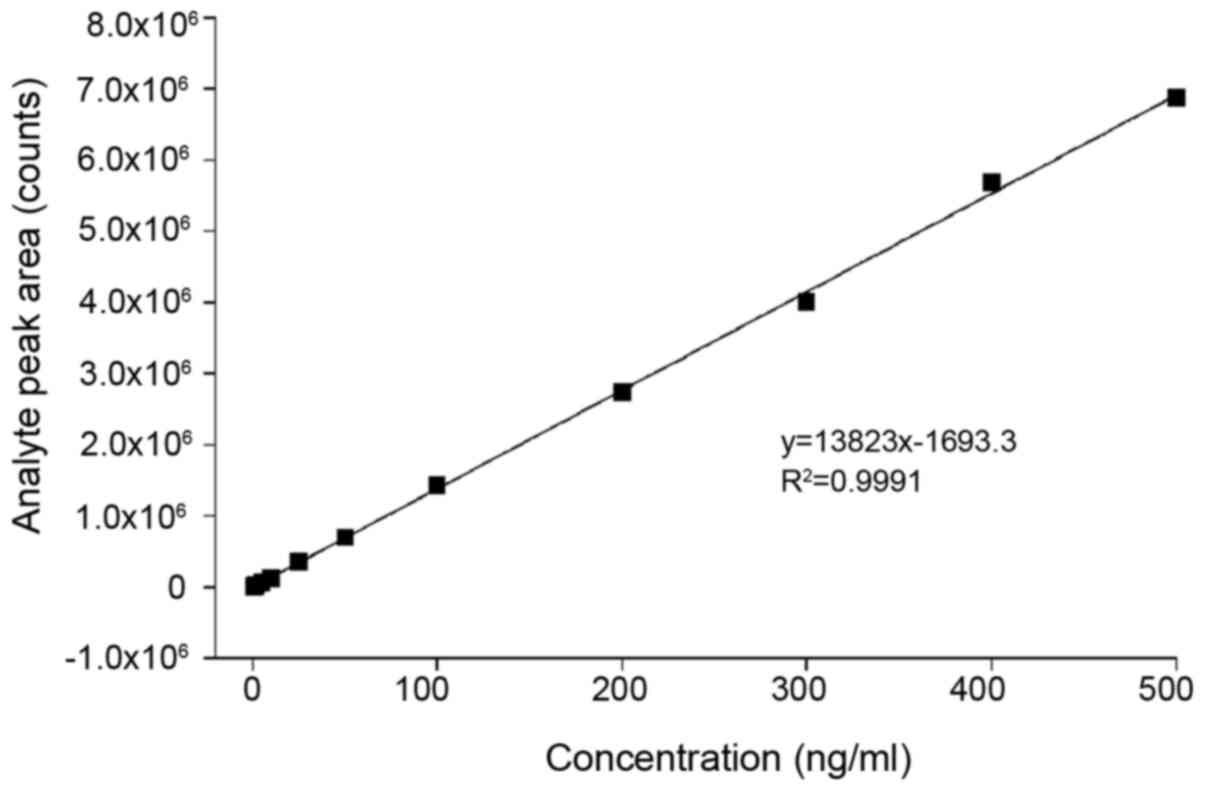 |
Figure 4
Standard curve of O-sulfotyrosine detection.
|
Matrix effect and absolute recovery. The matrix effect reached a low value of 9.87%, indicating an insignificant matrix effect of plasma substrates. The curves for the 2 groups of samples prepared in different solvents are shown in Fig. 5. The extraction recovery was analyzed at 3 concentrations, and the recovery rate is shown in Table I.
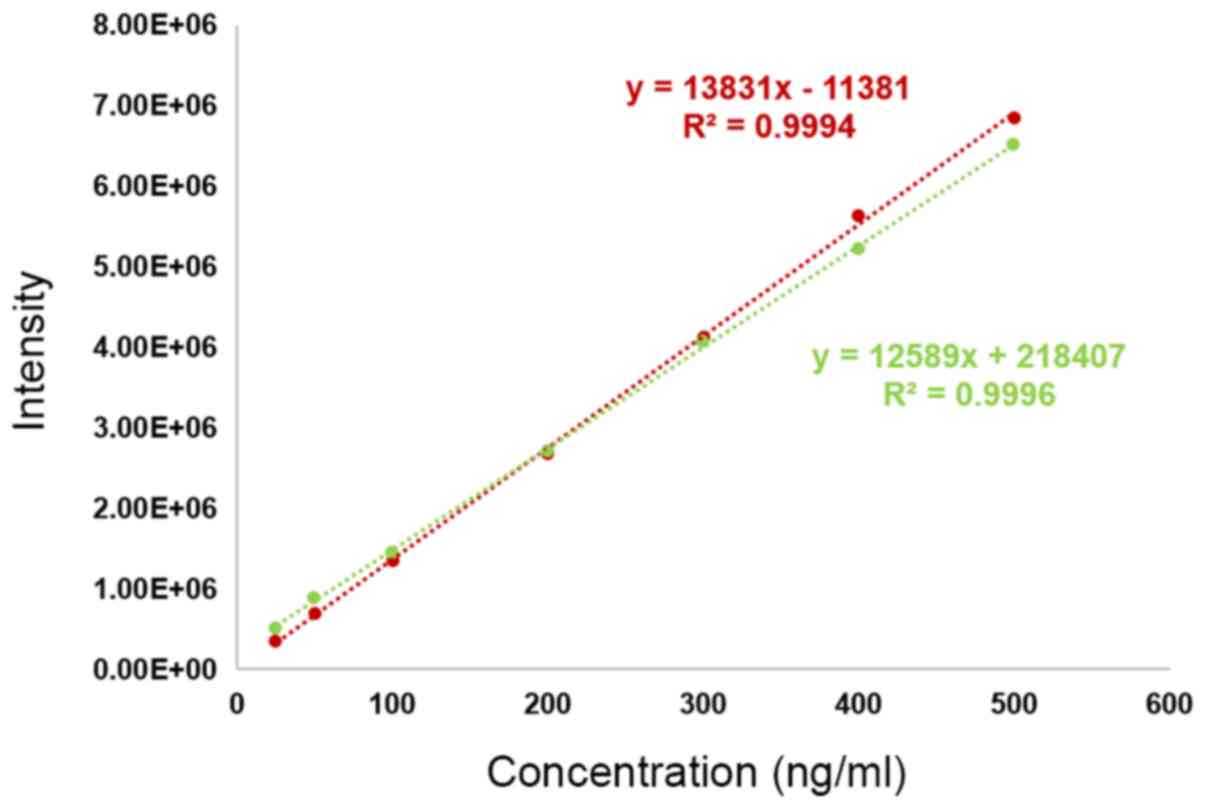 |
Figure 5
Matrix effect analysis. The green curve represents the calibration curve for standard samples prepared in plasma as the solvent, and the red curve is the standard curve prepared in ultrapure water.
|
Intraday precision and interday repeatability. QC samples were injected 5 times on the same day, and the test results are presented in Table II. The RSD% was 5.42%, indicating an acceptable intraday precision. QC samples were tested every other day 3 times to evaluate interday repeatability. The test results are also presented Table II. The RSD% of the O-sulfotyrosine peak area of three QC samples was 3.89%, indicating good interday repeatability
|
Table II
Intraday and interday precision test for QC sample.
|
Table II
Intraday and interday precision test for QC sample.
| Intraday precision test |
| Sample name |
Analyte peak area (counts) |
RSD |
| QC-1-re1 |
5.53E+05 |
5.42% |
| QC-1-re2 |
5.76E+05 |
|
| QC-1-re3 |
6.07E+05 |
|
| QC-1-re4 |
5.99E+05 |
|
| QC-1-re5 |
6.15E+05 |
|
| Interday precision test |
| Sample name |
Analyte peak area (counts) |
RSD |
| QC-1-day1 |
5.51E+05 |
3.89% |
| QC-1-day2 |
5.53E+05 |
|
| QC-1-day3 |
5.90E+05 |
|
Application on clinical samples
Blood samples from patients with or without CKD were collected, and plasma O-sulfotyrosine levels were determined following the completion of the validation process to demonstrate the utility of this method. The results revealed that the plasma concentration of O-sulfotyrosine was significantly increased in patients with CKD (Fig. 6). As early as the 1950s, Tallan et al reported that O-sulfotyrosine was detected in normal human urine, indicating that O-sulfotyrosine can be filtered by the glomerulus (22). It was hypothesized that the increase in the plasma O-sulfotyrosine concentration in patients with CKD may be partially attributed to an impaired glomerular filtration function and may be also partly due to increased post-translational modifications in tissues due to inorganic sulfate, the substrate for sulfation, markedly increased in patients with CKD (23-25). Future functional studies are required to validate such a hypothesis. Moreover, the question remains as to whether the plasma O-sulfotyrosine concentration contributes to disease progression or whether it is merely a biomarker for certain pathological conditions. However, a previous study reported an association between the serum level of O-sulfotyrosine and a decline in renal function in patients with impaired kidney function (19).
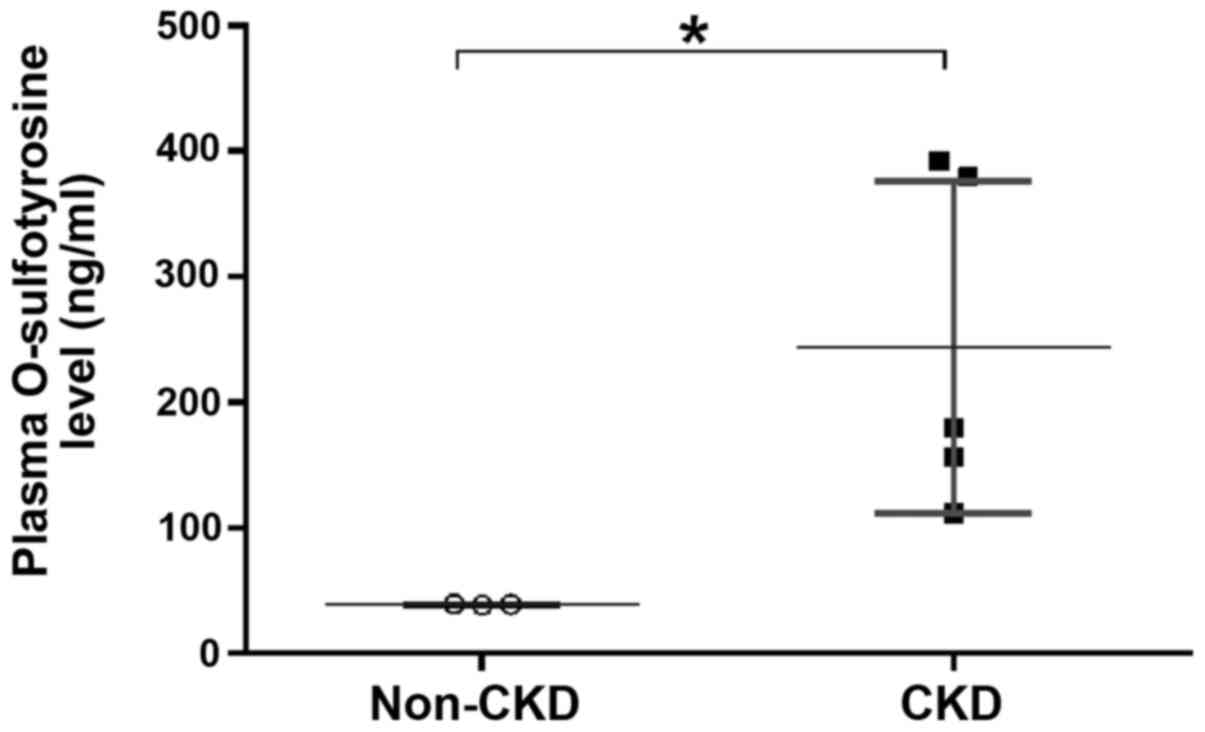 |
Figure 6
Plasma O-sulfotyrosine level is significantly increased in patients with CKD compared to those without CKD (non-CKD). *P<0.05. CKD,chronic kidney disease.
|
In conclusion, the present study presents an applicable, reproducible and sensitive method for the relative quantitative analysis of human plasma O-sulfotyrosine levels using HPLC-MS/MS in a linear negative ion mode. The current method requires a short chromatographic run time, a rapid sample preparation process and a small volume of plasma necessary for the analysis. However, as an external standard method, it generates some accidental and systemic errors due to the standard substance and the sample to be tested are tested independently, and the standard substance matrix differs from the sample to be tested. Therefore, in future experiments, a method of isotope internal standard should be used to create absolute quantitative detection.
In general, this assay is expected to find wide application in nephrological studies. In the future, absolute quantification is recommended to explore the exact association of the plasma O-sulfotyrosine level and pathologic condition, and the diagnostic value for certain diseases.
Acknowledgements
Not applicable.
Funding
The present study was funded by the National Natural Science Foundation of China (grant nos. 81770249 and 81670389).
Availability of data and materials
All data generated or analyzed during this study are included in this published article or are available from the corresponding author on reasonable request.
Authors' contributions
All authors made substantial contributions to the work presented in the study and to the preparation of the manuscript itself. DD, JZ and RZ contributed to all stages of preparation, including the conception and design of the study, as well as the acquisition, analysis and interpretation of the data, and revised the manuscript. ZR and HH contributed to the design of the study and assisted with data acquisition, analysis, interpretation of the data, and drafted the manuscript. DD and JZ confirm the authenticity of all the raw data. All authors have read and approved the final manuscript.
Ethics approval and consent to participate
The study protocol was approved by the Ethics Committee of Ruijin Hospital, Shanghai Jiaotong University School of Medicine (no. 2018-60). Written informed consent was obtained from all participants.
Patient consent for publication
Not applicable.
Competing interests
The authors declare that they have no competing interests.
References
|
1
|
Bettelheim FR: Tyrosine-O-sulfate in a peptide from fibrinogen. J Am Chem Soc. 76:2838–2839. 1954.
|
|
2
|
Huttner WB: Sulphation of tyrosine residues-a widespread modification of proteins. Nature. 299:273–276. 1982.PubMed/NCBI View Article : Google Scholar
|
|
3
|
Huttner WB: Tyrosine sulfation and the secretory pathway. Annu Rev Physiol. 50:363–376. 1988.PubMed/NCBI View Article : Google Scholar
|
|
4
|
Hsu W, Rosenquist GL, Ansari AA and Gershwin ME: Autoimmunity and tyrosine sulfation. Autoimmun Rev. 4:429–435. 2005.PubMed/NCBI View Article : Google Scholar
|
|
5
|
Pouyani T and Seed B: PSGL-1 recognition of P-selectin is controlled by a tyrosine sulfation consensus at the PSGL-1 amino terminus. Cell. 83:333–343. 1995.PubMed/NCBI View Article : Google Scholar
|
|
6
|
Bundgaard JR, Vuust J and Rehfeld JF: Tyrosine O-sulfation promotes proteolytic processing of progastrin. EMBO J. 14:3073–3079. 1995.PubMed/NCBI
|
|
7
|
Friederich E, Fritz HJ and Huttner WB: Inhibition of tyrosine sulfation in the trans-Golgi retards the transport of a constitutively secreted protein to the cell surface. J Cell Biol. 107:1655–1667. 1988.PubMed/NCBI View Article : Google Scholar
|
|
8
|
Leung AW, Backstrom I and Bally MB: Sulfonation, an underexploited area: From skeletal development to infectious diseases and cancer. Oncotarget. 7:55811–55827. 2016.PubMed/NCBI View Article : Google Scholar
|
|
9
|
Nishimura Y, Wakita T and Shimizu H: Tyrosine sulfation of the amino terminus of PSGL-1 is critical for enterovirus 71 infection. PLoS Pathog. 6(e1001174)2010.PubMed/NCBI View Article : Google Scholar
|
|
10
|
Koltsova E and Ley K: Tyrosine sulfation of leukocyte adhesion molecules and chemokine receptors promotes atherosclerosis. Arterioscler Thromb Vasc Biol. 29:1709–1711. 2009.PubMed/NCBI View Article : Google Scholar
|
|
11
|
Huttner WB: Determination and occurrence of tyrosine O-sulfate in proteins. Methods Enzymol. 107:200–223. 1984.PubMed/NCBI View Article : Google Scholar
|
|
12
|
Yu Y, Hoffhines AJ, Moore KL and Leary JA: Determination of the sites of tyrosine O-sulfation in peptides and proteins. Nat Methods. 4:583–588. 2007.PubMed/NCBI View Article : Google Scholar
|
|
13
|
Monigatti F, Gasteiger E, Bairoch A and Jung E: The Sulfinator: Predicting tyrosine sulfation sites in protein sequences. Bioinformatics. 18:769–770. 2002.PubMed/NCBI View Article : Google Scholar
|
|
14
|
Hoffhines AJ, Damoc E, Bridges KG, Leary JA and Moore KL: Detection and purification of tyrosine-sulfated proteins using a novel anti-sulfotyrosine monoclonal antibody. J Biol Chem. 281:37877–37887. 2006.PubMed/NCBI View Article : Google Scholar
|
|
15
|
Kehoe JW, Velappan N, Walbolt M, Rasmussen J, King D, Lou J, Knopp K, Pavlik P, Marks JD, Bertozzi CR, et al: Using phage display to select antibodies recognizing post-translational modifications independently of sequence context. Mol Cell Proteomics. 5:2350–2363. 2006.PubMed/NCBI View Article : Google Scholar
|
|
16
|
Rodgers SD, Camphausen RT and Hammer DA: Tyrosine sulfation enhances but is not required for PSGL-1 rolling adhesion on P-selectin. Biophys J. 81:2001–2009. 2001.PubMed/NCBI View Article : Google Scholar
|
|
17
|
Yagami T, Kitagawa K, Aida C, Fujiwara H and Futaki S: Stabilization of a tyrosine O-sulfate residue by a cationic functional group: Formation of a conjugate acid-base pair. J Pept Res. 56:239–249. 2000.PubMed/NCBI View Article : Google Scholar
|
|
18
|
Balsved D, Bundgaard JR and Sen JW: Stability of tyrosine sulfate in acidic solutions. Anal Biochem. 363:70–76. 2007.PubMed/NCBI View Article : Google Scholar
|
|
19
|
Niewczas MA, Mathew AV, Croall S, Byun J, Major M, Sabisetti VS, Smiles A, Bonventre JV, Pennathur S and Krolewski AS: Circulating modified metabolites and a risk of ESRD in patients with type 1 diabetes and chronic kidney disease. Diabetes Care. 40:383–390. 2017.PubMed/NCBI View Article : Google Scholar
|
|
20
|
Vanholder R, Hoefliger N, De Smet R, Ringoir S and Vogeleere P: Extraction of protein bound ligands from azotemic sera: Comparison of 12 deproteinization methods. Kidney Int. 41:1707–1712. 1992.PubMed/NCBI View Article : Google Scholar
|
|
21
|
Robinson MR, Moore KL and Brodbelt JS: Direct identification of tyrosine sulfation by using ultraviolet photodissociation mass spectrometry. J Am Soc Mass Spectrom. 25:1461–1471. 2014.PubMed/NCBI View Article : Google Scholar
|
|
22
|
Tallan HH, Bella ST, Stein WH and Moore S: Tyrosine-O-sulfate as a constituent of normal human urine. J Biol Chem. 217:703–708. 1955.PubMed/NCBI
|
|
23
|
Phillips LS and Kopple JD: Circulating somatomedin activity and sulfate levels in adults with normal and impaired kidney function. Metabolism. 30:1091–1095. 1981.PubMed/NCBI View Article : Google Scholar
|
|
24
|
Freeman RM and Richards CJ: Studies on sulfate in end-stage renal disease. Kidney Int. 15:167–175. 1979.PubMed/NCBI View Article : Google Scholar
|
|
25
|
Mulder GJ and Scholtens E: The availability of inorganic sulphate in blood for sulphate conjugation of drugs in rat liver in vivo. (35S)Sulphate incorporation into harmol sulphate. Biochem J. 172:247–251. 1978.PubMed/NCBI View Article : Google Scholar
|


