Introduction
The city of Columbia is the capital of the US state
of South Carolina with a population of 131 thousand individuals
(2019 estimate) (1). South
Carolina is a southern state located in South East US, at the coast
of Atlantic Ocean. The city has a well-developed wireless
connectivity infrastructure with services provided by all major
cell phone service providers. As a central hub for the state, the
city of Columbia entails offices for large corporations and small
businesses, government and city municipality departments. The city
is also home to a number of colleges, including the University of
South Carolina, Benedict College, Columbia College, Columbia
International University, Fortis College, South University, Allen
University and Lutheran Theological Southern seminary.
In previous studies, the authors investigated public
and occupational radiofrequency (RF) exposure in European cities,
including both outdoor and indoor exposure. For example, in June
and August, 2017, RF level measurements were conducted in city
center of Stockholm, Sweden. That study is analogous to the present
study as it covered a central city area, including business
district, shopping and tourist areas, together with popular leisure
streets and squares. In Stockholm the total (of all frequency
bands) mean exposure level was 5,494 µW/m² (1.439 V/m), whereas the
major contributions were downlinks from LTE 800 (4G), GSM + UMTS
900 (3G), GSM 1800 (2G), UMTS 2100 (3G) and LTE 2600 (4G) (2). In another detailed investigation into
RF exposure levels in Stockholm, the authors performed a spatial
exposure map of Järntorget square, where the mean exposure value
was 5.2 V/m (median, 5.0 V/m; range, 1.2-11.6 V/m), indicating one
of the highest exposure areas in the old town (3). The previous Stockholm Old Town
measurement in 2016, covering six different areas, including
squares and streets determined that the mean level of the total RF
radiation was 4,293 µW/m² (1.27 V/m) and max 173,302 µW/m² (8.08
V/m) (4).
In recent studies, the authors compared indoor
living places in the city of Stockholm, where a maximum exposure at
6 V/m was encountered at the attic apartment, located at the same
elevation and only some 6 m away from the base station antennas
(5). In another indoor exposure
study, the authors conducted exposimeter measurements in Swedish
schools. The mean exposure to RF radiation ranged from 1.1 to 66.1
µW/m² (0.02 to 0.16 V/m), whereas the highest mean level was 396.6
µW/m² (0.39 V/m) and maximum peaks reached 82,857 µW/m² (5.59 V/m)
(6). In another densely packed
indoor area, Stockholm central railway station, the mean total RF
radiation level varied between 2,817 to 4,891 µW/m² (1.03 to 1.36
V/m) for different measurement and maximum levels close to a wall
mounted cell phone base station yielding >95,544 µW/m² (6.0 V/m)
(7).
Herein, the findings of other authors in similar
studies are briefly discussed below. Jalilian et al
(8) performed a review of exposure
studies across European cities, finding mean outdoor exposure to
range from 0.07 to 1.27 V/m for downlink signals, as from mobile
phone base stations were highest contributors. Their study
concluded that everyday exposure during the pre-5G era, from 2012
to 2018 had not noticeably risen.
Sagar et al (9) also conducted a review of RF exposure
in 8 European cities. Of note, the majority of studies studies
report mean RF EMF exposure values, whereas others report median
values (for details, please see each publication in the
aforementioned study). For outdoor microenvironments, great
variability has been reported, ranging from 0.11 V/m (France)
(10) to 1.59 V/m (Sweden)
(11).
In another study by Sagar et al (12), microenvironments were compared,
including outdoor places in several cities in different countries,
namely Switzerland, Ethiopia, Nepal, South Africa, Australia and
the US. Los Angeles was included from the US where city center mean
exposure levels were reported to be 1.24 V/m (12). City centers in other countries
reported the following values: Switzerland, 0.48 V/m; Nepal, 0.75
V/m; South Africa, 0.85 V/m; Ethiopia, 1.21 V/m; Australia, 1.46
V/m [please see Table 1 in the aforementioned study by Sagar et
al (12)].
Thielens et al (13) investigated different
microenvironments in Melbourne, Australia. They recorded the
highest mean total 0.89 V/m RF-EMF exposure in Melbourne's central
business district (13) Misek
et al (14) performed RF
EMF exposure anayses and measured 1.07 V/m in the city center,
Andrej Hlinka Square, Zilina, Slovakia. Iyare et al
(15) measured GSM900, GSM1800 and
UMTS bands in Leuven, Belgium using spectrum analyzer measurements
at 60 locations. They calculated the maximum field value of 2.53
V/m (total exposure), whereas GSM900 was the main contributor
(15).
Cansiz et al (16) conducted exposimeter measurements in
the cities of Diyarbakir and Batikent, Turkey. The highest field
level recorded was 7.18 V/m, where the main contributor was the
Universal Mobile Telecommunications System (UMTS) band (16). Also in Turkey, in the Altınordu
district of Ordu, Kurnaz and Mutlu (17) measured city center RF exposure in
2016 and 2017, and recorded the average level to be 0.79 V/m and
the highest 5.86 V/m. Tang et al (18). also performed measurements in the
densely populated city of Xiamen, China, finding that the
integrated electric field intensity ranged from 0.32 to 1.70 V/m,
whereas the power density levels of 2G were higher than 3G and
4G.
The aforementioned studies by other authors have
followed different methodologies, producing different parameters,
which render comparisons difficulties at best. It should be
emphasized that there is a need to report all the relevant
statistical indicators (mean, median, min, max) and to provide
detailed background information on the locations and times the
measurements were obtained. The authors have developed a
methodology to characterize any city and an example of a city is
provided below.
The present study was performed to physically
characterize the wireless infrastructure and determine public
exposure to RF electromagnetic fields, including the sub-millimeter
wave 5G, in the city environment of Columbia, SC, USA. The present
study is particularly applicable to the emergence of 5G cell phone
systems and the installment of corresponding base station antennas
by the cell phone service operators.
This study is part of ongoing measurements of RF
fields in public places. The aim was to provide reliable
measurement data, characterizing the RF exposure levels on the dawn
of the 5G mobile communications era, using high-quality measurement
devices and following rigorous scientific methods. The results also
provide the means of comparing public exposure to other cities
worldwide. The findings of the present study may hence prove to be
meaningful for public health and safety discourse. From the
perspective of public RF exposure, Apart from the study by Sagar
et al (12), no such public
exposure surveys have been performed in the US for three decades,
at least to the best of our knowledge. The authors aim to continue
with further studies investigating other US cities.
Materials and methods
Characterizing the exposure of a city
downtown area
A measurement route was planned in the downtown area
of Columbia, taking into account central locations for various
activities, such as business, shopping, dining and recreation. The
authors have previously measured several European cities and have
developed a method to characterize public exposure to RF
electromagnetic fields (2-5,7).
By this method, four types of common places are included in the
city environment where the public comes into contact with these
physical fields: i) City streets, including downtown business
district(s), shopping areas, recreational hotspots with cafes and
other outdoor recreational places, and historic and tourist
locations; ii) city squares; iii) green areas, such as parks,
promenades or others, depending on the geographical placement of
the city; and iv) public transport hubs, such as railways station,
bus stations or others, depending on the infrastructure of the
given city. By accounting the aforementioned locations, typical
exposure levels for any city can be confidently registered and
displayed.
Measurements were conducted at least five times,
following the same measurement route; however, they were conducted
on different days, including business days and weekends, and at
different times of day, from morning to evening. The temporal
distribution allows for the identification of the times at which
the exposure is the highest.
Measurement route in the city of
Columbia, SC
The route represents the downtown area of the city
of Columbia. The route was designed to cover the popular public
areas, including recreational and commonly visited areas. The route
was designed to include major public hotspots; hence, the route is
representative of public exposure in this city.
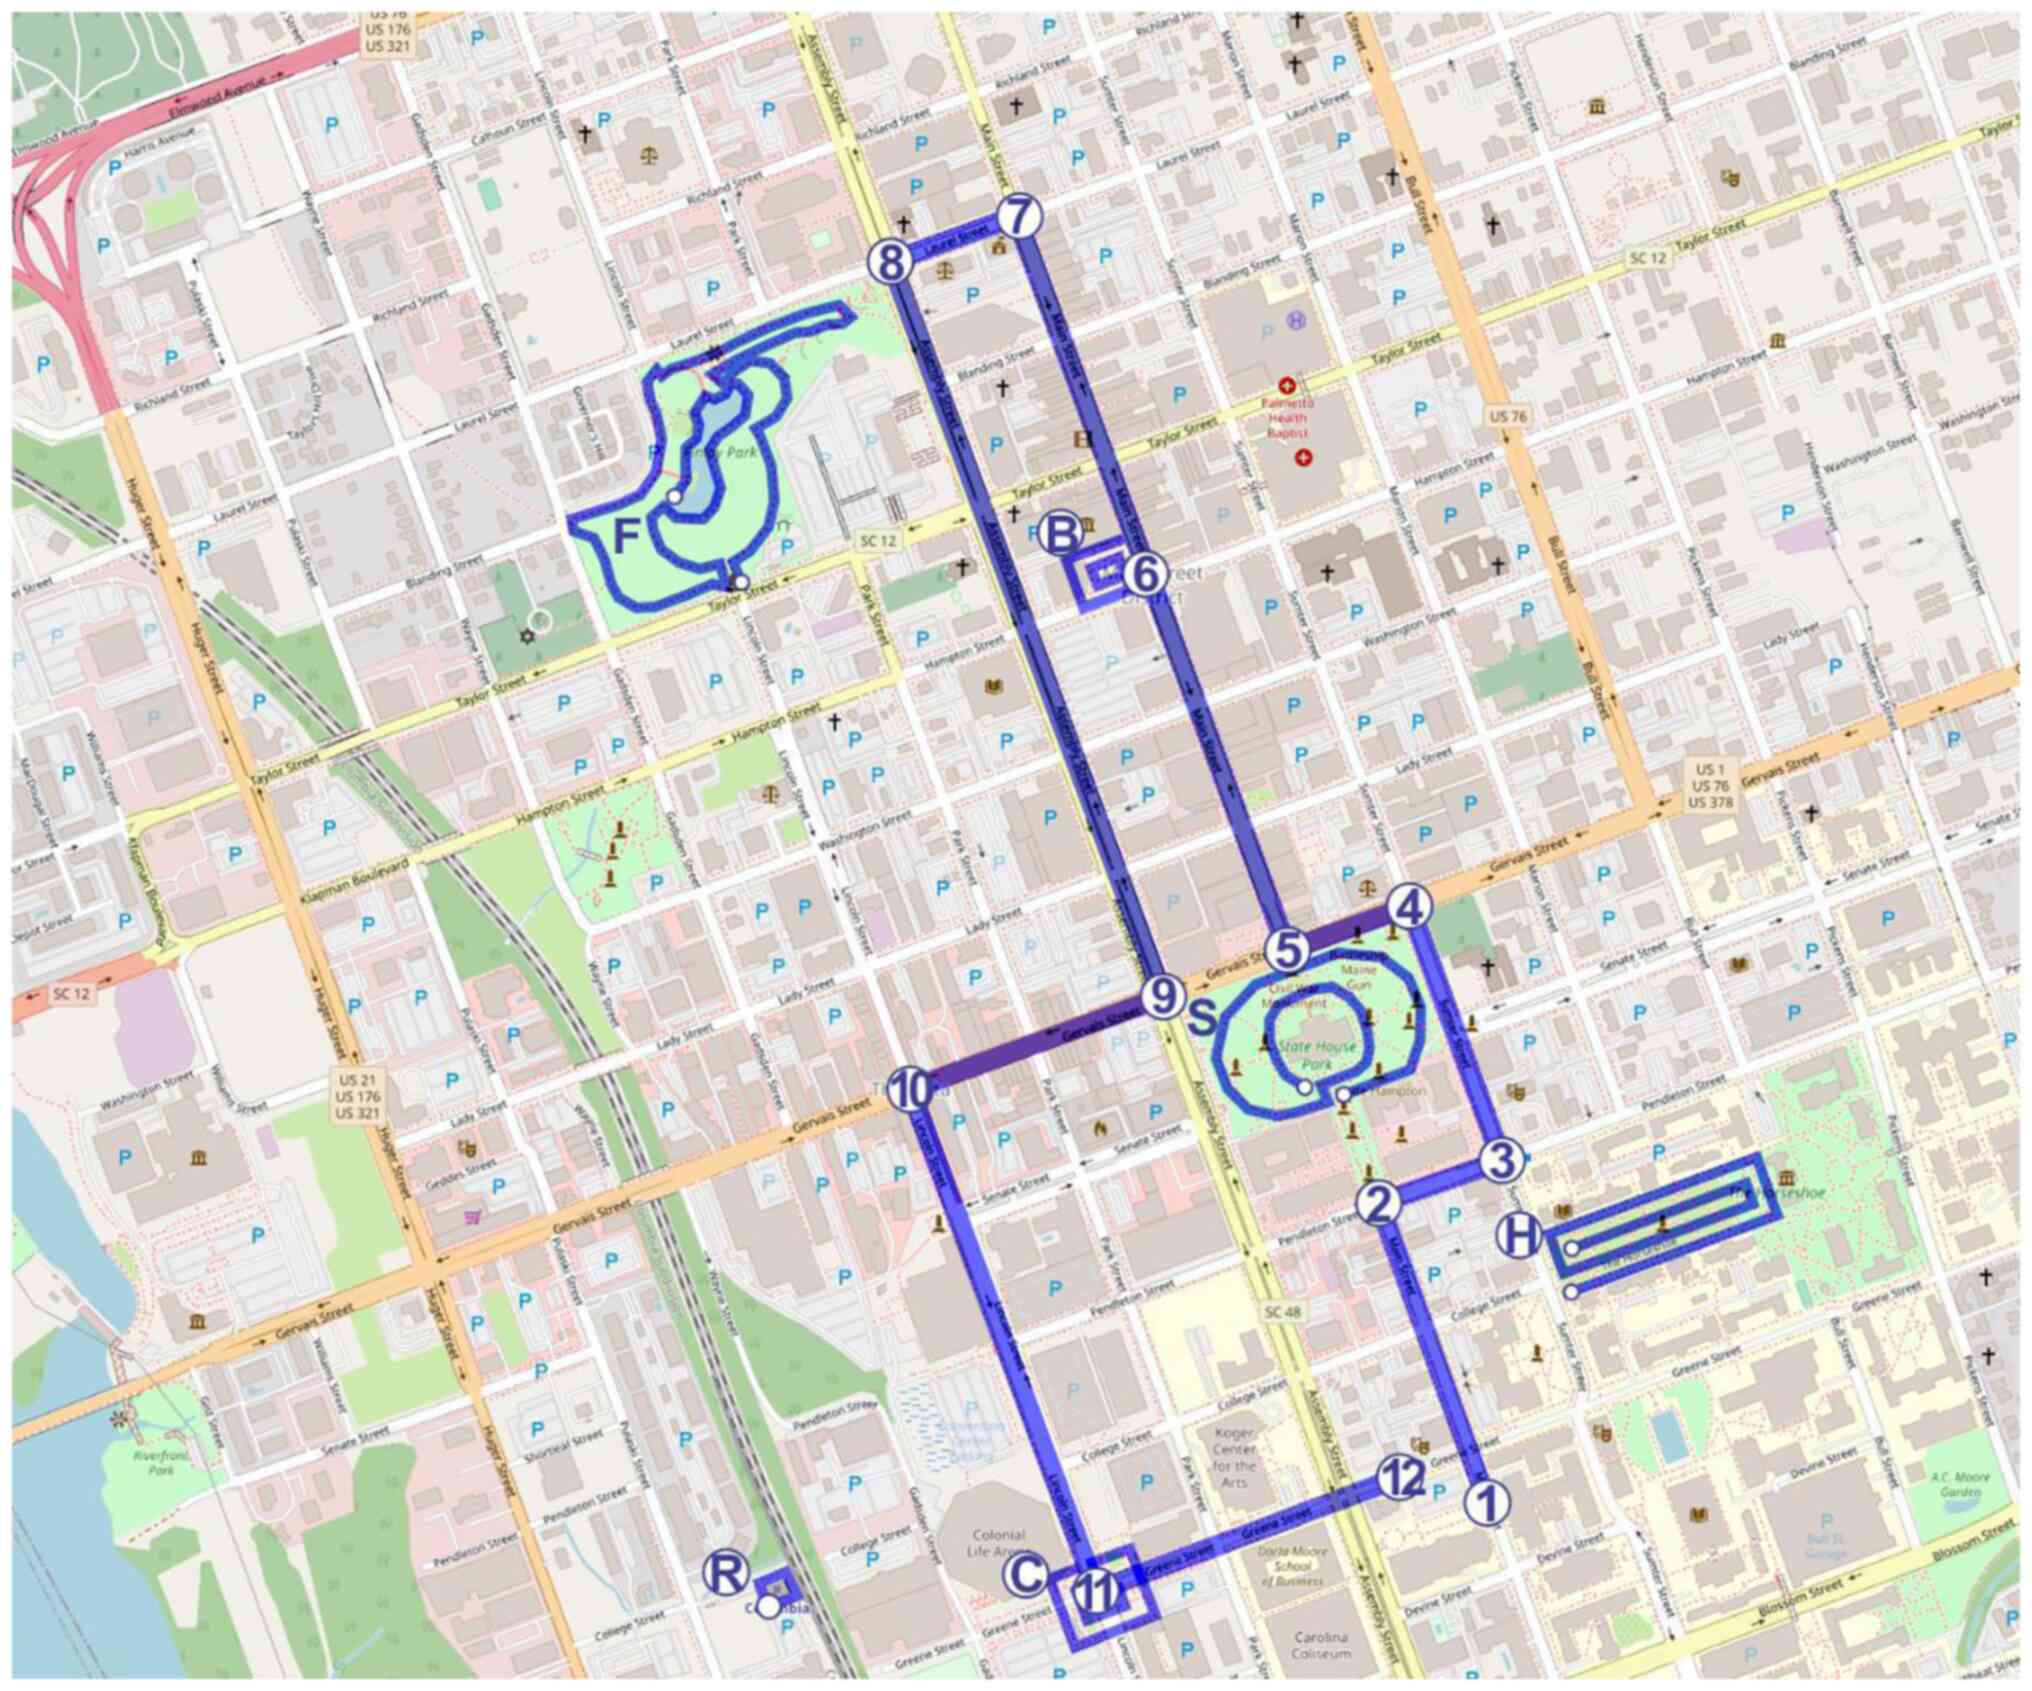
The measurement route for city streets and squares
consisted of 12 markers, designating the different street strips or
squares included in the measured public objects. The route includes
the three main downtown streets of the city: i) Assembly Street, a
business street where several offices reside. This is one of the
busiest streets, the arterial road of the city; ii) Main Street
which is a popular shopping street, with a number of pedestrians
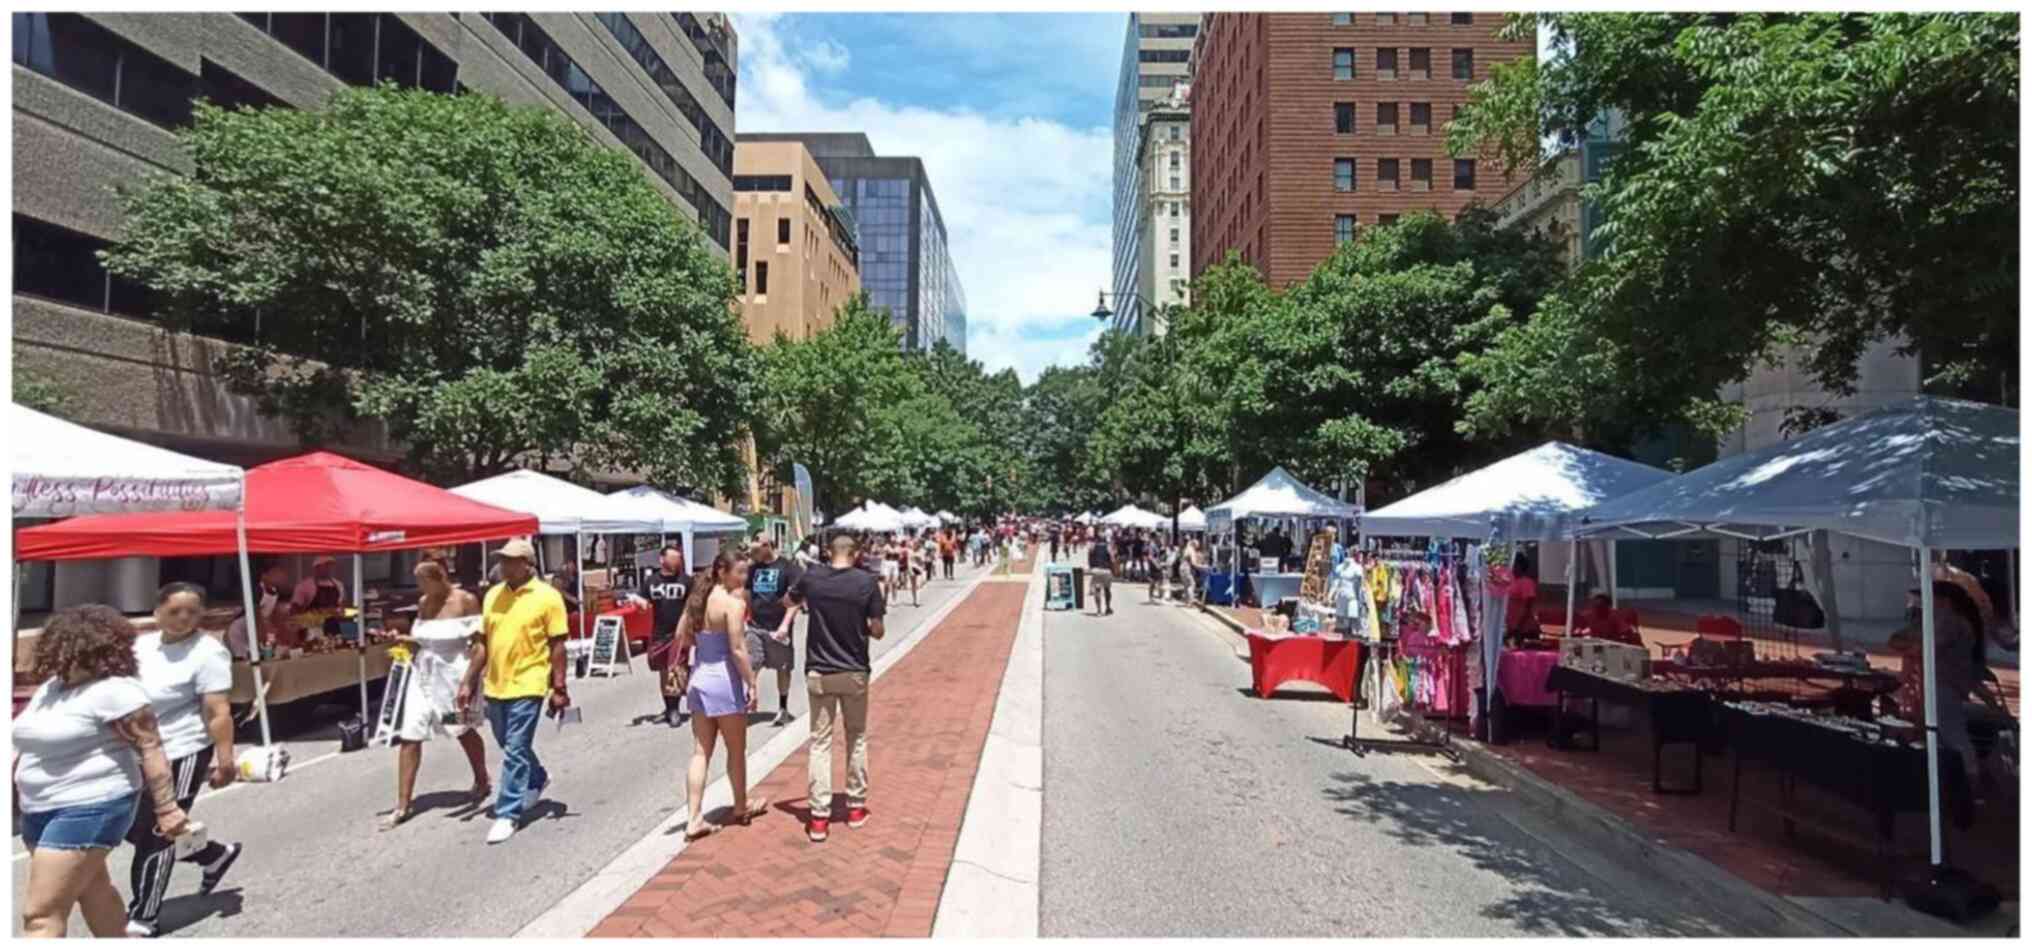
either walking, sitting in cafes or shopping (Fig. 1); iii) Gervais Street; iv) Greene
Street; and v) Lincoln Street. Gervais Street represents a typical
area comprised of small shops and businesses. The area is also
popular with small cafes, bars and diners. The buildings in this
area are mostly one- and two-story buildings, no high-rise
buildings are present at the strip included in the measurements.
The Gervais Street area represents the oldest business district
part of Columbia, as several of the buildings were built 100 years
ago. The route also accounts for Pendleton, Sumter and Laurel
Streets, along the Main Street; the route accounts detailed
measurements from Boyd plaza. Lincoln Street contains both old
historic buildings and relatively modern buildings, constructed
over the past few decades. Lincoln Street in the proximity of
Gervais Street contains a historical leisure area with popular bars
and pubs in the construction style of the beginning of the last
century. The southern part of Lincoln Street includes the city's
main free time locations, including a conference center, arena and
other features.
The route starts and ends at the University of South
Carolina campus and continues along the city center, passing
several central buildings, including FedEx, Wells Fargo Bank, Optus
bank, Synovus bank, South Carolina Secretary of State, State House,
Supreme Court, Sheraton Columbia Downtown, Marriott Columbia,
Columbia Museum of Art, Columbia City Hall, US Social Security
Administration, Federal building, Courthouse, United States Postal
Service, Richland county main library, the South Carolina
Department of Transportation, Colonial Life Arena and the Carolina
Coliseum.
In additional to the street route, the present study
measured RF levels at Columbia's train street (850 Pulaski Street,
Columbia). Public parks included i) State House Park, Assembly
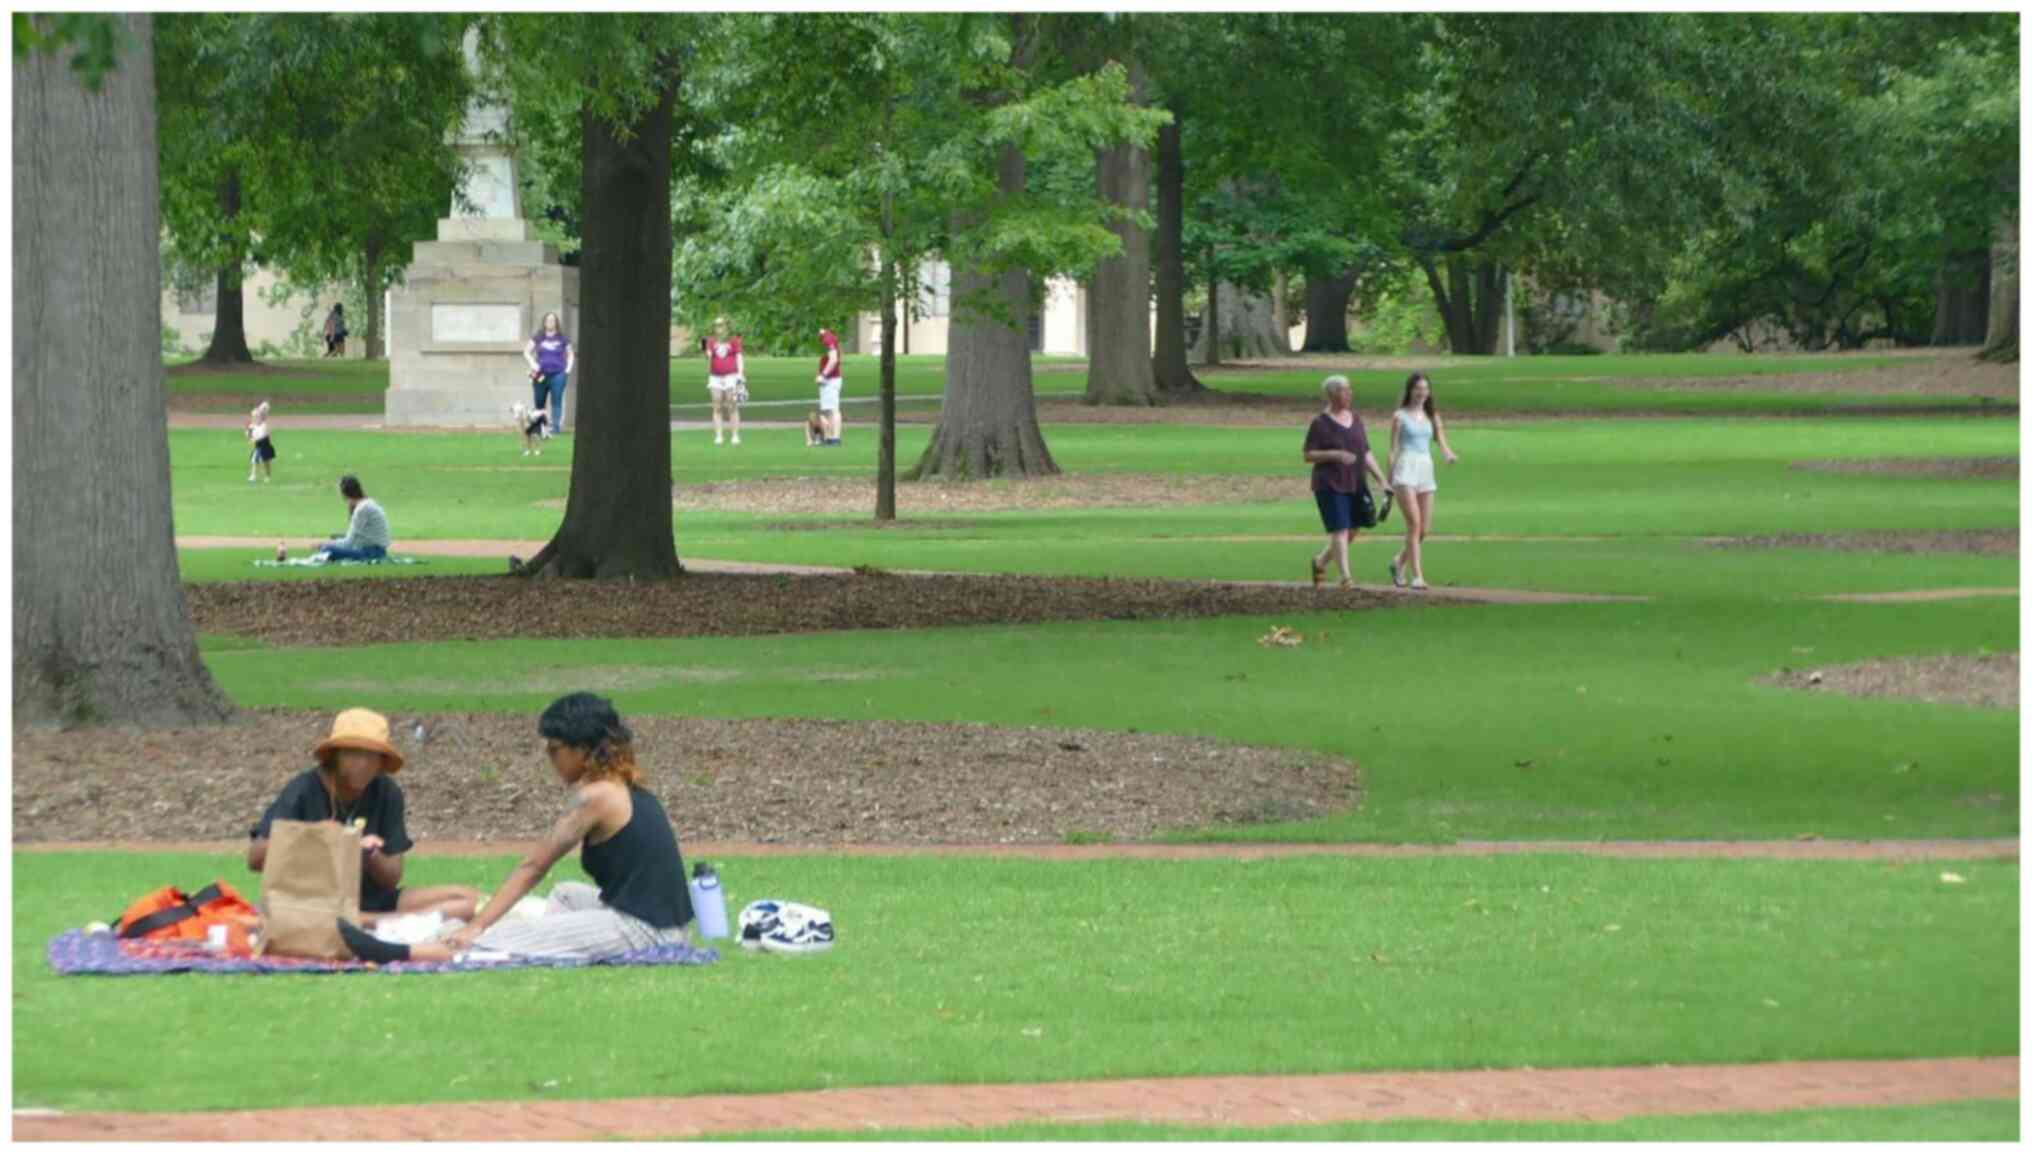
Street; ii) Horseshoe Park, Sumter Street (Fig. 2); and iii) Finlay Park, 930 Laurel
Street. For the parks and the train station, only one measurement
round was conducted. All aforementioned locations are presented in
Fig. 3.
Additionally, another measurement route was planned
for parks and the railway station, which was conducted
independently from the aforementioned route.
The meter was held at arm's length which is ~50 cm
from the body, to minimize the shielding effect of the operator's
body. The measurement was activated and a preset route was followed
for each measurement round. All the measurement rounds were
conducted at a steady pace, maintaining a constant speed. The city
squares were measured using a spiral movement pattern, covering the
square by evenly distributed layout; this allows for spatial
representation and the calculation of the mean exposure level.
Spatial distribution of the field
Other series of measurements were conducted to
analyze the spatial distribution of the radiofrequency field
exposure. An area of 0.89x1.0 miles (1.4x1.60 km) was selected,
where all streets were measured using the grid mapping method. The
spatial measurement was performed once, unlike the aforementioned
representative route measurements which were performed five times.
An exposimeter (EME SPY Evolution; MVG) was used for the
measurements together with a GPS logger for obtaining geographical
coordinates from GPS. During the measurements, the GPS accuracy was
1-3 meters, allowing for good spatial accuracy to prepare a field
distribution vector map. Vector mapping 3D Field software ver.
4.6.1.0 was used to conduct the calculations, where the kriging
method ‘Natural neighbors II’ was applied and the number of
gradients set to 20. To clearly illustrate the elevated exposure
areas i.e., hotspots, the highest gradient was set at 2.0 V/m,
whereas all the values above that were treated at the same color
(dark red). Spot measurement data were fed to the contour map
software 3DFIELD ver. 4.5.2.0 (by Vladimir Galouchko) and spatial
field distribution maps were drawn.
Measurement device
The EME SPY Evolution was used, a latest model
exposimeter (MVG). EME Spy Evolution is a selective, isotropic and
portable electromagnetic field meter for measuring various
communication standards between 80 MHz and 6 GHz, such as
(frequency modulation) radio broadcasting; television (TV)
broadcasting; Terrestrial Trunked Radio (formerly known as the
Trans-European Trunked Radio; TETRA) emergency services (police,
rescue, etc.); global system for mobile communications (GSM) second
generation mobile communications; universal mobile
telecommunications systems (UMTS) third generation mobile
communications, 3G; long term evolution (LTE) fourth generation
mobile communications standard, 4G; digital European cordless
telecommunications (DECT) cordless telephone systems standard;
Wi-Fi wireless local area network protocol. EME Spy Evolution
allows for the recording of field levels with a user set period and
recording duration. The lower detection limit of the meter is 0.05
V/m (2.7-6 GHz) and 0.02 V/m (0.08-2.7 GHz). The upper detection
limit is 6 V/m for all bands. The meter can store 166,000
measurement samples for 20 band scenarios. For each band, the meter
monitors the frequency bandwidth for a specific time and registers
(records) either an average or median depending on the band (signal
type).
For this measurement task, EME SPY Evolution was
configured to measure the maximum number of frequency bands and at
sampling rate of 6 sec (shortest for the given number of
bands).
Frequency bands
EME SPY Evolution software includes 85 preset
frequency bands covering all European, American and Asian cellphone
bands, as well as other civilian RF sources. Prior to the
measurements, a configuration must be set to select desired bands.
The device was configured to measure mostly download (DL) bands, as
the interest of the study was to characterize the exposure from
cell phone base station antennas. Cellular bands are designated as
b1 … b79 and can be duplex bands, meaning one for upload and the
other for download, e.g. b26UL and b26DL. Some cellular bands have
both the upload and download traffic within the same band, meaning
sharing the same frequencies e.g., 5G band b41.
Other, non-cellular exposure sources were also
included, constituting for the entire civilian RF infrastructure,
including TV, radio, industrial, scientific, and medical frequency
bands (ISM), DECT and TETRA. The frequencies used in the US were
preconfigured and set to the meter. USA TETRA is permitted in the
450-470 MHz and 809-824/854-869 MHz business/industrial land
transportation (B/ILT) band (19).
TETRA is a standardized trunked radio system (20). TETRA is used by a number of
professional services, including government, emergency, police,
rescue, ambulance and railway services. The Federal Communications
Commission (FCC) has set regulations for permitting intentional
radiators in the 902-928 MHz ISM band; ISM bands near 900 MHz and
2.4 GHz are allowed to be used in the US (21). The preparatory measurements did not
detect any transmitters at 450-470 MHz; thus, this was omitted from
the frequency table. In the US and Canada, DECT is permitted at
frequencies 1,920-1,930 MHz (22).
DECT (23) is most often familiar
by cordless telephones, baby monitors, but is also used for door
opener remotes and traffic.
Prior to the measurements, a literature search was
conducted, accounting for the public sources revealing the cellular
bands used in the corresponding city or area. In addition, multiple
measurement test runs were conducted in the area to identify and
confirm the cellular bands used in the city. The aim was to cover
all relevant sources of public exposure from the civilian RF
infrastructure, including GSM 2G, 3G, LTE 4G and 5G submillimeter
wave bands (<6 GHz). The selected bands do not include most cell
phone upload bands, as this level is highly dependent to the
proximity of people using cell phones and was not within the scope
of this study.
Statistical analysis
The mean, median, minimum and maximum values in V/m
were calculated to characterize the following: i) Amplitudes of
different frequency bands; ii) total exposure at different downtown
areas; and iii) total exposure across different weekdays and times
of day. The means were calculated as quadratic means. Total
exposure was calculated as the sum of all measured frequency bands.
Readings at the lower detection limit were treated as zero level
(0.00 V/m) exposure. One-way analysis of variance (ANOVA) was
conducted to assess whether there was a statistically significant
difference in RF public exposure when measured at different
weekdays and times. Tukey's test for multiple comparisons was used
for post hoc tests of all pairwise combinations of measurement
times. Statistical analyses were performed using IBM SPSS software
(ver. 26) (IBM Corp.). A value of P<0.05 was considered to
indicate a statistically significant difference.
Results
Measurements
The measurements in the present study were conducted
in the city of Columbia, SC, USA in the period of June 6 to 13,
2021. The measurement route length was calculated 2.8 M (4.5 km),
with the average duration of a measurement being 1 h and 10 min. On
the whole, 3,943 single measurements were conducted all over the
downtown area, distributed over five measurement days; each
measurement entailed an amplitude analysis of 20 frequency bands
(see Table I).
 | Table IFrequency bands present and measured
in Columbia, SC, USA. |
Table I
Frequency bands present and measured
in Columbia, SC, USA.
| Band | Transmitted by | Bandwidth (MHz) | Frequency span
(MHz) |
|---|
| FM US | Radio
broadcasting | 20 | 88-108 |
| TV UHF | Television
broadcasting | 145 | 470-615 |
| 71 DL | 4G, 5G base
station | 35 | 617-652 |
| 12 DL | 4G base station | 17 | 729-746 |
| 17 DL | 4G base station | 12 | 734-746 |
| 13 DL | 4G base station | 10 | 746-756 |
| 14 DL | 4G base station | 10 | 758-768 |
| 27 DL | 4G base station | 17 | 852-869 |
| 26 DL | 3G, 4G base
station | 35 | 859-894 |
| ISM | Short range
applications | 26 | 902-928 |
| DECT 6 | Cordless phones | 10 | 1920-1930 |
| 25 DL | 4G base station | 65 | 1930-1995 |
| 66 DL | 4G base station | 90 | 2110-2200 |
| 30 DL | 4G base station | 100 | 2305-2405 |
| W 2G | Public or private
WLAN | 10 | 2437-2447 |
| 41TDD | 4G, 5G base
station/cell phone | 194 | 2496-2690 |
| 7 DL | 4G base station | 70 | 2620-2690 |
| 22 DL | 4G, 5G base
station | 80 | 3510-3590 |
| 43 TDD | 4G, 5G base
station/cell phone | 200 | 3600-3800 |
| W 5G | Public or private
WLAN | 700 | 5150-5850 |
The highest exposure readings were registered close
to cell phone base station antennas that were placed at a low level
near the street level. These were cylinders mounted on top of
utility poles, street lamps, traffic lights or other arbitrary
posts. The antennas were surrounded by a cylindrical cover
rendering these unnoticeable for the bystanders.
Analysis of different downtown
areas
The area-specific results of the RF exposure
measurements averaged across all five measurement rounds are
presented in Table II. For parks
and the railway, only one measurement round was conducted. The
exposure is presented as a total of the 2.8 M (4.5 km) route and
also as route legs representing exposure at each measured street
strip. The presentation of street strip data helps to identify
highly exposed areas in the city, as well as areas with lower
exposure levels. In Table II, the
column labeled ‘Length of measured strip’ presents the length of
each measured street strip in feet and meters. In squares and
parks, the strip length indicates the total length of a spiral-like
route pattern which was taken at each area. ‘Nr of measurement
points’ indicates how many measurement points (single measurements)
were taken in each corresponding street strip or area.
| Table IIRadiofrequency levels at specific
areas in Columbia, SC, USA. |
Table II
Radiofrequency levels at specific
areas in Columbia, SC, USA.
| Location | Map marker | Length of measured
strip (ft/m) | n | Mean (V/m) | Median (V/m) | Min (V/m) | Maximum (V/m) |
|---|
| Gervais Street
(west) | 9-10 | 1,048/319 | 64 | 1.750 | 0.870 | 0.150 | 6.867 |
| Main Street
(middle) | 5-6 | 1,664/507 | 80 | 1.624 | 1.096 | 0.261 | 5.903 |
| Pendleton
Street | 2-3 | 537/163 | 21 | 1.568 | 1.368 | 0.566 | 3.728 |
| Greene Street | 11-12 | 1,294/394 | 59 | 1.548 | 1.319 | 0.228 | 4.917 |
| Sumter Street | 3-4 | 1,084/330 | 41 | 1.280 | 1.158 | 0.548 | 2.880 |
| Assembly
Street | 8-9 | 3,125/953 | 127 | 1.243 | 0.928 | 0.116 | 3.772 |
| Main Street
(south) | 1-2 | 1,239/378 | 77 | 1.072 | 0.984 | 0.089 | 2.444 |
| Boyd plaza | B | 1,023/312 | 48 | 0.997 | 0.809 | 0.197 | 2.195 |
| Lincoln Street | 10-11 | 2,107/642 | 78 | 0.956 | 0.654 | 0.250 | 5.490 |
| Laurel Street | 7-8 | 506/154 | 26 | 0.923 | 0.548 | 0.240 | 2.849 |
| Main Street
(north) | 6-7 | 1,476/450 | 64 | 0.871 | 0.544 | 0.168 | 3.164 |
| Colonial Life Arena
square | C | 1,685/513 | 82 | 0.858 | 0.680 | 0.242 | 2.771 |
| Gervais Street
(east) | 4-5 | 553/168 | 28 | 0.785 | 0.669 | 0.381 | 3.275 |
| State House
Park | S | 3,788/1,150 | 223 | 0.740 | 0.581 | 0.174 | 2.093 |
| Finlay Park | F | 5,233/1,600 | 267 | 0.688 | 0.614 | 0.187 | 1.409 |
| Horseshoe Park | H | 3,989/1,220 | 232 | 0.475 | 0.410 | 0.212 | 1.210 |
| Railway Street | R | 395/120 | 39 | 0.341 | 0.260 | 0.143 | 0.755 |
| Streets and squares
altogether | - |
14,626/4,458a | 795 | 1.240 | 0.859 | 0.089 | 6.867 |
| Parks
altogether | - | NA | 722 | 0.645 | 0.530 | 0.174 | 2.093 |
Based on the measurements collected at locations
around the city, the analysis of the means indicates the highest
exposure areas (beginning from the highest) at Gervais Street
(west), Main Street (middle) and Pendleton Street and Greene
Street. The upper detection limit of the meter was repeatedly
exceeded at Gervais Street, where also the maximum exposure level
of all rounds was registered.
Analysis of frequency bands
Frequency analysis (Table III) revealed that the majority of
contributors to the exposure budget were bands ‘FM US’, ‘14DL’,
‘27DL’, ‘25DL’ and ‘66DL’, whereas the latter two had the highest
single measurements recorded throughout the city and over all the
measurement bands. The highest exposure places for the bands were
accordingly: 1.243 V/m ‘FM US’ at Main Street (middle); 0.734 V/m
‘14DL’ at Greene Street; 0.616 V/m ‘27DL’ at Laurel Street; 0.847
‘25DL’ at Pendleton Street; and 1.422 V/m ‘66DL’ at Gervais Street
(west); the values indicate the mean exposure of several
measurement points at the location, and averaged over all five
measurement rounds.
| Table IIIBand specific radiofrequency exposure
levels based on all five measurement rounds in the city streets and
squares in Columbia, SC, USA. |
Table III
Band specific radiofrequency exposure
levels based on all five measurement rounds in the city streets and
squares in Columbia, SC, USA.
| Band | Mean (V/m) | Median (V/m) | Min (V/m) | Maximum (V/m) |
|---|
| FM US | 0.687 | 0.355 | 0.000 | 3.242 |
| TV UHF | 0.021 | 0.000 | 0.000 | 0.165 |
| 71 DL | 0.101 | 0.026 | 0.000 | 0.895 |
| 12 DL | 0.000 | 0.000 | 0.000 | 0.000 |
| 17 DL | 0.000 | 0.000 | 0.000 | 0.000 |
| 13 DL | 0.191 | 0.052 | 0.000 | 1.867 |
| 14 DL | 0.293 | 0.082 | 0.000 | 2.653 |
| 27 DL | 0.216 | 0.053 | 0.000 | 3.037 |
| 26 DL | 0.076 | 0.000 | 0.000 | 0.916 |
| ISM | 0.036 | 0.000 | 0.000 | 0.451 |
| DECT 6 | 0.024 | 0.000 | 0.000 | 0.286 |
| 25 DL | 0.513 | 0.260 | 0.021 | 5.196 |
| 66 DL | 0.781 | 0.388 | 0.000 | 6.001 |
| 30 DL | 0.062 | 0.000 | 0.000 | 0.478 |
| W 2G | 0.013 | 0.000 | 0.000 | 0.193 |
| 41TDD | 0.031 | 0.000 | 0.000 | 0.470 |
| 7 DL | 0.027 | 0.000 | 0.000 | 0.338 |
| 22 DL | 0.001 | 0.000 | 0.000 | 0.033 |
| 43 TDD | 0.002 | 0.000 | 0.000 | 0.052 |
| W 5G | 0.006 | 0.000 | 0.000 | 0.104 |
Comparing total exposure across
different days
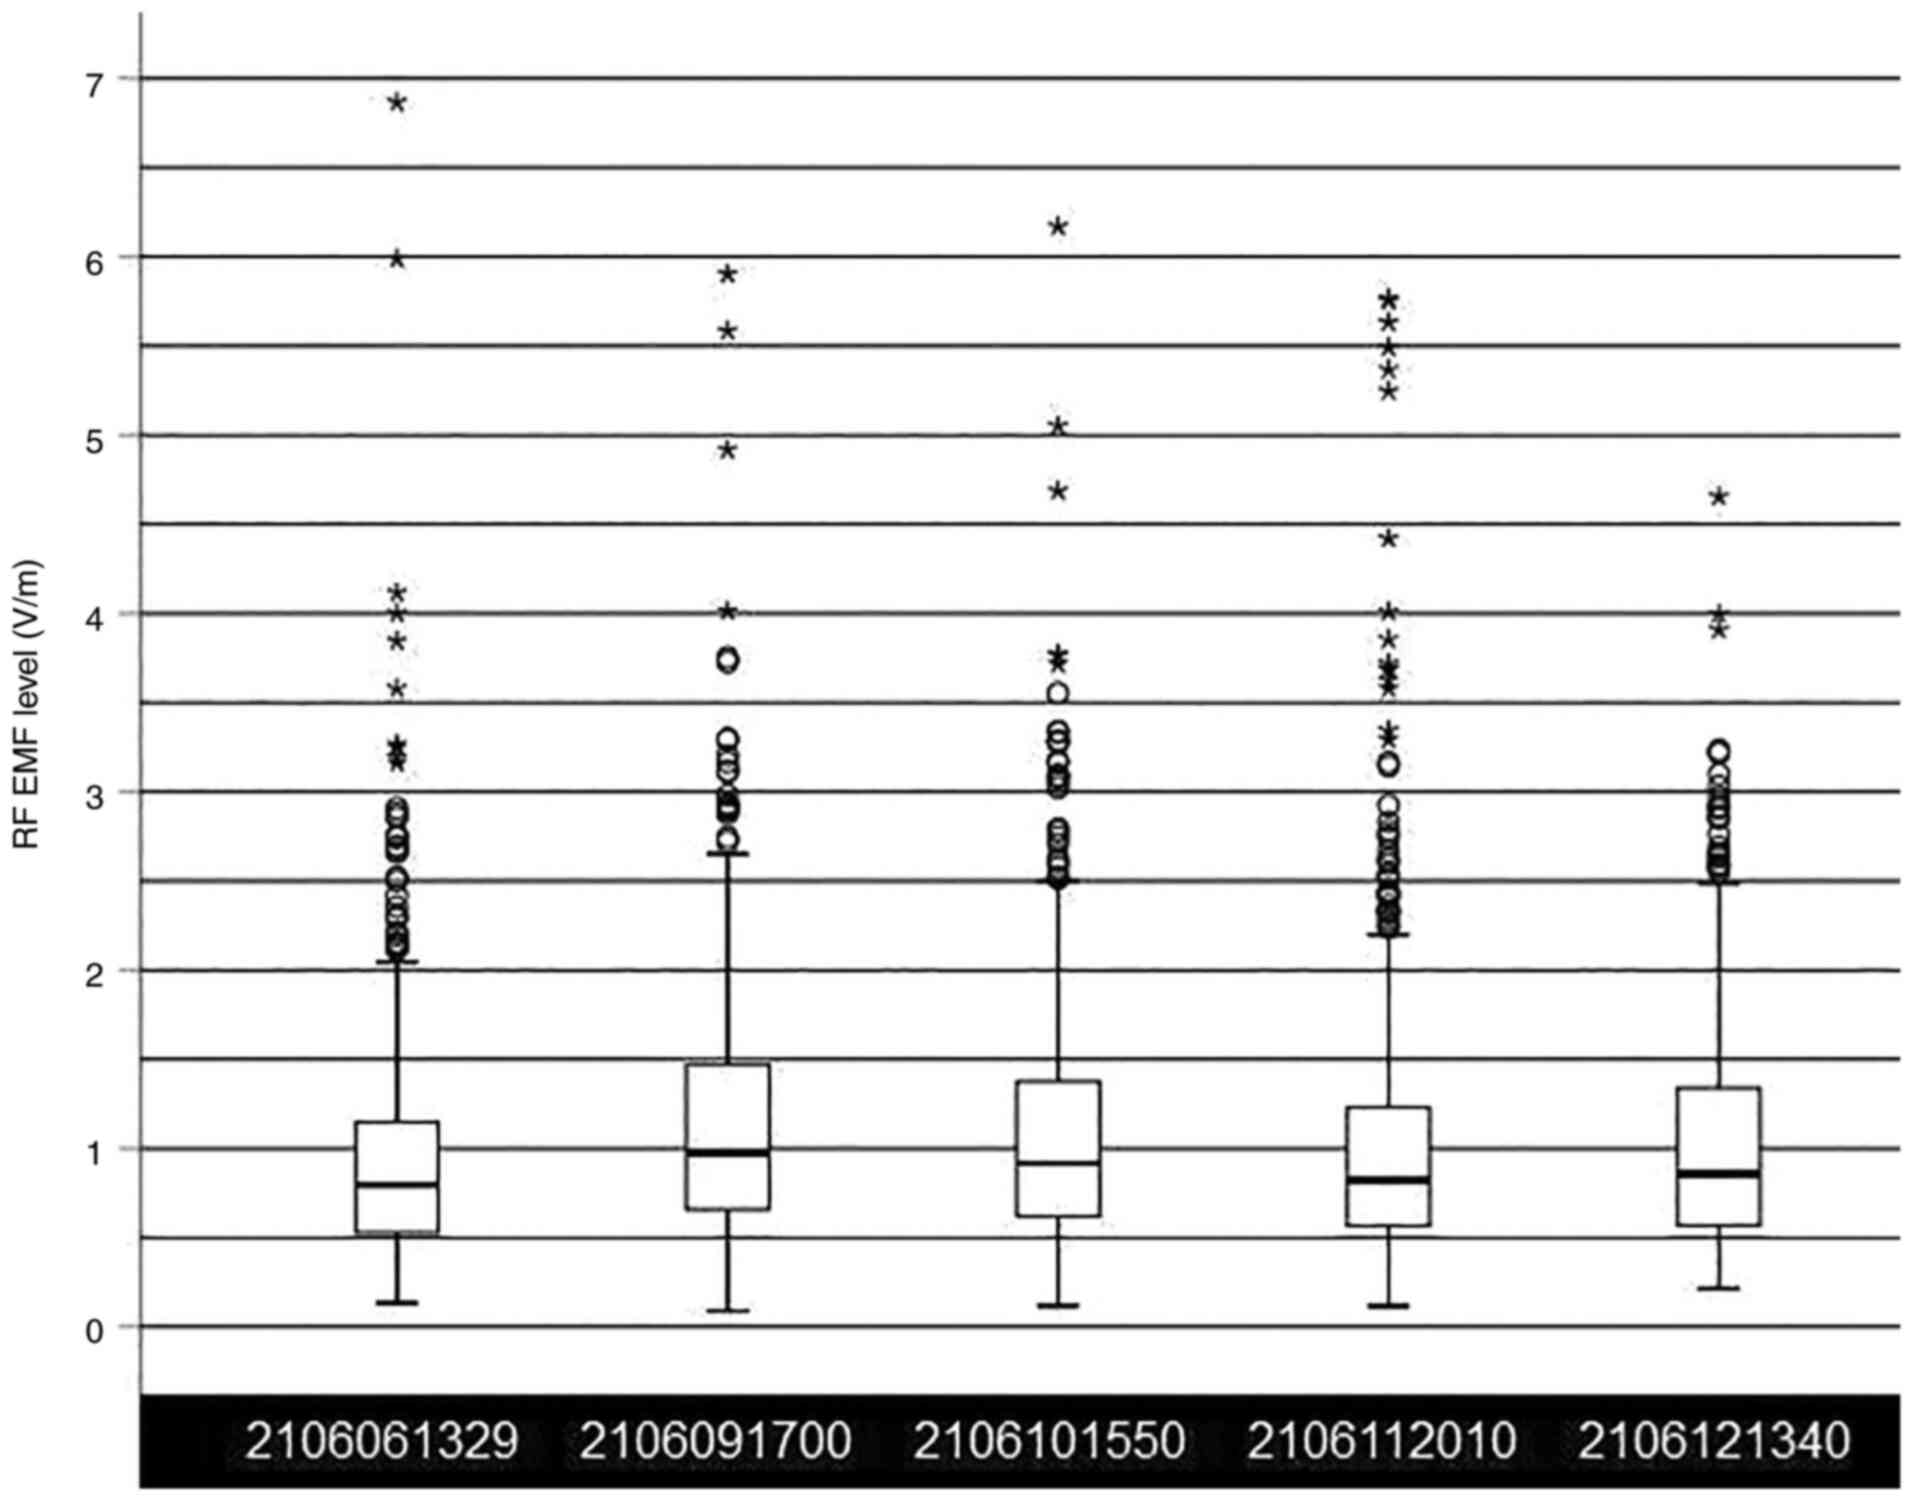
The measurements, following the same route, were
conducted on five different weekdays: 2106061329, 2106091700,
2106101550, 2106112010 and 2106121340 [the format
year/month/day/time (hhmm) designates the end time of a measurement
round]. In Fig. 4, a boxplot chart
is presented, demonstrating the total exposure, indicating temporal
fluctuations across different days and times of day. Temporal
variations across different weekdays and times of day are minimal
in Columbia with respect to public exposure. The mean exposures
over the entire route were measured as follows (in descending
order) as follows: i) highest 1.149 V/m on 2106091700, Wednesday
afternoon; ii) 1.075 V/m on 2106101550, Thursday afternoon; 1.02
V/m on 2106121340, Saturday midday; 0.985 V/m on 2106112010, Friday
evening; and the lowest 0.965 V/m on 2106061329, Sunday midday.
The exposure levels in downtown area were 12-16%
lower on weekend times as compared to business hours. The results
of the statistical analysis using ANOVA revealed a statistically
significant difference (P<0.001). Pairwise post hoc tests showed
statistically significantly different exposure levels for
2106091700 compared to 2106061329 (mean difference, 0.18 V/m;
P<0.001), for 2106101550 compared to 2106061329 (mean difference
0.11, V/m; P=0.01), for 2106112010 compared to 2106091700 (mean
difference, -0.16 V/m; P<0.001), for 2106121340 compared to
2106091700 (mean difference, -0.13 V/m; P=0.002) and for 2106112010
compared to 2106101550 (mean difference, -0.09 V/m; P=0.04)
(Table IV). The exposure was
lower on weekend times (Friday evening through Sunday) as compared
to business times. Additionally, the effect size [partial eta
squared (η2p)] characterized that 0.9% of RF level variability
accounted for different measurement times.
| Table IVPairwise post hoc comparisons between
all measurement times. |
Table IV
Pairwise post hoc comparisons between
all measurement times.
| Comparison between
different timesa | Mean difference
(V/m) |
P-valueb |
|---|
| 2106091700 vs.
2106061329 | 0.18 | <0.001 |
| 2106101550 vs.
2106061329 | 0.11 | 0.01 |
| 2106112010 vs.
2106061329 | 0.02 | 0.98 |
| 2106121340 vs.
2106061329 | 0.05 | 0.51 |
| 2106101550 vs.
2106091700 | -0.07 | 0.19 |
| 2106112010 vs.
2106091700 | -0.16 | <0.001 |
| 2106121340 vs.
2106091700 | -0.13 | 0.002 |
| 2106112010 vs.
2106101550 | -0.09 | 0.04 |
| 2106121340 vs.
2106101550 | -0.06 | 0.44 |
| 2106121340 vs.
2106112010 | 0.04 | 0.83 |
Spatial distribution of the field
During the field spatial mapping, 1,448 single
measurements were conducted. The total field exposure (sum of all
measured frequency bands) at the downtown area was as follows:
Mean, 0.879; median, 0.703; min, 0.127; max, 5.507 V/m (meter's
upper detection limit was reached). The measurement covered
altogether 14.8 miles (23.7 km). The results of spatial field
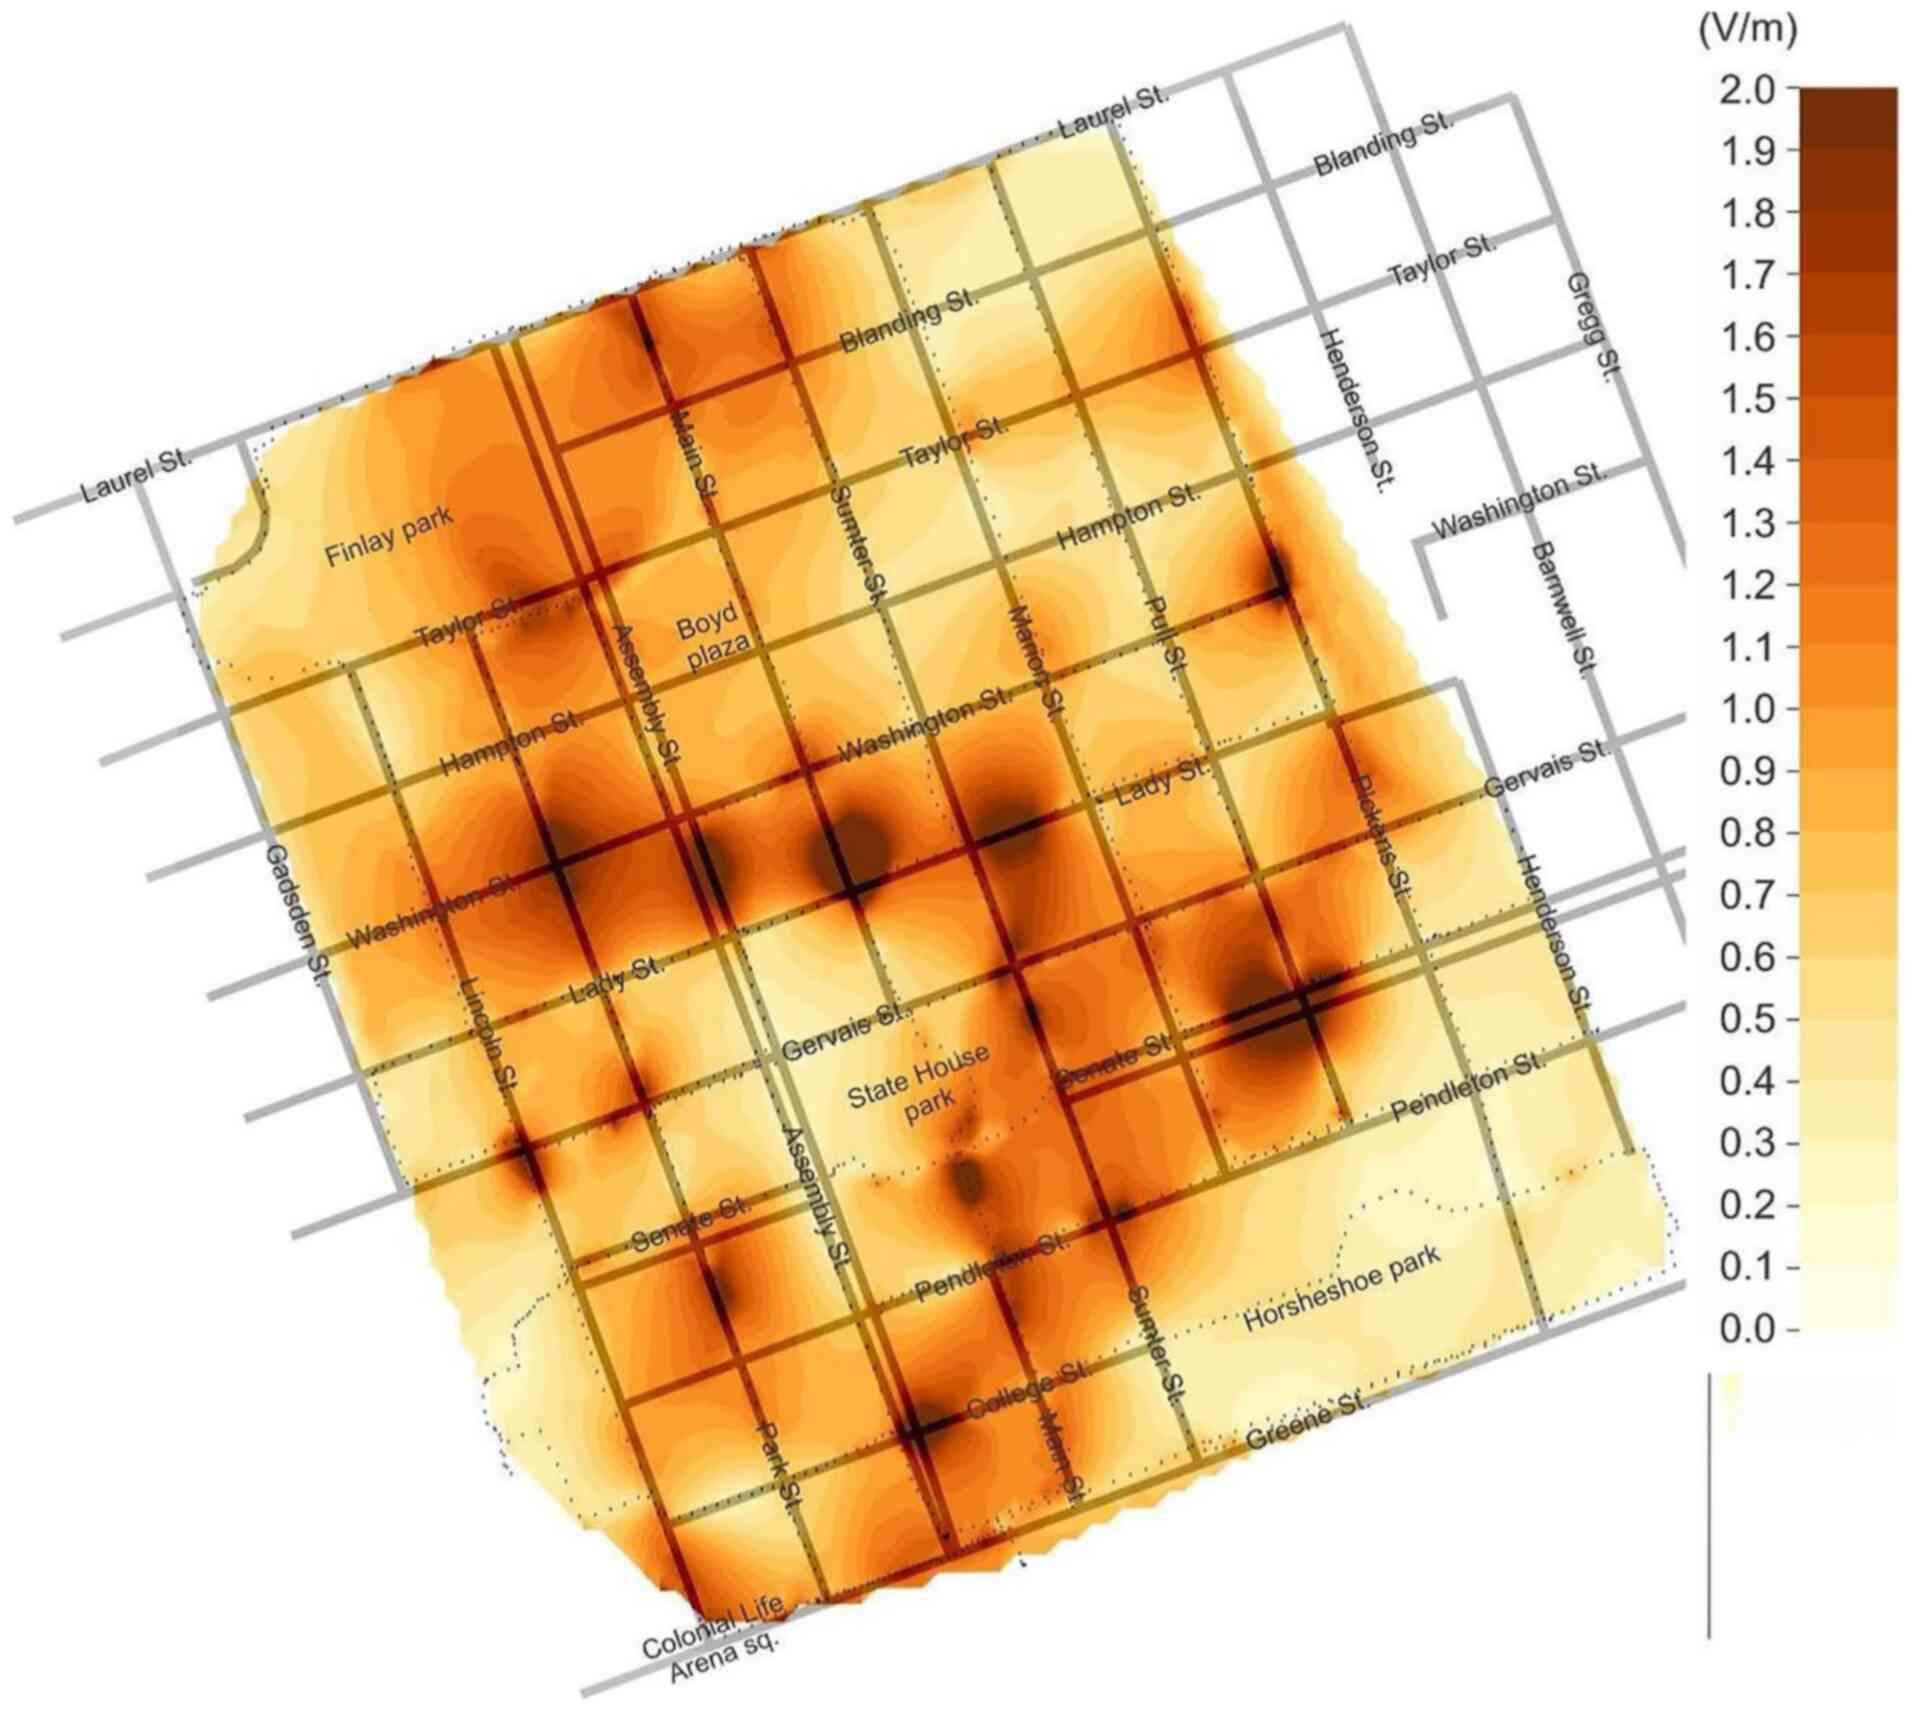
distribution in downtown Columbia, SC are depicted in Fig. 5, where ~15-20 hotspots of elevated
exposure could be identified. For example, a number of
smaller-scale hotspots could be identified in Gervais Street where
cell phone base station antennas are mounted on top of the utility
poles and therefore positioned low, close to the street level.
However, these are relatively low-powered transmitters, and also
due to the low positioning, the elevated field does not reach far.
Hotspots that cover larger areas are caused by the transmitters of
higher power, which are located on top of the tall buildings. A
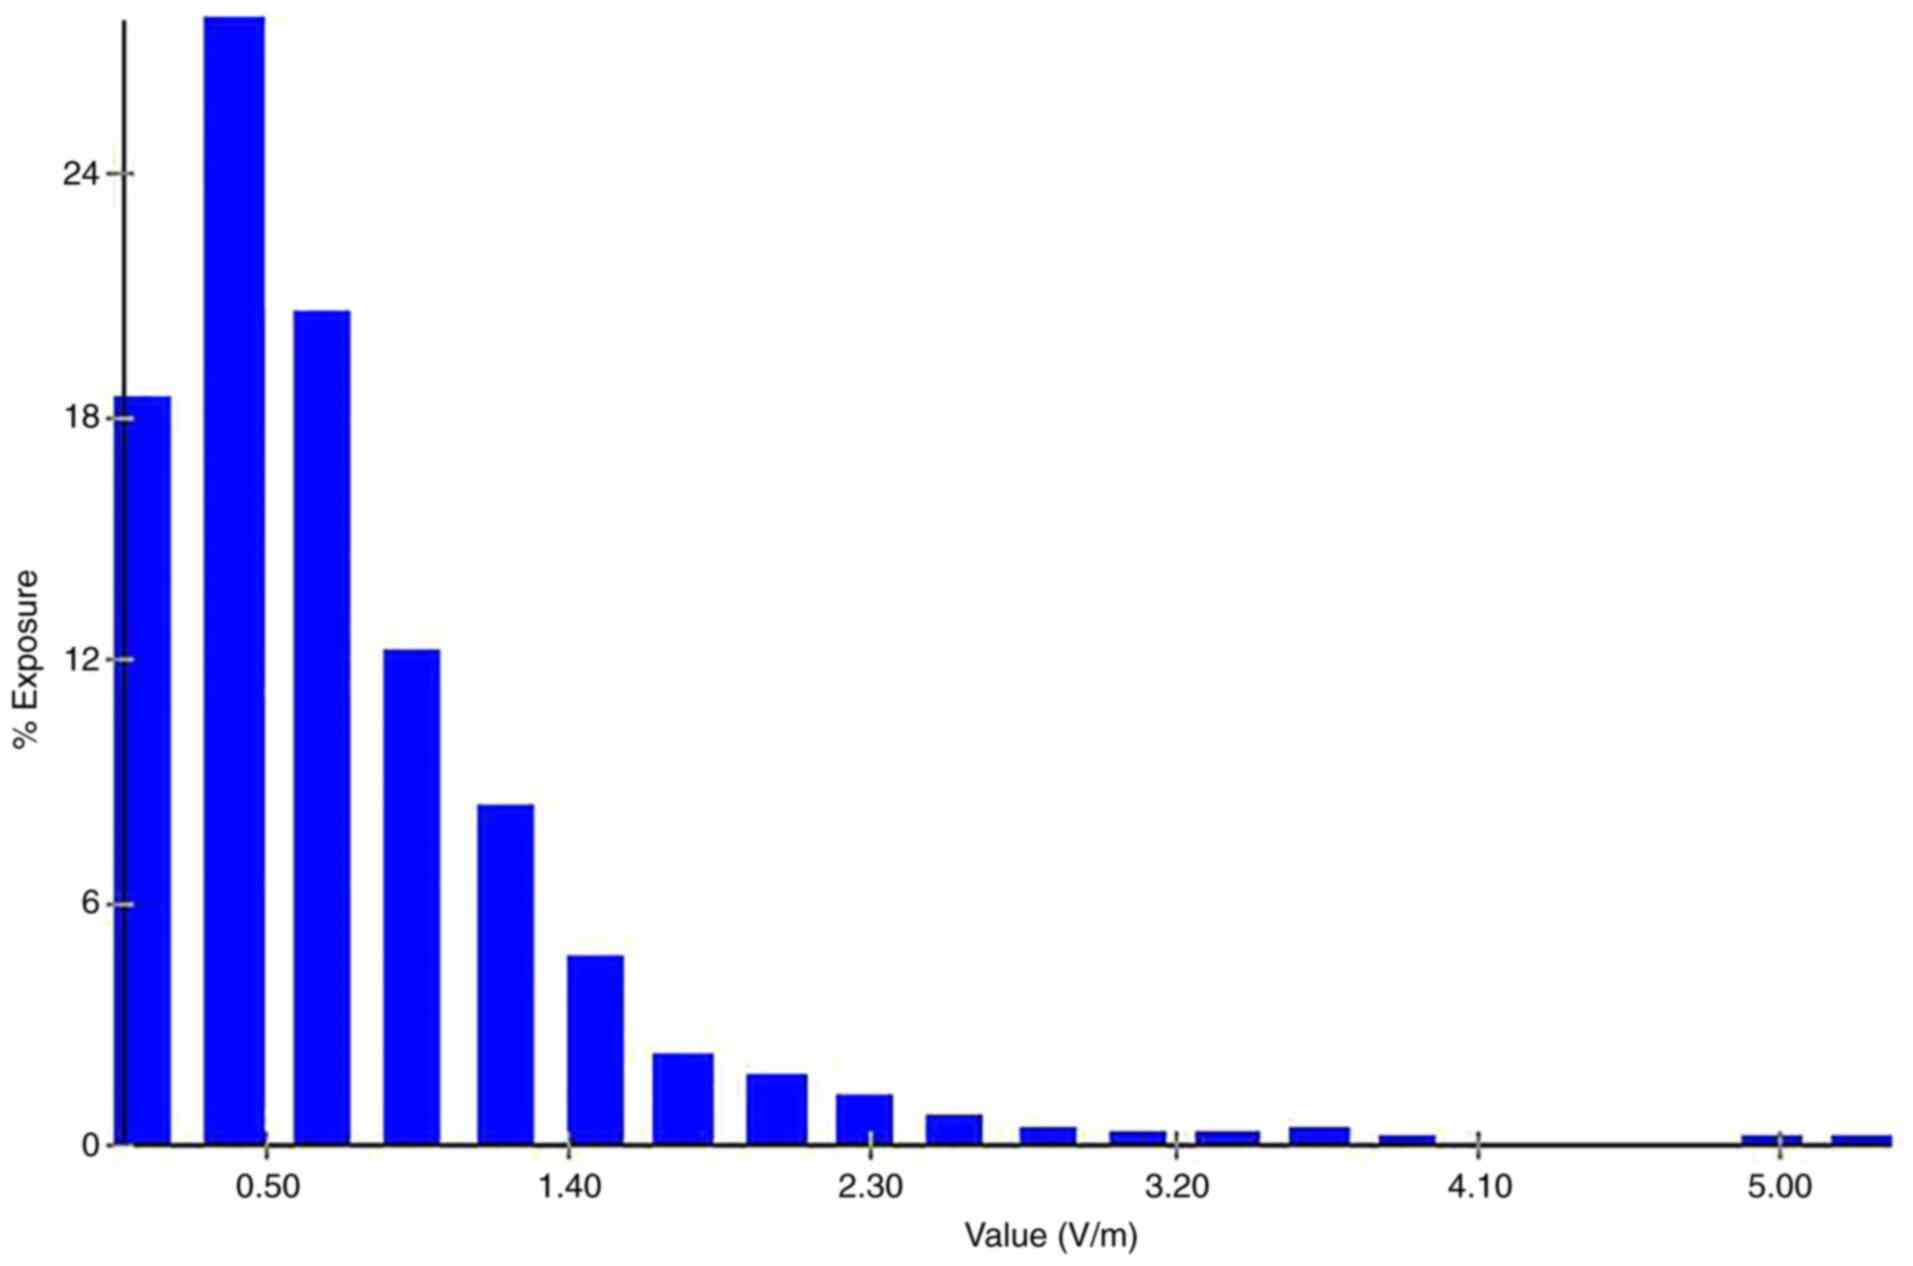
histogram of the spatial field distribution measurements is
depicted in Fig. 6. The highest
exposure levels were caused by cell phone base station antennas
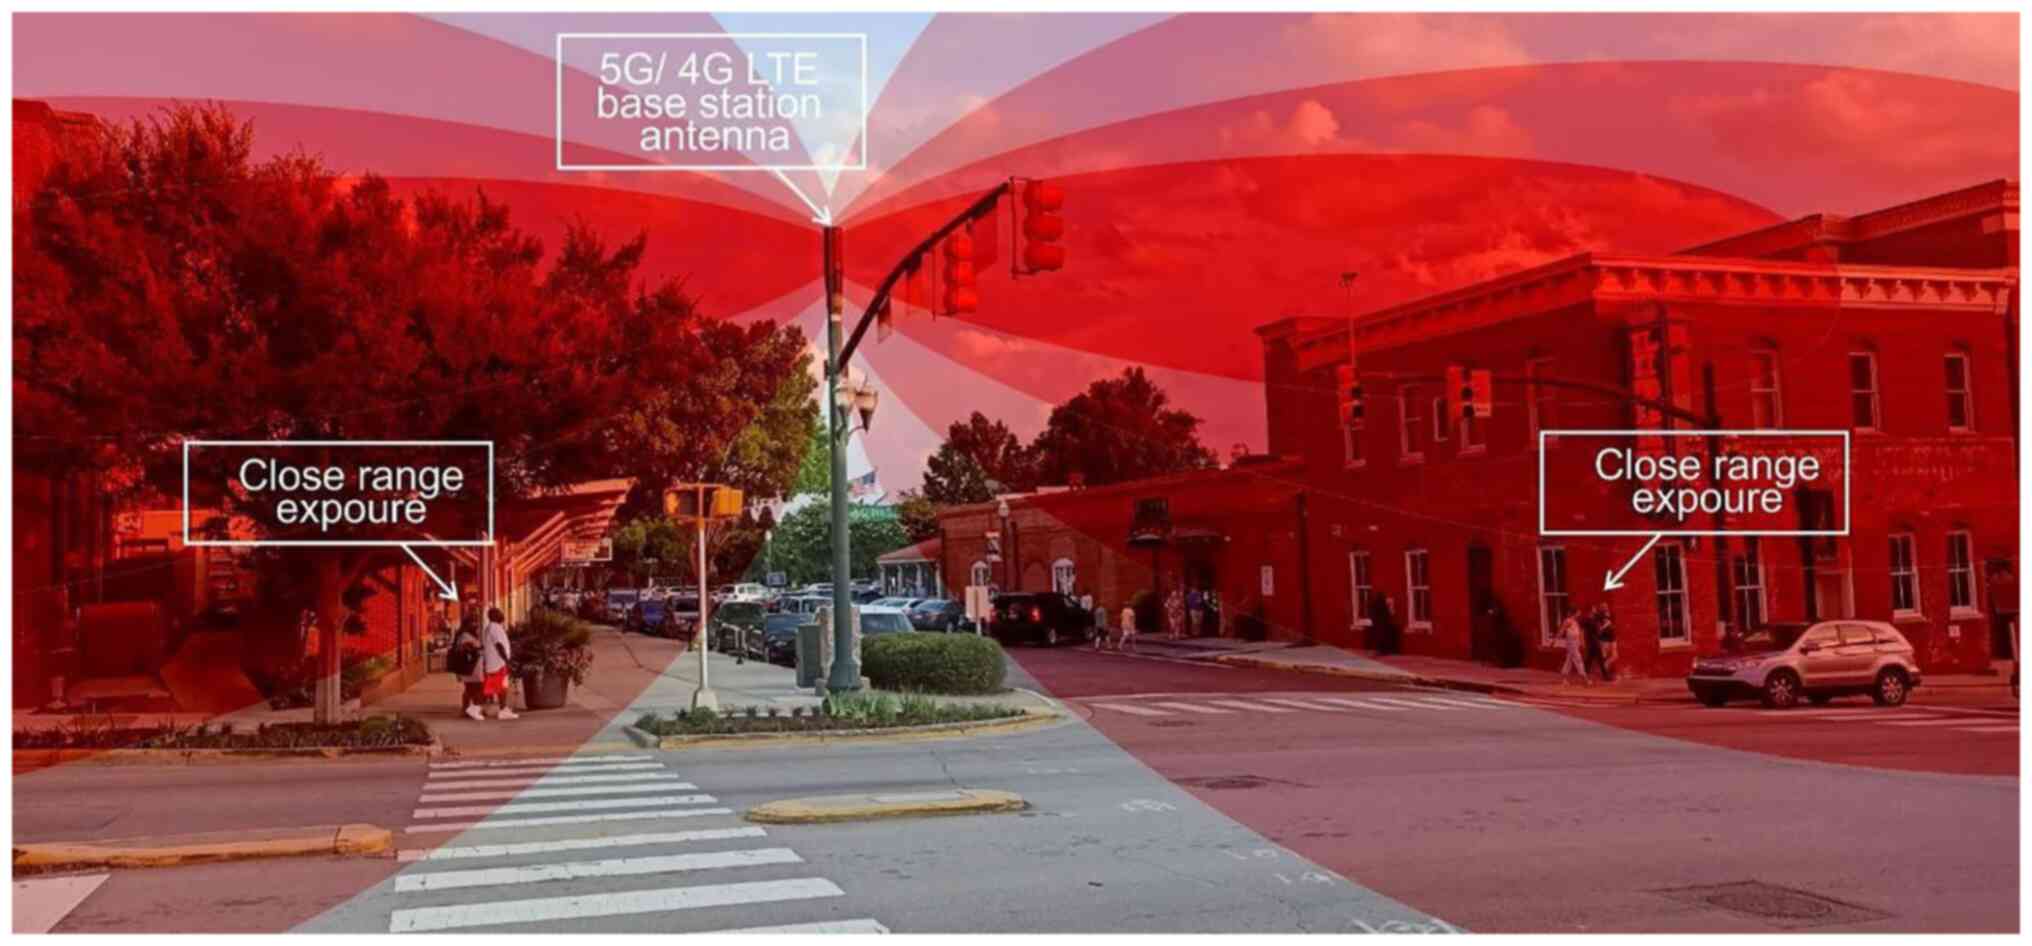
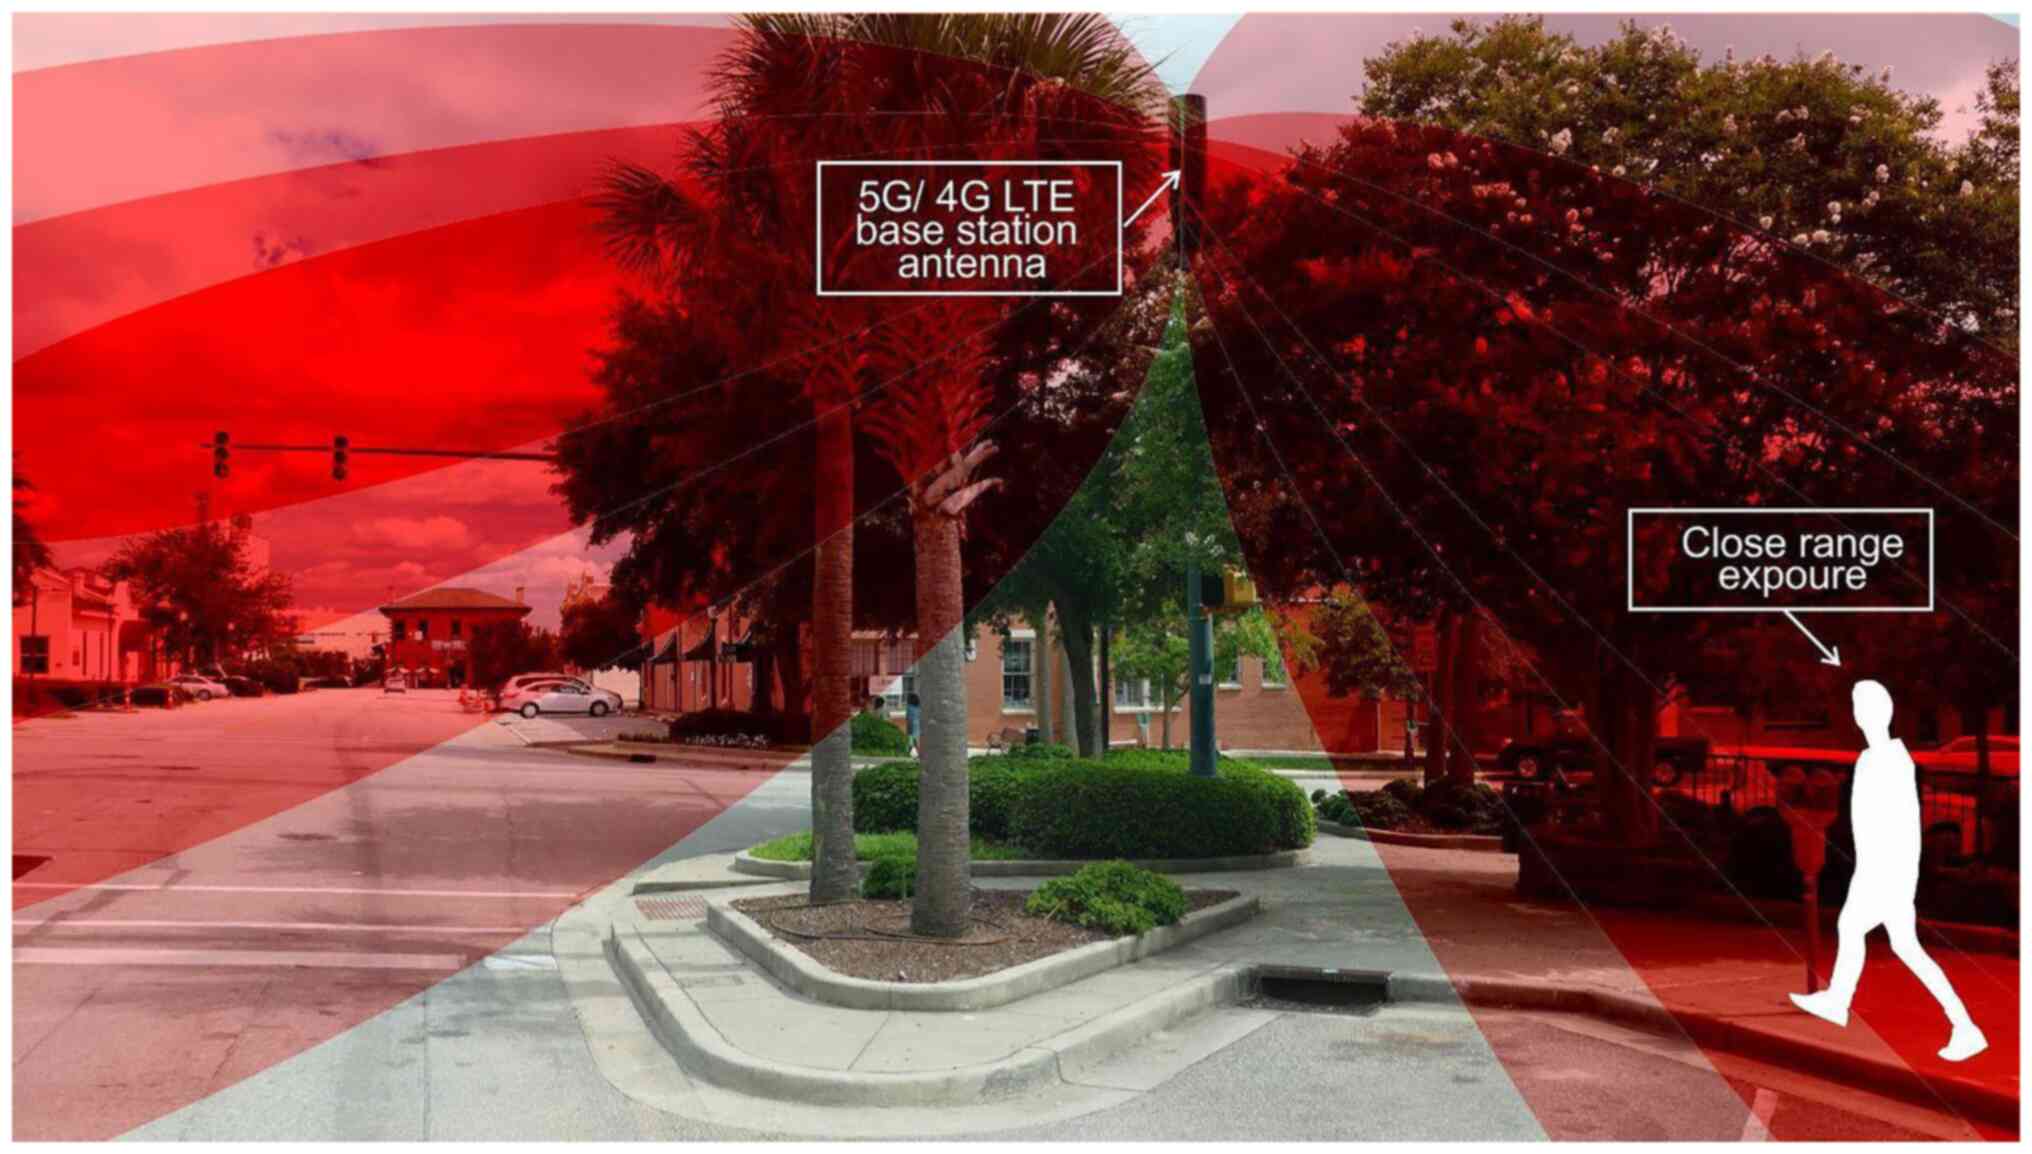
that were positioned low close to the street level (Figs. 7 and 8).
Discussion
Base stations nearby street level yielded the
highest exposure. This is demonstrated by measurements which
calculated the highest exposure for Gervais Street, where also the
maximum exposure of the entire study was registered. Unlike the
other streets measured, Gervais Street can be distinguished by two
features: i) New 5G base stations were installed and; ii) the
majority of the base station antennas were installed at a low
level, close to the street level. Hence, the present study
demonstrated that the installment of 5G base station antennas was
the reason for the highest exposure areas in the city. The reason
for the high exposure levels is the need to bring base stations
close to the subscriber devices.
Pedestrians walking on the city streets may notice
radio and TV transmitters placed on top of high-rise buildings;
however, they are unlikely to suspect that cylindrical objects on
top of utility poles, street lamps and traffic lights could be cell
phone antennas, particularly considering these are painted the same
color as the pole they are mounted on top of. Furthermore, cell
phone antennas are not always clearly visible, and thus individuals
are unaware of their presence; perhaps this is due to purposes of
conforming with any relevant city ordinance, such as
aesthetics.
Temporal analysis revealed that there was a
statistically significant difference in exposure levels in the
downtown area when comparing total exposure across different days
and times. The public exposure varied during different times and
days.
In the present study we conducted different
assessment methods to characterize city center exposure levels by
i) repetitive route measurements (mean 1,240 V/m) compared to ii)
grid measurement (mean 0.879 V/m). The difference of means can be
expected due to the following reasons: i) the grid measurement
covers a wider city center area, including areas of a lower
population density; ii) the route approach focuses more at the city
center area, where there are more RF EMF sources. Therefore, the
city center route method results in ~30% higher mean than the grid
measurement method. In addition, the temporal variation of 16%
between means from different days needs to be accounted for. When
comparing mean exposures from different cities, higher exposure
levels may be obtained, if these differ by ≥2-fold.
The present study measured RF exposure levels in
Columbia. In Columbia, SC, the measurement route, which was
conducted five times, calculated at the streets and squares 1,240
V/m as a mean exposure (total as a sum of all frequency bands) and
6.867 V/m as all times maximum (Table
II).
The majority of previous studies discussed above in
the ‘Introduction’ reported similar results in European cities. An
analogous study by the authors in Stockholm, Sweden, following the
same method, calculated 1,439 V/m as the mean exposure (2). The highest exposure levels that were
measured in a detailed measurements in Stockholm, Järntorget
square, resulted in 11.6 V/m as the maximum (3).
Jalilian et al (8), in their review article, reported the
mean outdoor exposure level of European cities to range from 0.07
to 1.27 V/m. This together with the readings from Stockholm places
the mean of Columbia city (1,240 V/m) on top of the European
scale.
In conclusion, in the city of Columbia, SC, USA, the
present study determined that the highest exposure areas were due
to two reasons: i) Cell phone base station antennas on top of
high-rise buildings provide good cell coverage reaching far away,
but creating elevated public exposure to the RF RMFs at the
immediate vicinity; and ii) cell phone base station antennas
installed on top of the utility poles have placed the radiation
source closer to humans walking on the street level.
RF exposure levels from mobile phone base station
antennas near the street level reached high levels. It is thus
recommended, that all such close proximity transmitters should be
labeled with relevant signs to warn of high RF exposure in the area
(24). Cell phone base station
antennas should be distinct and noticeable so that people who need
to limit their exposure, have been given a chance to do so by
distancing themselves from the RF sources. Considering the current
trend of cell phone service providers expanding their 5G network,
more utility pole base station antennas are expected. Consequently,
the public exposure is also likely to increase in the coming
years.
Acknowledgements
The authors express their sincere thanks to The Leto
Foundation for providing technical assistance. Mr. Michael Carlberg
(The Cancer and Environment Research Foundation, Örebro, Sweden) is
acknowledged for providing assistance with the statistical
analysis.
Funding
Funding: No funding was received.
Availability of data and materials
The datasets generated and analyzed during the
current study are available from the corresponding author on
reasonable request.
Authors' contributions
TK performed the measurements. The conception of the
study, the design and analyses of the material, the writing of the
article and the approval of the final manuscript was made by both
authors (TK and LH). Both authors confirm the authenticity of all
the raw data. Both authors have read and approved the final
manuscript.
Ethics approval and consent to
participate
Not applicable.
Patient consent for publication
Not applicable.
Competing interests
LH is an Editorial Advisor of the journal, but had
no personal involvement in the reviewing process, or any influence
in terms of adjudicating on the final decision, for this article.
The author TK declares that he has no competing interests.
References
|
1
|
United States Census Bureau. City of
Columbia. QuickFacts-Columbia City, South Carolina. 2021.
https://www.census.gov/quickfacts/columbiacitysouthcarolina.
Accessed November 19, 2021.
|
|
2
|
Carlberg M, Hedendahl L, Koppel T and
Hardell L: High ambient radiofrequency radiation in Stockholm city,
Sweden. Oncol Lett. 17:1777–1783. 2019.PubMed/NCBI View Article : Google Scholar
|
|
3
|
Hardell L, Carlberg M, Hedendahl LK,
Koppel T and Ahonen M: Environmental radiofrequency radiation at
the Järntorget Square in Stockholm Old Town, Sweden in May, 2018
compared with results on brain and heart tumour risks in rats
exposed to 1.8 GHz base station environmental emissions. World Acad
Sci J. 1:47–54. 2019.
|
|
4
|
Hardell L, Carlberg M, Koppel T and
Hedendahl L: High radiofrequency radiation at Stockholm Old Town:
An exposimeter study including the Royal Castle, Supreme Court,
three major squares and the Swedish Parliament. Mol Clin Oncol.
6:462–476. 2017.PubMed/NCBI View Article : Google Scholar
|
|
5
|
Koppel T, Ahonen M, Carlberg M, Hedendahl
LK and Hardell L: Radiofrequency radiation from nearby mobile phone
base stations-a case comparison of one low and one high exposure
apartment. Oncol Lett. 18:5383–5391. 2019.PubMed/NCBI View Article : Google Scholar
|
|
6
|
Hedendahl LK, Carlberg M, Koppel T and
Hardell L: Measurements of radiofrequency radiation with a
body-borne exposimeter in Swedish schools with Wi-Fi. Front Public
Health. 5(279)2017.PubMed/NCBI View Article : Google Scholar
|
|
7
|
Hardell L, Koppel T, Carlberg M, Ahonen M
and Hedendahl L: Radiofrequency radiation at Stockholm Central
Railway Station in Sweden and some medical aspects on public
exposure to RF fields. Int J Oncol. 49:1315–1324. 2016.PubMed/NCBI View Article : Google Scholar
|
|
8
|
Jalilian H, Eeftens M, Ziaei M and Röösli
M: Public exposure to radiofrequency electromagnetic fields in
everyday microenvironments: An updated systematic review for
Europe. Environ Res. 176(108517)2019.PubMed/NCBI View Article : Google Scholar
|
|
9
|
Sagar S, Dongus S, Schoeni A, Roser K,
Eeftens M, Struchen B, Foerster M, Meier N, Adem S and Röösli M:
Radiofrequency electromagnetic field exposure in everyday
microenvironments in Europe: A systematic literature review. J Expo
Sci Environ Epidemiol. 28:147–160. 2018.PubMed/NCBI View Article : Google Scholar
|
|
10
|
Viel FJ, Clerc S, Barrera C, Rymzhanova R,
Moissonnier M and Cardis E: Residential exposure to radiofrequency
fields from mobile phone base stations, and broadcast transmitters:
A population-based survey with personal meter. Occup Environ Med.
6:550–556. 2009.PubMed/NCBI View Article : Google Scholar
|
|
11
|
Estenberg J and Augustsson T: Extensive
frequency selective measurements of radiofrequency fields in
outdoor environments performed with a novel mobile monitoring
system. Bioelectromagn. 35:227–230. 2014.PubMed/NCBI View Article : Google Scholar
|
|
12
|
Sagar S, Adem SM, Struchen B, Loughran SP,
Brunjes ME, Arangua L, Dalvie MA, Croft RJ, Jerrett M, Moskowitz
JM, et al: Comparison of radiofrequency electromagnetic field
exposure levels in different everyday microenvironments in an
international context. Env Int. 114:297–306. 2018.PubMed/NCBI View Article : Google Scholar
|
|
13
|
Thielens A, Van den Bosschea M, Brzozekc
C, Bhatt C, Abramson M, Benke G, Martens L and Joseph W:
Microenvironmental personal and head exposure measurements of
radio-frequency electromagnetic fields. In: Joint Annual Meeting of
the Bioelectromagnetics Society and the European BioElectromagn
Assoc (BioEM 2018). Melbourne, pp273-279, 2018.
|
|
14
|
Misek J, Laukova T, Kohan M, Veternik M,
Jakusova V and Jakus J: Measurement of low-level radiofrequency
electromagnetic fields in the human environment. Acta Med
Martiniana. 18:27–33. 2018.
|
|
15
|
Iyare RN, Volskiy V and Vandenbosch GA:
Study of the electromagnetic exposure from mobile phones in a city
like environment: The case study of Leuven, Belgium. Environ Res.
175:402–413. 2019.PubMed/NCBI View Article : Google Scholar
|
|
16
|
Cansiz M, Abbasov T, Kurt MB and Celik AR:
Mapping of radio frequency electromagnetic field exposure levels in
outdoor environment and comparing with reference levels for general
public health. J Expo Sci Environ Epidemiol. 28:161–165.
2018.PubMed/NCBI View Article : Google Scholar
|
|
17
|
Kurnaz C and Mutlu M: Comprehensive
radiofrequency electromagnetic field measurements and assessments:
A city center example. Environ Monit Assess.
192(334)2020.PubMed/NCBI View Article : Google Scholar
|
|
18
|
Tang C, Yang C, Cai RS, Ye H, Duan L,
Zhang Z, Shi Z, Lin K, Song J and Huang X: Analysis of the
relationship between electromagnetic radiation characteristics and
urban functions in highly populated urban areas. Sci Total Environ.
654:535–540. 2019.PubMed/NCBI View Article : Google Scholar
|
|
19
|
Federal Communications Commission. A Rule
by the Federal Communications Commission on 10/10/2012. 2012.
https://www.federalregister.gov/documents/2012/10/10/2012-24792/private-land-mobile-radio-rules.
Accessed November 19, 2021.
|
|
20
|
ETSI EN 300 392-2 V3.2.1 (2007-09),
European standard, Terrestrial Trunked Radio (TETRA); Voice plus
Data (V+D); Part 2: Air Interface (AI). 2007. https://www.etsi.org/deliver/etsi_en/300300_300399/30039202/03.02.01_60/en_30039202v030201p.pdf.
Accessed November 19, 2021.
|
|
21
|
Loy M, Karingattil R and Williams L (eds):
ISM-Band and Short Range Device Regulatory Compliance Overview,
Application Report, Texas Instruments. 2003, http://www.ti.com/lit/pdf/swra048. Accessed November
19, 2021.
|
|
22
|
Federal Communications Commission.
Unlicensed Personal Communications Service Devices in the 1920-1930
MHz Band. A Rule on 07/23/2012. 77 FR 4300. 2012. https://www.federalregister.gov/documents/2012/07/23/2012-17793/unlicensed-personal-communications-service-devices-in-the-1920-1930-mhz.band.
Accessed November 19, 2021.
|
|
23
|
European Telecommunications Standards
Institute. Digital Enhanced Cordless Telecommunications (DECT); A
High Level Guide to the DECT Standardization, ETSI TR 101 178
V1.5.1 (2005-02) Technical Report. 2005. http://www.etsi.org/deliver/etsi_tr/101100_101199/101178/01.05.01_60/tr_101178v010501p.pdf.
Accessed November 19, 2021.
|
|
24
|
Recommendation 13 (page 16) of the State
of New Hampshire report: ʻCommission to Study The Environmental and
Health Effects of Evolving 5G Technology’. http://www.gencourt.state.nh.us/statstudcomm/committees/1474/reports/5G%20final%20report.pdf.
|