Introduction
In some areas of the world, the consumption of
mineral soils is common among wild and domestic animals. Regular
geophagy leads to the formation of easily recognizable landscape
complexes usually named salt licks or mineral licks in scientific
literature. As will be demonstrated below, these objects are not
always directly related to soluble salts and licking. That is why
it was decided to use the term ‘kudur’ which originates from the
Turkic shepherds (1). The term
‘kudurit’ derived from kudur, means mineral soil that is eaten at
kudurs.
The geophagy of animals has been systematically
studied since the 1930s. A number of researchers have tried to
understand the reasons leading to the consumption of rocks and
mineralized water from the springs by animals. However, currently,
there are only a series of hypotheses with varying degrees of
evidence. The most common of these are: The need for sodium and
mineral sorbents to normalize the electrolyte balance in the
digestive tract during the periods of seasonal transition of
animals from roughage to green food (2-4);
the replenishment of iron in the body; the renewal of
microorganisms in the intestine; b the acteriostatic action of clay
minerals against pathogenic microflora; parasite control; pH
regulation in the digestive tract (5-8);
and the removal of the toxic organic compounds from the body using
mineral sorbents (9-11).
After analyzing the extensive material on the
geochemistry of eaten earths in different regions of the world, it
was hypothesized that there are only two main reasons for the
desire for geophagy explaining all the cases worldwide. The first
one is the electrolyte imbalance in the body most often associated
with the lack of sodium in the diet. The other reason is associated
with disorders of the metabolism of rare earth elements (REE). The
second reason may be more common. The main point of the REE
hypothesis (12,13) is that some elements from the light
lanthanides group associated with nerve tissues and internal
secretion gland enzymes can be replaced by heavy lanthanides,
which, contrary to the light ones, are not able to perform the
functions necessary for the body. As a result, vital systems of the
body can be affected, which manifests in the decreasing adaptive
capacity of the body to counteract adverse external factors
(geochemical, cosmophysical, climatic and others). Animals under
hormonal stress begin searching for substances that can be either a
source of lacking REEs or their effective sorbents. This type of
stress and the associated urge for geophagy were reproduced by
American researchers on laboratory rats in the late 1970s. The
experiment demonstrated that rats with artificially induced stress
as a result of disturbed metabolic processes in the body
(artificially induced arthritis) began to actively eat clay
(14).
The research performed by the authors in the
Sikhote-Alin in 2020 demonstrated that in the areas where geophagy
is widespread among wild ungulates, acid volcanogenic and
volcanogenic-sedimentary rocks enriched in REE are predominant. The
weathering of these rocks leads to the formation of secondary
readily soluble rare earth hydrous phosphates, carbonates, and
fluorocarbonates over primary magmatic rare earth minerals. As a
result, there is the accumulation of rare-earth elements in all
landscape components (natural waters, soils, vegetation, and the
hormonal system of herbivores), i.e., in fact, the development of
landscape REE-abnormalities (15).
It was concluded that an excess of REE in the neuroimmunoendocrine
system of the body, which is a carrier of this group of elements,
causes a stress response in animals making them seek mineral
sorbents capable of correcting the REE imbalance in the body.
In 2021, to verify the REE hypothesis, similar
studies were carried out in the Altai (16) Mountains, a region with a
fundamentally different geological background, composition of
rocks, climate and plants and animals compared to the Sikhote-Alin.
The research was carried out on the coast of the Teletskoye Lake
and in the estuary part of the Chulyshman River (hereinafter
referred to as the Teletsky or T-area), and also in the upper
reaches of the Chulyshman River near the Yazula settlement
(hereinafter referred to as the Yazula or Y-area). These are the
areas of the Altai Mountains with well-known cases of animal
geophagy accompanied by the formation of well-defined kudurs. The
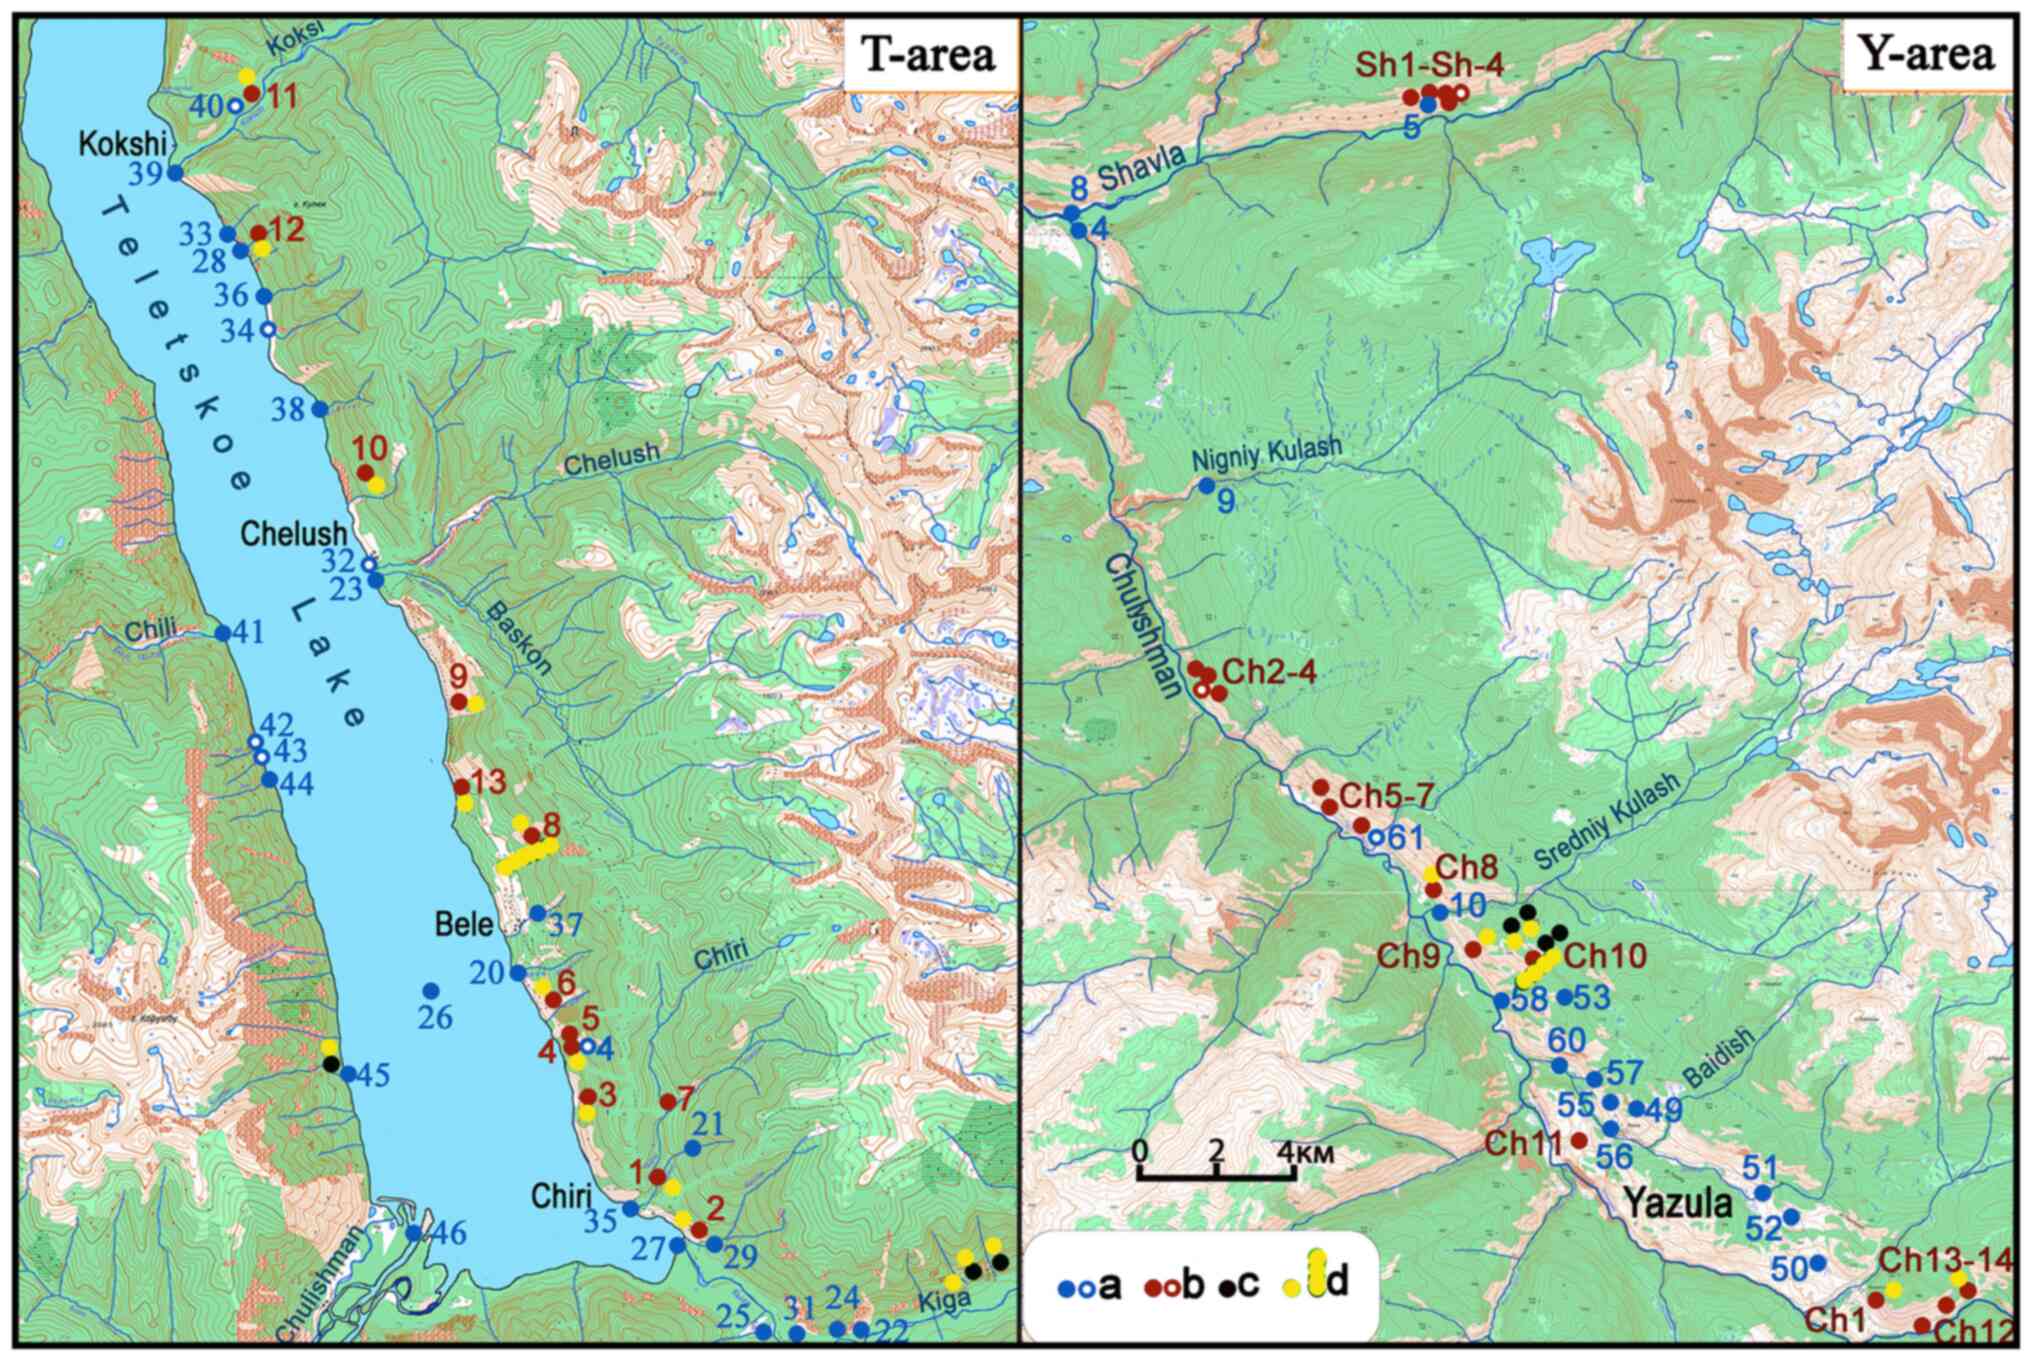
location of the study areas with kudurs is shown on the geological
map (Fig. 1).
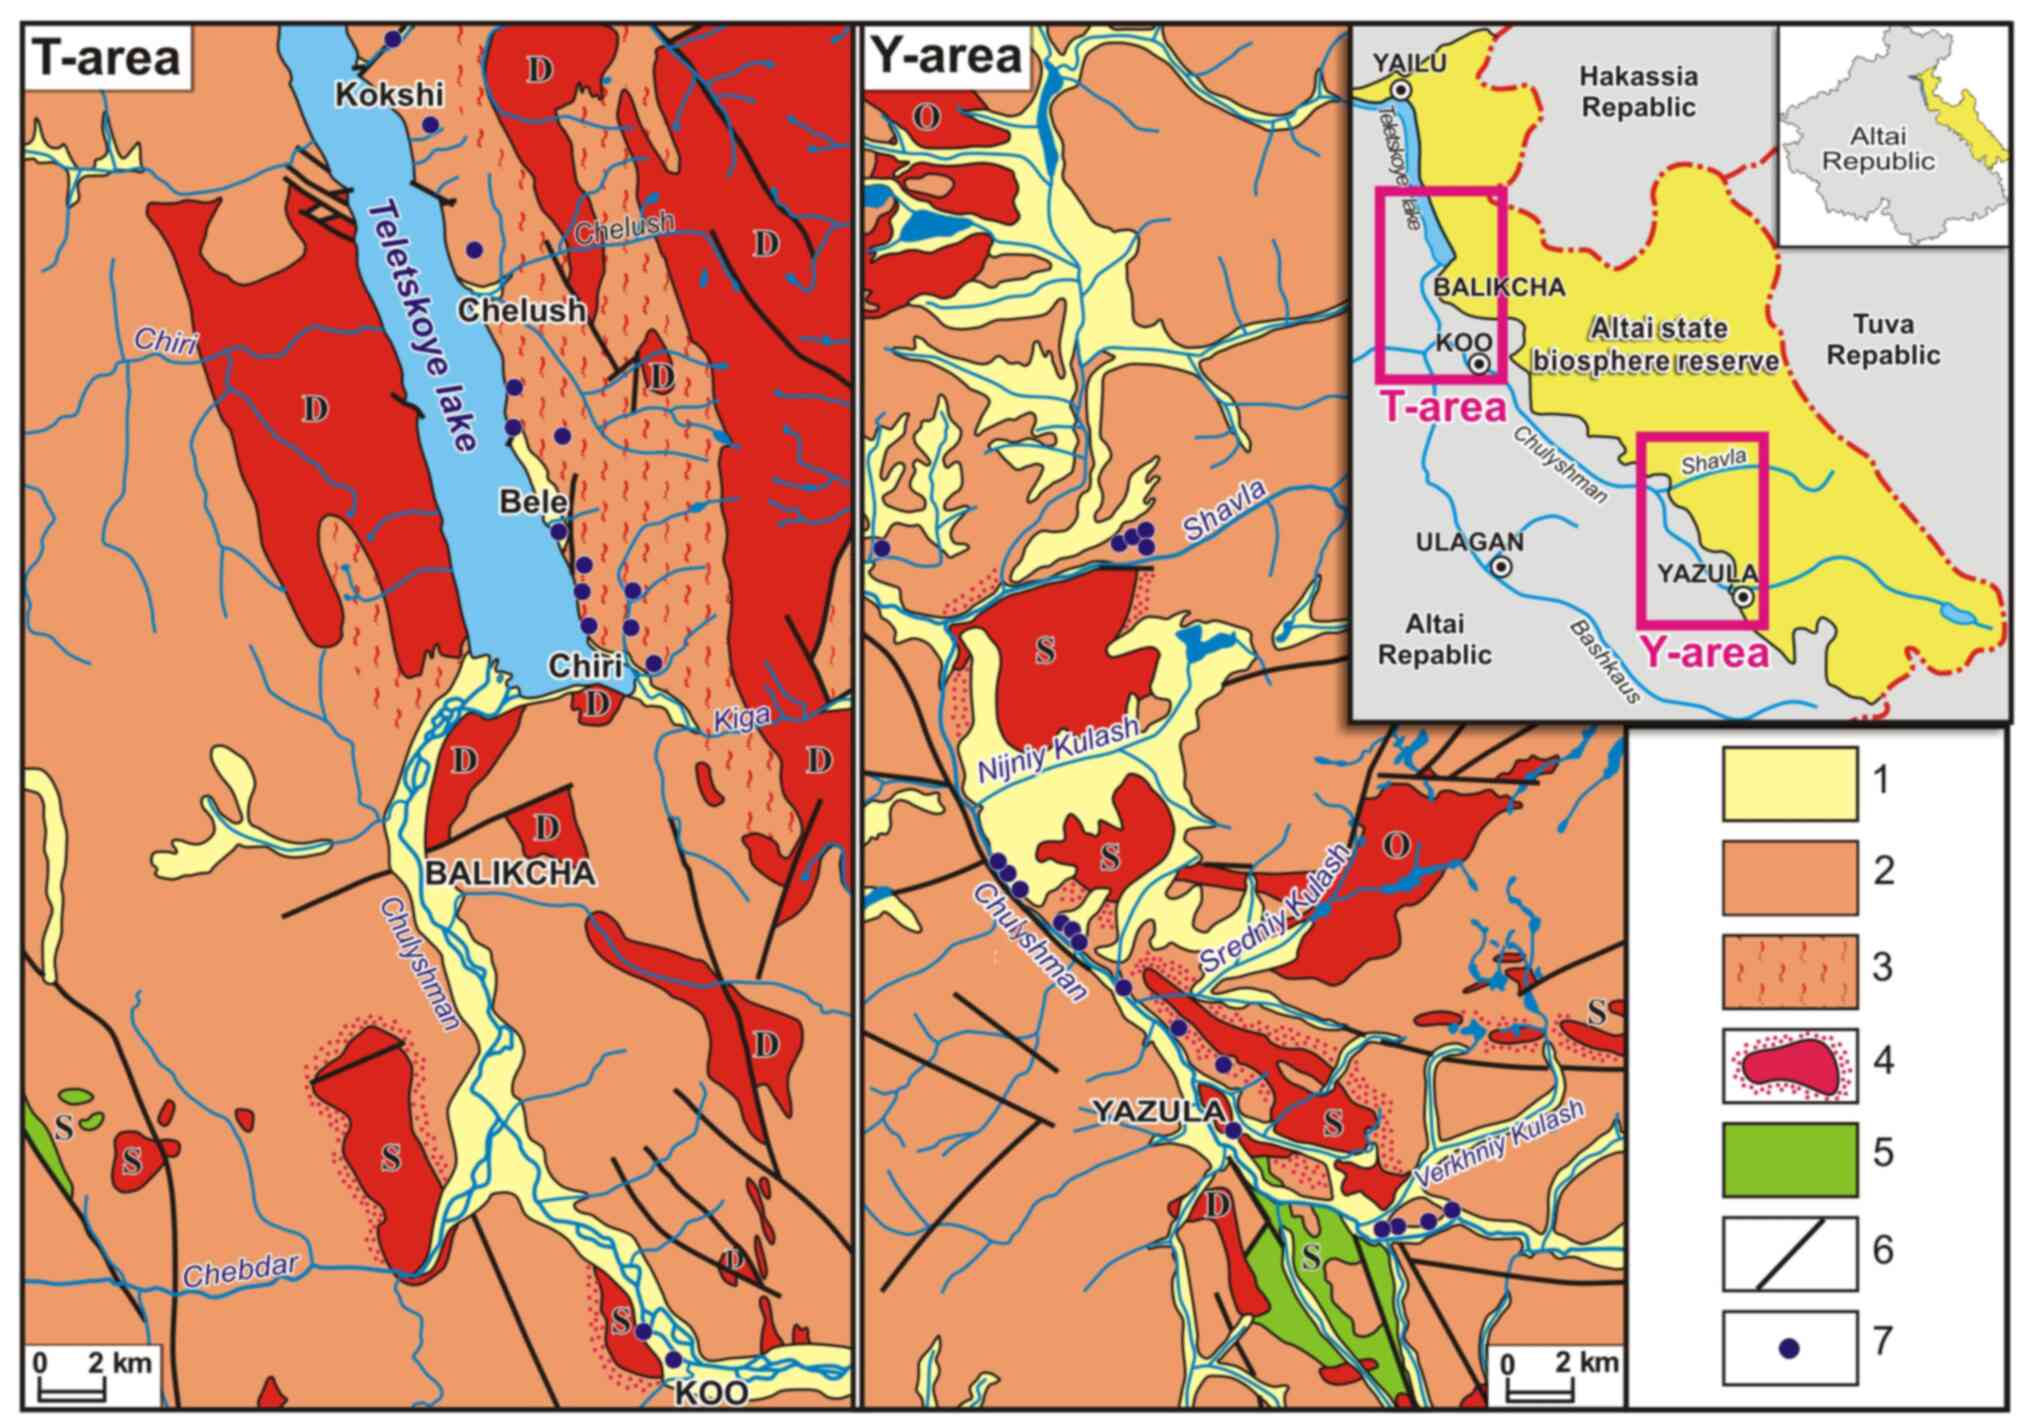 | Figure 1Geological structure of the study
areas and their location relative to the territory of the Altai
State Biosphere Reserve and the Altai Republic: 1, Quaternary
aqueous and aqueoglacial deposits (pebble, boulders, sandy loam and
loam); 2 and 3, Proterozoic and Early Paleozoic metamorphic rocks
[mainly quartz-albite-sericite and quartz-sericite-chlorite schists
(2) and gneiss (3)]; 4, Devonian, Ordovician and Silurian
granitoids, including those with the contact metamorphism aureoles;
5, Silurian diorites and gabbro-diorites; 6, tectonic faults; 7,
kudurs. |
It should be noted that the authors have already
studied soil eaten by animals in the coastal zone of Teletskoye
Lake in 2016(17). At that time,
it was found that the Altai kudurits contained low sodium (Na)
concentrations. However, there were higher REE concentrations
compared to the Sikhote-Alin, which could be extracted with the
hydrochloric acid solution. The authors also conducted similar
studies in 2018 on the Shavla River and near the Yazula settlement.
These data have not been published yet, and were also used in the
present study.
The research objectives included: The analysis of
the geological structure of the study areas according to the data
of the state geological survey; field collection of factual
material (samples of water, rock, and loose soil including the
kudurits, and vegetation samples); and various laboratory studies
of the collected material. Based on the data obtained and taking
into account the information from literature sources, the authors
aimed to draw a justified conclusion about the cause of
geophagy.
Following is a brief description of the study areas
and research objects in the present study:
The Teletsky area
The geology, geomorphology and the landscape of the
Teletskoye Lake area, as well as the characteristics of the local
kudurs have been previously described by the authors in sufficient
detail (17). Herein, only the
most critical points ares mentioned.
There are numerous kudurs in the Teletskoye Lake
area; however, they appear only on the southeastern shore.
According to the study by Sobanskiy (18), there are about 40 kudurs in this
part of the lake shore. They are also found near the estuary of the
Chulyshman River valley, in particular, near the Koo settlement
(Fig. 1).
The majority of the local kudurs are dry,
represented by outcrops of loose (sometimes poorly cemented) rocks
with characteristic depressions eaten by animals. They are formed
at the slopes and on the surface of a multi-level river and lake
terraces on thinly dispersed aqueous and glacial (more often,
glaciolacustrine) deposits. Sometimes they also appear on
interlayers of eolian material in modern diluvial and landslide
deposits. The main rocks in the area are strongly metamorphosed
mainly primary sedimentary rocks of the Proterozoic represented
mostly by quartz-albite-sericite schists and gneisses cut by
granitoids of the Middle Paleozoic age (presumably, Silurian and
Devonian) (Fig. 1).
The kudurs on the Teletskoye Lake are most often
visited by red deer (Cervus elaphus sibiricus), also
Siberian roe deer (Capreolus pygargus), hares (Lepus
timidus) and rarely, wild boar (Sus scrofa). According
to the local old residents, until the early 1930s, the kudurs were
also actively visited by Siberian ibex (Capra sibirica),
which at that time lived along the lake shores. According to the
annals of the Reserve, the main peak of visits to kudurs is from
April to July, with another slight increase in September-November.
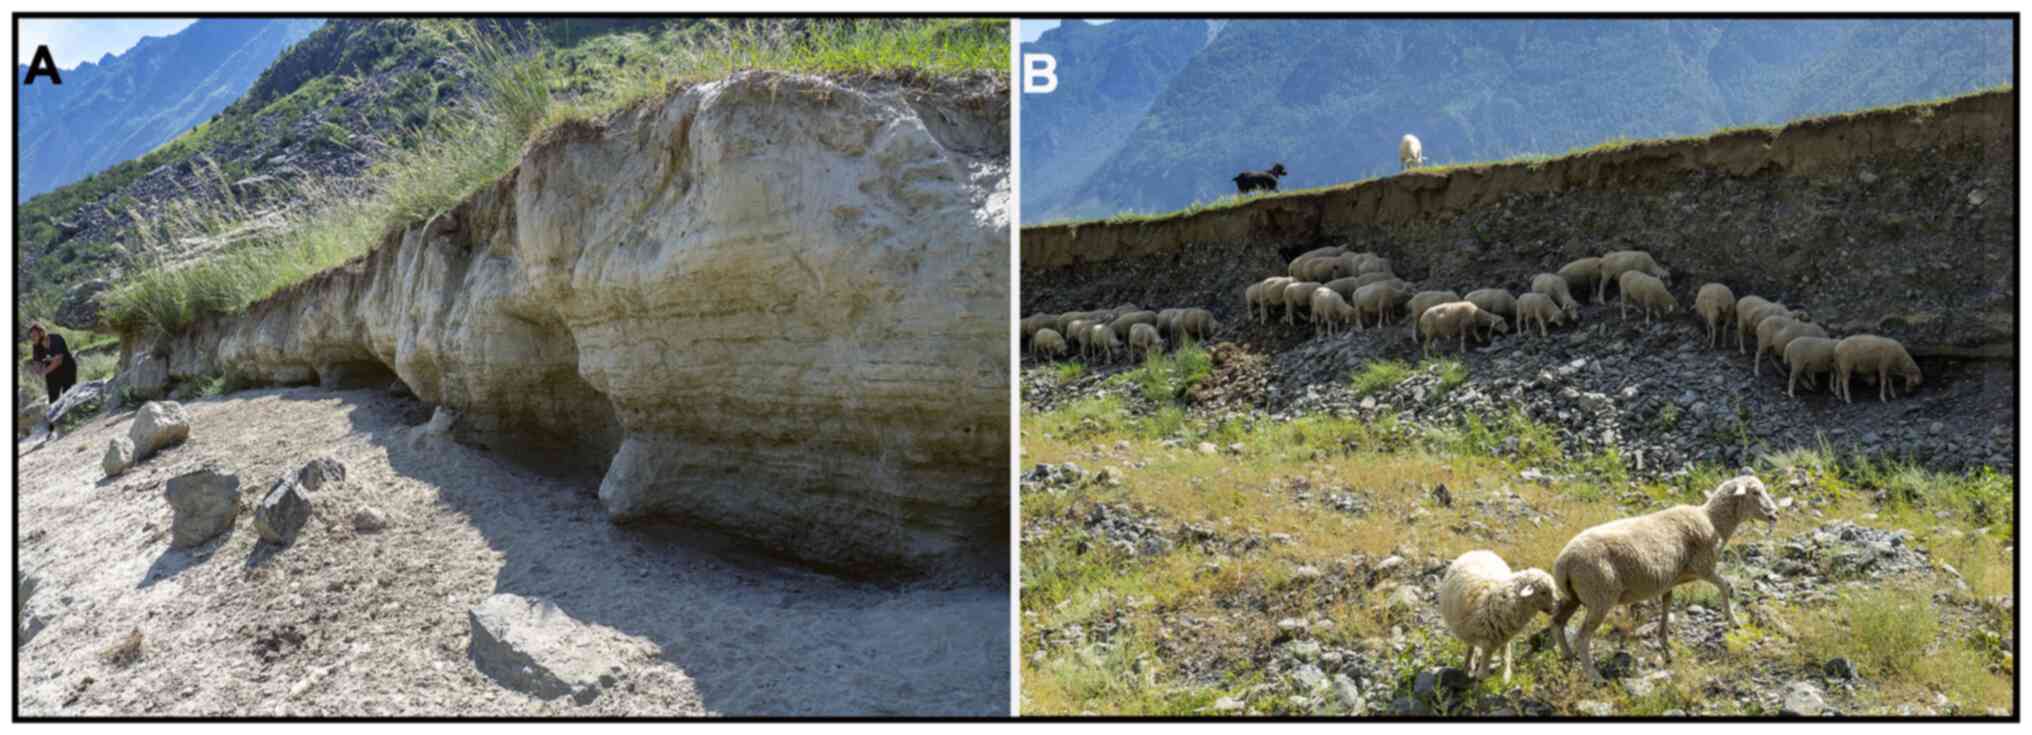
Near the Koo settlement, where Silurian granites outcrop in the
river valley, kudurs are equally actively visited by domestic
animals (Fig. 2B).
The Yazula area. The upper reaches of the
Chulyshman River near the Yazula village is a deeply dissected
mountain plateau with individual towering mountain massifs, with
absolute marks from 1,500 to 3,000 m. The valleys of the main
rivers are deeply incised, with terraces and floodplains of varying
degrees of intensity. Plateau-shaped watersheds are swamped in some
places, and the slopes of river valleys and floodplains are partly
covered with forests snd steppe. The tree cover is mainly
represented by larch (Larix sibirica). On the northern
slopes and in river valleys, dark conifers mingle with larch:
Siberian spruce (Picea obovata), Siberian fir (Abies
sibirica) and Scots pine (Pinus silvestris). Siberian
pine (Pinus sibirica) is predominant on the tops of slopes
and in the watersheds.
There are numerous kudurs near the Yazula
settlement. They are very similar to the Teletsky area kudurs both
in appearance and place of occurrence. All the kudurs studied
appeared on stepped surfaces of different steepness, mostly on
southern slopes. The vegetation is represented mainly by
fescue-sagebrush and forb-sagebrush steppe with the main dominants
of the Artemisia genus: Artemisia gmelinii, A.
frigida, A. viridis, A. commutata and A.
dracunculus. In the grasses, fescue is predominant: Festuca
pseudovina, F. vallesiaca and feather grass (Stipa
capillata). Mixed herbs include cinquefoil (Potentilla
acaulis), stonecrop (Orostachys spinosa), crassula
(Sedum hybridum), and sedge (Carex supina and C.
pediformis). The majority of these species are food for
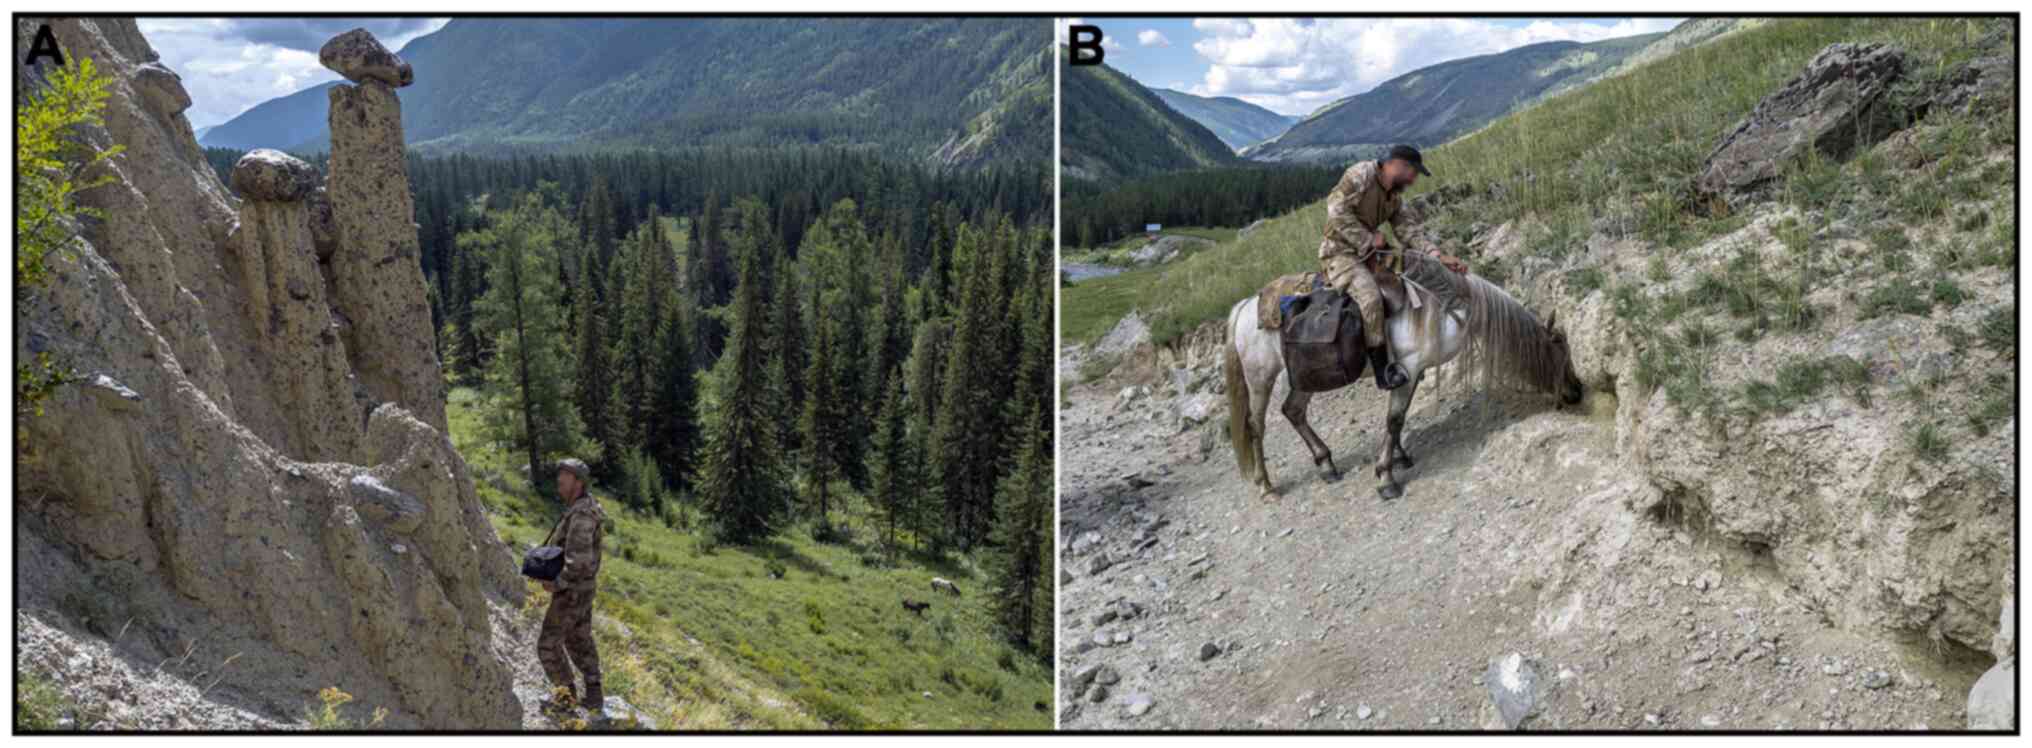
herbivores. On the sides of river valleys, kudurs are often
confined to remnants of glacial moraines with rounded boulders
(Fig. 3A), and on the sides and
the surface of river terraces, to outcrops of glaciolacustrine loam
and sandy loam.
According to the geological materials (map of the
Russian Federation at a 1:200,000 scale; sheets M-45-XI and
M-45-XVII), all studied glacial deposits with kudurs near the Yazul
settlement lie on the Proterozoic age rocks similar to the Teletsky
area (quartz-sericite-chlorite schists and gneiss), which are cut
by the Ordovician and Silurian granitoids (Fig. 1).
The kudurs near the Yazula settlement are mostly
visited by livestock (cows, sheep and horses), while the remote
kudurs are visited by red deer, Siberian roe deer, hares and moose
(Alces alces). Domestic and wild animals consume kudurits
almost all year round. The peaks of visits to kudurs are the same
as those in the lake area.
The attractiveness of the studied kudurs to domestic
animals is illustrated by the fact that all four expedition horses
(2018 expedition), once on the kudur after a seven-day walk, began
eating the soil, which they licked and chewed for about 20 min on
average, consuming ~0.5 kg of kudurit in the process (Fig. 3B).
Materials and methods
Factual material and sampling
methods
In the Teletsky area, the research was carried out
from July 24 to August 2, 2021, using motorboats and a car. In
total, 28 hydrochemical samples, 37 rock samples and 64 vegetation
samples were collected. The sampling locations are presented in
Fig. 4. In the Yazula area, the
research was carried out from August 1 to 8, 2018 using horses, and
from August 3 to 8, 2021 on foot. A total of 20 hydrochemical
samples, 50 rock samples and 28 vegetation samples were collected
(Fig. 4).
Sampling sites were added to a 1:50,000 scale
topographic base using GPS receivers. Water was sampled in 250 ml
bottles stored in a car fridge during the fieldwork. Rock material
samples (rocky and earthy varieties), up to 300 g each, were placed
in strong polyethylene bags. Kudurits were collected from
depressions eaten by animals to a depth of 10 cm. Aboveground plant
parts were sampled within a 10-m radius. In total, three plant
species were collected at all sites: One of the ferns (collected
species were: Matteuccia struthiopteris, Pteridium
aquilinum, Dryopteris filix-mas and Dryopteris
expansa); one of the sedges (Carex supina, C.
pediformis, C. caryophyllea and C. globularis),
and one of the sagebrushes (Artemisia gmelinii, A.
frigida, A. viridis, A. commutata and A.
dracunculus). Ferns were collected as they are the accumulators
of REE (19) common in Siberia and
the Russian Far East. In addition, some of these are a part of the
feed for ungulates. Sagebrushes are also occasionally used as food
plants and they are widespread in the study areas (20). Sedge was sampled as the most common
food plant for animals. Plant samples were collected into a paper
bags.
Analytical methods
Chemical analyses of water and rock samples were
performed at the Analytical Center of the Far East Geological
Institute of the Far East Branch of the Russian Academy of Sciences
(AC FEGI FEB RAS) in Vladivostok, Russia. X-ray diffraction
analysis of minerals was performed at the Department of Engineering
and Environmental Geology, Faculty of Geology, Lomonosov Moscow
State University (Moscow, Russia). Plant samples and biological
samples were analyzed in research laboratories of the Tomsk
Polytechnic University (TPU) in Tomsk, Russia.
Plant samples were further prepared for inductively
coupled plasma (ICP)-mass spectrometry (MS) analysis. They were
ground, weighed, placed in 200 mg plastic test tubes, and dissolved
in a mixture of nitric acid and hydrogen peroxide. Biological
samples were decomposed with a mixture of nitric acid
(HNO3) and hydrofluoric acid (HF) acids in HP500
autoclaves with the Mars 5 microwave decomposition system (CEM
Corporation). The maximum magnetron power was 1,200 W, the pressure
was 150 psi, and the temperature was 150˚C.
The analytical studies of the collected samples are
almost completely identical to those performed earlier. Further
details on the methodology of these studies have been previously
published (15).
The micromineral composition of kudurit samples was
determined in AC FEGI FEB RAS on the scanning electron microscopes
Lyra 3 XMH (Tescan) with analytical attachment EDS AZtec X-Max 80
and JSM-6490LV (JEOL Ltd.) with attachments EDS INCA Energy, X-max,
and WDS INCA Wave. A loose sample was glued onto carbon tape,
placed on an aluminum column and sprayed with carbon coating. To
automate the search process, INCAFeature software (version 5.03) by
Oxford Instruments was used.
The particle sizes in the kudurit samples were
determined using an Analysette 22 NanoTech plus laser particle
analyzer (Fritsch GmbH).
To determine the yield of chemical elements under
acidic conditions in the abomasums of ruminant mammals, 11 samples
were treated with hydrochloric acid extracts in the Laboratory of
Geochemistry of the PGI FEB RAS. Rock samples weighing 5.00 g were
treated with 50.00 ml of hydrogen chloride (HCl) solution (pH 1.0;
close to the rennet of large cattle). Subsequently, the suspension
was shaken for 30 min and left for a day. The supernatant was
centrifuged in plastic beakers for 30 min at 4,500 rpm (3,5 x g) at
22˚C. The transparent centrifugate was transferred to be analyzed
for the studied elements. Distilled extra-pure HCl and triple
purified distilled water were used to prepare the solution.
To reveal the ability of some minerals and mineral
mixtures to sorb REE in conditions close to the environment of the
abomasum, as well as the intestines of ruminants, laboratory
experiments were performed. To simulate the electrolyte in the
abomasum, an HCl solution with pH 2.00 was prepared in tridistilled
water, in which La, Pr and Sm compounds were diluted (one of them
appeared to have an admixture of Gd). First, La2
(CO3)3 salt (0.1648 g) and PrO2
(0.1129 g) and SmO (0.1106 g) oxides were dissolved in 3.3 ml of
10% distilled hydrochloric acid. The solution was then diluted to 1
liter and allowed to stand for 24 h; 1 ml was then taken from the
prepared solution and diluted with a HCl solution (pH 2) to 1 l.
Subsequently, 5 g each of minerals (quartz, chalcedony, albite,
calcite and smectite) and three varieties of
quartz-hydromica-chlorite kudurits grinded to 1-10 µm were placed
in flasks and 50 ml REE salt solution was added to each flask. This
was followed by 12 h in a shaker and 12 h of settling. The liquid
was separated from the minerals in a centrifuge for 30 min at 4,500
rpm (3,5 x g) at 22˚C. The analysis was performed using the ICP-MS
method.
A solution of salts in ammonium acetate buffer with
pH 8.6 on tridistilled water was prepared as a model of animal
intestinal electrolyte. At the first stage, individual solutions of
each salt were prepared: Lu2(SO4)3
x 8Н2О (0.0224 g),
Eu2(SO4)3 x 8Н2О
(0.0242 g) and Gd(CH3COO)3 x 3Н2О
(0.0248 g) were dissolved in 100 ml water; the salts
Tb2(CO3)3 x 3Н2О
(0.0173 g), Dy2(CO3)3 x
8Н2О (0.0178 g) and
Y2(CO3)3 x 3Н2О (0.0232
g) were dissolved in 3 ml of 2 M acetic acid solution, then brought
to 100 ml with water. A total of 0.1 ml was then taken from the
obtained solutions and diluted with ammonium acetate buffer
solution to 1 l. Following this, 5 g each of quartz and albite
minerals grinded to 1-10 microns were placed in flasks and 50 ml of
the prepared REE salt solution was added.
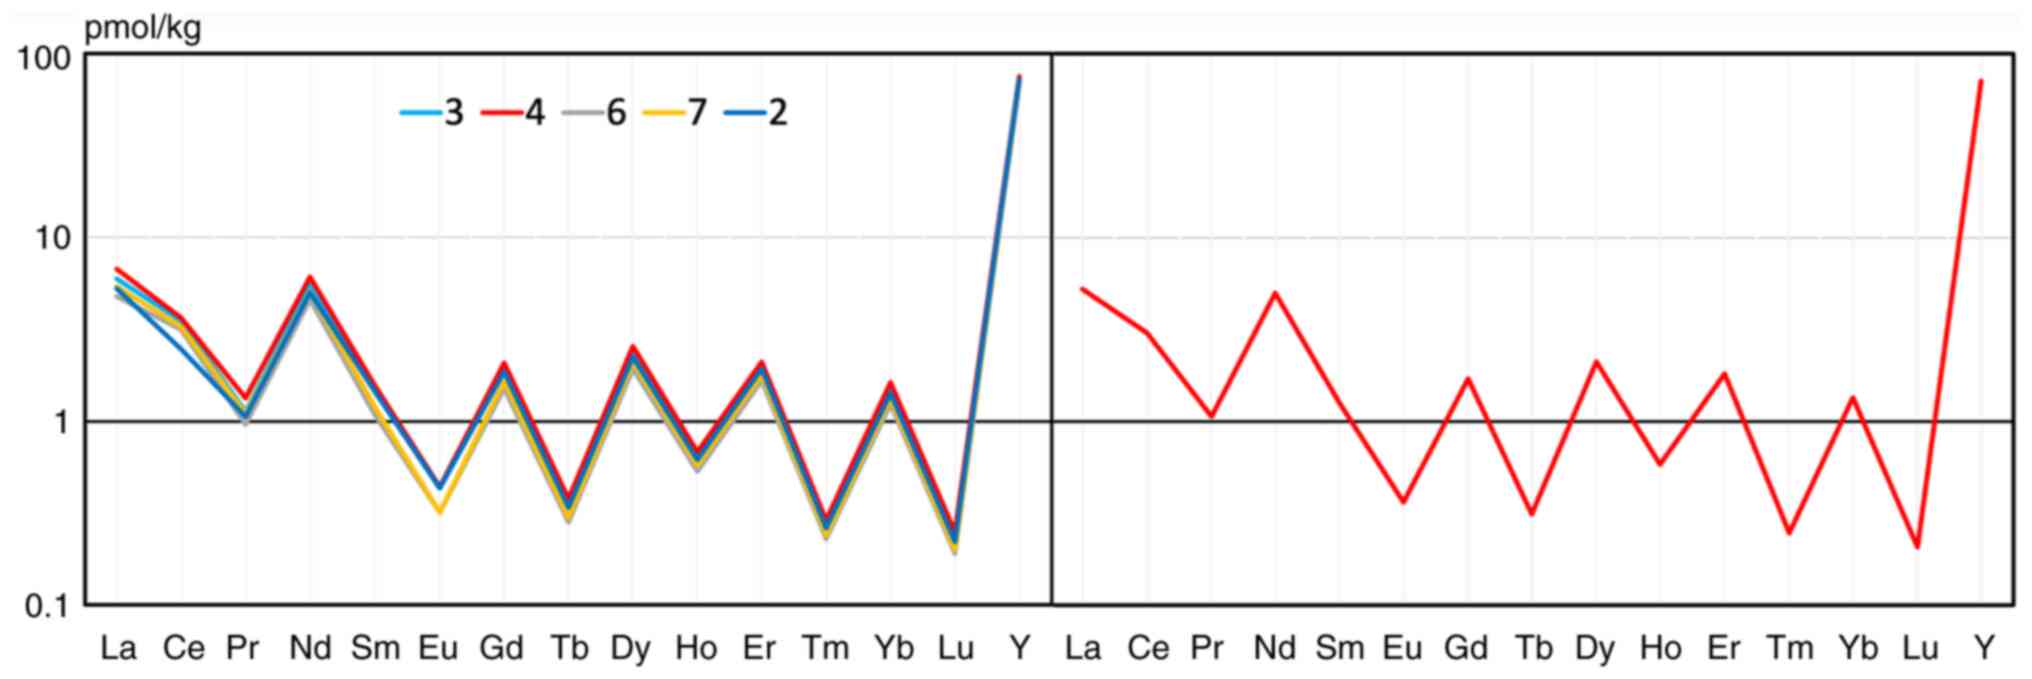
To optimize the presentation of REE concentration
profiles for water and biological samples, our standard for
seawater was introduced. The hypothesis is that the REE
concentration in seawater should be close to that in the animal
blood. In turn, the optimal concentration of REE in seawater should
be where the highest density of nekton is, as it is the marine
environment that is the source of REE for fish. For the
calculations, data from the literature (21,22)
were adopted on REE concentrations in seawater for four water areas
in the depth interval up to 30 m. The concentration profiles for
three, four, six and seven measurements at different depths from 3
to 30 m on the left, and an average profile for seven measurements
on the right are illustrated in Fig.
5. The numerical values used for the recalculation to the
seawater standard are presented in Table I.
 | Table IAveraged REE concentrations in
seawater for the recalculation to the seawater standard. |
Table I
Averaged REE concentrations in
seawater for the recalculation to the seawater standard.
| Units | La | Ce | Pr | Nd | Sm | Eu | Gd | Tb | Dy | Ho | Er | Tm | Yb | Lu | Y |
|---|
| pmol/kg | 5.26 | 3.02 | 1.06 | 4.97 | 1.26 | 0.36 | 1.70 | 0.31 | 2.12 | 0.58 | 1.82 | 0.25 | 1.35 | 0.21 | 71.21 |
| ppb | 0.73 | 0.42 | 0.15 | 0.72 | 0.19 | 0.06 | 0.27 | 0.05 | 0.34 | 0.09 | 0.30 | 0.04 | 0.23 | 0.04 | 6.33 |
The mathematical processing of data was performed
using Excel and STATISTICA software, which are parts of the
licensed software package of Tomsk Polytechnic University (software
package Microsoft Office 2016 Standard Russian Academic and
StatSoft Statistica 13 Ultimate Academic Russian Concurrent).
Statistical non-parametric analysis using the Mann-Whitney U test
was applied to evaluate the significance of differences between the
samples. Differences were considered significant at the critical
value of Mann-Whitney U test for the significance level β=5% and
confidence level P=0.95, i.e., P<0.05.
To obtain the objective and reliable information
about the concentrations of La, Ce, Nd, Sm, Eu, Tb, Yb and Lu, 91
vegetation samples were also analyzed by the instrumental
neutron-activation method. According to the statistical processing
of the results of comparison of samples analyzed by two methods,
the deviation in Ce, Nd and Lu concentrations was not >15%, and
in La, Sm, Eu, Tb, and Yb, the concentrations were not >10%. The
results were obtained using the equipment of the Center for
Collective Use of Scientific Equipment of Tambov State University
(Tambov, Russia) named after G.R. Derzhavin.
Results
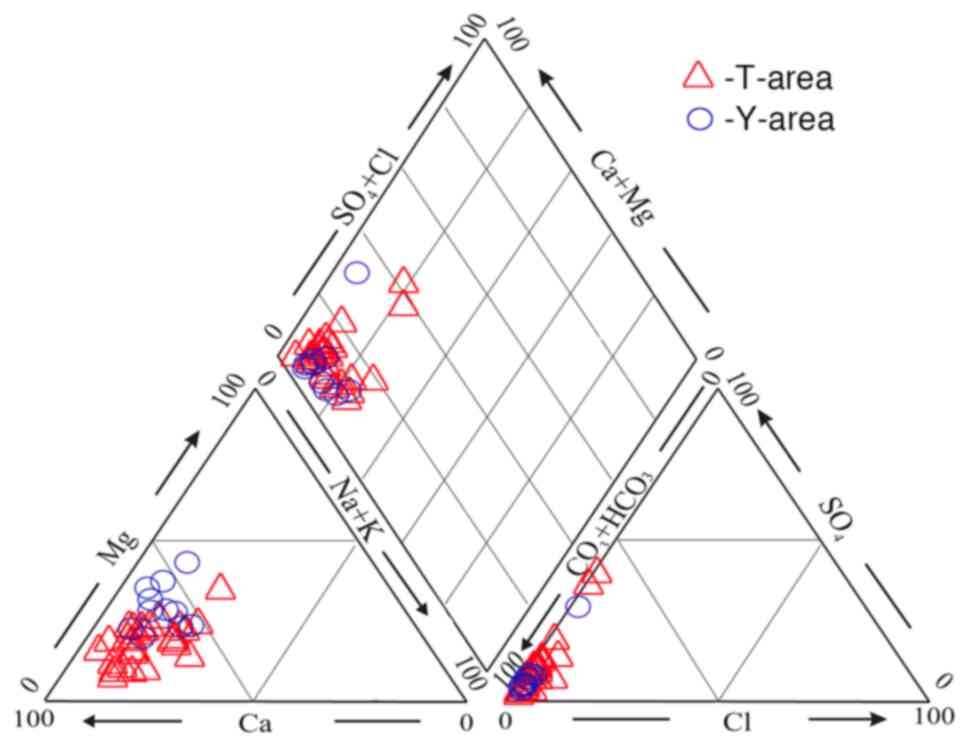
Hydrochemistry
Analytical data for the water samples indicate that
all the waters sampled in the studied areas are ultra-fresh with
salinity <0.3 g/l. The pH values of waters in the Teletsky area
range from 5.64 to 7.76 (6.67 on average; herein and below, the
authors are referring to the arithmetic mean) and in the Yazula
area, from 6.25 to 8.20 (7.50 on average). By the basic salt
composition, the majority of the waters are hydrocarbonate-calcium,
with only a few samples with a significant proportion of sulfate
ions (Fig. 6).
In the Teletsky area, the
HCO3- concentration in samples varies from
2.1 to 206.9 ppm and the average value is 68.25. The average for
SO42+ is 6.53 (1.14-30.6). The average
chloride ion content is 0.57 ppm, ranging from <0.1 to 3.86. The
average NO3 content is 2.44 ppm (0.1-13.80). The
concentrations of F and NO2 ions are <0.1 (the
detection limit). The average Ca content is 17.75 ppm (2.87-52.3).
The average Nа+ content is 2.29 ppm (0.81-8.15). The
content of Mg is 2.87 ppm on average (0.44-7.32). The content of K
varies from 0.21 to 5.44 (1.91 on average). The dissolved organic
carbon content ranges from 0.1 to 20.7, with an average of 3.72 ppm
(data not shown).
In terms of the content of most trace elements (in
ppb), the analyzed waters are distinguished by significant
variations (within one order of magnitude) of Al (from 3.74 to 581
with an average of 53.2), Sr (8.37-180/52), Mo (0.12-8.32), U
(0.07-6.50/1.17), and all elements of the REE group. In other
elements, variations are less than an order of magnitude. The
average concentrations of other trace elements are as follows: Li,
1.80; Be, 0.02; B, 16.02; P, 8.18; Sc, 0.086; Ti, 0.87; V, 0.55;
Cr, 0.75; Mn, 0.88; Fe, 50.0; Co, 0.07; Ni, 0.42; Cu, 1.98; Zn,
2.23; Ga, 0.015; Ge, 0.027; As, 0.85; Se, 0. 26; Rb, 1.22; Zr,
0.16; Nb, 0.03; Ag, 0.009; Cd, 0.005; Sn, 0.01; Sb, 0.095; Cs,
0.061; Ba, 12.8; Hf, 0.004; Ta, 0.0005; W, 0.03; Tl, 0.003; Pb,
2.76; Bi, 0.001; and Th, 0.06 (data not shown).
The total concentration of dissolved forms of REE
varied from 1.11 to 12.98 ppb (including Sc and Y). In all samples,
the predominance of the sum of light lanthanides over heavy ones
was observed with, the light rare earth elements (LREE) sums
ranging from 63 to 87%.
In the Yazula area, the average concentration of
HCO3- was 143 ppm (15.65-283), and the
concentrations of other elements were as follows: sulfate ion, 11.3
(1.31-60.7); chloride ion, 0.55 (0.1-1.40); and NO3,
1.08 mg/l (0.13-4.52). The concentrations of F and NO2
ions were also <0.1 (the detection limit). In the composition of
the main cations, Ca also was predominant, with an average of 27.3
ppm (2.77-52.3). The average content of Na was 6.03 (1.43-12.4) and
that of Mg was 12.2 ppm (1.0-27.9). The content of K varied from
0.55 to 2.13 (1.54 on average). Dissolved organic carbon content
ranged from 0.1 to 5.1, with an average of 2.85 ppm (data not
shown).
In the composition of trace elements, significant
variations (within the same order) were found for Sr (16.59 to 347
ppb with an average of 158 ppb), Mn (0.06-5.29/0.82), Th
(0.0003-0.032/0.011), U (0.05-7.25/2.04) and all REE elements. For
the other elements, the variations were not significant. Their
average concentrations are as follows: Li-3.89, Be-0.003, B-31.12,
P-8.85, Ti-0.45, V-0.95, Cr-0.81, Mn-0.82, Fe-11.53, Co-0.07,
Ni-0.48, Cu-1.11, Zn-1.47, Ga-0.01, Ge-0.010, As-0.61, Se-0. 22,
Rb-0.54, Zr-0.13, Nb-0.002, Ag-0.008, Cd-0.005, Sn-0.01, Sb-0.12,
Cs-0.09, Ba-16.83, Hf-0.003, Ta-0.0004, W-0.09, Tl-0.0012, Pb-2.42,
and Bi-0.001.
The total concentration of dissolved forms of REE
varied from 0.11 to 2.21 ppb (including Sc and Y). In all samples,
the predominance of the sum of light lanthanides over heavy ones
was observed, with the LREE sums ranging from 62 to 82%.
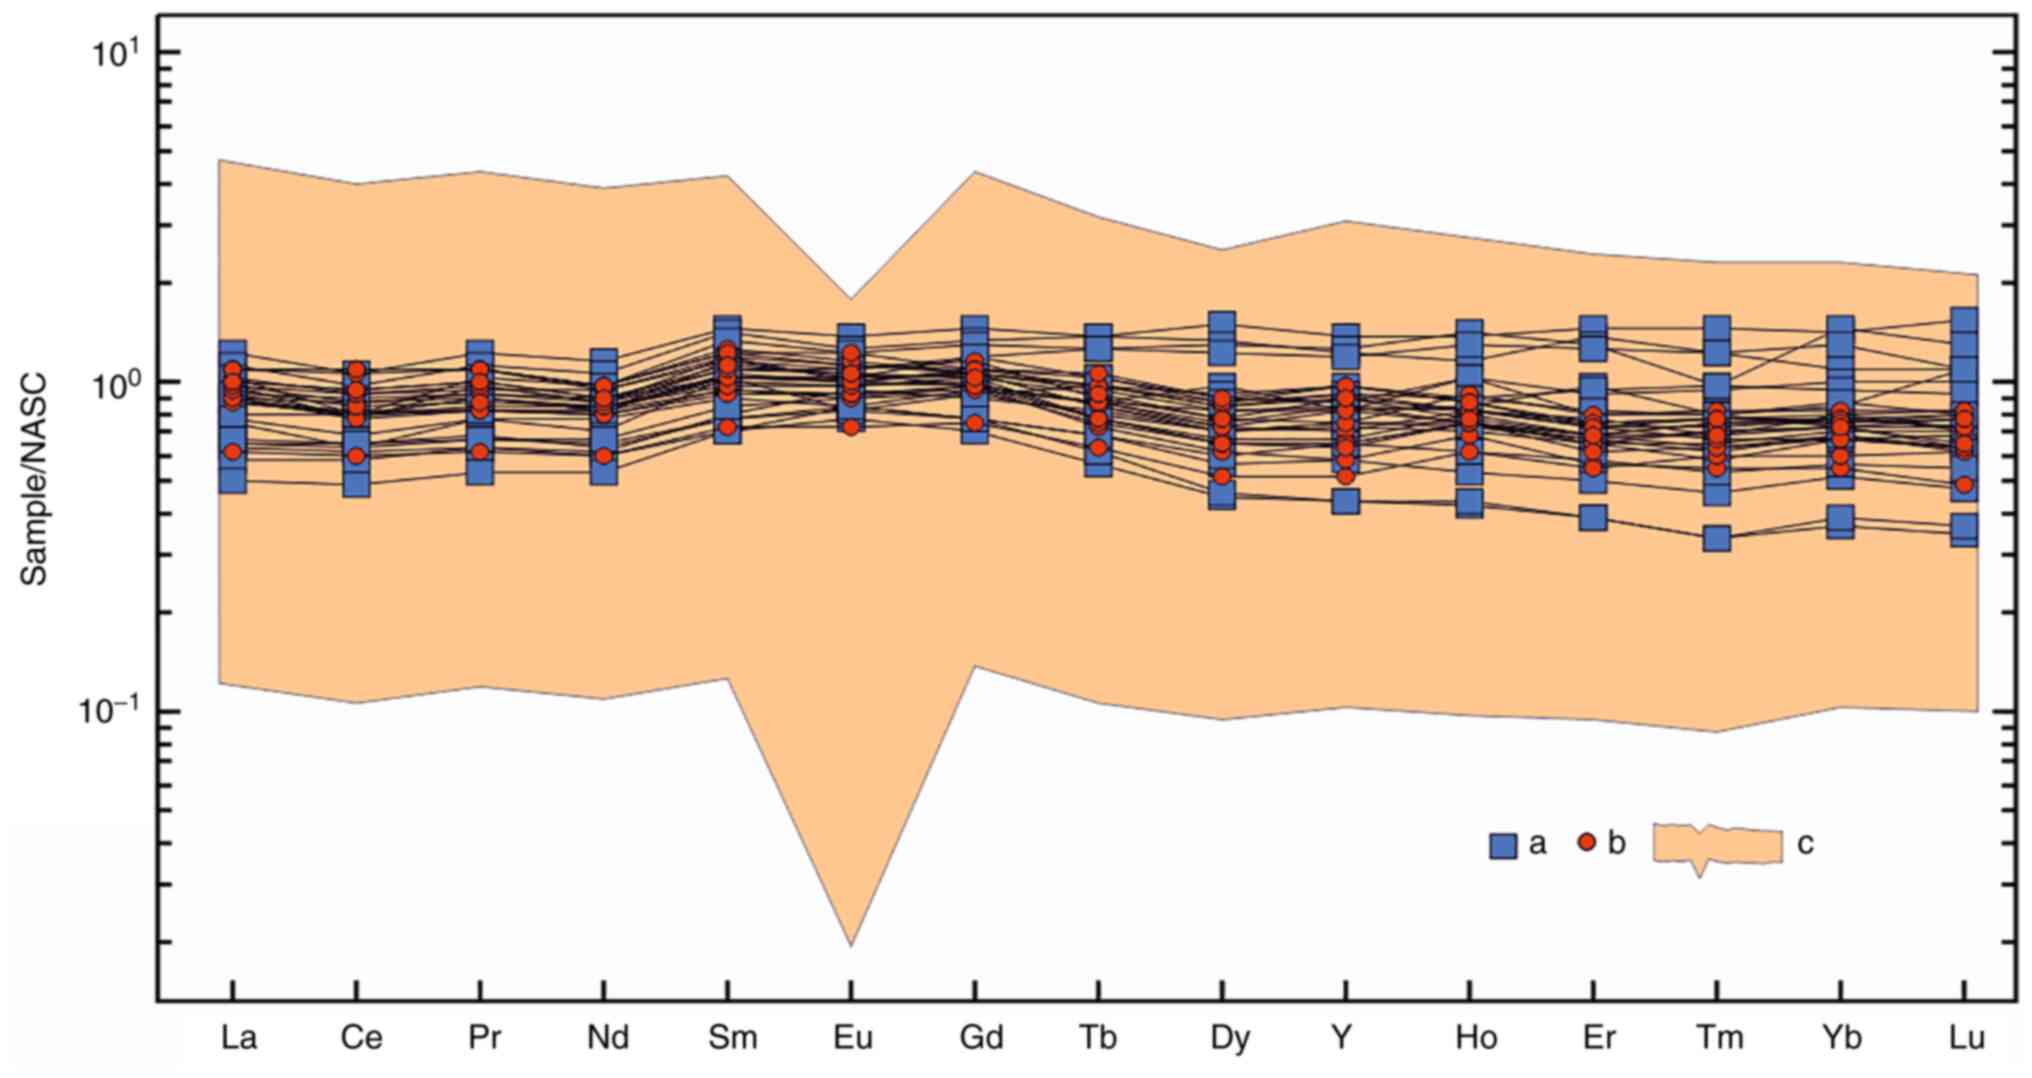
As illustrated in Fig.
7A, the North-American slate (NASC)-normalized concentrations
of REE and yttrium in six most REE-rich water samples from the
Teletsky area and one sample from the Yazula area were compared to
the average concentrations in rivers worldwide (23) and the concentration in the
Teletskoye Lake. In both areas, the REE concentrations exceeded the
world average values by up to 10-fold. All spectra exhibited a
distinctly negative cerium anomaly (Ce/Ce*=0.08-0.53) which is
typical for river waters. More detailed hydrochemical
characteristics of waters with a high REE content are summarized in
Tables II and III.
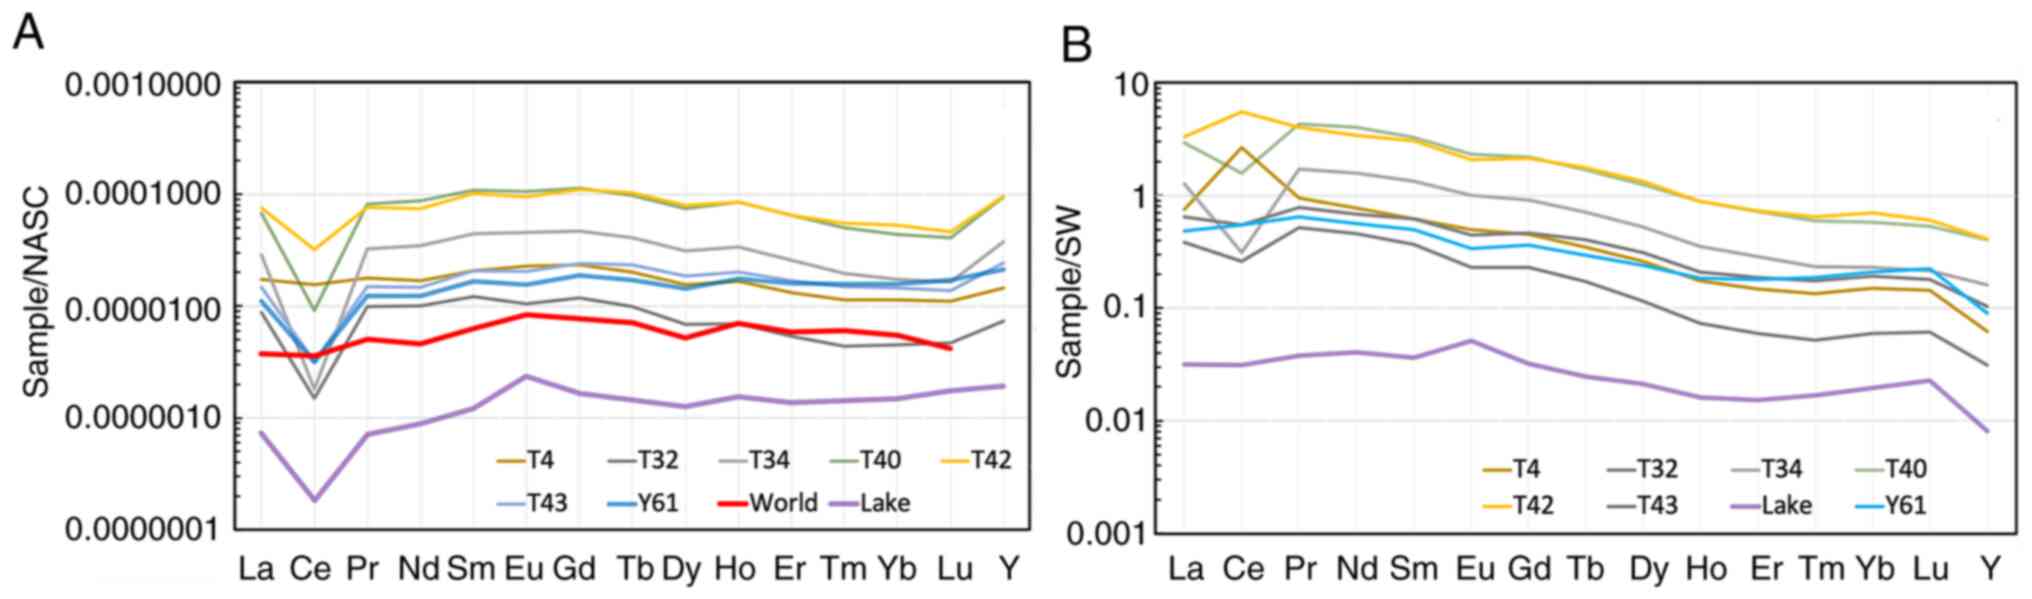 | Figure 7REE distribution profiles in water
samples with the maximum REE content in the Teletsky (n=6) and
Yazula (n=1) areas: (A) NASC-normalized (24); (B) normalized to seawater (please
see Table I for normalization
values). Of note, ‘World’ is the world average content (25), ‘Lake’ is the Teletskoye Lake (n=1).
T4, 32, 34, 40, 42, 43, 61 and Y4, 32, 34, 40, 42, 43, 61 are the
locations of surface and spring well water sampling in the Teletsky
and Yazula areas shown in Fig. 4.
REE, rare earth elements; NASC. |
| Table IIContent of main ions in water samples
with the maximum REE content collected from water sources and
surface watercourses in the Teletsky and Yazula areas. |
Table II
Content of main ions in water samples
with the maximum REE content collected from water sources and
surface watercourses in the Teletsky and Yazula areas.
| |
Concentration of ions, mg/l (ppm) |
|---|
| Area | Sample | рН |
HCO3 |
SO42- | Cl- | Br- |
NO3- | F- | Na+ | K+ |
Ca2+ |
Mg2+ |
NH4+ |
|---|
| Teletsky | T4 | 6.27 | 7.24 | 35.7 | 0.44 | <0.001 | 0.66 | 0.08 | 7.36 | 7.67 | 34.3 | 9.25 | 0.06 |
| | T32 | 6.05 | 15.6 | 1.86 | 0.12 | <0.05 | 1.52 | <0.3 | 1.07 | 0.89 | 3.94 | 0.72 | <0.1 |
| | T34 | 6.68 | 49.5 | 3.89 | 0.15 | <0.05 | 2.56 | <0.3 | 1.71 | 2.24 | 14.8 | 1.29 | <0.1 |
| | T40 | 6.79 | 39.8 | 3.16 | 0.19 | <0.05 | 0.22 | <0.3 | 3.12 | 2.07 | 6.58 | 3.54 | <0.1 |
| | T42 | 5.64 | 5.40 | 2.56 | 0.10 | <0.05 | 1.58 | <0.3 | 1.23 | 0.25 | 3.11 | 0.76 | <0.1 |
| | T43 | 5.70 | 19.5 | 1.22 | 0.10 | <0.05 | 2.07 | <0.3 | 1.29 | 0.31 | 6.07 | 0.51 | <0.1 |
| | T26-Lake | 6.66 | 57.80 | 3.89 | 0.52 | <0.05 | 0.61 | <0.3 | 1.51 | 0.61 | 13.80 | 2.81 | <0.1 |
| Yazula | Y61 | 6.25 | 31.50 | 1.68 | 0.15 | <0.05 | 0.25 | <0.3 | 2.30 | 0.88 | 6.93 | 1.74 | <0.1 |
| Table IIIConcentrations of Y and lanthanides
in water samples with the maximum REE content from the Teletsky and
Yazula areas (ppb). |
Table III
Concentrations of Y and lanthanides
in water samples with the maximum REE content from the Teletsky and
Yazula areas (ppb).
| | T-area | Y-area |
|---|
| Element | T4 | T32 | T34 | T40 | T42 | T43 | T26-Lake | Y61 |
|---|
| Y | 0.391 | 0.1991 | 1.0207 | 2.5502 | 2.6069 | 2.6069 | 0.0516 | 0.5723 |
| La | 0.5520 | 0.2797 | 0.9224 | 2.1568 | 2.4226 | 0.4714 | 0.0233 | 0.3520 |
| Ce | 1.1300 | 0.1097 | 0.1317 | 0.6676 | 2.3262 | 0.2326 | 0.0132 | 0.2309 |
| Pr | 0.1410 | 0.0778 | 0.2568 | 0.6446 | 0.6048 | 0.1172 | 0.0056 | 0.0969 |
| Nd | 0.5570 | 0.3295 | 1.1398 | 2.8689 | 2.4365 | 0.4883 | 0.0290 | 0.4061 |
| Sm | 0.1180 | 0.0693 | 0.2531 | 0.6185 | 0.5758 | 0.1177 | 0.0069 | 0.0948 |
| Eu | 0.0271 | 0.0125 | 0.0550 | 0.1276 | 0.1143 | 0.0244 | 0.0028 | 0.0186 |
| Gd | 0.1210 | 0.0617 | 0.2446 | 0.5915 | 0.5707 | 0.1242 | 0.0086 | 0.0972 |
| Tb | 0.0172 | 0.0085 | 0.0349 | 0.0831 | 0.0873 | 0.0198 | 0.0012 | 0.0145 |
| Dy | 0.0900 | 0.0395 | 0.1804 | 0.4291 | 0.4617 | 0.1069 | 0.0073 | 0.0830 |
| Ho | 0.0166 | 0.0070 | 0.0336 | 0.0850 | 0.0848 | 0.0201 | 0.0016 | 0.0176 |
| Er | 0.0449 | 0.0181 | 0.0875 | 0.2205 | 0.2214 | 0.0571 | 0.0047 | 0.0543 |
| Tm | 0.0057 | 0.0022 | 0.0098 | 0.0250 | 0.0275 | 0.0074 | 0.0007 | 0.0079 |
| Yb | 0.0352 | 0.0139 | 0.0539 | 0.1348 | 0.1639 | 0.0451 | 0.0046 | 0.0490 |
| Lu | 0.0053 | 0.0022 | 0.0079 | 0.0196 | 0.0222 | 0.0066 | 0.0008 | 0.0082 |
| ∑REE | 2.861 | 1.032 | 3.411 | 8.673 | 10.120 | 1.839 | 0.1109 | 1.5319 |
| LREE | 2.498 | 0.866 | 2.704 | 6.956 | 8.366 | 1.427 | 0.078 | 1.181 |
| HREE | 0.363 | 0.166 | 0.708 | 1.716 | 1.754 | 0.412 | 0.032 | 0.350 |
| LREE% | 87.31 | 83.95 | 79.26 | 80.21 | 82.67 | 77.62 | 70.72 | 77.12 |
| HREE% | 12.69 | 16.05 | 20.72 | 19.79 | 17.33 | 22.38 | 29.28 | 22.88 |
| Y/Ho | 23.55 | 28.44 | 30.38 | 30.00 | 30.74 | 129.70 | 32.25 | 32.52 |
| Eu/Eu* | 1.519 | 1.949 | 1.658 | 1.55 | 1.432 | 1.013 | 0.491 | 0.696 |
| Ce/Ce* | 1.027 | 0.867 | 1.003 | 0.957 | 0.904 | 0.913 | 1.629 | 0.878 |
| La/Yba | 0.882 | 0.162 | 0.059 | 0.123 | 0.419 | 0.216 | 0.252 | 0.272 |
| La/Sma | 0.833 | 0.719 | 0.649 | 0.621 | 0.749 | 0.713 | 0.602 | 0.661 |
| Sm/Yba | 1.823 | 2.712 | 2.554 | 2.495 | 1.911 | 1.419 | 0.816 | 1.052 |
|
LREE/HREEa | 0.607 | 0.651 | 0.511 | 0.523 | 0.519 | 0.411 | 0.261 | 0.375 |
As shown in Fig.
7B, the REE distribution profiles in the same samples were
normalized to seawater. Level ‘1’ on the y-axis indicates that the
values correspond to REE concentrations in seawater (in fact, to
optimal concentrations for living organisms). In almost all but
three samples, the concentrations of all elements were lower than
those in seawater. The concentrations at Y were particularly
low.
Mineralogy of kudurits
The sizes of the main mass of mineral particles in
the kudurit samples measured on a laser particle analyzer markedly
differed in the study areas (data not shown).
In the Teletsky area, the particle sizes in 11
samples of kudurits varied mainly from 0.1 to 100 µm, with their
maximum number in the interval from 20 to 50 µm, which corresponds
to the size of the silty or dusty fraction. The fraction of clay
particles (<1 µm in size) ranged from 1 to 5%. In two samples,
there were additional peaks with a quantitative maximum of ~0.2
mm.
In the Teletsky area kudurit minerals, according to
the quantitative mineralogic X-ray diffraction analysis of 15
samples, quartz and feldspar crystalloclasts were predominant (41
to 73% in total), of which quartz particles contributed from 20 to
42% and plagioclase, from 21 to 34%. In other minerals, mica and
chlorite were strongly predominant, namely 8 to 48% in total. As
impurity minerals, kaolinite, smectite, calcite, gypsum, ankerite,
zeolites, actinolite, amphiboles and rutile may be present (not
exceeding 5% in total) (Table
IV).
| Table IVResults of quantitative mineralogic
X-ray diffraction analysis of kudurit samples from the littoral
zone of the Teletskoye Lake. |
Table IV
Results of quantitative mineralogic
X-ray diffraction analysis of kudurit samples from the littoral
zone of the Teletskoye Lake.
| |
Mineral
fraction in samples, wt% |
|---|
| | Т1 | Т2 | Т3 | Т5 | Т7 | Т8 | Т9 | Т10 | Т11 | Т13 | Koo |
|---|
| Minerals | 1.1a | 18-3 | 2.1a | 19-1 | 1.1a | 42-1 | 1.1a | 1.1a | 37-1 | 37-2 | 1a | 1a | 1a | 41-1 | 44-1 |
|---|
| Quartz | 40.2 | 40.9 | 30.2 | 39.6 | 42.8 | 34.1 | 39.4 | 35.0 | 37.4 | 27.4 | 20.1 | 39.7 | 39.6 | 37.4 | 28.0 |
| Plagioclase | 21.7 | 26.8 | 29.0 | 31.1 | 26.6 | 34.7 | 32.0 | 23.3 | 25.1 | 24.4 | 15.0 | 29.8 | 28.6 | 25.4 | 24.5 |
| K-f-spar | 4.4 | - | 2.1 | - | 0.0 | - | 5.3 | | - | - | 6.4 | 0.0 | 3.0 | - | - |
| Micas | 21.3 | 6.8 | 31.1 | 6.7 | 24.9 | 6.8 | 21.4 | 22.0 | 19.1 | 23.6 | 42.3 | 17.3 | 22.7 | 23.9 | 19.8 |
| Chlorite | 9.0 | 9.1 | 4.5 | 1.7 | 3.2 | 3.7 | 1.2 | 5.3 | 7.8 | 16.9 | 5.2 | 3.8 | 2.3 | 6.7 | 23.8 |
|
Illite-smectite | 0.0 | 8.8 | 1.6 | - | 0.8 | 8.1 | 0.0 | 4.6 | - | - | 5.0 | 4.2 | 0.0 | - | - |
| Kaolinite | 1.0 | - | 0.0 | - | 0.0 | - | 1.7 | 0.6 | - | - | 1.3 | 0.4 | 1.1 | - | - |
| Calcite | 0.0 | 4.8 | 0.8 | 3.0 | 0.0 | - | 0.0 | 0.0 | 2.0 | 2.1 | 0.0 | 2.0 | 0.0 | 3.1 | 1.1 |
| Gypsum | - | - | - | - | - | 2.5 | - | - | - | - | - | - | - | - | 1.1 |
| Ankerite | - | 0,5 | - | 0.7 | - | 0.8 | - | - | 1.0 | 1.1 | - | - | - | 1.1 | 0.5 |
| Zeolites | 1.7 | - | 0.7 | - | 0.9 | 1.5 | 2.3 | 0.7 | - | - | 0.9 | 0.9 | 0.6 | 0.5 | 0.5 |
| Actinolite | 0.6 | - | 0.0 | - | 0.8 | - | 0.4 | 3.2 | - | - | 3.8 | 2.0 | 2.1 | - | - |
| Аmphiboles | - | 1.3 | | 17.2 | - | 6.9 | - | - | 6.0 | 3.5 | - | - | - | 2.1 | |
| Rutile | - | 0.8 | | - | - | - | - | - | 1.0 | 1.0 | - | - | - | - | 1.5 |
In the Yazula area, the particle sizes in 14 samples
of kudurits and three samples of uneaten analogs of kudurits also
varied mainly from 0.1 to 100 µm, but with quantitative maximums
from 5 to 20 µm, which correspond to the fine dust fraction. The
clay fraction contribution was also markedly higher, sometimes up
to 20%. Four samples had additional peaks in the sandy particle
size range, with three samples having a ‘sandy’ peak in the 100-200
µm range and one sample having a peak near 1,000 µm.
In the mineral composition of 11 samples of kudurits
and three similar rocks without traces of consumption by animals,
crystalloclasts of quartz and feldspars (28 to 66% in total) were
also predominant, of which quartz particles contributed 19 to 43%.
In other minerals, mica and chlorite were also strongly predominant
ranging from 20 to 69% in total. Moreover, chlorite was
considerably more abundant than in kudurits from the Teletsky area.
As impurity minerals, calcite, gypsum, ankerite, kaolinite,
actinolite, pyrite, amphiboles, and rutile may be present (not
exceeding 5% in total) (Table V).
As shown the data in Table V, the
mineral composition of uneaten analogs of kudurits did not differ
from the composition of kudurits.
| Table VResults of quantitative mineralogic
X-ray diffraction analysis of kudurits and uneaten analogs from the
Yazula area. |
Table V
Results of quantitative mineralogic
X-ray diffraction analysis of kudurits and uneaten analogs from the
Yazula area.
| |
Mineral
fraction in samples, wt% |
|---|
| | Shavla River basin
(Sh) |
Chulyshman
River basin (Ch) |
|---|
| Minerals | 2.2 | 3.1 | 4.0a | 4.1 | 1.1 | 1.2 | 3.1 | 3.3 | 4.0a | 6.0a | 6.1 | 54 | 63 | 71 |
|---|
| Quartz | 24 | 27.8 | 19.3 | 22 | 18.5 | 15.3 | 19.2 | 23.6 | 17.6 | 32.6 | 25.3 | 43.1 | 14.8 | 30.5 |
| Plagioclase | 20.6 | 25.3 | 19.2 | 19.2 | 20.7 | 20.6 | 21.7 | 24 | 21.3 | 25.3 | 19.9 | 23.7 | 13.6 | 26.3 |
| K-f-spar | 5.7 | 6.4 | 5 | 5.8 | 6.1 | 5.1 | 5.2 | 9 | 5.4 | 10.8 | 8.3 | - | - | - |
| Micas | 30.3 | 22.7 | 34.1 | 29.3 | 29.2 | 31.6 | 31.1 | 22.6 | 32.8 | 14.9 | 26.4 | 10.1 | 46.3 | 19.0 |
| Chlorite | 16.3 | 15.1 | 20.1 | 20 | 21.1 | 20.9 | 18.4 | 15.6 | 18.4 | 8.2 | 15.8 | 10.2 | 23.5 | 19.6 |
|
Illite-smectite | - | - | - | - | - | - | - | - | - | - | - | 9.0 | - | - |
| Kaolinite | 0.5 | 0.8 | 0.5 | 0.6 | 1.4 | 2.9 | 3.2 | 1.0 | 1.8 | 4.0 | 0.7 | - | - | - |
| Calcite | 0.4 | 0 | 0.3 | 1.5 | 1.3 | 1.3 | 0.2 | 1.9 | 0.6 | 0.8 | 0.6 | 0.9 | 0.5 | 1.9 |
| Gypsum | 1.1 | 0.8 | 0.8 | 0.8 | 0.6 | 1.1 | 0.3 | 0.9 | 0.9 | 1.0 | 1.2 | 0.7 | - | 0.6 |
| Ankerite | - | - | - | - | - | - | - | - | - | - | | 0.6 | 0.5 | 0.5 |
| Pyrite | 0.3 | 0.1 | 0.1 | 0 | 0.1 | 0.1 | 0.2 | 0.1 | 0.2 | 0.4 | 0.2 | - | - | - |
| Actinolite | 0.9 | 1.0 | 0.6 | 1.0 | 1.1 | 1.0 | 0.7 | 1.4 | 0.9 | 2.0 | 1.7 | - | - | - |
| Amphiboles | - | - | - | - | - | - | - | - | - | - | - | 1.4 | 0.5 | 1.1 |
| Rutile | - | - | - | - | - | - | - | - | - | - | - | 0.5 | 1.2 | 0.8 |
Thus, the main difference in the mineral composition
of kudurits from the studied areas is in the amount of chlorite and
the composition of impurity minerals. As for the sizes of mineral
particles, they are noticeably smaller in the Yazula area. This may
be explained by a higher contribution of aeolian particles in the
upper Chulyshman glacial deposits.
Geochemistry of kudurits, gneisses and
granitoids
If the eaten earths in both studied areas are
formally characterize by the composition of the main oxides, they
all belong to the acid and acid-medium series with low- and
normal-alkaline content of alkaline elements. The SiO2
content in 17 kudurit samples from the T-area varied from 55.2 to
70.32% with an average value of 62.76, TiO2 from 0.54 to
0.93 (0.73), Al2O3 from 11.64 to 17.42
(14.15), Fe2O3 from 3.98 to 8.68 (6.27), MnO
from 0.07 to 0.17 (0.11), MgO from 1.57 to 4.76 (3.29), CaO from
2.37 to 7.08 (4.11), Na2O from 2.34 to 3.3 (2.75),
K2O from 1.26 to 3.70 (2.87), and
P2O5 from 0.1 to 0.2 (0.15). The loss on
ignition varied from 1.21 to 5.41%, with an average value of 3.22%
(data not shown).
In the composition of 46 trace elements, the highest
values were in Ba, 332 ppm on average, ranging from 189 to 590 ppm.
The composition of the remaining elements was as follows in
descending order: Sr, 193 (153-226); V, 126 (153-226); Cr, 123
(82-188); Zr, 84 (59-178); Rb, 68 (48-104); Zn, 59 (44-92); Ni, 56
(42-80); Ce, 50 (36-65); Cu, 49 (29-105); Li, 28 (22-41); Nd, 23
(18-29); La, 23 (16-30); Y, 18 (12-25); Sc, 16.31 (11-21); Co, 16
(1-22); and Ga, 12.24 (11-18). These are followed by concentrations
<10 ppm in descending order: Pb, As, Nb, Th, Pr, Sm, Gd, Dy, Cs,
W, Er, Yb, Hf, U, Sn, Ge, Mo, Be and Eu; and <1 ppm-Sb, Ho, Tb,
Ta, Tm, Lu, Tl, Se, Bi, Cd, Ag and Te (data not shown).
The sum of REE in kudurits from the T-area
(including yttrium and scandium) ranged from 128 to 202 ppm, with
an average of 155 ppm.
The granitoids of the T-area were characterized in
five samples. They had the following composition of the main
oxides: SiO2 from 63.26 to 72.68%, with an average of
68.09, TiO2 from 0.18 to 0.98 (0.59),
Al2O3 from 14.09 to 15.63 (14.54),
Fe2O3 from 1.79 to 6.23 (4.15), MnO from 0.03
to 0.11 (0.08), MgO from 0.51 to 2.46 (1.56), CaO from 1.32 to 4.57
(2.86), Na2O from 3.07 to 4.27 (3.59), K2O
from 1.84 to 5.46 (3.45), and P2O5 from 0.15
to 0.26 (0.21). The loss on ignition ranges from 0.07 to 1.21% with
an average of 0.53%. The sum of REE (including yttrium and
scandium) ranges from 102 to 174 ppm, with an average of 135 ppm
(data not shown).
The SiO2 content in 20 kudurit samples
from the Y-area ranged from 47.56 to 66.06%, with an average of
55.83, TiO2 from 0.39 to 0.94 (0.71),
Al2O3 from 13.70 to 20.95 (17.62),
Fe2O3 from 5.79 to 10.47 (7.95), MnO from
0.10 to 0.18 (0.14), MgO from 2.81 to 5.11 (4.16), CaO from 1.01 to
6.9 (2.22), Na2O from 1.32 to 2.92 (2.25),
K2O from 2.03 to 4.06 (2.91), and
P2O5 from 0.11 to 0.25 (0.18). The loss on
ignition ranged from 2.13 to 10.32%, with an average of 5.1% (data
not shown).
In the composition of trace elements, the highest
values were: Ba, 578 ppm, on average, ranging from 356 to 857 ppm.
The following are presented in descending order: Sr, 204 (115-320);
Cr, 164 (102-299); V, 142 (99-218); Rb, 126 (75-167); Zn, 115
(77-163); Ni, 110 (78-187); Zr, 93 (42-125); Ce, 68 (43-91); Li, 54
(37-76); Cu, 49 (29-105); La, 32 (20-40); Nd, 29.49 (14-35); Co, 24
(15-30); Y, 23 (14-35); Ga, 22 (14-28); Sc, 22 (14-30); and Pb, 17
(13-23). These are followed by concentrations <10 ppm in
descending order: Th, Cs, Nb, As, Pr, Sm, Gd, Dy, Sn, U, Er, Yb,
Hf, Be, W, Ge, Eu and Sb; and <1 ppm: Ho, Tb, Ta, Tl, Mo, Tm,
Lu, Ag, Se, Cd and Te. The sum of REE in kudurits in the Y-area
(including yttrium and scandium) varied from 141 to 271 ppm, with
an average of 206 ppm (data not shown).
The granitoids of the T-area were characterized in
five samples. They had the following composition of the main
oxides: SiO2 from 61.65 to 74.53% with an average of
66.58, TiO2 from 0.30 to 1.17 (0.67),
Al2O3 from 12.70 to 17.04 (15.19),
Fe2O3 from 2.18 to 6.41 (4.56), MnO from 0.03
to 0.12 (0.08); MgO from 0.38 to 4.08 (1.61), CaO from 1.22 to 3.17
(2.48), Na2O from 3.09 to 5.36 (4.20), K2O
from 1.32 to 4.91 (3.21), P2O5 from 0.06 to
0.37 (0.21). LOI varies from 0.09 to 1.85% with an average of
0.77%. The sum of REE varies from 131 to 240 ppm with an average of
183 ppm.
Fig. 8 shows
profiles of the chondrite-normalized REE in kudurits from the
Teletsky and Yazula areas on the field of values for kudurits from
two areas in the Sikhote-Alin (15). Apparently, the kudurits from
geographically and geologically different regions are comparable in
REE concentration.
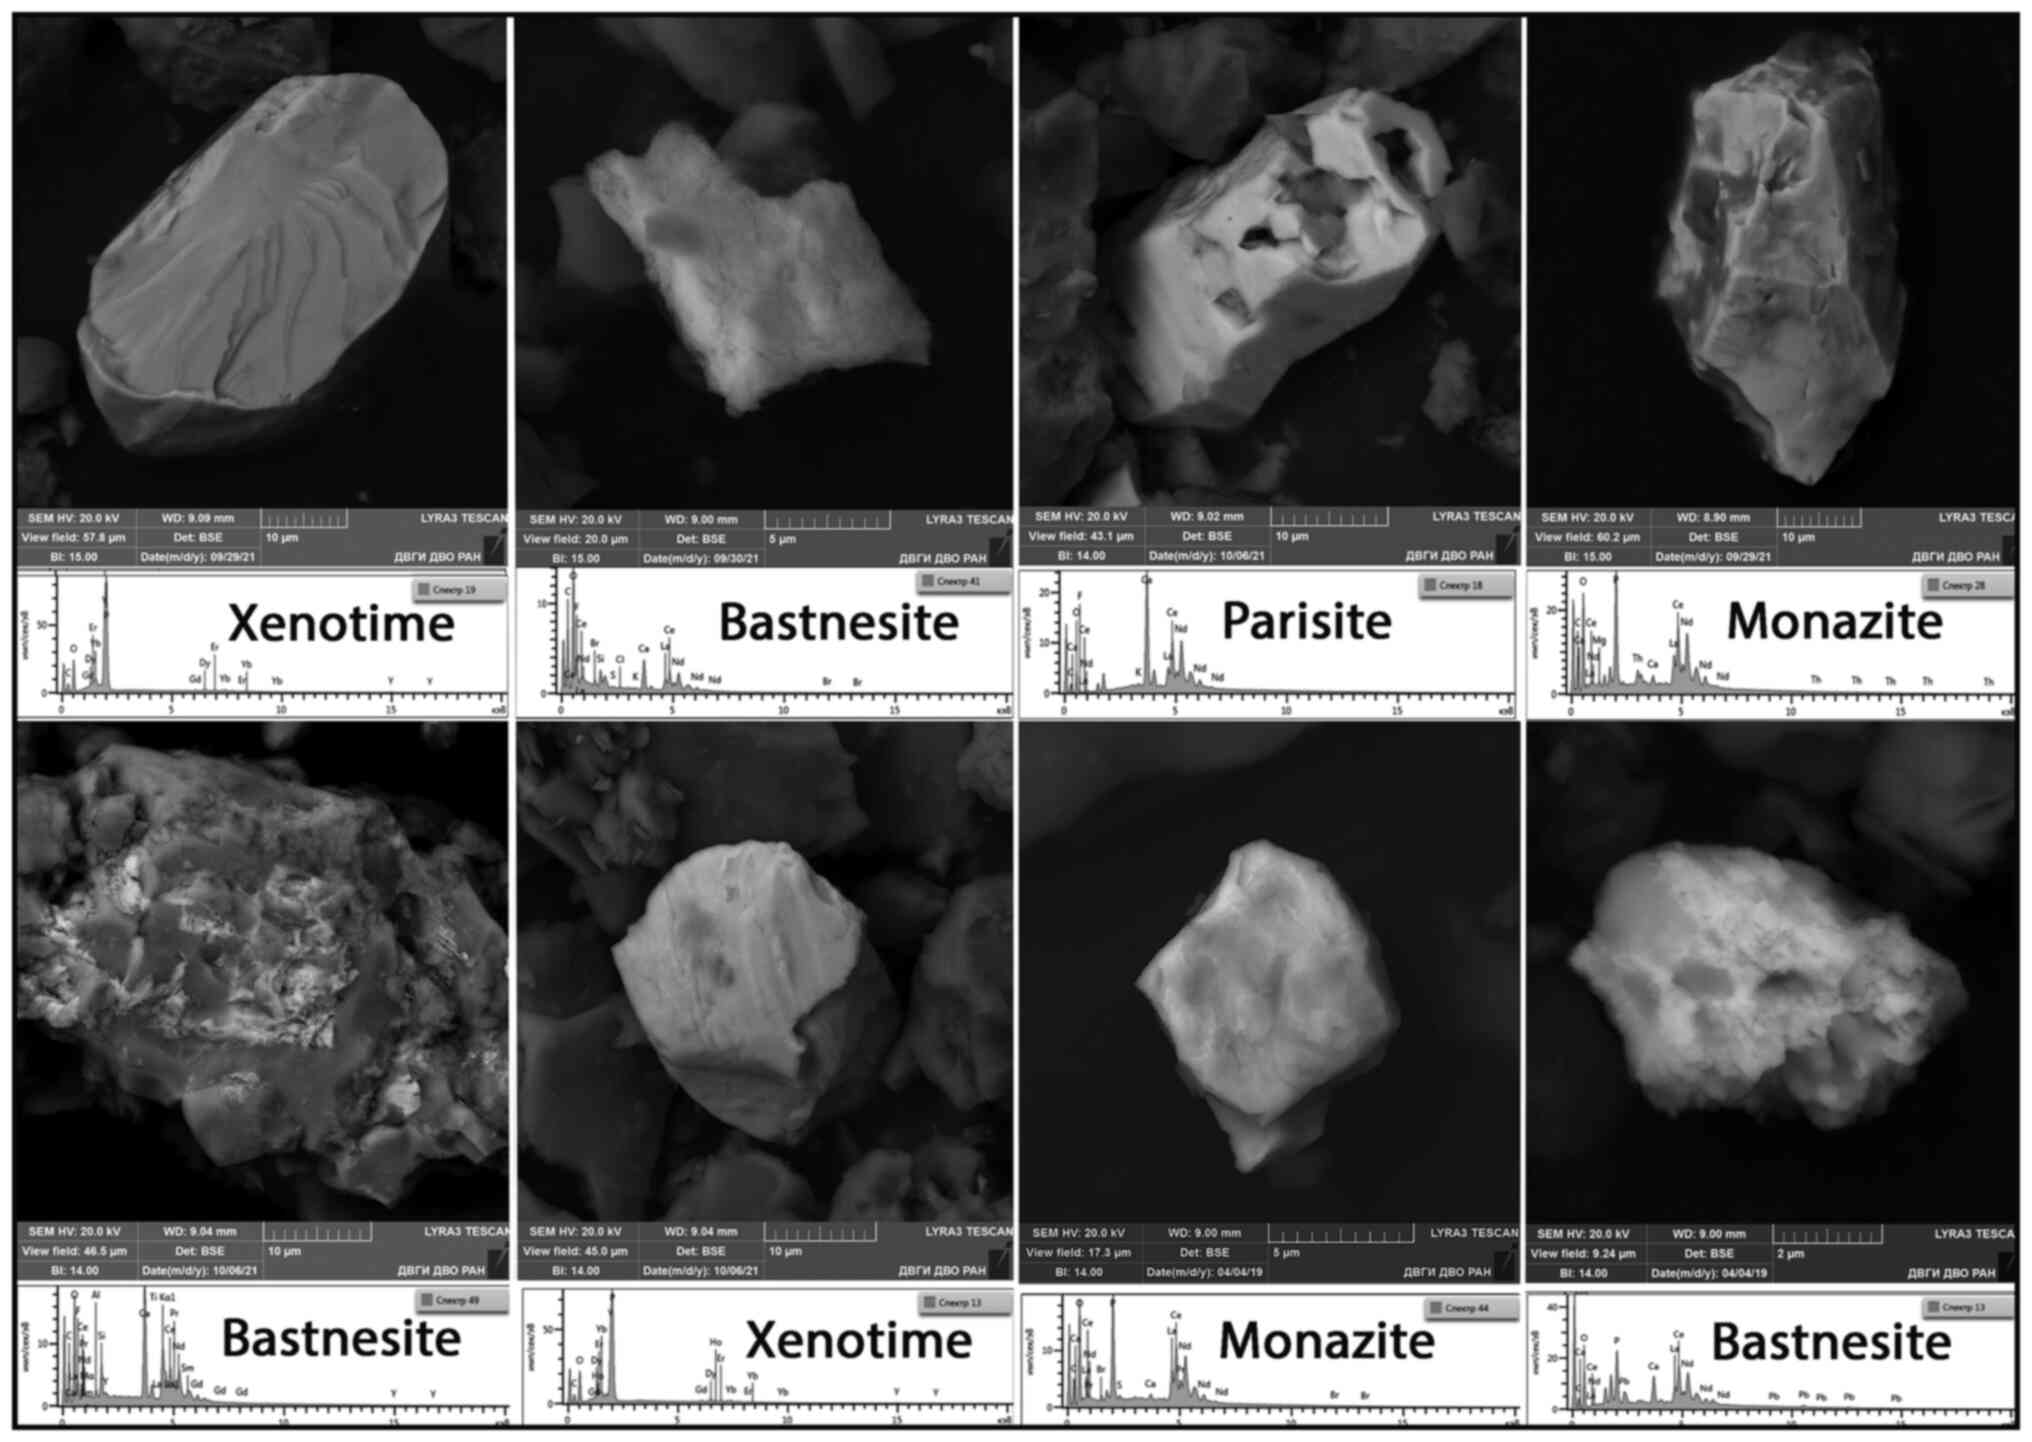
Electron microscopy
Four samples each from both areas were selected for
the automated quantitative determination of mineral aggregates of
REE in kudurits on an electron microscope. The results are
summarized in Table VI. It is
evident that at almost the same scanning surface, the abundance of
REE aggregates in kudurits in the Teletsky area is almost twice as
high as in the Yazula area. In terms of individual elements, the
maximum amount of REE aggregates in the T-area is for Ce, followed
by Nd, La, Dy, Er, Gd, Yb, Pr, Sm, Tb and Eu. In the Y-area, the
succession is somewhat different: Ce, Nd, La, Dy, Gd, Er, Pr, Yb,
Tb, Sm and Eu. All the detected fluorine-containing REE aggregates
were identified as the REE fluorocarbonates parizite and
bastnaesite. The remaining REE aggregates were phosphates
(xenotime, monazite, and rhabdophane). The most representative of
the identified REE aggregates are presented in Fig. 9.
| Table VIResults of the automated search on an
electron microscope with an analytical attachment for aggregates
containing REE in kudurit samples. |
Table VI
Results of the automated search on an
electron microscope with an analytical attachment for aggregates
containing REE in kudurit samples.
| |
No. of
phases containing an element in significant quantities |
|---|
| Sample | S,
mm2 | No. of
particles | La | Ce | Pr | Nd | Sm | Eu | Gd | Tb | Dy | Ho | Er | Tm | Yb | Lu | Y |
|---|
| The Teletsky
area | | | | | | | | | | | | | | | | | |
| T 18 | 95 | 4514 | 553 | 616 | 8 | 583 | - | 1 | 15 | - | 33 | - | 8 | - | 4 | - | 85 |
| T 37 | 108 | 5122 | 131 | 157 | - | 138 | 1 | - | 5 | 4 | 11 | - | 4 | - | 4 | - | 17 |
| T 38 | 95 | 5655 | 258 | 285 | 23 | 271 | 16 | 1 | 44 | 6 | 52 | - | 49 | - | 31 | - | 86 |
| T 44 | 109 | 7259 | 233 | 304 | 12 | 254 | 8 | 2 | 12 | - | 22 | - | 16 | - | 8 | - | 49 |
| SUM | 407 | 22,550 | 1,175 | 1,362 | 43 | 1,246 | 25 | 4 | 76 | 10 | 118 | - | 77 | - | 47 | - | 237 |
| The Yazula
area | | | | | | | | | | | | | | | | | |
| Ch 49 | 112 | 2,453 | 45 | 48 | 3 | 45 | - | - | 5 | 2 | 9 | - | 9 | - | 5 | - | 9 |
| Ch 59 | 106 | 1,832 | 154 | 168 | 6 | 161 | 2 | - | 14 | - | 27 | - | 16 | - | 9 | - | 32 |
| Ch 62 | 116 | 7,087 | 378 | 418 | 23 | 404 | 19 | 8 | 29 | 27 | 34 | - | 22 | - | 16 | - | 75 |
| Ch 71 | 78 | 2,122 | 82 | 90 | 1 | 90 | 1 | - | 3 | 3 | 7 | - | 2 | - | - | - | 17 |
| SUM | 411 | 13,494 | 659 | 724 | 33 | 700 | 22 | 8 | 51 | 32 | 77 | - | 49 | - | 30 | - | 133 |
Acid extracts
The indicators of the most notable macrocations (Na
and Ca) coming out into the hydrochloric solution from the kudurits
indicate a significant variation of the content of the Na forms
soluble in the acidic environment: from 50 to 3,472 ppm, or from
0.4 to 19.7% from the gross content (Table VII). The content of the soluble
forms of Na in the earthly substances not consumed by animals was
lower in total than in the consumed ones. However, there are the
kudurit samples, in which there is less Na available for animals
than in the unconsumed earths. In comparison with the kudurits of
the of the Teletsky area, the kudurits from the Yazula area
contained more Na and substantially less Ca (tens and hundreds of
times) available for animals. The yield of the element in the
extract from different samples also proved to be highly variable,
clearly indicating that animal interest in Fe is not related to
geophagy.
| Table VIIYield of macrocations in the acid
solution (HCl, pH 1.0) from the eaten and uneaten soils from the
Yazula and Teletsky areas. |
Table VII
Yield of macrocations in the acid
solution (HCl, pH 1.0) from the eaten and uneaten soils from the
Yazula and Teletsky areas.
| | Na | Ca | Fe |
|---|
| Area | Sample | ppm | % | ppm | % | ppm | % |
|---|
| Teletskoye Lake
shore | Т1.1 | 585 | 6.4 | 6428 | 28 | - | - |
| | Т2.1 | 1,080 | 9.8 | 14,400 | 46 | - | - |
| | Т3.1 | 495 | 5.7 | 5,207 | 19 | - | - |
| | Т7.1 | 155 | 1.3 | 2,196 | 11 | - | - |
| | Т8.1 | 780 | 5.1 | 7,892 | 33 | - | - |
| | Т9.1 | 510 | 5.6 | 5,919 | 24 | - | - |
| | Т10.1 | 145 | 1.7 | 18,876 | 37 | - | - |
| | Т11.1 | 50 | 0.4 | 1993 | 41 | - | - |
| Yazula, Chulymshan
River | Ch1.1 | 972 | 6.1 | 121 | 0.7 | 0.31 | 0.0005 |
| | Ch3.1 | 842 | 5.5 | 305 | 2.6 | 4.07 | 0.0067 |
| | Ch3.3 | 1,154 | 6.7 | 110 | 0.9 | 0.98 | 0.0018 |
| | Ch4.0a | 321 | 2.2 | 188 | 1.5 | 0.82 | 0.0013 |
| | Ch6.0a | 181 | 1.1 | 352 | 1.5 | <0.01 | <0.0001 |
| | Ch6.1 | 2,499 | 13.4 | 232 | 1.8 | <0.01 | <0.0001 |
| Yazula, Shavla
River | Sh1.1 | 130 | 1.5 | 15,600 | 32 | <0.01 | <0.0001 |
| | Sh2.1 | 3,472 | 19.7 | 188 | 1.5 | 0.17 | 0.0003 |
| | Sh3.0a | 9 | 0.1 | 105 | 1.0 | 2.23 | 0.0043 |
| | Sh4.0a | 101 | 0.7 | 291 | 2.4 | <0.01 | <0.0001 |
| | Sh4.1 | 67 | 0.5 | 147 | 0.8 | 0.85 | 0.0016 |
Among trace elements in the extracts from Teletsky
kudurits, the highest concentrations were in Ba, with a range of
values from 20 to 119 ppm, Sr (5-27), V (0. 09-7.39), Cu
(0.31-7.00), Zn (0.01-5.00), Ni (0.42-4.06), Co (0.16-3.96), Cr
(0.06-3.31), Ce (0.04-8.43), Nd (0.05-4.48), Y (0.12-5.25), Gd
(0.01-1.10) and Pb (0.004-1.66). The concentrations of other trace
elements was <1 ppm.
In the Yazula area kudurits, the situation with
trace elements in extracts differed substantially. The data
obtained after statistical processing (arithmetic mean ± error of
the mean) indicated that the highest average concentrations in the
extracts (downward) were in Sr, 24.52±3.22 ppm; and Ba, 18.64±5.76
ppm. A group of five elements had a yield of 5 to 12 ppm, including
Ce, 11.17±0.50 ppm; Y, 5.40±0.25 ppm; Cu, 8.53±1.16 ppm; Nd,
5.79±0.28 ppm; and La, 5.58±0.32 ppm. A group of 11 elements had a
yield of 1 to 4 ppm, including Pb, 4.06±0.64 ppm; Zn, 3.94±0.53
ppm; Ni, 3.16±0.34 ppm; V, 2.00±0.46 ppm; Cr, 1.76±0.30 ppm; Co,
1.63±0.0.18 ppm; Gd, 1.39±0.05 ppm; Li, 1.33±0.12 ppm; Sm,
1.32±0.05 ppm; Dy, 1.10±0.04 ppm; and U, 1.01±0.22 ppm. The yield
of other elements in the solution was <1 ppm.
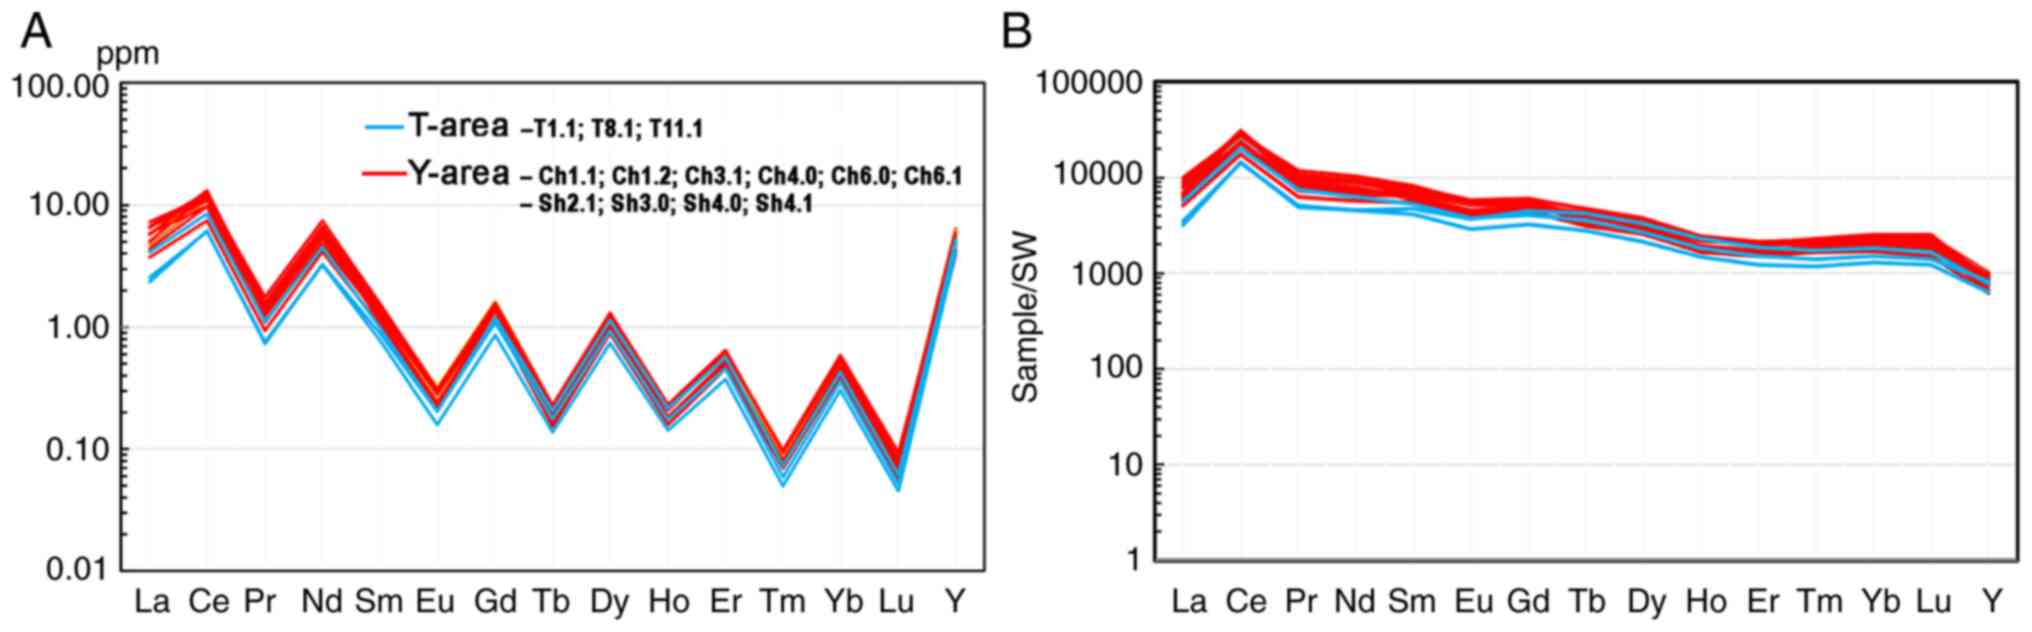
The REE distribution spectra in the acid extracts
from the Teletsky and Yazula areas kudurits (Fig. 10) indicated that the quantitative
yield of REE from the rocks of both sites was almost identical
(P=0.96). When normalized to seawater, it becomes evident that the
distribution of REE in the extracts relative to the living matter
is relatively uniform with a slight deficit in Y and La and a
slight excess in Ce, while the concentration of LREE elements is
four orders of magnitude higher and heavy rare earth elements
(HREE) is three orders of magnitude higher than in seawater.
Experiment
For the purpose of revealing the ability of some
minerals to sorb REE in conditions close to the environment of
abomasum and intestine of ruminants, a specific experiment was
conducted. The experimental method was described above. The results
are presented in Tables VIII
and IX.
| Table VIIIThe ability of grinded monominerals,
as well as the Teletsky and Yazula kudurits to sorb REE from an
acid solution (HCl, pH 2.00). |
Table VIII
The ability of grinded monominerals,
as well as the Teletsky and Yazula kudurits to sorb REE from an
acid solution (HCl, pH 2.00).
| Elements | La | Pr | Sm | Gd |
|---|
| Initial
concentration in 0.1 N HCl solution (ррb) | 14.17 | 16.33 | 13.87 | 1.40 |
| Following addition
of quartz | 15.90 | 16.82 | 15.09 | 1.78 |
| Difference from
initial concentration (%) | +1.73 (12%) | +0.49 (3%) | +1.22 (9%) | +0.38 (27%) |
| Following addition
of аlbite | 24.22 | 17.35 | 15.82 | 4.23 |
| Difference from
initial concentration (%) | +10.05 (71%) | +1.02 (6%) | +1.95 (14%) | +2.83 (202%) |
| Following addition
of сhalcedony | 1.86 | 1.06 | 0.75 | 0.14 |
| Difference from
initial concentration (%) | -12.31 (87%) | -15.27 (94%) | -12.92 (93%) | -1.26 (90%) |
| Following addition
of сalcite | 0.12 | 0.12 | 0.11 | 0.02 |
| Difference from
initial concentration (%) | -14.05 (99%) | -16.21 (99%) | -13.76 (99%) | -1.38 (99%) |
| Following addition
of smectite | 0.86 | 0.57 | 0.54 | 0.11 |
| Difference from
initial concentration (%) | -13.37 (94%) | -15.76 (97%) | -13.33 (96%) | -1.29 (92%) |
| Following addition
of No. T10.1 | 1.66 | 1.34 | 1.47 | 0.55 |
| Difference from
initial concentration (%) | -12.51 (88%) | -14.99 (92%) | -12.40 (89%) | -0.85 (61%) |
| Following addition
of No. Ch4.0 | 1.23 | 0.56 | 0.51 | 0.23 |
| Difference from
initial concentration (%) | -12.94 (91%) | -15.77 (97%) | -13.36 (96%) | -1.17 (84%) |
| Following addition
of No. Ch1.2 | 0.73 | 0.53 | 0.47 | 0.1 |
| Difference from
initial concentration (%) | -13.44 (95%) | -15.79 (97%) | -13.40 (97%) | -1.30 (93%) |
| Table IXThe ability of grinded monominerals
(quartz and albite) to sorb HREE from an alkaline solution (pH
8.60). |
Table IX
The ability of grinded monominerals
(quartz and albite) to sorb HREE from an alkaline solution (pH
8.60).
| Elements | Eu | Gd | Tb | Dy | Lu |
|---|
| Initial
concentration in pH 8.60 solution (ррb) | 2.49 | 1.94 | 2.56 | 2.59 | 1.49 |
| Following addition
of quartz | 0.30 | 0.22 | 0.30 | 0.29 | 0.22 |
| Difference from
initial concentration (%) | 2.19 (88%) | -1.72 (89%) | -2.26 (88%) | -2.30 (89%) | -1.27 (85%) |
| Following addition
of аlbite | 0.37 | 0.27 | 0.34 | 0.35 | 0.26 |
| Difference from
initial concentration (%) | 2.12 (85%) | -1.67 (86%) | -2.22 (87%) | -2.24 (86%) | -1.23 (83%) |
The experiment revealed that pure mineral powders of
quartz and plagioclase (albite) were unable to sorb REE from acid
solution (Table IX). Moreover,
when they were treated with an acidic solution, the additional
leaching of REE occurred, resulting in an increase in their
concentration in the solution. In alkaline solution (pH>8.60),
quartz and albite sorb REE well due to the formation of silica
gels, capturing >80% of dissolved elements from the solution
(Table IX).
It was found that chalcedony, calcite and smectite
powders, as well as quartz-plagioclase-illite-chlorite kudurits
during interaction with acidic REE solution sorb REE with
efficiency from 60 to 99% (~92% on average). Calcite powder turned
out to be the most effective sorbent with a sorption efficiency of
about 99% for all elements. This result effectively demonstrated
that quartz-plagioclase-illite-chlorite kudurits are actively
sorbing REE from the biological liquid in any pH range in the
conditions of the digestive tract.
Assessment of the real ability of
kudurits to sorb REE in the digestive tract of animals
The actual assessment of the ability of kudurits to
sorb REE in the digestive tract of animals is possible by comparing
REE concentrations in coprolites and corresponding kudurits. The
NASC-normalized profiles (24) of
REE concentrations in coprolites (C-1 and C-2) and chemically
corresponding kudurits near which the coprolites were found are
shown in Fig. 11. It can be seen
that kudurits of quartz-feldspar-illite-chlorite composition most
actively sorb the light REE subgroup in the digestive tract, and
the nature of the curves in the kudurit-coprolite analogs remote
from each other has quite an obvious similarity.
Biogeochemistry
A high REE background within the investigated areas
is most pronounced in vegetation, particularly in ferns. For
example, the sums of lanthanides with scandium and yttrium in 15
fern samples collected in the Teletsky area varied from 0.294 to
139.5 ppm per dry matter (mean, 22.95; median, 7.85). No ferns are
growing in the Yazula area.
In 14 sagebrush samples from the T-area, the REE
sums ranged from 0.051 to 7.183 ppm (mean, 0.991; median, 0.12),
and in 15 samples from the Y-area they ranged from 0.139 to 4.56
(arithmetic mean, 1.28; median, 0.74). In 34 sedge samples from the
T-area, the REE amounts varied from 0.051 to 2.32 ppm (mean, 0.459;
median, 0.21), and in 13 sedge samples from the Y-area, they varied
from 0.055 to 2.61 (mean, 0.96; median, 0.79). The values of REE
concentrations in plants were almost similar to those we found when
studying areas with active geophagy in the Sikhote-Alin (15).
The maximum concentrations of REE in plants were
found on granites and gneisses enriched in these elements. Minimum
concentrations are common in loose deposits remote from their
primary sources, gneisses and granitoids. In glacial deposits
located in relative proximity to granitoids, the REE concentration
is usually at a medium level. This pattern is evident in Fig. 12, where the diagram on the left
panel demonstrates the profiles of the maximum, minimum, mean and
median REE concentrations normalized to seawater in ferns from the
T-area, and the diagram on the right panel demonstrates the same in
sedges from the T-area and Y-area.
In the REE profiles for all grasses in both studied
areas, there was an increase in the concentration of Eu, as well as
a chaotic distribution of elements of the HREE subgroup from medium
to low concentrations, which is particularly common in glacial
deposits. (This effect may be due to the inaccuracy of
determinations at low concentrations). As an example, Fig. 13 shows diagrams of
seawater-normalized REE concentrations in sedges collected along a
500-m-long profile near kudur no. 8 (Fig. 4, T-area).
The analysis of REE content in the tail
(supracaudal) gland of red deer (Cervus elaphus sibiricus)
killed by wolves near the Bele cordon on Teletskoye Lake in
December, 2022 demonstrated almost complete similarity of
concentration profiles in iron and in sedges growing on dealluvium
granites (Fig. 14). Comparing it
to the REE concentration profile in iron normalized to seawater
(Fig. 14B), the unusually high
cerium content in it becomes evident.
Discussion
As a result of the present study, first of all, it
was found that surface and ground waters in areas where geophagy
among wild and domestic animals is common, contain markedly less
dissolved forms of REE compared to waters in similar areas of the
Sikhote-Alin. However, their increased concentrations (≥10-fold)
were found in some streams and springs with the lowest pH values.
Typically, such waters are confined to REE-enriched metamorphic and
magmatic rocks and the associated glacial deposits. Significantly
lower concentrations of REE in the waters of the Altai Mountains
compared to the Sikhote-Alin are caused by higher pH values in the
Altai waters, which is associated with the abundance of calcium and
magnesium carbonates in the rocks. The climate in the Altai
Mountains is also somewhat relevant, as it is drier and colder
there.
Secondly, it was found that the vast majority of
kudurs in the Chulyshman river valley and the littoral zone of the
Teletskoye Lake are formed on fine-grained glacial deposits in
relative proximity to outcrops of granite-gneisses and REE-enriched
granitoids. Deluvium on such parent rocks, as well as glacial
deposits, too are enriched in REE minerals, both phosphates and
carbonates of magmatic genesis (monazite, xenotime, orthite,
parisite, etc.), and secondary phosphates and fluorocarbonates
(parisite and rhabdophane).
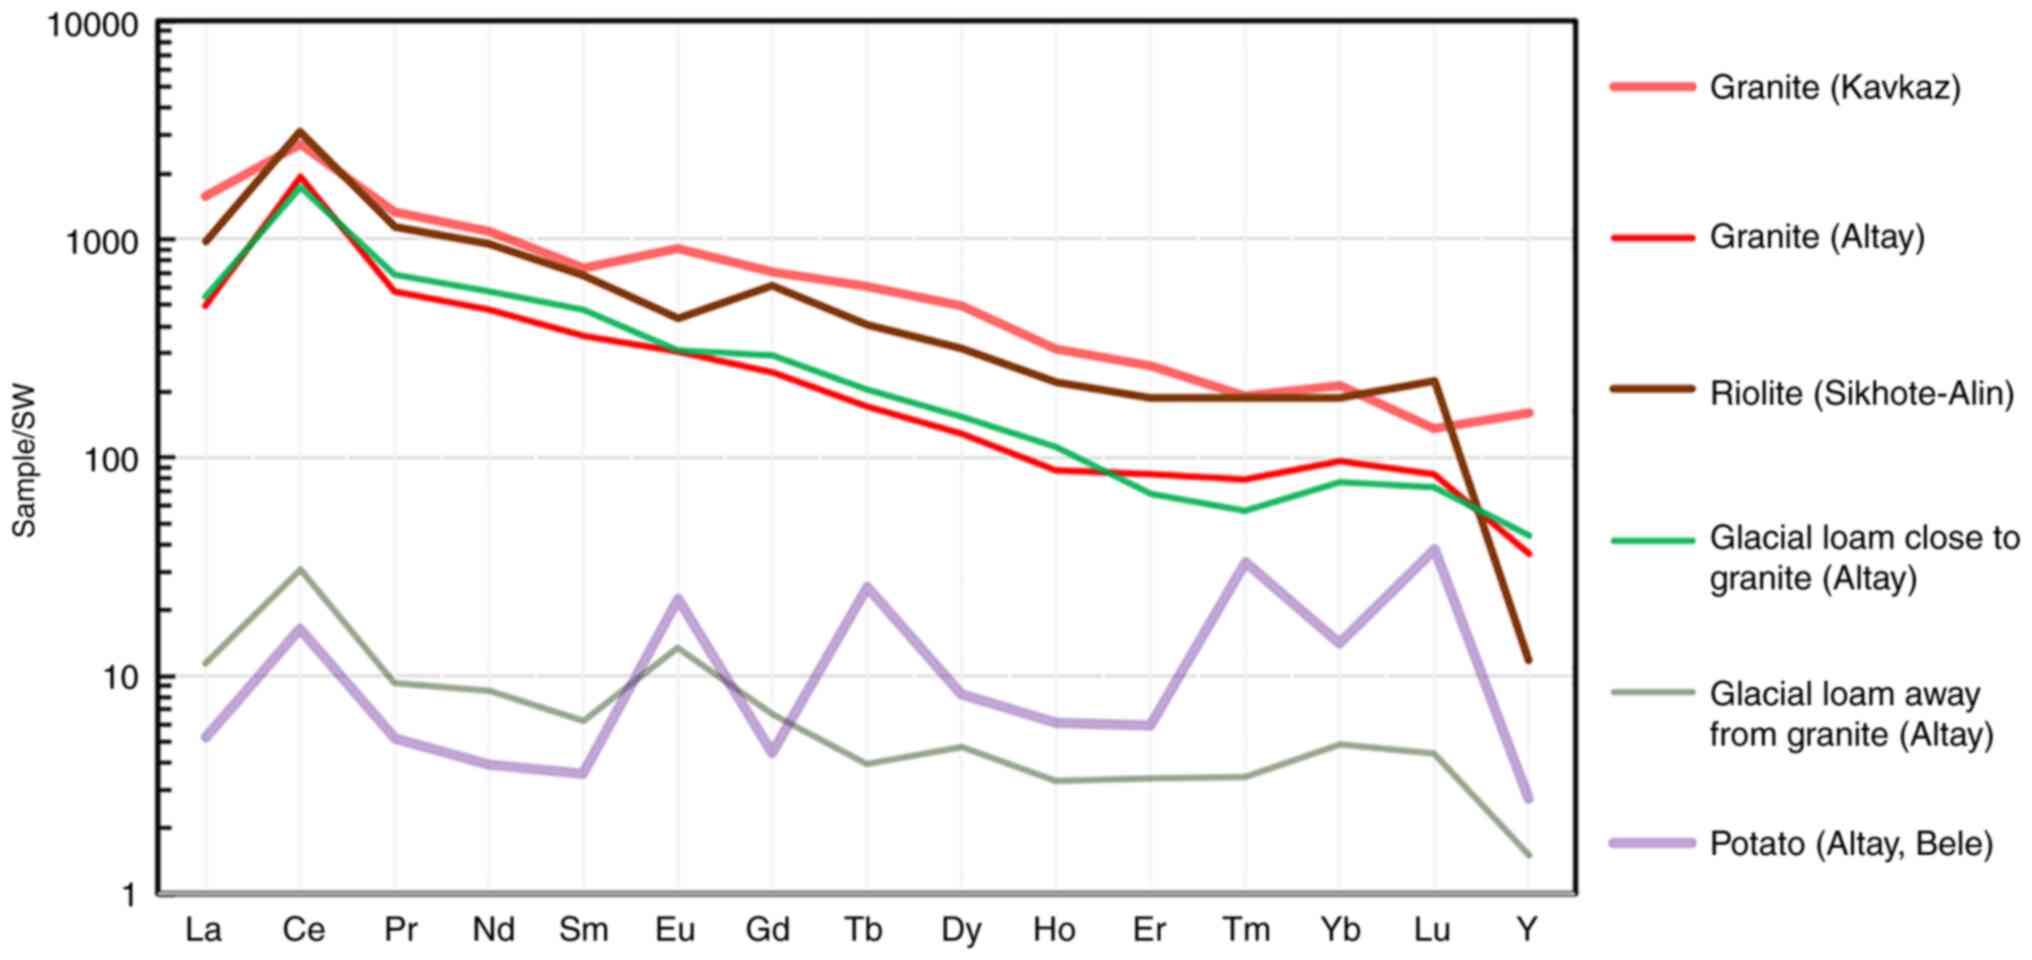
Thirdly, the vegetation on such glacial deposits,
particularly directly on REE-enriched weathering crust gneisses and
granitoids, also accumulates significant concentrations of these
elements. Not only ferns, the natural REE concentrators (19), but also sedges and artemisia, which
are food plants for ungulates, accumulate these elements. Fig. 15 shows the profiles of maximum and
minimum REE concentrations in the sedges from the three regions
studied by the authors thus far. These data well illustrate the
fact that sedges on REE-enriched rocks are capable of accumulating
these elements up to ≥100-fold than those on ordinary widespread
rocks with an average REE content. Notably, the REE concentration
profile of a potato tuber sample from a vegetable garden in the
Bele settlement on the Teletskoye Lake shore differs from the
profiles of grasses demonstrating a relatively sharp enrichment in
the HREE group of elements. This fact can be directly related to
the health of people in the area. Further on, we will discuss this
issue in more detail.
According to the observations of ungulates in the
southern part of the lake, which have been conducted for several
years by the nature reserve employee Dr Yu. N. Kalinkin, the main
habitats of these animals are the slopes and the near-to-summit
parts of the mountain ridge on the right bank, where REE-enriched
plants are most widespread. In spring and summer, animals
periodically go down to the kudurs where they consume mineral
sorbents, which, as we found out, can remove excessive REE from the
body.
However, the question of how far animals can travel
to kudurs in the Altai Mountains has not been specifically studied
(25,26). The only reliable data on animal
travel to kudurs are for ibex and bighorn sheep on the American
continent. For example, Rice (27), using the radio tracking method,
found that animals living in a relative vicinity of kudurs (4-5 km)
visit them most often. Occasionally, animals come from afar (up to
29 km) and may stay near kudurs sometimes for up to a month or
more. According to the study by Sobansky (18), red deer come to the kudurs on the
Teletskoye Lake shore even from the Abakan Ridge spurs covering
distances up to 15 km. These data suggest that the kudurs in the
Altai Mountains may be visited by animals not only from nearby
territories but also from relatively distant ones.
The mineral composition of the Altai kudurits is
fundamentally different from the kudurits in the Sikhote-Alin. The
main mineral sorbents in the Altai Mountains are
quartz-plagioclase-illite-chlorite mineral mixtures with minor
additions of calcium carbonates and clay minerals (mainly
kaolinite). A similar mineral composition of kudurits was
discovered by the authors as early as 1988 in another geophagy area
in the Chulyshman River basin, along the Bashkaus tributary
(28). The geological structure of
the kudur areas along the Bashkaus River demonstrates a perfect
analogy with the geological structure of the area near the Yazula
settlement. The Altai type sorbents, in contrast to the
smectite-zeolite ones in the Sikhote-Alin, have a much lower
absorption capacity for such macrocations as Na and Ca (3), at the same time being able to absorb
REE from the biological electrolyte in the pH range from 4.0 to 8.6
no less effectively.
Special attention should be paid to some varieties
with an admixture of calcium carbonates among the Altai kudurits.
The matter is that in the tropics, the main sorbents in the mineral
composition of kudurits most often are clay minerals of either
kaolinite or smectite groups. Varieties with an admixture of
calcium carbonates are also present there (8,29).
The mineral composition of ‘edible earths’ consumed by humans
contains the same mineral assemblage and, again, varieties with
calcium and magnesium carbonates (8,30,31).
The literature describes even predominantly carbonate varieties of
soil eaten by humans, such as ‘hydromagnocalcite’ by Gebel
(32), consisting of redeposited
earthy magnesium and calcium carbonates with an admixture of
sulfates, which was bought at one of the markets in Central Asia.
The present study demonstrated the unusually high sorption capacity
of calcium carbonates in relation to REE (particularly HREE), and
the interest of animals and humans in the consumption of this
mineral becomes more understandable. It is possible that the
dietary interest of pregnant women in scribe chalk is related not
only, and maybe not so much to the lack of Ca in the body, but
rather to the instinctive impulse to regulate the REE imbalance in
the body as REE is the most important components in the hormonal
system, which determines the activation of mineralization and
demineralization of the skeleton. This ability of lanthanides is
pointed out, in particular, in the review by Redling (33), who refers to the works of several
researchers.
As regards sodium, in the present study, it was
once again verified that the only biologically available
macronutrient found in kudurits in increased concentrations is Na.
However, the obtained data also indicate that the desire to find
this element cannot explain the cause of geophagy. To demonstrated
the validity of this statement, some calculations are made. To
extract 20 g of pure Na (the weight of the element in 50 g or a
tablespoon of NaCl) from the most Na-enriched kudurit in Table VII (3.5 g/kg Na, sample No.
Sh2.1) one needs to consume at least 6 kg of soil. This is assuming
that the concentration of the sought element is uniform in all the
volume of the eaten soil. If one should consume the kudurit with
the minimum Na content (0.05 g/kg, sample No. T11.1), then the
weight of soil for getting the same dose of Na increases to 400 kg.
From this reasoning it becomes clear that animals consume kudurits
not for the sake of Na, at least, not only and not so much for the
sake of getting exactly this element. It is appropriate to note the
long-proven fact: Even the most severe Na deficiency in the diet is
not fatal for animals (34).
The variations of Na (as well as Ca) concentrations
in kudurits (Table VII) are most
likely related to the fact that sodium and calcium salts are
concentrated on outcrops close to the day surface due to capillary
rise of saline groundwater in hot summer conditions. Here animals
find them using their taste buds and eat them instead of similar,
but less Na-enriched earths. The typical compaction of initially
loose kudurits in the studied areas is caused precisely by their
saturation with sulfates and calcium carbonates brought in as part
of groundwater and pore water.
Thus, it was confirmed that the search for Na
cannot explain the animals' desire for geophagy, as kudurits
contain too few biologically available forms of this element. It is
worth noting that animals can address the Na deficiency issue also
by greatly reducing the losses of the deficient element in the
body. Na loss can occur, for example, in diarrheal diseases,
particularly during seasonal changes in the diet (2,4).
Mineral sorbents including those based on clays and silica gels are
known to be effective in medicine and veterinary for stopping
diarrhea.
The desire to stop diarrhea, undoubtedly, may be a
reason for consuming kudurits. However, one cannot recognize it as
the main reason that can unite the majority of geophagy cases
worldwide. The findings obtained do not point to the only possible
connection between the desire of ungulates for geophagy and
diarrhea, although individual facts of such a connection in the
spring period have long been noted by a number of researchers,
including those in the Altai Mountains, for example by Shaposhnikov
(35). The observations of humans
and great apes are particularly illustrative in this respect. The
mineral soils consumed by these groups of geophages contain
practically no available Na and are most often used without obvious
signs of digestive disorders (36-38).
Concluding the discussion of sodium in connection
with geophagy, an interesting fact can be noted indicating the
existing connection between Na, Ca and REE in the body. Powis et
al (39), in experiments on
cell cultures, found that La3+ can independently
transport itself into chromaffin cells of bovine adrenal glands by
exchange through sodium-calcium channels and trigger the release of
the catecholamine hormones. It is worth noting here that REE
involvement in the regulation of catecholamines is not their most
critical role in hormone function. There are data on their
participation in the regulation of several hormones and enzymes,
including growth hormones (pituitary gland), thyroid hormones, sex
hormones, insulin, etc., which can be found in many references to
studies in the review by Redling (33).
As regards the trace elements, in the present
study, Sr, Ba, Y and LREE demonstrated the highest concentrations
among the trace elements in acid extracts. Assuming that the first
two elements can hardly be attributed to those that animals seek at
kudurs, it is Y and LREE that are the most likely trace elements to
be looked for, judging by the amount and stability of yield into
the acid solution. It is considered that the other trace elements
as less likely candidates, since all of them both in this and in
similar studies on other types of kudurits and other regions
worldwide (16), show highly
unstable results. However, the appearance of any trace elements
(other than REE) in the digestive tract can undoubtedly influence
the symbiont microflora. Some of these elements can even be
absorbed in the body, but it is also hardly appropriate to consider
them as candidates for the main cause of geophagy (the one that
unites this phenomenon throughout the world).
Having found relatively high concentrations of
easily soluble forms of LREE in kudurits of the Sikhote-Alin, Altai
Mountains and Caucasus (16,26,40)
and the fact of unusually high gross concentrations of REE in
African and Indonesian kudurits described in the publications of
several authors (35,37,41-43),
it was first suggested that animals consume kudurits to compensate
the lack of some elements from the LREE group in the body. The
aforementioned series of articles was devoted to proving this
hypothesis. However, following a thorough investigation in two
areas of the Sikhote-Alin in 2021(15), it became evident that the cause of
geophagy may be connected not only with REE deficiency in food and
drinking water, but also with their excess. The excessive content
in the plant food negatively influencing animal health appears to
be more frequent. The evidence that the positive effects of REE on
the animal body, be it the stimulation of growth, an increase of
immunity, influence on cell proliferation and others, can
dissipate, and turn into opposite effects as the REE concentration
increases, is supported by ample data, which can be found in the
most complete form in the review by Redling (33).
The cases of LREE deficiency are probably most
common in humid tropical forests where elements are actively
transported from soils by acidic solutions, and also in areas where
biogenic carbonate rocks are widespread as biogenic carbonate
accumulates negligible amounts of REE (44). Animals may also need LREE if there
is a sharp imbalance in feed and drinking water in favor of HREE at
the expense of the lighter counterparts, or if there is a toxic
element present in large amounts that blocks the ingestion of
LREE.
There is evidence of high concentrations of mobile
forms of REE in kudurits, which were found both in the Sikhote-Alin
and the Altai Mountains. These findings are not quite consistent
with the explanation of the cause of geophagy by an excess of REE
in food plants and the desire to consume minerals capable of
sorbing these elements. There could be two possible explanations.
The first one is that animals have no other suitable sorbents. The
second possibility (which appears more credible) is that specific
microorganisms may develop in such rocks, that can assimilate REE
converting them into forms suitable for digestion in animals. It is
to be expected that these microorganisms may actively grow in the
mycorrhiza of some plants, explaining why a number of animal licks
appear near the roots of trees, shrubs and some species of grass.
Animals may be attracted to such microorganisms as symbiont
REE-converting forms in the digestive tract microflora as the forms
required by the organism can ‘degenerate ‘at the intake of food
enriched in REE with a ‘wrong’ LREE to HREE ratio.
Concluding the discussion of the results obtained,
a brief focus is made on the possible negative effects of excess
REE content in landscape components on humans. The situation of
unusually high concentrations of LREE (particularly cerium) in
vegetation and the tail gland of deer (Fig. 14B) that we found in the Altai
Mountains, coupled with the published data on specific human
pathologies, such as the endomyocardial Leffler fibrosis (EFL)
which has a direct link with the excess of cerium in the plant diet
of humans in India (45,46) and Africa (47), strongly suggest that geophagy both
in herbivores and humans is associated with an impaired REE
exchange in the body. Within the considered aspect, the connection
of human consumption of earthy substances with the disease
described in South America as Cachexia Africana (48) also does not appear coincidental.
Previous studies on geophagy in humans have demonstrated that the
urge for geophagy develops against a background of specific
pathologies accompanied by signs of mineral metabolism disorders
(49-52).
It is important to note that geophagy in animals is
also common in the southern states of India that are not affected
by EFL disease in humans. Such cases have been reported, in
particular, in the Chinnar Nature Park (53) in Kerala, India and the neighboring
state of Tamiland in the Marakkanam Reserved Forest, India
(54). The Chinnar Park is located
on a mountain plateau with heights up to 2,500 m. Similar to the
plateau in the upper Chulyshman River, it is composed of
metamorphic rocks of the Precambrian age, mainly crystalline
schists and gneisses, including the Charnockite series, where the
major part of REE is concentrated in monazite (55). Biogeochemical endemic diseases in
humans associated with an excess of REE in monazite-bearing sands
were revealed along the banks and in the estuarine parts of rivers
running precisely from this plateau. Similar rocks are very
widespread not only in the south but also in the eastern parts of
India, i.e., exactly where geophagy among humans was widespread at
the beginning of the XX century, according to Laufer (56).
As a development of this topic, there was an
interesting fact that was found in 2021 in Yazula, when residents
were interviewed (data not shown). Some of the interviewees assured
us that there were individuals in the village who periodically ate
the most finely dispersed varieties of kudurits. This leads to the
hypotheses that one should also expect mineral metabolism disorders
and other endemic pathologies associated with an excess of REE in
people living in the areas we studied in the Chulyshman River
basin, namely in the Balykcha, Koo and Yazula settlements. However,
specific medical research is required for this to be
determined.
In conclusion, geological and hydrobiogeochemical
analyses conducted in two areas in the Teletskoye Lake basin in the
Altai Mountains suggest that geophagy among wild and domestic
herbivores in the studied areas develops in mountain-taiga with
steppe landscapes on Proterozoic metamorphic rocks near outcrops of
Paleozoic granitoids with high concentrations of magmatogenic REE
minerals. This circumstance is the reason for high concentrations
of REE in loose diluvial deposits and glacial deposits adjacent to
granitoids, as well as in derivative soils and vegetation. This
geochemical specificity of the landscape with a high probability
can lead to an excess of REE in the neuroimmunoendocrine system of
the body, a carrier of this group of elements, which can cause a
stress reaction in animals. This condition most likely causes
animals to compensate for the resulting problems in the body by
using mineral sorbents capable of removing the excess of REE from
the body. When choosing these, the animals tend to find Na-enriched
varieties if possible. The obtained results justify the need to
continue testing the validity of the REE-hypothesis in other
regions of the world, including the sites of geophagy among
humans.
Acknowledgements
The authors would like to thank staff of the
Analytic Center of the Far Eastern Geological Institute of the FEB
RAS (Vladivostok, Russia): N.V. Zarubina, G.A. Gorbach, E.A.
Tkalina, N.V. Khurkalo and Y.M. Ivanova, who participated in the
preparation and analytical study of the factual material.
Funding
Funding: The present study was financially supported by the
Russian Science Foundation (Project no. 20-67-47005 and
20-64-47021).
Availability of data and materials
The datasets used and/or analyzed during the
current study are available from the corresponding author on
reasonable request.
Authors' contributions
All authors (AMP, NVB, IVS, IYC, EAV, YVK, TNL,
NYP, AVR, DSO, ЕVЕ, AVV, OVP, RAM and YAM, ASK, DAS, AT and KSG)
contributed to the conception and design of the study. Material
preparation, data collection and analysis were performed by AMP,
NVB, IVS, IYC, EAV, YVK, TNL, NYP, AVR, DSO, ЕVЕ, AVV, OVP, RAM and
YAM. The first draft of the manuscript was written by AMP and all
authors commented on previous versions of the manuscript. AMP and
KSG confirm the authenticity of all the raw data. All authors have
read and approved the final manuscript.
Ethics approval and consent to
participate
Not applicable.
Patient consent for publication
Not applicable.
Competing interests
DAS is the Managing Editor of the journal, but had
no personal involvement in the reviewing process, or any influence
in terms of adjudicating on the final decision, for this article.
AT is an Editorial Advisor of the journal, but had no personal
involvement in the reviewing process, or any influence in terms of
adjudicating on the final decision, for this article. The other
authors declare that they have no competing interests.
References
|
1
|
Panichev AM, Golokhvast KS, Gulkov AN and
Сhekryzhov IY: Geophagy in animals and geology of Kudurs (mineral
licks): A review of Russian publications. Environ Geochemistry
Health. 35:133–152. 2013.PubMed/NCBI View Article : Google Scholar
|
|
2
|
Kreulen DA: Lick use by large herbivores:
A review of benefits and banes of soil consumption. Mammal Rev.
15:107–123. 1985.
|
|
3
|
Panichev AM: Geophagia in the worlds of
animals and humans. Moscow, Nauka, pp223, 1990 (In Russian).
|
|
4
|
Klaus G and Schmid B: Geophagy at natural
licks and mammal ecology: A review. Mammalia. 62:482–498. 1998.
|
|
5
|
Abrahams PW: Geophagy (soil consumption)
and iron supplementation in Uganda. Trop Med Int Helth. 2:617–623.
1997.PubMed/NCBI View Article : Google Scholar
|
|
6
|
Ketch LA, Malloch D, Mahaney WC and
Huffman MA: Comparative microbial analysis and clay mineralogy of
soil eaten by chimpanzees (Pan troglodytes schweinfurhii) in
Tanzania. Soil Biol Biochemistry. 33:199–203. 2001.
|
|
7
|
Krishnamani R and Mahaney WC: Geophagy
among primates: Adaptive significance and ecological consequences.
Anim Behav. 59:899–915. 2002.PubMed/NCBI View Article : Google Scholar
|
|
8
|
Wilson MJ: Сlay mineralogical and related
characteristics of geophagic materials. J Chem Ecol. 29:1525–1547.
2003.PubMed/NCBI View Article : Google Scholar
|
|
9
|
Gilardi JD, Duffey SS, Munn CA and Tell L:
Biochemical functions of geophagy in parrots: Detoxification of
dietary toxins and cytoprotective effects. J Chem Ecol. 25:897–922.
1999.
|
|
10
|
Houston DC, Gilardi JD and Hall AJ: Soil
consumption by elephants might help to minimize the toxic effects
of plant secondary compounds in forest browse. Mammal Rev.
31:249–254. 2001.
|
|
11
|
Ekosse GI, Chistyakov KV, Rozanov AB,
Bashkirova NN, Dultz S, Polekhovsky YS and Lessovaia SN: Landscape
settings and mineralogy of some geophagic clay occurrences in South
Africa. In: Frank-Kamenetskaya OV, Vlasov D, Panova E, Lessovaia S,
(eds.): Processes and Phenomena on the Boundary Between Biogenic
and Abiogenic Nature. Lecture Notes in Earth System Sciences, Cham,
pp785-801, 2020.
|
|
12
|
Panichev AM: Rare earth elements: Review
of medical and biological properties and their abundance in the
rock materials and mineralized spring waters in the context of
animal and human geophagia reasons evaluation. Achievements Life
Sci. 9:95–103. 2015.
|
|
13
|
Panichev AM: Geophagia: Causes of the
phenomenon. Priroda. 25–35. 2016.(In Russian).
|
|
14
|
Burchfield SR, Elich MS and Woods SC:
Geophagia in response to stress and arthritis. Physiol Behavior.
19:265–267. 1977.PubMed/NCBI View Article : Google Scholar
|
|
15
|
Panichev AM, Baranovskaya NV, Seryodkin
IV, Chekryzhov IY, Vakh EA, Soktoev BR, Belyanovskaya AI,
Makarevich RA, Lutsenko TN, Popov NY, et al: Landscape REE
anomalies and the cause of geophagy in wild animals at kudurs
(mineral salt licks) in the Sikhote-Alin (Primorsky Krai, Russia).
Environ Geochem Health. 44:1137–1160. 2021.PubMed/NCBI View Article : Google Scholar
|
|
16
|
Panichev AM, Baranovskaya NV, Chekryzhov
LY, Kalinkin YN, Kholodov AS, Spandidos DA, Tsatsakis A and
Golokhvast KS: Kudurs (mineral licks) on ultrabasic rocks in the
Altai Mountains, Russia. World Acad Sci J. 5(2)2023.
|
|
17
|
Panichev AM, Seryodkin IV, Kalinkin YN,
Makarevich RA, Stolyarova TA, Sergievich AA and Khoroshikh PP:
Development of the ‘rare-earth’ hypothesis to explain the reasons
of geophagy in Teletskoye Lake area kudurs (Gorny Altai, Russia).
Environ Geochem Health. 40:1299–1316. 2018.PubMed/NCBI View Article : Google Scholar
|
|
18
|
Sobanskiy GG: Animals of the Altai. Part
1: Large carnivores and ungulates. Novosibirsk-Moscow: Association
of Scientific Editions KMK, pp414, 2008 (In Russian).
|
|
19
|
Wei ZG, Yin M, Zhang X, Hong FS, Li B, Tao
Y, Zhao GW and Yan CH: Rare earth elements in naturally grown fern
Dicranopteris linears in relation to their variation in soils in
South-Jiangxi region (Southern China). Environ Pollut. 114:345–355.
2001.PubMed/NCBI View Article : Google Scholar
|
|
20
|
Bromley GF and Kucherenko SP: Ungulates of
the south of the USSR Far East. Moscow, Nauka, pp305, 1983 (In
Russian).
|
|
21
|
Zhang J and Nozaki Y: Rare earth
elementsand yttrium in seawater: ICP-MS determinations in the East
Caroline, Coral Sea, and South Fiji basins of the western South
Pacific Ocean. Geochimica et Cosmochimic Acta. 60:4631–4644.
1996.
|
|
22
|
Alibo DS and Nozaki Y: Rare earth elements
in seawater: Particle association, shale-normalization, and Ce
oxidation. Geochimica et Cosmochimica Acta. 63:363–372. 1999.
|
|
23
|
Gaillardet J, Viers J and Dupre B: Trace
elements in rivers waters. Treasure on Geochemistry. V5. Amsterdam:
Elsevier Pergamon. 5:225–272. 2004.
|
|
24
|
Gromet LP, Dymek RF, Haskin LA and Korotev
RL: The ‘North American shale composite’; its compilation, major
and trace element characteristics. Geochimica et Cosmochimica Acta.
48:2469–2482. 1984.
|
|
25
|
Sun SS and McDonough WF: Chemical and
isotopic systematics of ocean basalts implications for mantle
composition and processes. Geological Society, London, Special
Publications. 42:313–345. 1989.
|
|
26
|
Panichev AM, Chekryzhov IY, Stolyarova TA,
Mitina EI, Trepet SA, Sergievich AA and Khoroshikh AA: Results of
mineralogical-geochemical researches of two high-mountain kudurs
within territory of Caucasus. Environ Earth Sci. 76(749)2017.
|
|
27
|
Rice CG: Mineral lick visitation by
mountain goats, Oreamnos americanus. Can Field Naturalist.
124:225–237. 2010.
|
|
28
|
Bgatov VI, Panichev AM, Sobanskii GG, Van
AV and Budnikov IV: Animal licks in Siberian Mountains. Bulletin of
Moscow Society of Nature Investigators. Department Biol. 93:42–53.
1988.(In Russian).
|
|
29
|
Abrahams PW: The chemistry and mineralogy
of three Savanna lick soils. J Chem Ecol. 25:2215–2228. 1999.
|
|
30
|
Ferrell RE, Vermeer DE and LeBlanc WS:
Chemical and mineralogical composition of geophagical materials.
Trace substances in environ. Health Univ Missouri. 19:47–55.
1985.
|
|
31
|
Ekosse GI and Anyangwe S: Mineralogical
and particulate morphological characterization of geophagic clayey
soils from Botswana. Bull Chem Soc Ethiop. 26:373–382. 2012.
|
|
32
|
Gebel AD: On earthy substances used as
food in Persia. Notes of the Imperial Academy of Sciences.
Saint-Petersburg. 2:126–135. 1862.(In Russian).
|
|
33
|
Redling K: Rare Earth Elements in
Agriculture with Emphasis on Animal Husbandry. Dissertation, LMU
München: Tierärztlichen Fakultät, 2006.
|
|
34
|
Blair-West IR, Coghlan JP, Denton DA,
Nelson JF, Orchard E, Scoggins BA, Wright RD, Myers K and Junqueira
CL: Physiological, morphological and behavioural abaptation to a
sodium-deficient environment by wild native Australian and
introduced species of animals. Nature. 217:922–928. 1968.PubMed/NCBI View Article : Google Scholar
|
|
35
|
Shaposhnikov FD: On salt-licking of wild
ungulates in the mountain-taiga Altai. Byulleten' Moskovskogo
Obshchestva Ispytatelei Prirody Otdel Biologicheskii. 58:3–10.
1953.(In Russian).
|
|
36
|
Mahaney WС, Milner MW, Sunmugadas K,
Hancock RGV, Aufreiter S, Wragham R and Pier HW: Analysis of
geophagy soils in Kibale Forest, Uganda. Primates. 38:159–176.
1997.
|
|
37
|
Mahaney WC, Milner MW, Muliono H, Hancock
RGV and Aufreiter S: Mineral and chemical analyses of soil eaten by
humans in Indonesia. Int J Environm Healht Research. 10:93–109.
2000.
|
|
38
|
Аnell B and Lagercrantz S: Gefagical
customs. Stud Ethnogr Upsal. 17(98)1958.
|
|
39
|
Powis DA, Clark CL and O'Brien KJ:
Lanthanum can be transported by the sodium-calcium exchange pathway
and directly triggers catecholamine release from bovine chromaffin
cells. Cell Calcium. 16:377–390. 1994.PubMed/NCBI View Article : Google Scholar
|
|
40
|
Panichev AM, Popov VK, Chekryzhov IY,
Seryodkin IV, Stolyarova TA, Zakusin SV, Sergievich AA and
Khoroshikh PP: Rare earth elements upon assessment of reasons of
the geophagy in Sikhote-Alin region (Russian Federation), Africa
and other world regions. Environ Geochem Health. 38:1255–1270.
2016.PubMed/NCBI View Article : Google Scholar
|
|
41
|
Mahaney WC and Hancock RGV: Geochemical
nalysis of African buffalo geophagic sites and dung on Mount Kenya,
East Africa. Mammalia. 54:25–32. 1990.
|
|
42
|
Mahaney WC, Watts D and Hancock RGV:
Geophagia by mountain gorillas (Gorilla gorilla beringei) in the
Virunga Mountains, Rwanda. Primates. 31:113–120. 1990.
|
|
43
|
Mahaney WC, Zippin J, Hancock RGV,
Aufreiter S, Campbell S, Malloch D, Wink M and Huffman MA:
Chemistry, mineralogy and microbiology of termite mound soils eaten
by the chimpanzees of the Mahale Mountains, Western Tanzania. J
Tropical Ecol. 15:565–588. 1999.
|
|
44
|
Dubinin AV: Geochemistry of rare earth
elements in the ocean. Moscow, Nauka, pp360, 2006 (in Russian).
|
|
45
|
Kutty VR, Abraham S and Kartha CC:
Geographical distribution of endomyocardial fibrosis in South
Kerala. International Epidemiological Association. 25:1220–1207.
1996.PubMed/NCBI View Article : Google Scholar
|
|
46
|
Eapen JT: Elevated levels of cerium in
tubers from regions endemic for endomyocardial fibrosis (EMF). Bull
Environ Contam Toxicol. 60:168–170. 1998.PubMed/NCBI View Article : Google Scholar
|
|
47
|
Smith B, Chenery SRN, Cook JM, Styles MT,
Tiberindwa JV, Hampton C, Freers J, Rutakinggirwa M, Sserunjogi L,
Tomkins A and Brown CJ: Geochemical and environmental factors
controlling exposure to cerium and magnesium in Uganda. J
Geochemical Exploration. 65:1–15. 1998.
|
|
48
|
Cragin FW: Observations on Cachexia
Africana or dirt-eating. Am J Med Sci. 17:356–364. 1836.
|
|
49
|
Prasad AS: A diet of zinc or clay.
Citation classic. Current Contents. Life Sci. 34(11)1991.
|
|
50
|
Collignon R: А propos des troubles des
conduites alimentaires du pica des médecins à la géophagie des
géographes, des voyageurs et des ethnologues. Psychopathologie
Africaine. 24:385–396. 1992.
|
|
51
|
Selinus O, Finkelman RB and Centeno JA:
Medical geology. A regional synthesis. Springer, pp392, 2010.
|
|
52
|
Campuzano Maya G: Pica: el síntoma
olvidado. Medicina Laboratorio. 17:533–552. 2011.
|
|
53
|
Ramachandran KK, Balagopalan M and
Vijayakumaran Nayr P: Use pattern and chemical characterization of
the natural salt licks in Chinnar wildlife sanctuary (Research
report 94). Kerala Forest Research Institute Peechi, Thrissur, 18,
1995.
|
|
54
|
Voros J, Mahaney WC and Milner MW:
Geophagy by the bonnet macaques (Macaca radiata) of Southern India:
A preliminary analysis. Primates. 42:327–344. 2001.
|
|
55
|
Anitha JK, Joseph Sabu RG and Sundararajan
M: Monazite chemistry and its distribution along the coast of
Neendakara-Kayamkulam belt, Kerala, India. SN Applied Sciences.
2(812)2020.
|
|
56
|
Laufer B: Geophagy publications of the
field museum of natural history. Anthropological Series. 18:99.
101–198. 1930.
|