Introduction
There is a higher risk of bone fracture in patients
with stroke compared to the healthy controls. A significant reason
for this is the decreased use of paretic extremities, which induced
disuse amyotrophy and bone loss (1).
In a few previous studies the associations of bone mineral content
(BMC) and soft tissue composition of the extremities were observed
in patients with stroke and the results were inconsistent (2,3). One of the
reasons was that different methodologies for rehabilitation were
used.
There is a hypothesis that skeletal muscle should
not be only treated as a locomotorium, but also as an endocrine
organ (4,5). Increasing research over the past 20 years
has demonstrated that muscle is a source of myokines that can
influence muscle and bone growth in positive or negative ways.
Myostatin, insulin-like growth factor 1 (IGF-1) and mechano growth
factor (MGF) are three significant myokines, which are produced,
expressed and released by muscle fibers following external
stimulation, and have their own roles in mediating bone and muscle
metabolism by exerting either paracrine or endocrine effects
(6–9).
The present study was divided to two sections; the
clinical research and animal experiment. The clinical research was
designed to investigate the association between BMC, lean mass (LM)
and fat mass (FM) in the hemiplegic extremities in patients
following a stroke, while the animal experiment was designed to
determine the effectiveness of electrical muscle stimulation (EMS)
to the hindlimbs following sciatic neurectomy (SN) in attenuating
disuse amyotrophy and cortical bone loss in Sprague-Dawley female
rats by regulating the myostatin, IGF-1, and MGF mRNA or protein
expression in muscle fiber and bone tissue.
Materials and methods
Clinical research
Subjects
A total of 61 hemiplegic patients subsequent to
experiencing a stroke [35 men, mean age of 64.3 years, mean body
mass index (BMI) of 23.9 kg/m2; 26 women, mean age of
65.8 years, mean BMI of 25.7 kg/m2) were recruited on a
volunteer basis. All the subjects had to fulfill the following
inclusion criteria: i) Experienced one single stroke only, ii)
post-stroke duration of ≥1 year, and iii) were independent in
ambulation with or without an assistive device. Potential subjects
were excluded if they: i) Had other serious diseases in addition to
stroke that affect bone metabolism, ii) had any metal implants in
extremities, iii) were currently prescribed medications that affect
bone metabolism, and iv) had unstable cardiovascular disease.
Dual-energy X-ray absorptiometry (DEXA)
Each subject underwent a total body scan using DEXA
(Lunar-DPX IQ; GE Lunar Corp., Chicago, IL, USA). All the scans
were performed by the same technician using standard procedures,
following the manufacturer's protocol. The BMC (g), LM (g) and FM
(g) in each extremity were determined by the region of interest
program.
Animal experiment
Animal and experimental design
A total of 30 female specific pathogen-free
Sprague-Dawley rats were obtained from Sino-British Sippr/BK Lab
Animal Ltd., Co. [Shanghai, China; license no. SCXK (HU) 2008–0016]
weighing ~200 g (~6 weeks of age) and allowed to acclimate to their
surroundings for 1 week prior to the initiation of the study. All
the rats were housed in the Experimental Animal Center of Shanghai
University of Traditional Chinese Medicine (Shanghai, China). The
animal room was environmentally controlled at 28±1°C and 60%
humidity with a 12:12-h light-dark cycle.
Three experimental groups were studied: i) Blank
control (BC, n=10), ii) sham procedure (SP, n=10), and iii) animals
that underwent surgery and were subjected to right-side SN (n=10)
under anesthesia pentobarbital sodium (0.1 ml/100 g body weight).
Rats were housed with normal cage activity and allowed free access
to standard lab chow and tap water. Each group was divided into 2
subgroups: EMS and non-EMS. EMS was performed on the rats in the
EMS subgroup. After 9 weeks all the rats were sacrificed.
At the time of sacrifice the soleus, gastrocnemius,
medial vastus and tibial anterior muscle were excised, and the wet
weights were recorded. Additionally, the tibias were removed and
weighed, cleaned of soft tissue and stored in 75% ethanol at room
temperature for cortical histomorphometry of the diaphysis region.
The femurs were stored in ethylenediaminetetraacetic acid (5.5
g:100 ml 10% formalin) at room temperature for detecting myostatin
protein expression with an immunohistochemical method.
EMS
EMS was performed in rats with limbs fixed by
threads. The stainless steel needles were inserted percutaneously
into the tibial anterior muscle, at a depth of 7 mm at the knee
region of rats. The stimulation was applied using a G9805
stimulator (Medical Electronic Instrument Factory, Shanghai, China)
with 1.0 mA and a duration of 1.0 msec at 3 pulses. Rats in the EMS
subgroups underwent EMS for a period of 30 min at a time, once a
day for 5 days a week, for a duration of 9 weeks. The limbs of the
rats in the non-EMS subgroup were fixed and needles were placed
into the same point without performing the stimulation.
Reverse transcription-quantitative polymerase
chain reaction (RT-qPCR)
RNA extraction was performed according to the RNAiso
Plus directions (D9108A; Takara, Tokyo, Japan) with a few
modifications. Subsequently, the integrity of the total RNA was
confirmed by determination of the optical density (OD) at 260 and
280 nm under ultraviolet light (Shimadzu, Kyoto, Japan). Only those
samples with OD260/OD280 ≥1.7 were used for RT. RT reactions were
carried out on 1–2 µg of sample in accordance with the PrimeScript
RT reagent kit (DRR037A; Takara) using a DNA Engine Peltier Thermal
Cycle machine (Bio-Rad, Hercules, CA, USA). Samples were analyzed
for myostatin, IGF-1, and MGF mRNA levels by RT-qPCR using the
Real-Time 7500 system (Applied Biosystems, Thermo Fisher
Scientific, Inc., Waltham, MA, USA) using SYBR Premix Ex Taq kit
(Takara code: DRR041A). The sequences of primers used for PCR were
as follows: GAPDH-forward (F), GACAACTTTGGCATCGTGGA and reverse
(R), ATGCAGGGATGATGTTCTGG; myostatin-F, AGAATGGGCATGATCTTGCTGTAAC
and R, CATCACAGTCAAGCCCAAAGTCTC; MGF-F, GCTTGCTCACCTTTACCAGC and R,
AAATGTACTTCCTTTCCTTCTC; and IGF-F, TTCAGTTCGTGTGTGGACCAAG; R,
GATCACAGCTCCGGAAGCAA. All the primer sequences were designed
according to gene bank and synthesized by Takara.
Histology and immunohistochemistry
Vastus medialis and femurs, harvested from rats
anesthetized by 3% pentobarbital sodium (0.1 ml/100 g body weight),
were embedded in paraffin (following fixation in 4% formalin). The
paraffin blocks were separated at 5 µm and vastus medialis atrophy
was determined through histomorphometry following hematoxylin and
eosin (H&E) staining. After deparaffinization and rehydration
in ascending grades of alcohol, antigen retrieval was performed in
citrate buffer (pH 6.0) at 93–98°C for 6 min in the microwave. The
slides were blocked in 10% fetal bovine serum (Sigma Aldrich, St.
Louis, MO, USA) for 15 min. The sections of vestus medialis and
femur were stained with rabbit anti-human yostatin (sc-28910,
1:100, Santa Cruz Biotechnology, Inc., Dallas, TX, USA) for 2 h at
room temperature and staining was revealed with a biotinylated goat
anti-rabbit secondary antibody (sc-2018, 1:200, Santa Cruz
Biotechnology, Inc.) for 1 h at room temperature. Endogenous
peroxidase activity was blocked by 3% H2O2
and slides were counterstained with H&E.
Histomorphometric analysis
Tetracycline (TC; Xinhua Pharmaceutical Co., Ltd.,
Shandong, China) gavage (100 mg/kg of body mass) was administered
to rats on day 1 of EMS and the day prior to sacrificing to label
the mineralizing bone formation for histomorphometric analysis.
Undemineralized distal tibiae were subjected to
serial dehydration. Serial cross sections (200–250 µm) of midshaft
bone were separated starting at 3 mm with a Leica SP1600 slicing
machine (Leica, Wetzlar, Germany). Sections were handground to
reduce the thickness (<100 µm) prior to mounting on glass
slides. The histomorphometric analyses were performed using the
Olympus microscope (Olympus, Tokyo, Japan). Measures of labeled
surfaces and interlabel widths were obtained (magnification, ×200)
of ≤3 slides per tibiae. The cortical grow rates were calculated by
dividing the average interlabel width by the time between the two
times of labeling (63 days).
Statistical analysis
All data are expressed as mean ± standard deviation
and evaluated using the statistical package SPSS 13.0 (SPSS, Inc.,
Chicago, IL, USA). Paired t-tests were used to examine whether
there were side-to-side differences in BMC, LM and FM. Pearson
correlations were used for nominal data that were normally
distributed: BMC, LM, and FM. Bone, muscle wet weight at sacrifice,
myostatin, IGF-1 and MGF mRNA expression levels and TC interlabel
width were analyzed using paired t-tests to determine whether there
were significant differences between operated and contralateral
hindlimbs. The unpaired t-test was used to compare the group and
subgroup differences. For all data, P<0.05 was considered to
indicate a statistically significant difference.
Ethical statement
All patients participating in the present study
provided written informed consent. The protocols for the clinical
research and animal experiments were approved by all hospital
ethics committees.
Results
Clinical investigation
Comparison of bone mineral levels and soft
tissues composition between the extremities
Bone mineral levels and soft tissue composition were
significantly different between paretic and non-paretic extremities
(Table I). The paretic extremities had
a significantly lower BMC, FM and LM compared to non-paretic
extremities. No significant differences were identified in the
LM/FM ratio between the paretic and non-paretic extremities.
 | Table I.Comparison between the paretic and
non-paretic extremities. |
Table I.
Comparison between the paretic and
non-paretic extremities.
| Variable | Non-paretic
extremity | Paretic
extremity | P-value (paired
t-tests) |
|---|
| Upper extremity |
|
|
|
| BMC,
g |
166.5±56.8 |
138.9±54.8 | <0.01 |
| FM,
g |
1677.3±852.5 |
1437.4±755.2 | <0.01 |
| LM,
g |
2994.5±1003.9 |
2515.9±812.1 | <0.01 |
|
LM/FM |
2.35±1.4 |
2.4±2.1 | >0.05 |
| Lower extremity |
|
|
|
| BMC,
g |
434.8±138.1 |
398.0±142.5 | <0.01 |
| FM,
g |
2393.2±884.2 |
2237.1±872.7 | <0.01 |
| LM,
g |
6541.3±1633.3 |
6090.6±1693.8 | <0.01 |
|
LM/FM |
3.2±1.7 |
3.3±1.8 | >0.05 |
BMC loss and muscle atrophy
There were significant correlations between BMC and
LM, but not FM in the non-paretic upper (r=0.754, P<0.01) and
lower (r=0.877, P<0.01) extremities. However there were
significant correlations between BMC and LM (r=0.808, P<0.01)
and FM (r=−0.305, P<0.05) in the paretic upper extremity and
only between BMC and LM (r=0.884, P<0.01) in paretic lower
extremity. A decrease in BMC was significantly correlated with LM
loss (upper: r=0.808; lower: r=0.884; P<0.01) in the paretic
extremities, while there was no evidence of BMC loss being
correlated with FM loss. The multiple regression analysis showed
that extremity LM loss was a strong predictor of paretic extremity
BMC loss (upper: β=0.702, F=16.244, P<0.01; lower: β=0.836,
F=47.374, P<0.01).
Rat model experiments
Changing trend of body weight
The mean weight increase of the BC, SP and SN groups
from the first to the last week was 28.33, 42.32 and 20.24%. The
EMS group weight only increased by 23.65%, while the non-EMS group
had a growth of 27.58%.
Influence of SN on the wet weight of muscle and
bones
There were no differences of vastus medials, soleus,
tibialis anterior (TA) muscle, femur and tibia wet weight between
the right and left hindlimbs in the BC and SP groups (P>0.05).
The SN group showed a significant loss of vastus medials, soleus,
TA muscle, tibia and femur wet weight in the surgically operated
hindlimbs compared to contralateral limbs (P<0.01) (Table II). Compared to the BC group, no
difference was identified in the SP group in muscle or bone wet
weight in the left or right hindlimbs (P>0.05), while the SN
group had a significant wet weight loss in the surgically operated
hindlimbs (P<0.01).
| Table II.Wet weight of muscle and bone from the
left and right hindlimbs of the different treatment groups. |
Table II.
Wet weight of muscle and bone from the
left and right hindlimbs of the different treatment groups.
| Group | Sample | Left hindlimb, g | Right hindlimb,
g | P-value |
|---|
| BC | Vastus medialis |
2.29±0.31 |
2.41±0.42 | 0.33 |
|
| Soleus |
2.05±0.20 |
2.05±0.26 | 0.90 |
|
| TA |
1.11±0.43 |
1.17±0.48 | 0.45 |
|
| Femur |
0.97±0.15 |
1.03±0.14 | 0.27 |
|
| Tibia |
0.84±0.21 |
0.80±0.07 | 0.52 |
| SP | Vastus medialis |
2.39±0.28 |
2.26±0.33 | 0.27 |
|
| Soleus |
2.17±0.20 |
2.07±0.24 | 0.37 |
|
| TA |
1.02±0.11 |
0.97±0.18 | 0.38 |
|
| Femur |
1.04±0.13 |
1.05±0.14 | 0.46 |
|
| Tibia |
0.77±0.11 |
0.76±0.10 | 0.71 |
| SN | Vastus medialis |
2.04±0.23 |
1.86±0.30 | 0.03 |
|
| Soleus |
1.85±0.19 |
0.59±0.47 | 0.01 |
|
| TA |
0.84±0.11 |
0.35±0.15 | 0.01 |
|
| Femur |
1.04±0.11 |
0.89±0.11 | 0.01 |
|
| Tibia |
0.74±0.06 |
0.68±0.06 | 0.01 |
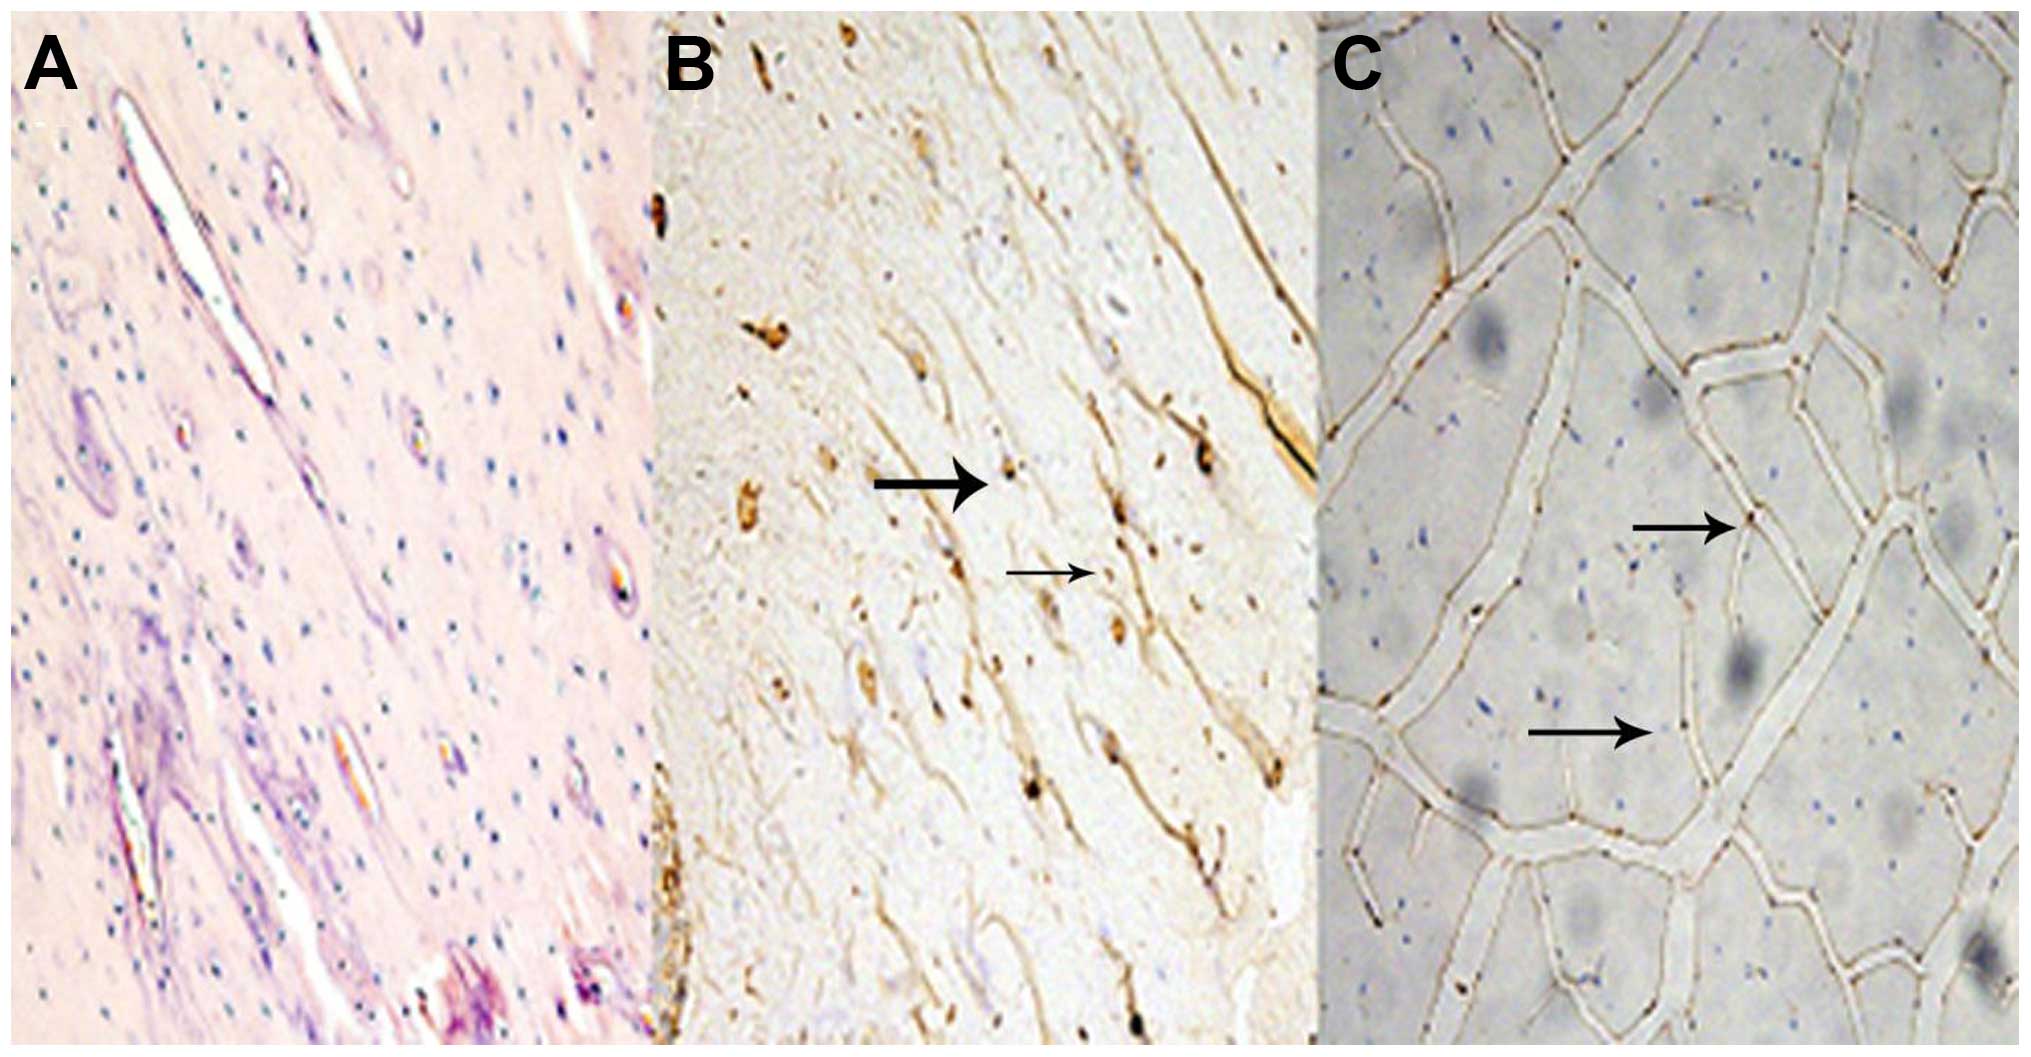
Histology and immunohistochemistry
In sections from vastus medialis with H&E
staining, muscle fiber atrophy was observed in the SN group. All
the groups maintained the polygonal muscle fiber shape.
Fig. 1 represents the
sections of myostatin protein expression in femur bone tissue and
medial vastus muscle fiber. Relative to the BC group, myostatin
protein expression was observed in the bone and muscle tissue in
the SN group.
Myostatin, MGF and IGF-1 mRNA expression
levels
No differences were observed for the myostatin, MGF
and IGF-1 mRNA expression levels between the SP and BC group
(P>0.05). The SN group showed a significant upregulated
myostatin mRNA expression level, while MGF and IGF-1 mRNA remained
the same level compared to the BC group. Myostatin mRNA expression
level was significantly decreased in the BC+EMS and SN+EMS
subgroups, while there was a significant increase in the trend in
MGF and IGF-1 mRNA expression had a significant increase trend
compared to Non-EMS subgroup (P<0.05). However, no significant
differences were observed in the SP+EMS and SP+non-EMS group
(P>0.05) (Table III).
| Table III.Relative expression levels of MSTN,
MGF and IGF-1 mRNA in muscle fibers of the different treatment
groups. |
Table III.
Relative expression levels of MSTN,
MGF and IGF-1 mRNA in muscle fibers of the different treatment
groups.
| Gene | BC+Non-EMS | BC+EMS | SP+Non-EMS | SP+EMS | SN+Non-EMS | SN+EMS |
|---|
| MSTN |
1.00±0.00 |
0.59±0.14 |
0.80±0.17 |
0.48±0.31 |
3.32±1.40 |
1.45±0.81 |
| MGF |
1.00±0.00 |
1.35±0.56 |
1.18±0.28 |
1.66±0.75 |
1.02±0.58 |
2.76±1.00 |
| IGF-1 |
1.00±0.00 |
1.34±0.39 |
1.05±0.25 |
1.74±1.16 |
1.32±0.52 |
2.71±1.36 |
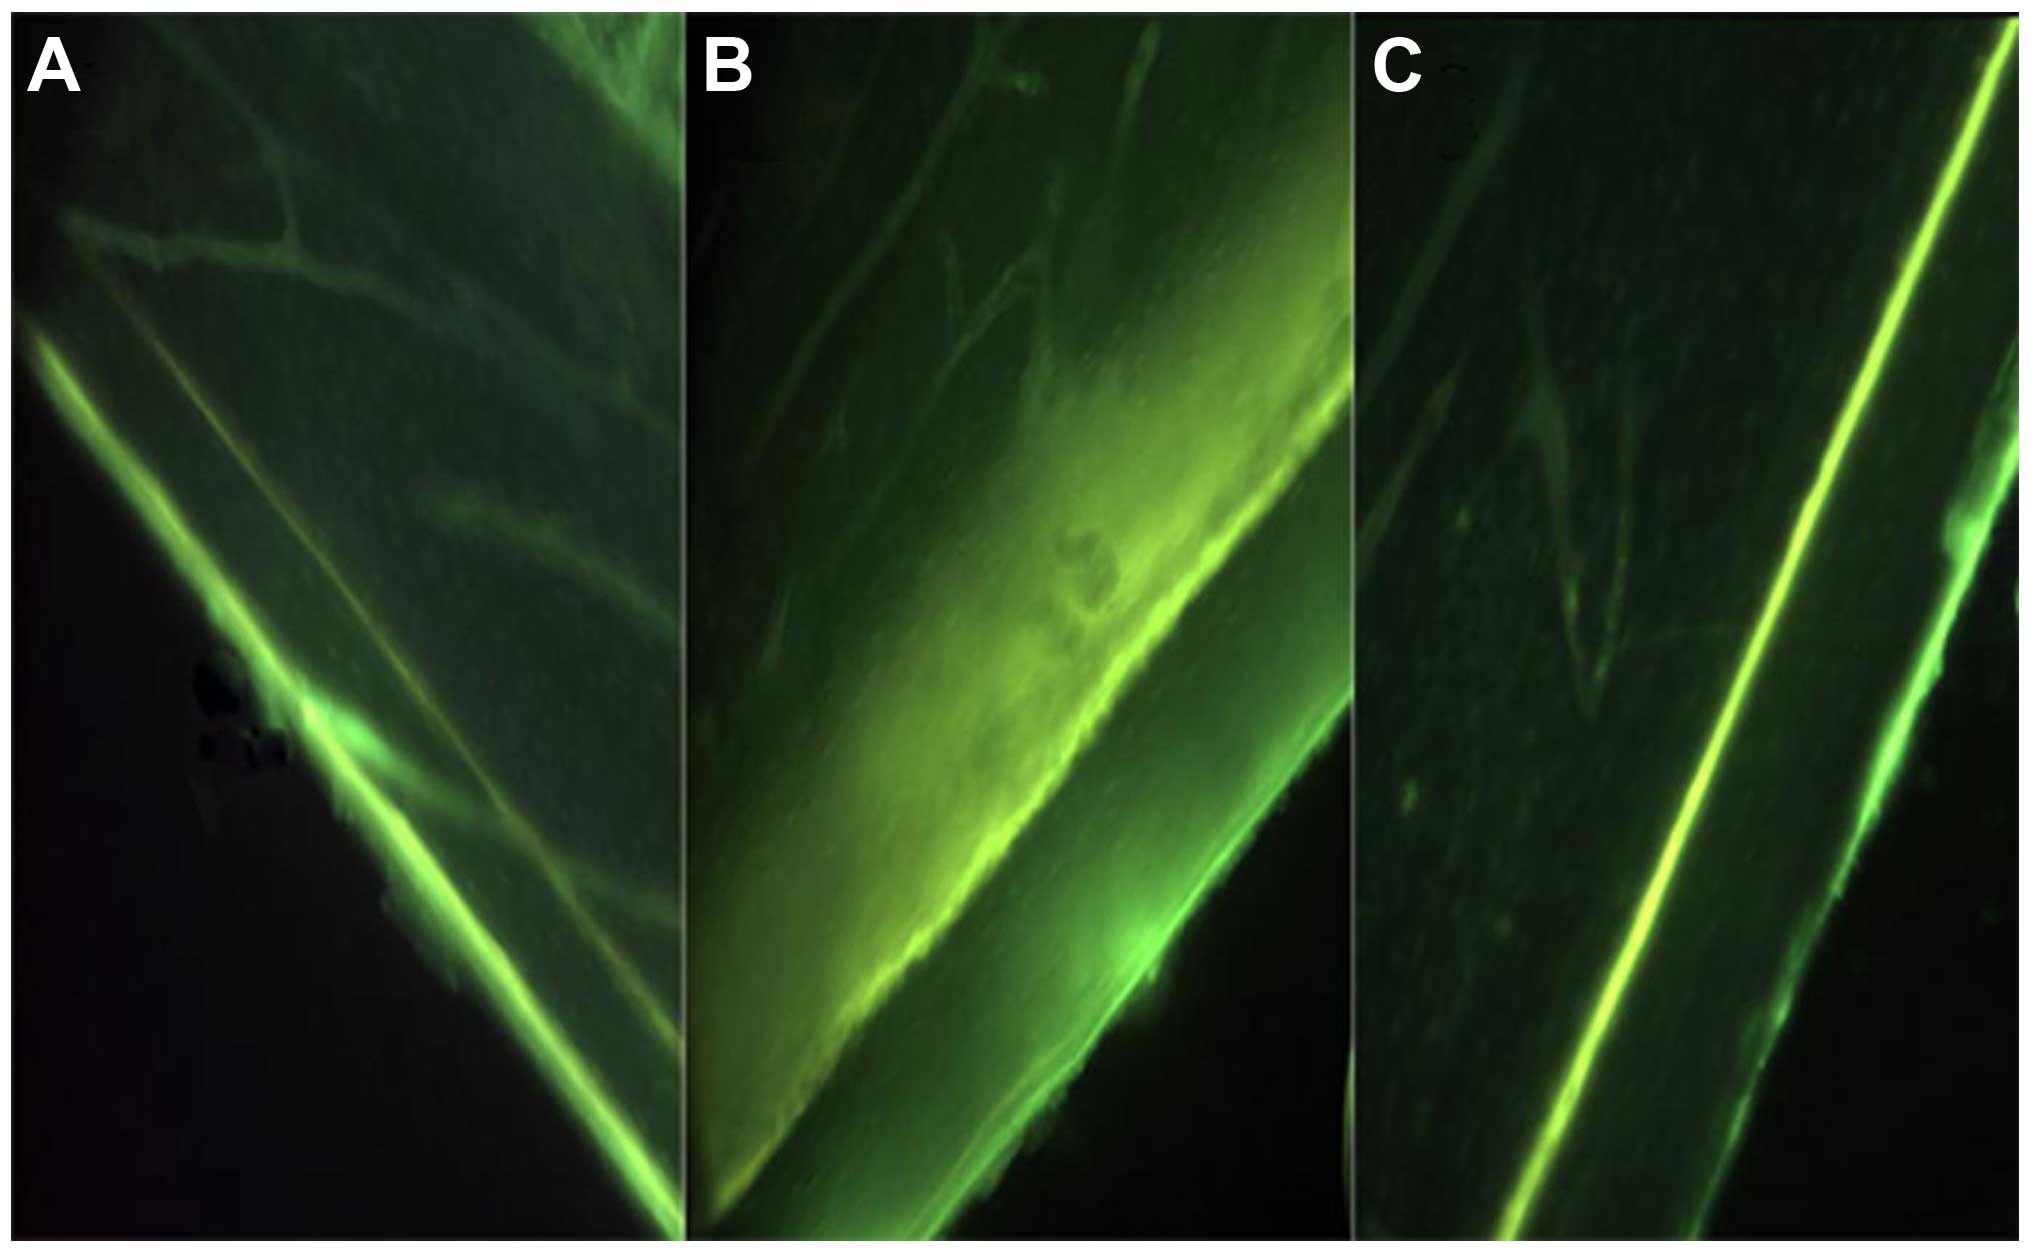
EMS increases bone formation on cortical
surfaces
No significant differences were observed in the TC
interlabel width between BC (56.90±10.21 µm) and SP (57.00±9.90 µm)
groups (P>0.05). The SN group showed an evident decrease in TC
interlabel width (43.33±16.33 vs. 57.50±17.47 µm) and cortical
growth speed (0.69±0.26 vs. 0.91±0.28 µm/day) in the surgically
operated hindlimbs compared to the contralateral hindlimbs, but was
not significantly different (P>0.05). Animals in the SN group
were exposed to EMS (SN+EMS), and this subgroup exhibited a
relatively larger TC interlabel width and faster cortical growth
speed (P>0.05) (Table IV, Fig. 2).
| Table IV.TC interlabel width and growth speed
on the tibia cortical surface of the different subgroup
treatments. |
Table IV.
TC interlabel width and growth speed
on the tibia cortical surface of the different subgroup
treatments.
| Groups | Tibia | Interlabel width,
µm | Growth speed,
µm/day |
|---|
| BC+non-EMS | Right |
48.75±12.37 |
0.77±0.20 |
| BC+EMS | Right |
62.23±4.61 |
0.99±0.07 |
| SP+non-EMS | Left |
50.00±3.54 |
0.79±0.06 |
|
| Right |
54.17±6.29 |
0.52±0.48 |
| SP+EMS | Left |
61.67±10.40 |
0.98±0.17 |
|
| Right |
48.50±6.26 |
0.46±0.43 |
| SN+non-EMS | Left |
51.67±11.27 |
0.82±0.18 |
|
| Right |
37.50±5.00 |
0.36±0.33 |
| SN+EMS | Left |
63.33±23.09 |
1.01±0.37 |
|
| Right |
49.17±23.23 |
0.78±0.37 |
Discussion
Disuse muscle atrophy is observed in the paretic
extremities in a number of patients following stroke, which
correlates a higher risk of bone fractures. Reduced motor skills,
failure to keep balance and osteoporosis may lead to this. There
have been several studies on BMC and soft tissue changes in
hemiplegic patients following stroke. BMC and LM were significantly
decreased in paretic extremities compared to non-paretic
extremities, and BMC correlated strongly with LM (1–3). The results
of the present study supported these opinions. In addition, BMC was
strongly correlated with LM in paretic and non-paretic extremities,
and BMC loss was strongly correlated with LM loss, but not FM in
paretic extremities of patients following stroke. The LM was an
important predictor of BMC, indicating that muscle has a key role
in maintaining BMC of extremities (1).
Therefore, we may suppose that exercise could prevent bone loss and
increase BMC through muscle stretching.
In order to investigate the molecular mechanism and
discuss whether physical therapy could prevent LM and bone loss, a
rat model of SN to the hindlimbs was established to assess the
association of BMC loss with LM loss and the feasibility of EMS for
attenuating cortical bone loss and muscle atrophy. The present
study showed that rats with SN had a lower rate of weight increase
compared to the other two groups and there was significant
reduction in muscle and bone wet weight in the surgically operated
hindlimbs compared to the non-operated sides, which may indicate
that reduced muscle contraction due to muscle atrophy was
associated with the cause of bone loss. As bone formation was
stimulated by muscle forces, muscle strength may be a key factor
affecting bone mineralization. EMS is a non-drug therapy. Wei et
al (10) reported that loading by
stimulation-induced muscle contraction at high frequencies was
beneficial for the maintenance of bone growth or the prevention of
mineral loss, or both, during hindlimb suspension in rats. In the
present study, TC was used for dual-label mineralizing bone
formation and bone growth. EMS increased bone growth rate, which
suggests that EMS could prevent bone mineral loss due to SN through
stimulating muscle contraction.
The interaction between muscle and bone remains to
be elucidated, and it was shown that muscle is a potential
endocrine organ that could synthesis and secrete several cytokines
to affect bone metabolism (5).
Myostatin as an important myokine, formerly known as growth and
differentiation factor 8, a member of transforming growth factor-β
superfamily, is an important negative regulator of skeletal muscle
mass (11). The data reported in the
present study showed a significant upregulated myostatin mRNA level
in gastrocnemius muscle fibers of surgically operated hindlimbs.
Muscle without neurotrophy resulted in myostatin mRNA increase,
which led to the inhibition of myocyte proliferation and muscle
atrophy. However, following the administration of SN rat EMS,
myostatin mRNA expression showed a clear decrease. This result
supported the view that myostatin downregulation was in response to
EMS, which was in line with other studies that showed
resistance-type muscle loading could decrease myostatin mRNA
expression levels (11). Furthermore,
in the present study it was shown that myostatin protein was not
only expressed in muscle tissue but also bone tissue, and changes
in mRNA were indicative of changes in the protein levels.
Considering the inhibiting effect of myostatin on muscle growth and
bone growth (6–8), this finding could help to explain the
superior effect of EMS on attenuating muscle atrophy and bone loss.
As shown in the data presented, the SN+EMS subgroup showed larger
TC interlabel width and faster cortical growth speed compared to
the SN+non-EMS subgroup. Therefore, we may speculate that the
faster growth of cortical bone is associated with a decrease of
myostatin mRNA expression.
IGF-1 is synthesized by almost all tissues and is an
important mediator of cell growth, differentiation, and
transformation. IGF-1 is the product of the IGF-1 gene and it is
known that the IGF-1 gene has several different splice variants
that have different functions. These variants in rodents include
one that is the same as the main systemic IGF-1Ea produced by liver
and another which has been termed MGF (IGF-1Eb), and its mRNA is
only detected in muscle following mechanical stimulation. From its
sequence, MGF is derived from the IGF-1 gene by alternative
splicing and has different 3′ exons to IGF-1Ea, it has a 52
base-pair insert in rodents within the E domain of exon 5, which
results in a different reading frame (9). Hill and Goldspink (12) reported that following mechanical
stimulation or muscle damage, the IGF-1 gene was first spliced to
produce MGF and later produced the more common IGF-1Ea transcript.
MGF can induce satellite cell activation as well as protein
synthesis. A mammalian expression plasmid containing the MGF cDNA
sequence was delivered to the hindlimb muscles of mice, which
resulted in a significant improvement in hindlimb muscle strength,
and an increase in motor unit and motor neuron survival (13). No significant differences in IGF-1 and
MGF mRNA expression levels in the BC, SP and SN groups were
observed in the present study. However, MGF and IGF-1 mRNA level
presented a significant increase in the EMS subgroup compared to
the non-EMS subgroup. This result demonstrated that EMS could
upregulate MGF and IGF-1 mRNA levels in muscle fibers, which was
consistent with other studies. Hameed et al (14) reported that high resistance exercise
resulted in a significant increase (864%) in MGF mRNA in young
patients. Bamman et al (15)
reported a 62% increase in IGF-1 mRNA level in human muscle 48 h
after a single bout of eccentric resistance-type exercise. The
present study showed an increase of MGF mRNA following EMS;
however, the magnitude was not as high as other studies (16). It is possible that MGF is just a
transient and activity-sensitive local growth factor with a short
half life. In the present study, MGF mRNA in gastrocnemius muscle
was detected 24 h later after the last EMS, and it is possible that
the majority of MGF had already degraded. Considering the positive
effect of MGF and IGF-1 on muscle growth, we may speculate that EMS
could benefit in preventing muscle atrophy.
Certain limitations merit discussion. First, in the
clinical research there was a relatively small sample size. Second,
in the rat model experiments, BMD levels were not determined and
ultrastructure of the bone was not observed by micro-computed
tomography.
In conclusion, a decrease of BMC in paretic limbs
correlated significantly with a decrease of LM, but not with FM, in
patients following stroke. EMS mitigated disuse amyotrophy and bone
loss from SN, associated with downregulating myostatin expression
and increasing IGF-1 and MGF in muscle fiber, and enhancing bone
formation.
Acknowledgements
The present study was funded by the Ministry of
Civil Affairs China [grant no. (2007)18-1-09].
Glossary
Abbreviations
Abbreviations:
|
BMC
|
bone mineral content
|
|
LM
|
lean mass
|
|
FM
|
fat mass
|
|
EMS
|
electrical muscle stimulation
|
|
MGF
|
mechano growth factor
|
|
SN
|
sciatic neurectomy
|
|
SP
|
sham procedure
|
|
BC
|
blank control
|
|
TC
|
tetracycline
|
References
|
1
|
Pang MYC and Eng JJ: Muscle strength is a
determinant of bone mineral content in the hemiparetic upper
extremity: Implications for stroke rehabilitation. Bone.
37:103–111. 2005. View Article : Google Scholar : PubMed/NCBI
|
|
2
|
Iwamoto J, Takeda T and Ichimura S:
Relationships between physical activity and metacarpal cortical
bone mass and bone resorption in hemiplegic patients. J Orthop Sci.
6:227–233. 2001. View Article : Google Scholar : PubMed/NCBI
|
|
3
|
Sahin L, Ozoran K, Gündüz OH, Uçan H and
Yücel M: Bone mineral density in patients with stroke. Am J Phys
Med Rehabil. 80:592–596. 2001. View Article : Google Scholar : PubMed/NCBI
|
|
4
|
Nielsen S and Pedersen BK: Skeletal muscle
as an immunogenic organ. Curr Opin Pharmacol. 8:346–351. 2008.
View Article : Google Scholar : PubMed/NCBI
|
|
5
|
Engler D: Hypothesis: Musculin is a
hormone secreted by skeletal muscle, the body's largest endocrine
organ. Evidence for actions on the endocrine pancreas to restrain
the beta-cell mass and to inhibit insulin secretion and on the
hypothalamus to co-ordinate the neuroendocrine and appetite
responses to exercise. Acta Biomed. 78(Suppl 1): 156–206.
2007.PubMed/NCBI
|
|
6
|
Ma K, Mallidis C, Bhasin S, Mahabadi V,
Artaza J, et al: Glucocorticoid-induced skeletal muscle atrophy is
associated with upregulation of myostatin gene expression. Am J
Physiol Endocrinol Metab. 285:E363–E371. 2003. View Article : Google Scholar : PubMed/NCBI
|
|
7
|
Elkasrawy MN and Hamrick MW: Myostatin
(GDF-8) as a key factor linking muscle mass and bone structure. J
Musculoskelet Neuronal Interact. 10:56–63. 2010.PubMed/NCBI
|
|
8
|
Hamrick MW, Samaddar T, Pennington C and
McCormick J: Increased muscle mass with myostatin deficiency
improves gains in bone strength with exercise. J Bone Miner Res.
21:477–483. 2006. View Article : Google Scholar : PubMed/NCBI
|
|
9
|
West CA, Arnett TR and Farrow SM:
Expression of insulin-like growth factor I (IGF-I) mRNA variants in
rat bone. Bone. 19:41–46. 1996. View Article : Google Scholar : PubMed/NCBI
|
|
10
|
Wei CN, Ohira Y, Tanaka T, Yonemitsu H and
Ueda A: Does electrical stimulation of the sciatic nerve prevent
suspension-induced changes in rat hindlimb bones? Jpn J Physiol.
48:33–37. 1998. View Article : Google Scholar : PubMed/NCBI
|
|
11
|
Roth SM, Martel GF, Ferrell RE, Metter EJ,
Hurley BF and Rogers MA: Myostatin gene expression is reduced in
humans with heavy-resistance strength training: A brief
communication. Exp Biol Med (Maywood). 228:706–709. 2003.PubMed/NCBI
|
|
12
|
Hill M and Goldspink G: Expression and
splicing of the insulin-like growth factor gene in rodent muscle is
associated with muscle satellite (stem) cell activation following
local tissue damage. J Physiol. 549:409–418. 2003. View Article : Google Scholar : PubMed/NCBI
|
|
13
|
Riddoch-Contreras J, Yang SY, Dick JR,
Goldspink G, Orrell RW and Greensmith L: Mechano-growth factor, an
IGF-I splice variant, rescues motoneurons and improves muscle
function in SOD1(G93A) mice. Exp Neurol. 215:281–289. 2009.
View Article : Google Scholar : PubMed/NCBI
|
|
14
|
Hameed M, Orrell RW, Cobbold M, et al:
Expression of IGF-I splice variants in young and old human skeletal
muscle after high resistance exercise. J Physiol. 547:247–254.
2003. View Article : Google Scholar : PubMed/NCBI
|
|
15
|
Bamman MM, Shipp JR, Jiang J, Gower BA,
Hunter GR, Goodman A, et al: Mechanical load increases muscle IGF-I
and androgen receptor mRNA concentrations in humans. Am J Physiol
Endocrinol Metab. 280:E383–E390. 2001.PubMed/NCBI
|
|
16
|
Owino V, Yang SY and Goldspink G:
Age-related loss of skeletal muscle function and the inability to
express the autocrine form of insulin-like growth factor-1 (MGF) in
response to mechanical overload. FEBS Lett. 505:259–263. 2001.
View Article : Google Scholar : PubMed/NCBI
|