Introduction
Acarbose is an α-glucosidase inhibitor. It slows the
breakdown of carbohydrates in the gut, and delays absorption of
carbohydrates by inhibition of a-amylase and α-glucosidase
activities, which reduces post-prandial hyperglycemia (1,2). The
reduction of blood glucose concentration is accompanied by a
decreased insulin demand and increased insulin sensitivity in type
2 diabetes mellitus (T2DM) (3).
Recently, by using a continuous glucose monitoring system (CGMS),
further improvements in glucose fluctuation in T2DM patients
treated with pre-mixed insulin therapy were observed (4). Microvascular and macrovascular
complications are mainly (5,6) or partially (6,7) caused by
hyperglycemia. Monnier et al (8) reported that acute glucose fluctuations
during postprandial periods were crucial in oxidative stress. The
rapid rise in postprandial blood glucose concentrations induces an
overproduction of peroxynitrite and nitrotyrosine (8,9). As
demonstrated by clinical trials, acarbose has been reported to
improve postprandial endothelial dysfunction in newly diagnosed
T2DM patients (10), as well as
decreasing the lipid peroxidation and platelet activation in
patients with T2DM (11). Furthermore,
in patients with impaired glucose tolerance, acarbose was
associated with a 49% relative risk reduction in the development of
cardiovascular events (12).
A previous study demonstrated that exogenous
hyperinsulinemia increases the activation of NAD(P)H in the rat
aortic endothelium (13). However, at
normal concentrations of insulin, the effect of insulin on
activating oxidative stress is considered to be controversial
(14). As insulin therapy is used for
treating patients with T2DM worldwide, the administration of a
combination of acarbose and insulin therapy is proposed.
Therefore an open and unblended study was performed
to investigate the add-on effect of acarbose on oxidative stress,
and the lipid and inflammatory profiles in patients with T2DM
treated with insulin.
Materials and methods
Patients
One hundred and thirty four patients (male: female,
67:67) with newly diagnosed T2DM were admitted to Nanjing First
Hospital (Nanjing, China) between January, 2014 and May, 2015.
Patients were aged 18–75 years with body mass index (BMI;
calculated as weight in kilograms divided by the square of their
height in meters), 18–40 kg/m2 and hemoglobin
A1c (HbA1c) range, 9.0–12.0%. Patients were
excluded if they had acute or severe chronic diabetic
complications, serious systemic disease or poor medication
compliance. Patients with known cancers, known allergies to insulin
or acarbose, or deemed not suitable to participate following an
assessment by the researchers were excluded (15,16). The
patients received therapy via continuous subcutaneous insulin
infusion (CSII) for initial rapid correction of hyperglycaemia
(defined as fasting plasma glucose between 7.0 and 8.0 mmol/l).
Total daily doses for CSII were calculated as 0.4–0.6 IU/kg, and
50% of the total daily dose was administered as boluses with three
meals at a fixed rate; the remaining insulin was administered over
24 h. Insulin doses were subsequently adapted according to blood
glucose values that were obtained by self-monitoring. After rapid
correction of hyperglycaemia, a premixed insulin titration period
(duration, 4–6 days) subsequently followed. Patients were then
randomized (1:1) into two groups: The acarbose plus insulin
isophane protamine recombinant human insulin 30/70 (pre-mixed 30/70
insulin; twice-daily) group and a pre-mixed 30/70 insulin
(twice-daily) only group. The initial pre-mixed 30/70 insulin doses
were calculated according to the insulin dose used for the CSII,
and subsequently adapted according to fasting capillary blood
glucose and capillary blood glucose at 2 h after each of three
meals (15). Investigators titrated
the insulin doses on an individual patient basis with the titration
algorithm (if the fasting blood glucose level was <4.4 mmol/l,
the insulin dose was reduced by 2 units; if the fasting blood
glucose level was within 4.4–6.1 mmol/l, the insulin dose was
unchanged; if the fasting blood glucose level was within 6.2–7.8,
7.9–10.0, and >10.0 mmol/l, the insulin dose was subsequently
increased by 2, 4, and 6 units, respectively). Pre-mixed insulin
doses were unchanged and recorded if euglycemic control was
achieved for two consecutive days. Patients were subsequently
randomized to receive acarbose (100 mg, t.i.d; Glucobay; Bayer AG,
Leverkusen, Germany) plus pre-mixed 30/70 (twice-daily) or
pre-mixed insulin 30/70 (twice-daily) only. Treatment was
maintained for 2 weeks. CGMS data were obtained using Medtronic
MiniMed CGMS Gold (Medtronic Incorporated, Northridge, USA) for at
least 3 days on completion of 2 weeks randomized treatment
(17). All patients were subjected to
3 consecutive days of CGMS use in the hospital by a specialist
nurse. Briefly, the CGMS sensor was subcutaneously embedded at day
0 around 16:00–17:00 PM. The patients continued with the sensor for
3 consecutive days if use of the CGMS was going well. Subjects were
instructed to keep the sensor fixed and waterproof. The study nurse
input a minimum of four calibration readings per day. At day 3, at
around 16:00–17:00 PM, subjects had the sensor removed and the CGMS
data were saved by the investigator. The 24-h mean amplitude of
glycemic excursions (MAGE), the 24-h mean blood glucose (MBG), the
percentage time duration (%) and the incremental area under the
curve (AUC) of plasma glucose >10.0 and <3.9 mmol/l was
calculated, and hypoglycemia episodes were also recorded. MAGE was
calculated for each patient by measuring the arithmetic mean of the
ascending and descending excursions between consecutive peaks and
nadirs for the same 24 h period, only absolute excursion values
>1 standard deviation (SD) were considered (18).
Ethical approval
The current study was approved by the ethics
committee of Nanjing First Hospital (Nanjing, China), and was in
accordance with the 1964 Helsinki declaration and its later
amendments or comparable ethical standards. Written informed
consent was obtained from the patients prior to participation in
the present study.
Assays
The following plasma parameters were measured at
baseline and upon completion of the study: Fasting plasma glucose,
fasting plasma insulin, lipid profile, high-sensitivity C reactive
protein (Hs-CRP), 8-iso prostaglandin F2α (8-iso
PGF2α), tumor necrosis factor-α (TNF-α), interleukin
(IL)-1β, IL-6, adiponectin (APN) and leptin. Plasma glucose
concentrations were measured the day before and after therapy
withdrawal using an Accu-Chek® Active glucometer (Roche
Diagnostics GmbH, Mannheim, Germany). Fasting plasma insulin was
determined using an insulin radioimmunoassay kit according to the
manufacturer's instructions (Beijing Beifang Technology Co.,
Beijing, China). HbA1c was measured using a Diastat
HbA1c analyzer (Bio-Rad Laboratories, Inc., Hercules,
CA, USA) at baseline. Hs-CRP was determined using radioimmunoassay
kits provided by Beijing Onder High-Tech Co., Ltd. (Beijing, China)
according to the manufacturer's instructions. The plasma 8-iso
PGF2α level was measured using an enzyme immunoassay
method according to the manufacturer's instructions (Cayman
Chemical Co., Ann Arbor, MI, USA) (19). TNF-α was measured using the
human-specific Milliplex map kit (EMD Millipore, St. Charles, MO,
USA) according to the manufacturer's instructions. IL-1β was
determined using enzyme-linked immunosorbent assay (ELISA)
procedures (Orgenium Laboratories, Helsinki, Finland) and IL-6 was
determined using commercially available ELISA kits (R&D
Systems, Minneapolis, MN, USA) according to manufacturer's
instructions. APN and leptin were measured using enzyme immunoassay
kits (from R&D Systems, Inc., Minneapolis, MN, USA and Mercodia
AB, Uppsala, Sweden, respectively) according to the manufacturer's
instructions.
Statistical analysis
Statistical analysis was performed using SPSS
software (version 17.0; SPSS, Inc., Chicago, IL, USA). The
Shapiro-Wilk test was used to assess the distribution of data.
Normally distributed and continuous variables are presented as
means ± SD. Non-normally distributed variables are presented as
medians (interquartile range) and were logarithmically transformed
prior to analysis. The independent samples t-test was used
to compare each group difference and Bonferroni correction was
subsequently performed, with a significance level of 5%.
Results
Patient characteristics
The patients (n=134) were randomized into each of
the two treatment groups. Their demographic characteristics and
history of T2DM are presented in Table
I. The two groups were well matched in terms of age, gender and
BMI with no significant differences identified between the two
groups.
 | Table I.Baseline characteristics of the study
population (n=134). |
Table I.
Baseline characteristics of the study
population (n=134).
| Characteristic | Acarbose + | Acarbose − | P-value |
|---|
| Patients (n) | 68 | 66 | – |
| Gender
(male/female) | 35/33 | 32/34 | – |
| Age (years) | 65.75±4.35 | 66.33±7.66 | 0.926 |
| Body weight (kg) |
60.15±10.33 |
62.15±10.86 | 0.845 |
| Body mass index
(kg/m2) | 23.63±3.93 | 24.23±2.21 | 0.729 |
| HbA1c
(%) |
9.66±1.90 |
9.79±1.19 | 0.721 |
Glucose control
Table II compares the
24-h mean glucose levels, and the percentage of time of significant
hyperglycemia (glucose, >10 mmol/l) and significant hypoglycemia
(glucose, <3.9 mmol/l) between the two groups. The differences
between the acarbose plus insulin group and the monotherapy group
were not statistically significant between the 24-h MBG, 24-h MBG
SD, the hyperglycemic and hypoglycemic episodes, or the
hyperglycemic and hypoglycemic duration (Table II). However, patients in the acarbose
plus insulin group demonstrated significant decreases in the
incremental AUC >10 mmol/l [0.85 (0.23, 1.4) mmol/l per day] and
MAGE (7.50±3.28 mmol/l) compared with patients in the insulin only
group.
| Table II.Glucose fluctuation parameters in the
two groups upon completion of the follow-up period. |
Table II.
Glucose fluctuation parameters in the
two groups upon completion of the follow-up period.
| Parameter | Acarbose + | Acarbose − | P-value |
|---|
| Insulin dose/day
(IU) |
36.43±17.16 |
37.5±12.40 | 0.891 |
| 24-h MBG
(mmol/l) |
8.2±1.39 |
8.4±1.64 | 0.711 |
| 24-h MBG SD
(mmol/l) |
2.34±0.67 |
2.68±1.26 | 0.384 |
| Hyperglycemic
episodes, (n=16) |
3.11±1.69 |
3.36±2.17 | 0.739 |
| Hypoglycemic
episodes, (n=8) |
2.09±1.68 |
2.38±1.81 | 0.892 |
| Hyperglycemic
duration (%) |
28.24±25.19 |
28.44±19.36 | 0.963 |
| Hypoglycemic
duration (%) |
5.01±8.19 |
7.26±12.37 | 0.629 |
BMI, blood glucose and insulin
change
The BMI of patients from the two groups was
calculated at the end of therapy. BMI was almost unchanged in the
two groups, with no significant difference identified between
groups (P>0.05). Fasting blood glucose significantly improved in
each group after the 2-week treatment [acarbose plus insulin group:
8.21±2.13 to 6.98±1.53 mmol/l (P<0.05); insulin only group:
8.30±2.32 to 7.16±3.28 mmol/l (P<0.05)]. No significant
difference in fasting blood glucose levels was identified between
the two groups (P>0.05). Fasting insulin was assessed 2 days
after completion of treatment. It was almost unchanged (8.14±3.09
to 8.87±4.11 µU/ml; P>0.05) in the acarbose plus insulin group,
whereas it slightly decreased from 7.78±2.17 to 6.71±3.34 µU/ml
(P>0.05) in the insulin only group. No statistical difference of
fasting insulin concentration was identified between the two groups
(P>0.05).
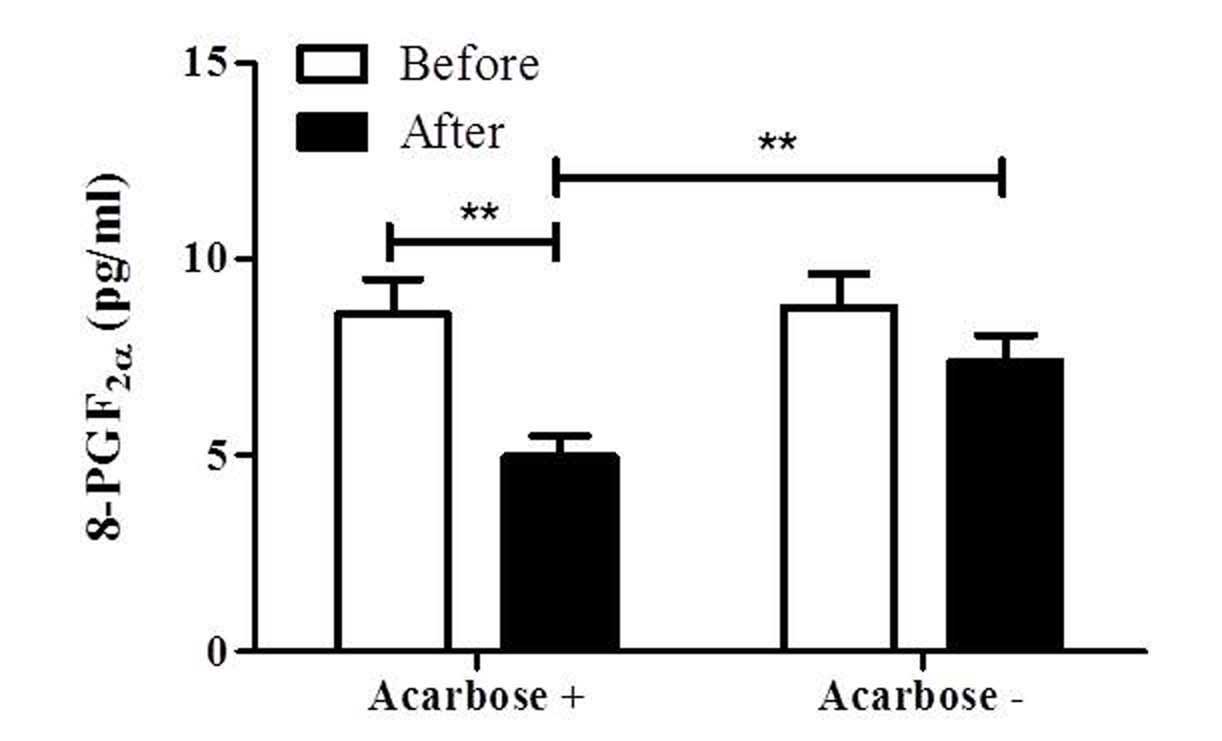
Oxidative stress
To determine the effect of co-administration of
acarbose with insulin on oxidative stress in patients with T2DM,
8-PGF2α, a well-recognized biomarker of oxidative
stress, was measured. As shown in Fig.
1, 8-PGF2α was significantly decreased in the
acarbose plus insulin group from 8.55±3.62 to 4.97±2.16 pg/ml
(P<0.01). Although it exhibited a decreasing tendency in the
insulin group (8.79±3.58 to 6.65±2.45 pg/ml), no statistically
significant difference was observed. Furthermore, the
8-PGF2α level of the acarbose plus insulin group was
significantly lower than that of the insulin group at 2 weeks
(P<0.01; Fig. 1).
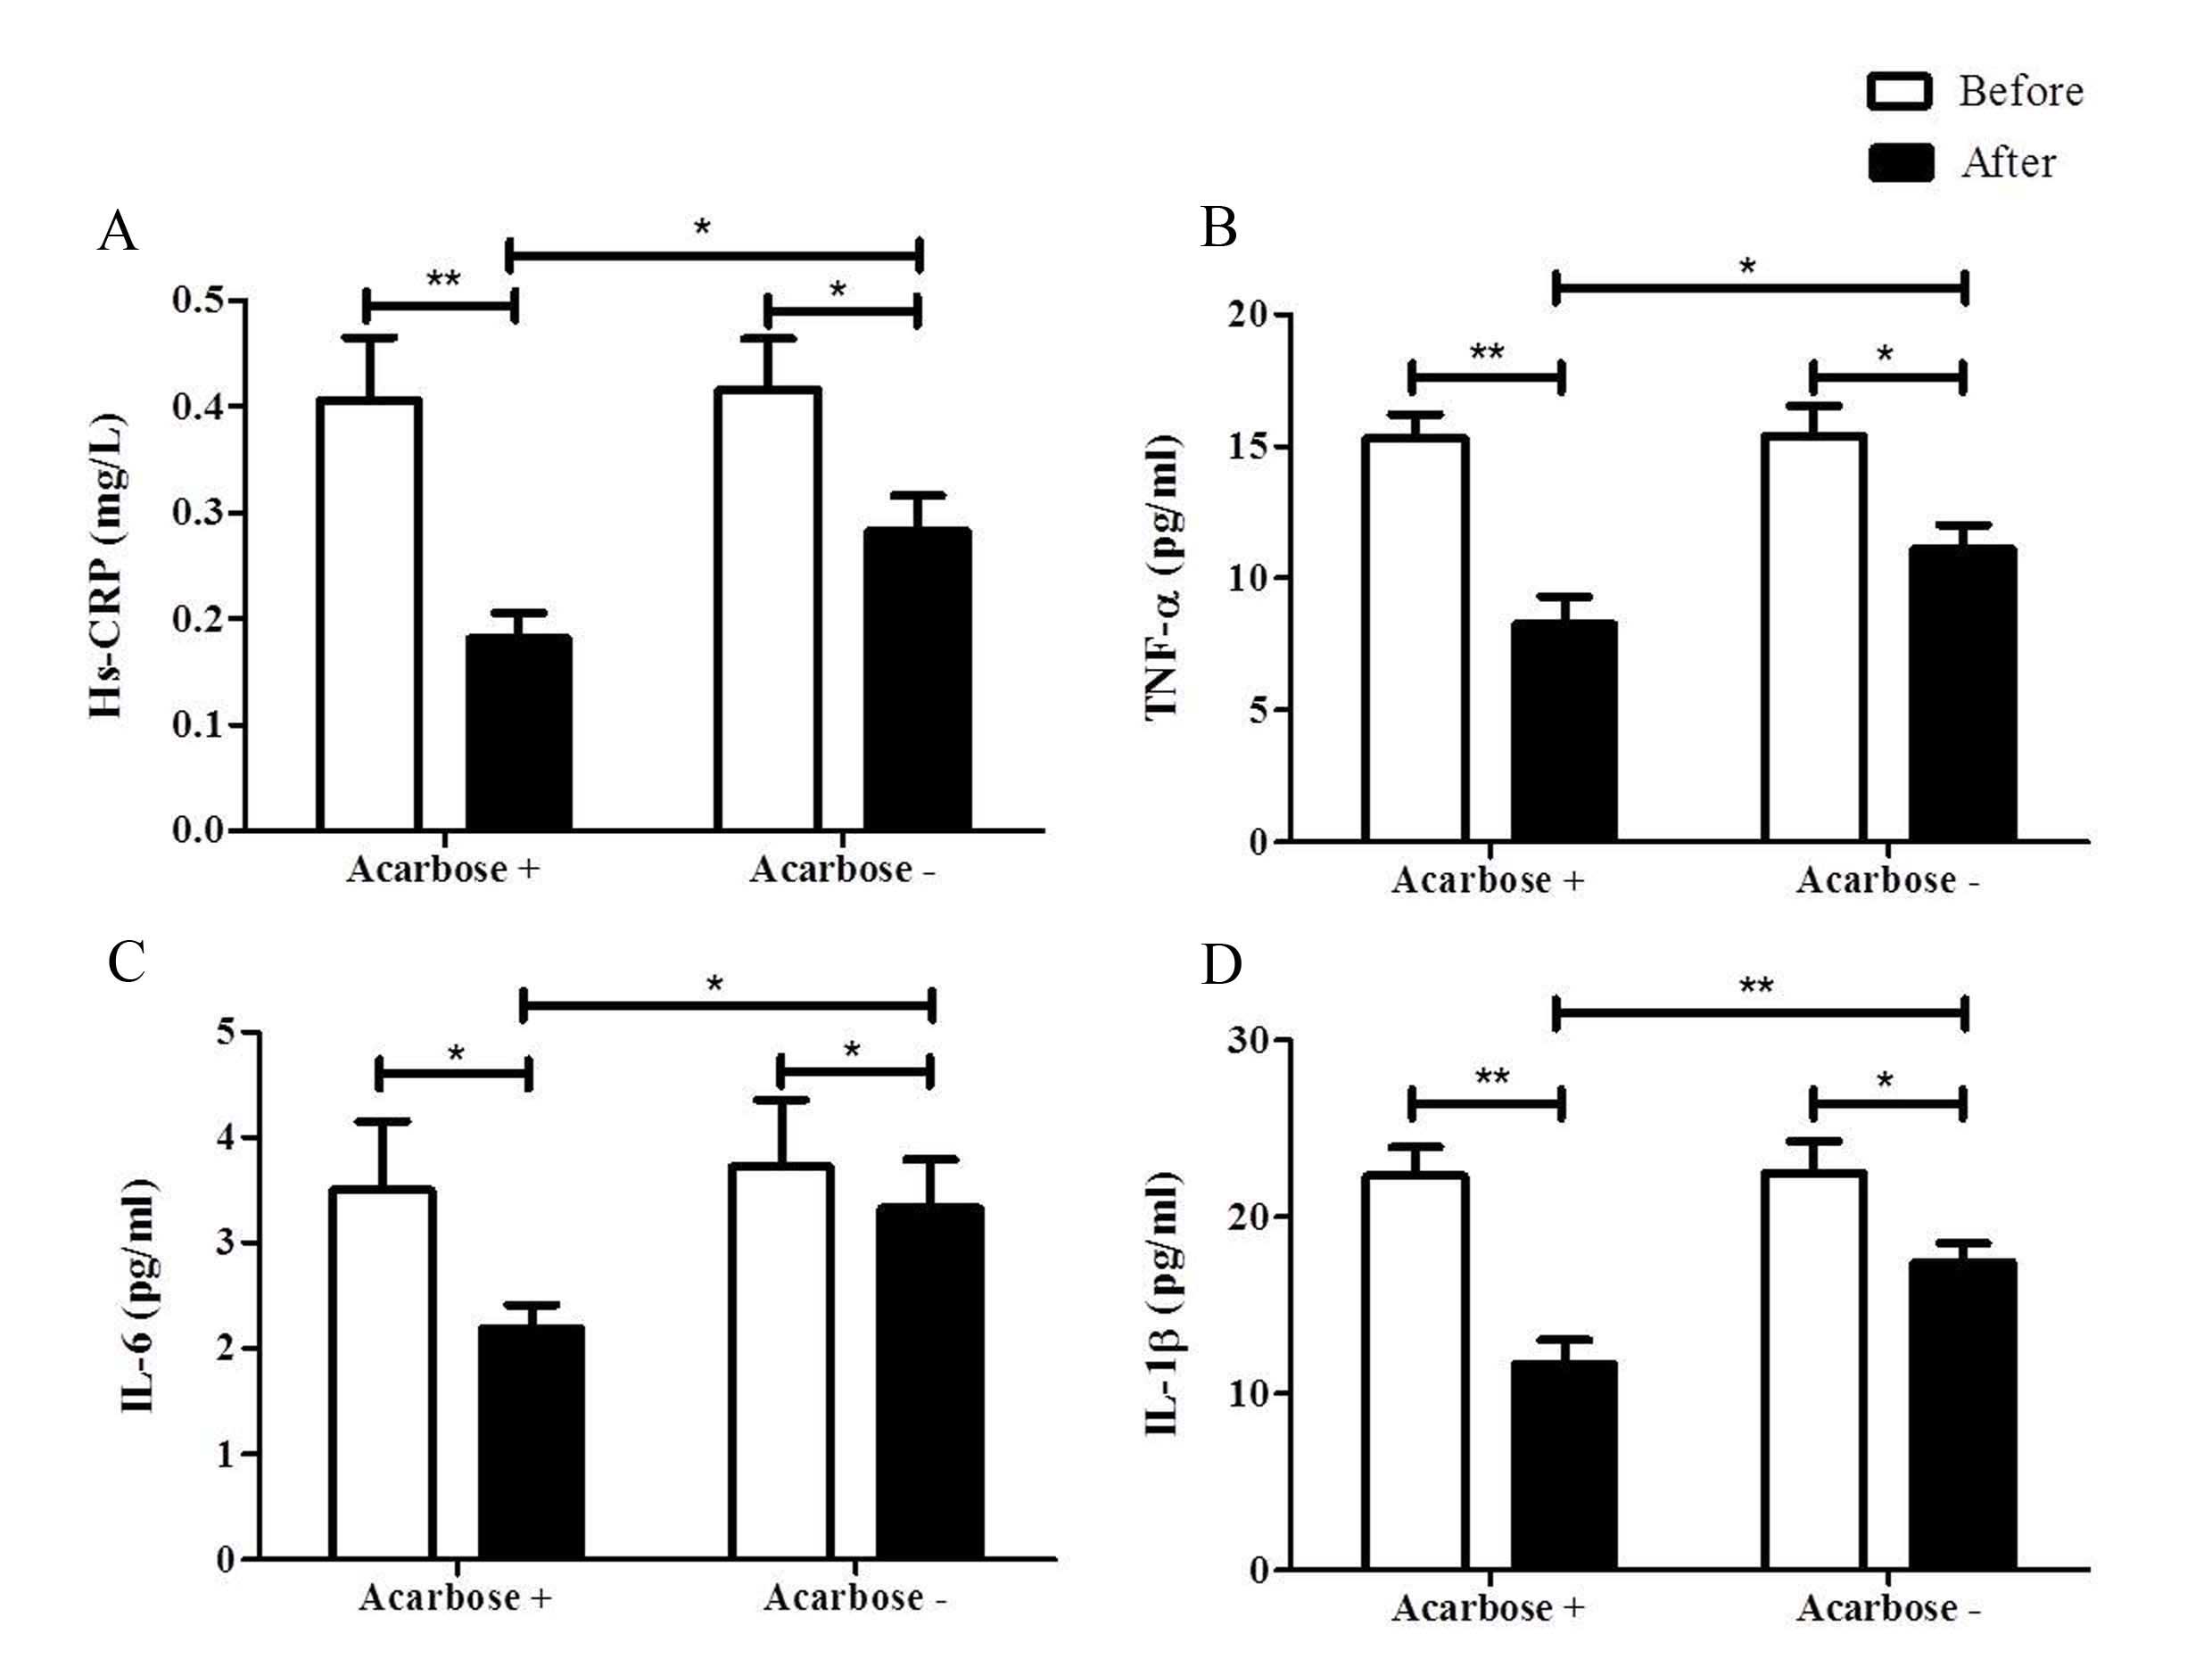
Inflammatory cytokines
Patients with T2DM have a significantly higher
inflammatory score when compared with control subjects (20). Although significant decreases of
inflammatory cytokines were found in the two groups, the addition
of acarbose resulted in further reductions of inflammatory cytokine
levels, when compared with the insulin only group at 2 weeks. The
Hs-CRP level of the acarbose plus insulin group decreased from
0.41±0.24 to 0.18±0.10 mg/l (P<0.05). This was also observed in
the insulin only group (0.42±0.20 to 0.28±0.14 mg/l; P<0.05).
Notably, the Hs-CRP level of the acarbose plus insulin group was
significantly lower than that of the insulin only group at 2 weeks
(P<0.05; Fig. 2A).
The TNF-α level was significantly reduced in the two
groups at 2 weeks after treatment. It significantly reduced from
14.59±4.56 to 8.13±4.56 pg/ml (P<0.01) in the acarbose plus
insulin group, and it also significantly decreased from 13.84±5.25
to 10.63±4.31 pg/ml (P<0.05) in the insulin only group (Fig. 2B). However, the addition of acarbose
further reduced TNF-α levels as compared with the insulin group at
2 weeks (P<0.05; Fig. 2B).
IL-6 significantly decreased in the two groups
[3.50±2.61 to 2.19±0.91 pg/ml in the acarbose plus insulin group
(P<0.05) and from 3.72±2.70 to 3.33±1.94 pg/ml in the insulin
only group (P<0.05); Fig. 2C and
D]. A lower level of IL-6 was observed in the acarbose plus
insulin group when compared with the insulin only group (P<0.05)
at 2 weeks (Fig. 2C).
IL-1β significantly decreased in the two groups
[22.31±6.48 to 11.66±5.35 pg/ml in the acarbose plus insulin group
(P<0.01) and from 22.49±7.61 to 17.43±4.58 pg/ml in the insulin
only group (P<0.05)] in 2 weeks. However, IL-1β in the acarbose
plus insulin group was significantly lower than that of the insulin
only group at 2 weeks (P<0.01; Fig.
2D).
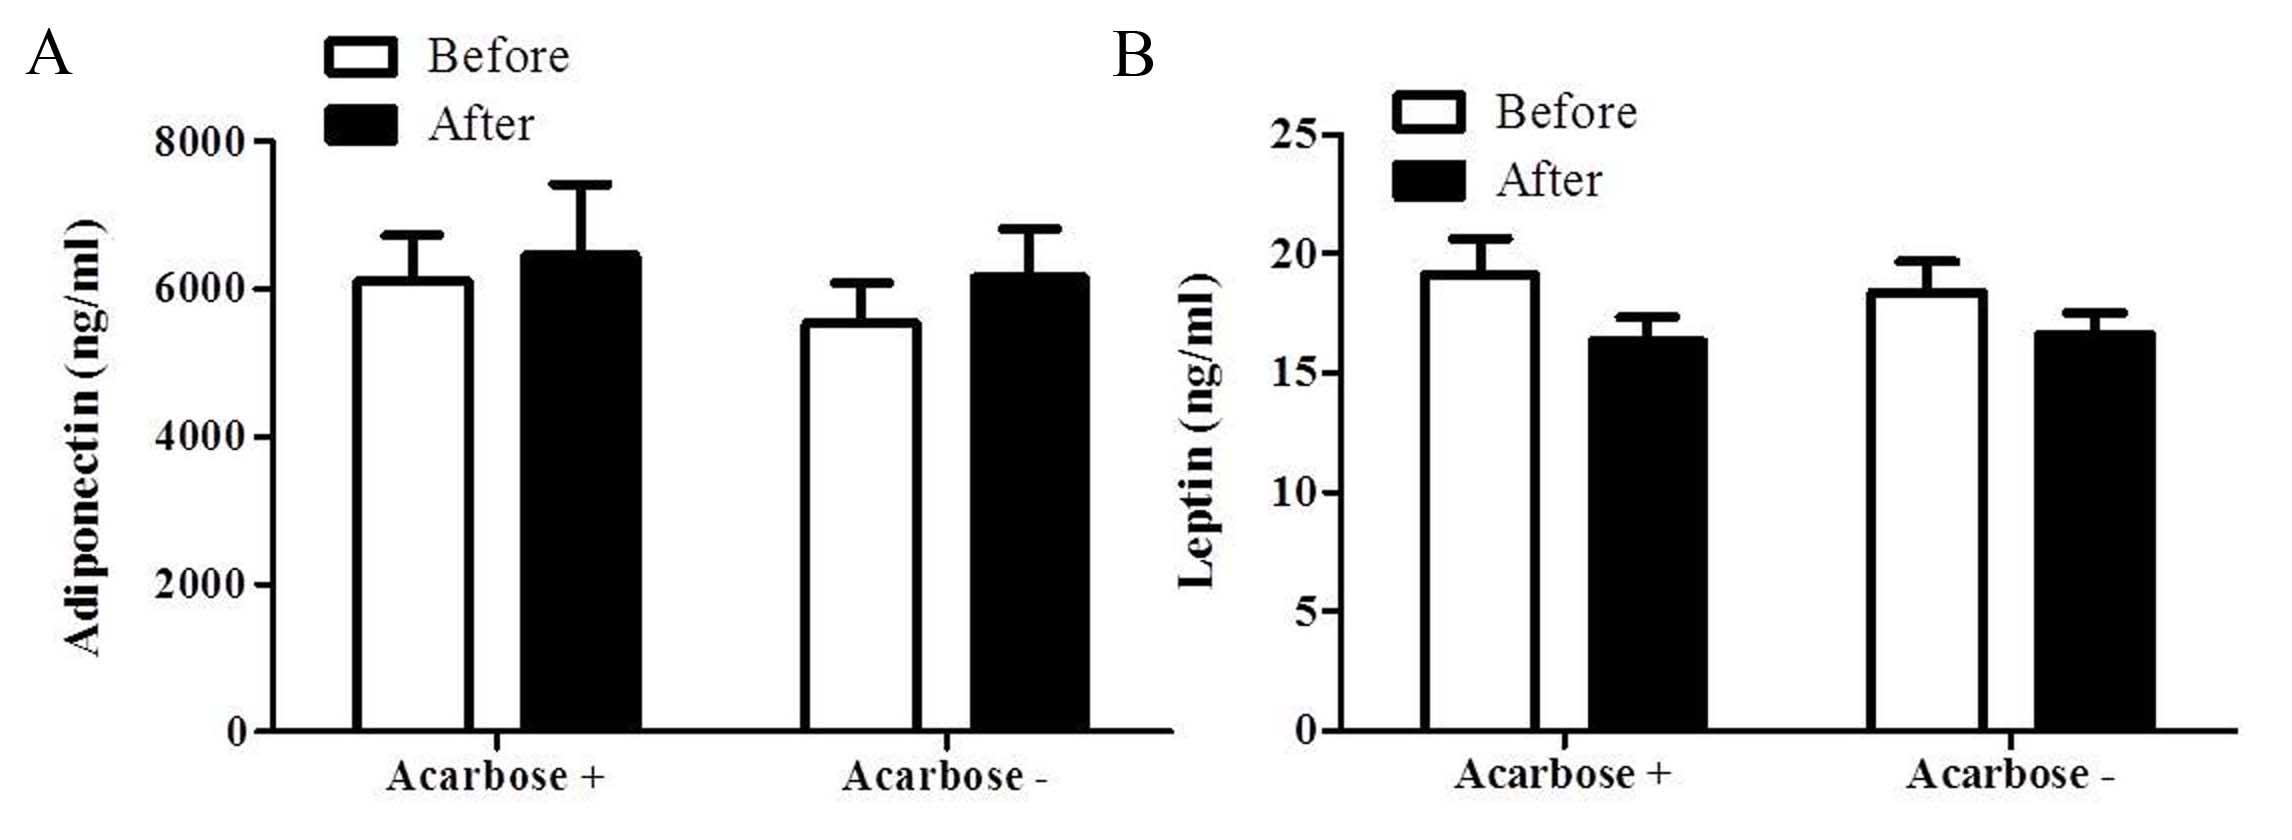
Adipocytokines
The APN level marginally increased from
5,539.06±2312.45 to 6,156.94±2797.11 ng/ml (P>0.05) in the
insulin only group following 2 weeks of treatment (Fig. 3A). Similarly, the APN level increased
from 6,110.31±2485.21 to 6,458.88±3851.47 ng/ml (P>0.05) in the
acarbose plus insulin group. However, no significant difference in
the APN level was identified between the two groups at 2 weeks
(P>0.05; Fig. 3A). The leptin level
in the acarbose plus insulin group marginally reduced from
19.11±6.15 to 15.69±4.11 ng/ml (P>0.05). Similarly, the leptin
level in the insulin only group decreased from 18.38±5.43 to
16.61±3.87 ng/ml following 2 weeks of treatment (P>0.05). No
significant difference in the level of leptin was observed between
the two groups at 2 weeks (P>0.05; Fig.
3B).
Safety
Adverse events, consisting of digestive disorders,
were reported by nine of the patients in the acarbose plus insulin
group and by three of the insulin only group patients.
Discussion
In the current study, the efficacy of acarbose on
oxidative stress, and lipid and inflammatory profiles in patients
with T2DM receiving insulin therapy was evaluated. The addition of
acarbose with insulin therapy was observed to more effectively
improve oxidative stress and the inflammatory profiles of patients
with T2DM when compared with patients receiving insulin therapy
alone.
Acute glucose fluctuations, other than chronic
hyperglycemia, during postprandial periods more significantly
affect oxidative stress in patients with T2DM (8). The rapid rise in postprandial blood
glucose concentration induces an over production of peroxynitrite
and nitrotyrosine (8,9,21). Thus,
there are continued efforts aimed at suppressing postprandial
hyperglycemia in patients with T2DM (22). Previous studies indicated that improved
postprandial glycemic excursions smooth oxidative and nitrosative
stress (23). Chiasson et al
(24) reported that acarbose was able
to normalize the PPG concentration in patients with impaired
glucose tolerance (IGT). Furthermore, clinical trials have shown
that acarbose treatment prevents cardiovascular complications in
patients with T2DM and in those with IGT (12,25). Studies
have also demonstrated that postprandial hyperglycemia
concentration results in an increase of oxidative stress in
patients with T2DM (26), which is
associated with endothelial dysfunction (27). Kato et al (10) suggested that acarbose enhances
postprandial endothelial function by improvement of postprandial
hyperglycemia. Notably, postprandial hyperglycemia as a risk factor
for cardiovascular disease was evaluated by the STOP-NIDDM
(12) Trial and the data indicated
that acarbose treatment was associated with a 49% relative risk
reduction in the development of cardiovascular events. The current
study presents evidence that the improved glucose fluctuation
resulting from acarbose plus insulin therapy leads to a reduction
of oxidative stress in patients with T2DM.
There is also evidence that hyperglycemia
contributes to the inflammation experienced by patients with T2DM.
It has been demonstrated that repeated fluctuations of glucose
produce increased circulating levels of inflammatory cytokines when
compared with stable, high glucose levels in normal subjects
(28). Daniele et al (20) demonstrated that the inflammatory score,
an integrated quantity of TNF-α, IL-6, monocyte chemoattractant
protein-1, fractalkine, osteopontin and APN, is increased in
patients with T2DM and correlates with hyperglycemia (20). The link between hyperglycemia,
increased oxidative stress and the higher level of inflammatory
cytokines was first demonstrated by Esposito et al (28) who suggested that hyperglycemia
increases the levels of inflammatory cytokines via an oxidative
mechanism (28). Notably, in the
present study, the levels of serum inflammatory markers (Hs-CRP,
IL-1β, IL-6 and TNF-α) were significantly decreased in patients
with T2DM who were treated with acarbose plus insulin therapy when
compared with those that received only insulin therapy, along with
decreased oxidative stress levels. This may suggest that acarbose
attenuates the oxidation that is caused by hyperglycemia or/and
hyperinsulinemia. It was found that the level of APN, an
anti-inflammatory cytokine (29), was
not significantly increased in the current study.
In conclusion, the addition of acarbose to insulin
therapy was associated with a reduction in oxidative stress and
inflammation in patients with T2DM. However, future studies are
required to clarify the underlying mechanisms.
Acknowledgements
The present study was funded by Nanjing Public
Health Bureau Project (grant no. YKK11110), Nanjing Science and
Technology Commission Project (grant no. 201201108) and Jiangsu
Provincial Department of Science and Technology Project (grant no.
BL2014010).
References
|
1
|
Bischoff H: The mechanism of
alpha-glucosidase inhibition in the management of diabetes. Clin
Invest Med. 18:303–311. 1995.PubMed/NCBI
|
|
2
|
Krentz AJ and Bailey CJ: Oral antidiabetic
agents: Current role in type 2 diabetes mellitus. Drugs.
65:385–411. 2005. View Article : Google Scholar : PubMed/NCBI
|
|
3
|
Meneilly GS, Ryan EA, Radziuk J, Lau DC,
Yale JF, Morais J, Chiasson JL, Rabasa-Lhoret R, Maheux P, Tessier
D, et al: Effect of acarbose on insulin sensitivity in elderly
patients with diabetes. Diabetes care. 23:1162–1167. 2000.
View Article : Google Scholar : PubMed/NCBI
|
|
4
|
Li FF, Xu XH, Fu LY, Su XF, Wu JD, Lu CF,
Ye L and Ma JH: Influence of acarbose on plasma glucose
fluctuations in insulin-treated patients with type 2 diabetes: A
pilot study. Int J Endocrinol. 2015:9035242015. View Article : Google Scholar : PubMed/NCBI
|
|
5
|
The relationship of glycemic exposure
(HbA1c) to the risk of development and progression of retinopathy
in the diabetes control and complications trial. Diabetes.
44:968–983. 1995. View Article : Google Scholar : PubMed/NCBI
|
|
6
|
Klein R: Hyperglycemia and microvascular
and macrovascular disease in diabetes. Diabetes Care. 18:258–268.
1995. View Article : Google Scholar : PubMed/NCBI
|
|
7
|
Stratton IM, Adler AI, Neil HA, Matthews
DR, Manley SE, Cull CA, Hadden D, Turner RC and Holman RR:
Association of glycaemia with macrovascular and microvascular
complications of type 2 diabetes (UKPDS 35): Prospective
observational study. BMJ. 321:405–412. 2000. View Article : Google Scholar : PubMed/NCBI
|
|
8
|
Monnier L, Mas E, Ginet C, Michel F,
Villon L, Cristol JP and Colette C: Activation of oxidative stress
by acute glucose fluctuations compared with sustained chronic
hyperglycemia in patients with type 2 diabetes. JAMA.
295:1681–1637. 2006. View Article : Google Scholar : PubMed/NCBI
|
|
9
|
Hu Y, Liu W, Huang R and Zhang X:
Postchallenge plasma glucose excursions, carotid intima-media
thickness and risk factors for atherosclerosis in Chinese
population with type 2 diabetes. Atherosclerosis. 210:302–306.
2010. View Article : Google Scholar : PubMed/NCBI
|
|
10
|
Kato T, Inoue T and Node K: Postprandial
endothelial dysfunction in subjects with new-onset type 2 diabetes:
An acarbose and nateglinide comparative study. Cardiovasc Diabetol.
9:122010. View Article : Google Scholar : PubMed/NCBI
|
|
11
|
Santilli F, Formoso G, Sbraccia P, Averna
M, Miccoli R, Di Fulvio P, Ganci A, Pulizzi N, Lattanzio S,
Ciabattoni G, et al: Postprandial hyperglycemia is a determinant of
platelet activation in early type 2 diabetes mellitus. J Thromb
Haemost. 8:828–837. 2010.PubMed/NCBI
|
|
12
|
Chiasson JL, Josse RG, Gomis R, Hanefeld
M, Karasik A and Laakso M: STOP-NIDDM Trial Research Group:
Acarbose treatment and the risk of cardiovascular disease and
hypertension in patients with impaired glucose tolerance: The
STOP-NIDDM trial. JAMA. 290:486–494. 2003. View Article : Google Scholar : PubMed/NCBI
|
|
13
|
Kashiwagi A, Shinozaki K, Nishio Y,
Maegawa H, Maeno Y, Kanazawa A, Kojima H, Haneda M, Hidaka H,
Yasuda H and Kikkawa R: Endothelium-specific activation of NAD(P)H
oxidase in aortas of exogenously hyperinsulinemic rats. Am J
Physiol. 277:E976–E983. 1999.PubMed/NCBI
|
|
14
|
Monnier L, Colette C, Mas E, Michel F,
Cristol JP, Boegner C and Owens DR: Regulation of oxidative stress
by glycaemic control: Evidence for an independent inhibitory effect
of insulin therapy. Diabetologia. 53:562–571. 2010. View Article : Google Scholar : PubMed/NCBI
|
|
15
|
Schnell O, Mertes G and Standl E:
Acarbose-Insulin Combination Study Group: Acarbose and metabolic
control in patients with type 2 diabetes with newly initiated
insulin therapy. Diabetes Obes Metab. 9:853–858. 2007. View Article : Google Scholar : PubMed/NCBI
|
|
16
|
Weng J, Li Y, Xu W, Shi L, Zhang Q, Zhu D,
Hu Y, Zhou Z, Yan X, Tian H, et al: Effect of intensive insulin
therapy on beta-cell function and glycaemic control in patients
with newly diagnosed type 2 diabetes: A multicentre randomised
parallel-group trial. Lancet. 371:1753–1760. 2008. View Article : Google Scholar : PubMed/NCBI
|
|
17
|
Service FJ, Molnar GD, Rosevear JW,
Ackerman E, Gatewood LC and Taylor WF: Mean amplitude of glycemic
excursions, a measure of diabetic instability. Diabetes.
19:644–655. 1970. View Article : Google Scholar : PubMed/NCBI
|
|
18
|
Ziegler R, Tubili C, Chico A, Guerci B,
Lundberg E, Borchert M, Löffler A, Bloethner S, Weissmann J and
Pfützner A: ProAct study: New features of insulin pumps improve
diabetes management and glycemic control in patients after
transition of continuous subcutaneous insulin infusion systems.
Diabetes Technol Ther. 15:738–743. 2013. View Article : Google Scholar : PubMed/NCBI
|
|
19
|
Wu JD, Xu XH, Zhu J, Ding B, Du TX, Gao G,
Mao XM, Ye L, Lee KO and Ma JH: Effect of exenatide on inflammatory
and oxidative stress markers in patients with type 2 diabetes
mellitus. Diabetes Technol Ther. 13:143–148. 2011. View Article : Google Scholar : PubMed/NCBI
|
|
20
|
Daniele G, Mendoza R Guardado, Winnier D,
Fiorentino TV, Pengou Z, Cornell J, Andreozzi F, Jenkinson C,
Cersosimo E, Federici M, et al: The inflammatory status score
including IL-6, TNF-α, osteopontin, fractalkine, MCP-1 and
adiponectin underlies whole-body insulin resistance and
hyperglycemia in type 2 diabetes mellitus. Acta Diabetol.
51:123–131. 2014. View Article : Google Scholar : PubMed/NCBI
|
|
21
|
Ceriello A, Esposito K, Piconi L, Ihnat
MA, Thorpe JE, Testa R, Boemi M and Giugliano D: Oscillating
glucose is more deleterious to endothelial function and oxidative
stress than mean glucose in normal and type 2 diabetic patients.
Diabetes. 57:1349–1354. 2008. View Article : Google Scholar : PubMed/NCBI
|
|
22
|
Gallwitz B: Implications of postprandial
glucose and weight control in people with type 2 diabetes:
Understanding and implementing the international diabetes
federation guidelines. Diabetes Care. 2:(32 Suppl). S322–S513.
2009. View Article : Google Scholar
|
|
23
|
Ceriello A, Quagliaro L, Catone B, Pascon
R, Piazzola M, Bais B, Marra G, Tonutti L, Taboga C and Motz E:
Role of hyperglycemia in nitrotyrosine postprandial generation.
Diabetes Care. 25:1439–1443. 2002. View Article : Google Scholar : PubMed/NCBI
|
|
24
|
Chiasson JL, Josse RG, Leiter LA, Mihic M,
Nathan DM, Palmason C, Cohen RM and Wolever TM: The effect of
acarbose on insulin sensitivity in subjects with impaired glucose
tolerance. Diabetes Care. 19:1190–1203. 1996. View Article : Google Scholar : PubMed/NCBI
|
|
25
|
Hanefeld M, Cagatay M, Petrowitsch T,
Neuser D, Petzinna D and Rupp M: Acarbose reduces the risk for
myocardial infarction in type 2 diabetic patients: Meta-analysis of
seven long-term studies. Eur Heart J. 25:10–16. 2004. View Article : Google Scholar : PubMed/NCBI
|
|
26
|
Ceriello A, Bortolotti N, Falleti E,
Taboga C, Tonutti L, Crescentini A, Motz E, Lizzio S, Russo A and
Bartoli E: Total radical-trapping antioxidant parameter in NIDDM
patients. Diabetes Care. 20:194–197. 1997. View Article : Google Scholar : PubMed/NCBI
|
|
27
|
El Midaoui A, Wu R and de Champlain J:
Prevention of hypertension, hyperglycemia and vascular oxidative
stress by aspirin treatment in chronically glucose-fed rats. J
Hypertens. 20:1407–1412. 2002. View Article : Google Scholar : PubMed/NCBI
|
|
28
|
Esposito K, Nappo F, Marfella R, Giugliano
G, Giugliano F, Ciotola M, Quagliaro L, Ceriello A and Giugliano D:
Inflammatory cytokine concentrations are acutely increased by
hyperglycemia in humans: Role of oxidative stress. Circulation.
106:2067–2072. 2002. View Article : Google Scholar : PubMed/NCBI
|
|
29
|
Tilg H and Moschen AR: Role of adiponectin
and PBEF/visfatin as regulators of inflammation: Involvement in
obesity-associated diseases. Clin Sci (Lond). 114:275–288. 2008.
View Article : Google Scholar : PubMed/NCBI
|