Introduction
Down syndrome is considered to be the most common
disease among prenatal chromosome abnormalities (1). Prenatal serological screening is an
effective method for decreasing the birth of prevalence of children
with Down syndrome, and adequate quality control of the screening
is important to maintain its efficiency (2). Prenatal screening for Down syndrome
involves coordination of multiple clinical sectors, and its
efficiency depends on a variety of factors, including clinical data
collection, serum and treatment, detection method and risk
calculation. Due to numerous and uncertain factors, it is difficult
to monitor the complete process of prenatal screening for Down
syndrome (3–5).
Second-trimester biochemical screening methods
include the detection of dual serological indicators, namely
α-fetoprotein (AFP) combined with total human chorionic
gonadotropin (HCG) or free β-HCG (6,7), a triple
test for AFP, unconjugated estriol (uE3) and HCG (8), and a quadruple test for AFP, HCG (total
or free β-), uE3 and inhibin-A (9).
The median multiple of the median (mMoM) value for different
markers is considered to be a standard metric as it responds to the
quality of data effectively. The detection rate (DR) and false
positive rate (FPR) are also considered to be effective evaluation
indices of screening efficiency, though they may be affected by the
bias in MoM values of distinct markers (8). Nix et al (10) identified that if there was a bias of
10% in MoM value for individual markers, there would be a 4-fold
increase in risk of Down syndrome determined via the triple test.
For instance, if a risk was 1/1,000 and all three markers had a 10%
bias in MoM values towards Down syndrome, the risk would be 1/361.
The risk threshold changed from 1/250 to 1/692.5, meanwhile FPR and
DR increased simultaneously. If the risk threshold was 1/250, FPR
and DR were 5.8 and 75.6%, respectively. Considering a risk
threshold of 1/692.5, FPR would be 13.5% and DR would be 86.9%,
thus increasing FPR by 7.7% and DR by 11.3%. These data indicated
that even a 5% bias in a single marker would lead to up to a 2%
change in FPR (10). Increased FPR is
a source of mental stress for pregnant women, as well as being
wasteful in terms of medical resources and cost. Therefore, it is
important to observe FPR and mMoM values regularly to maintain
effective screening quality. The present study aimed to evaluate
the practical bias phenomenon in mMoM values at the Nanjing
Maternity and Child Health Care Hospital (Nanjing, China), and to
determine strategies of reducing the bias in order to improve
screening and provide improved quality control management.
Materials and methods
Population selection
A total of 109,952 female subjects (mean age,
28.20±3.32) with singleton pregnancies, who accepted the second
trimester screening for Down syndrome at 15+0 and
20+6 weeks at the Nanjing Maternity and Child Health
Care Hospital from January 2014 to December 2016, were included in
the current study. Ethical approval following review of the study
protocols was obtained from the Medical Ethics Committee of Nanjing
Maternity and Child Health Care Hospital, and written informed
consent was obtained from all participants following full
disclosure of the study procedures.
Instruments and reagents
AFP and free β-HCG in serum were detected with a
1235 automatic fluorescence immunoassay analyzer (PerkinElmer,
Inc., Waltham, MA, USA) using a Wallac Auto DELFIA®
hAFP/Free hCGβ Dual kit (PerkinElmer, Inc.). Control serum (batch
nos. 20140301, 20150401 and 20151101) with high, medium and low
concentrations (Zhejiang Biosan Biochemical Technologies Co., Ltd.,
Zhejiang, China) was assayed under the same condition to verify the
reliability of the experiment. The ranges of low, medium and high
for each batch were obtained from a sufficient number of tests
following on from the previous quality control batch.
mMoM monitoring of serum biomarkers
AFP and free β-HCG
mMoM value fluctuating between 0.95 and 1.05 was
considered to be acceptable, and values beyond this range indicated
that certain factors may be influencing the bias of screening and
influence DR and FPR (11).
Adjustment of gestational age and
weight median equations
In general, FPR of ~5% with slight fluctuation was
considered normal (12); if FPR was
markedly higher or lower the screening was deemed unsatisfactory.
An increase in FPR may ultimately cause an increase in the number
of invasive prenatal examinations, in the psychological burden to
pregnant women and in pressure to medical capacity. From May 2015
to August 2015, it was identified that the FPR was high (>6%).
Subsequently, mMoM values obtained each month between January 2014
and August 2015 for individual markers were retrospectively
analyzed. Following the identification of continuous bias in mMoM
values of AFP and free β-HCG towards Down syndrome, their mMoM
values were observed between different gestational ages and weight
groups, as listed in Table I.
Initially, only gestational age and weight median equations for AFP
were adjusted, as well as the weight median equation for free β-HCG
based on the study cohort data from January 2014 to August 2015.
Medians embedded in LifeCycle software version 4.0 (PerkinElmer,
Inc.) were replaced by medians calculated according to the local
data from January 2014 to August 2015. However, it was identified
that mMoM values of free β-HCG in the next months (September 2015
to March 2016) had increased bias compared with the values from the
preceding months. Thus, both gestational and weight median
equations for free β-HCG were adjusted using the study cohort data
from January 2014 to December 2015. The medians embedded in the
LifeCycle software were then replaced by the medians calculated
over this time period. The data from January 2014 to December 2016
was retrospectively analyzed applying the adjusted median
equations. Whether the adjustment was appropriate was verified by
comparing FPR, mMoM values of AFP and free β-HCG markers, and mMoM
values of AFP and free β-HCG under different gestational ages and
different weight groups prior to and following the adjustments of
the median equations.
 | Table I.Numbers of patients in different
gestational age and weight groups. |
Table I.
Numbers of patients in different
gestational age and weight groups.
| Gestational age
(weeks) | n | Weight (kg) | n |
|---|
|
15+0-15+6 |
4,707 | 40–50 |
9,805 |
|
16+0-16+6 | 20,067 | 51–55 | 16,582 |
|
17+0-17+6 | 26,177 | 56–60 | 14,946 |
|
18+0-18+6 |
9,314 | 61–65 |
9,590 |
|
19+0-19+6 |
3,128 | 66–70 |
7,822 |
|
20+0-20+6 |
1,013 | 71–75 |
2,427 |
|
|
| 76–80 |
2,031 |
|
|
| 81–85 | 516 |
|
|
| 85–90 | 441 |
|
|
| >90 | 246 |
Cumulative sum control (CUSUM) chart
analysis
A CUSUM chart accumulates and magnifies the bias
occurring during a detection process. When the mean value of the
measured results coincides with the expected value, the cumulative
trend is parallel to the time axis. When the deviation of the mean
value from the expected value is positive, the cumulative trend
inclines upwards and vice versa. The larger the difference between
the measured result and the expected value, the greater the
accumulation and the steeper the inclination of the graph. By
observing the change in the slope of the curve, the change and the
starting point of the change can be identified (13,14). The
current study analyzed whether the change was consistent with mMoM
values of AFP and free β-HCG, and its function in quality control
was evaluated.
Statistical analysis
SPSS 17.0 software (SPSS, Inc., Chicago, IL, USA)
was used for statistical analysis. Independent samples t-tests were
used for analysis of data significance, Data was presented as the
mean ± two standard deviations and P<0.05 was considered to
indicate a statistically significant difference.
Results
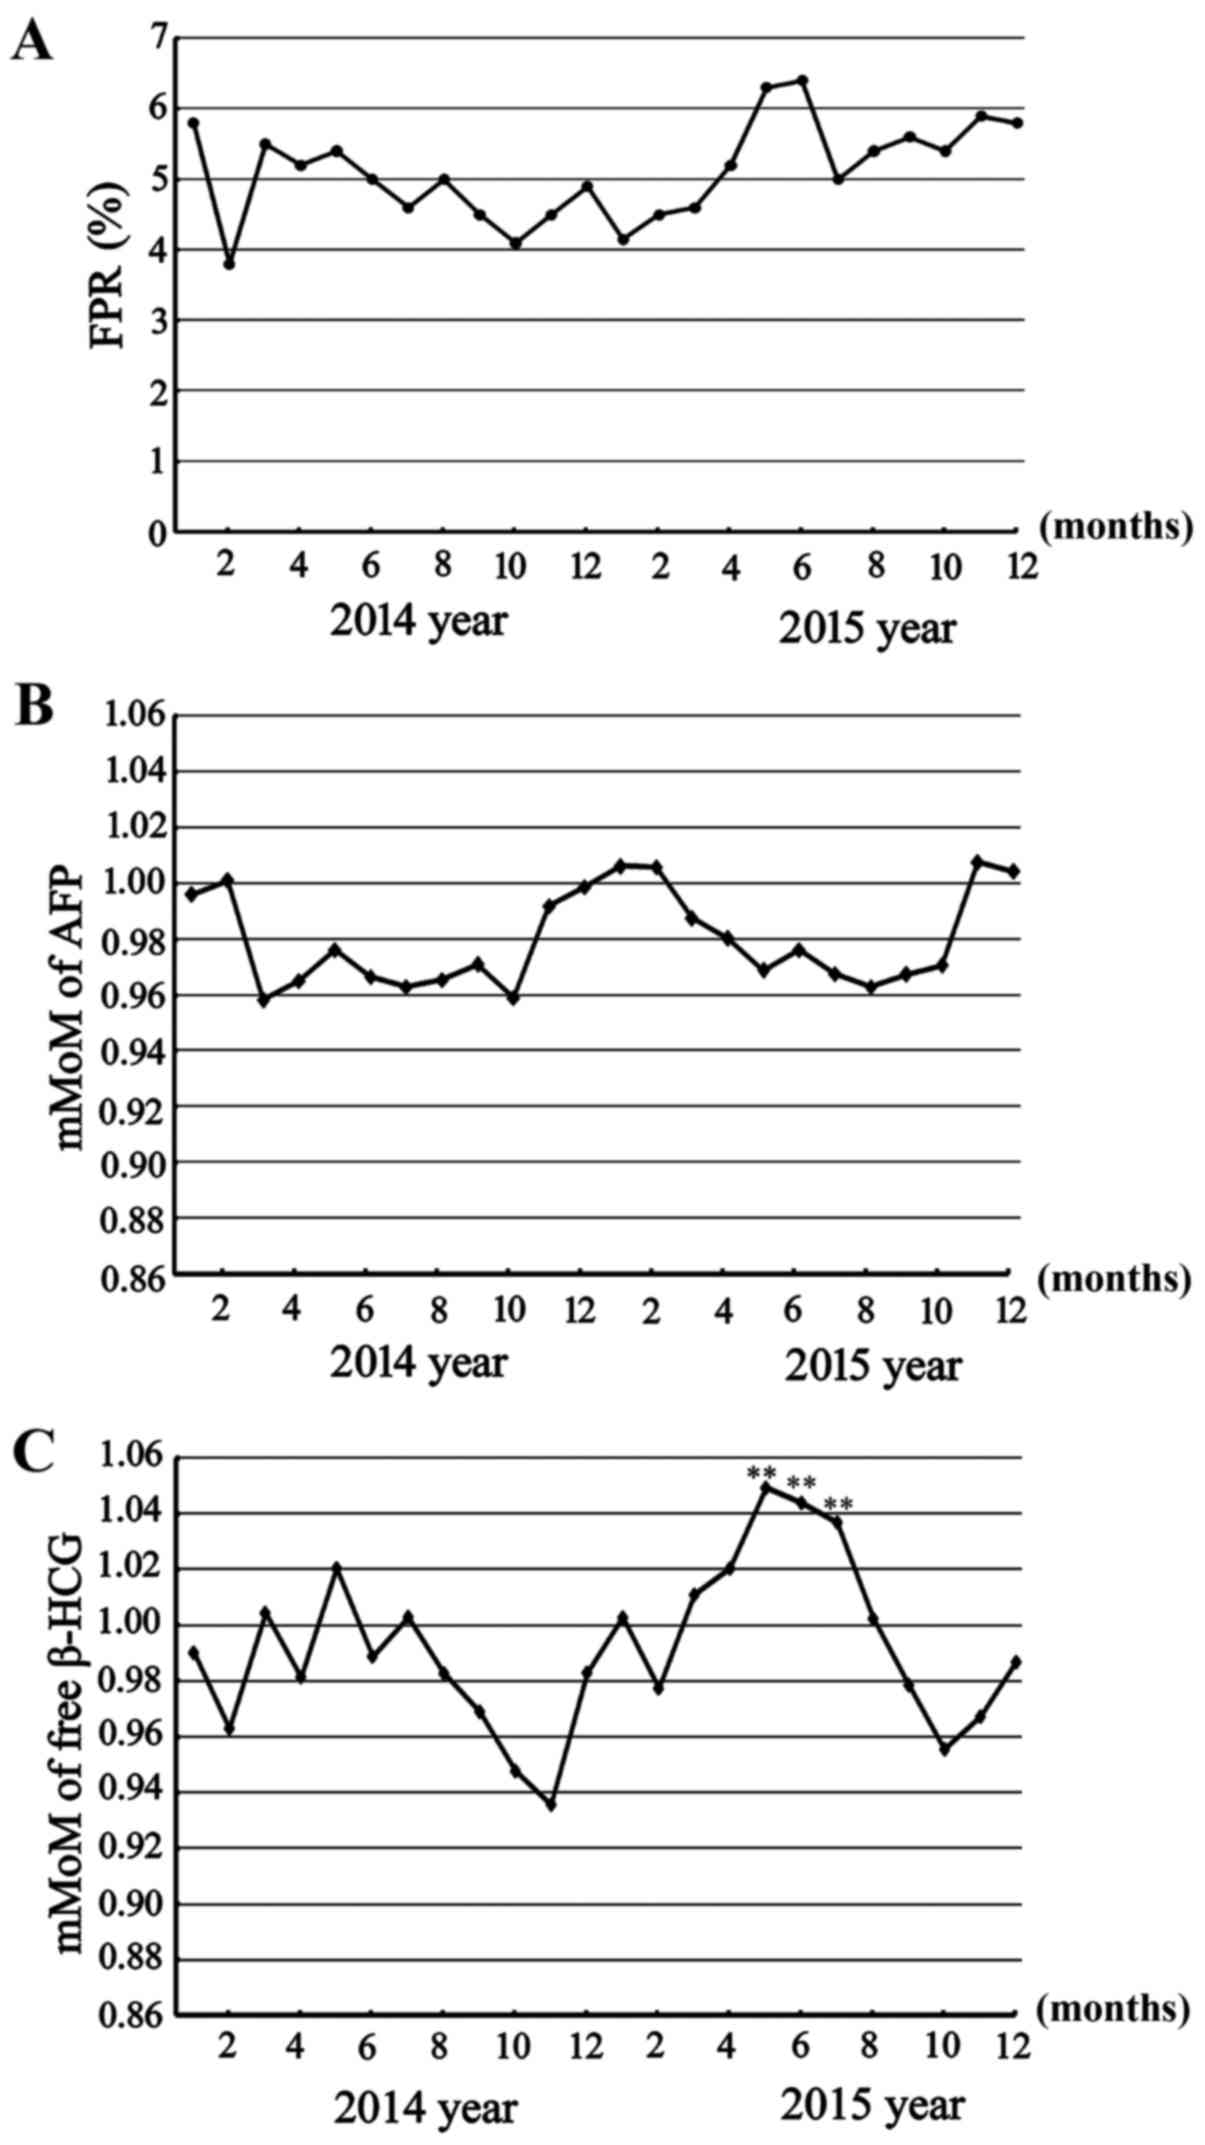
FPR increase and bias in mMoM values
of AFP and free β-HCG markers
FPR is a quality control aspect of serological
screening, which in the current study was identified to be ~5%
between January 2014 and April 2015 (4.80±1.08), though was
comparatively higher from May 2015 (5.74±1.20; P>0.05; Fig. 1A). Subsequently, the detection
precision and accuracy factors that may lead to an increased FPR,
including serum processing and testing, and gestational age
projections, were excluded, and the mMoM values of AFP and free
β-HCG markers were retrospectively analyzed. From March to October
2014 and March to August 2015, there was continuous bias. mMoM
values of AFP fluctuated in the range of 0.95–1.00 (Fig. 1B); and mMoM values of free β-HCG
fluctuated in the range of 0.95–1.05 from January 2014 to April
2015 (0.99±0.04), and rarely outside this range, but it was
persistently above 1.0 from May 2015 to July 2015 (1.04±0.02;
P<0.01), thus indicating significant bias towards Down syndrome
(Fig. 1C). These biases may have been
the cause of high FPR.
Influences of gestational age and
weight median equations on mMoM values
Following the identification of bias in mMoM values
of AFP and free β-HCG markers, mMoM values of AFP and free β-HCG
were retrospectively analyzed under different gestational ages and
weight groups. This identified bias in the mMoM values of AFP under
the different gestational ages and weight groups. The preliminary
gestational age median equation for AFP was not calibrated for
gestational ages from 17 weeks (119 days) to 20 weeks (140 days),
as mMoM values fluctuated in the range 0.95–1.0 and were sometimes
<0.95; therefore, the median equation of gestational age was
adjusted from the original
y=10^(0.514018+0.00872271*GA+0.000000182258*GA^2) to
y=10^(1.77831–0.0101412*GA+0.0000716186*GA^2). When the new median
equation was applied, mMoM values of AFP under different
gestational ages from January 2014 to May 2016, or data from
September 2015 to March 2016 under different gestational ages
resulted in reliable curves, with mMoM values fluctuating from 0.95
to 1.05 randomly (Fig. 2A). The
gestational age median equation of free β-HCG was not changed at
this time, as there was no apparent unsuitability using the median
equation
y=10^(−4.53412+0.270717*GA-0.00398489*GA^2+0.0000237835*GA^3-0.0000000510437*GA^4)
provided by the LifeCycle software (Fig.
2B). For the weight median equation, it was identified that
both calibrations were inadequate (Table
II); the mMoM values of AFP and free β-HCG under different
weight groups were biased markedly towards Down syndrome;
therefore, the weight median equation of AFP was changed from
y=0.43391+37.643/weight to y=0.276478+40.9054/weight, and the
weight median equation of free β-HCG was changed from
y=10^(0.276–0.004*weight) to
y=10^(0.495775–0.0107661*weight+0.000036501*weight^2), based on the
data from January 2014 to December 2015. Following the change, mMoM
values of AFP under different weight groups came to an ideal
distribution state, generally fluctuating in the range of 0.95 to
1.05, though some were over the range (Table II). However, correcting the body
weight median equation and medians in LifeCycle software for free
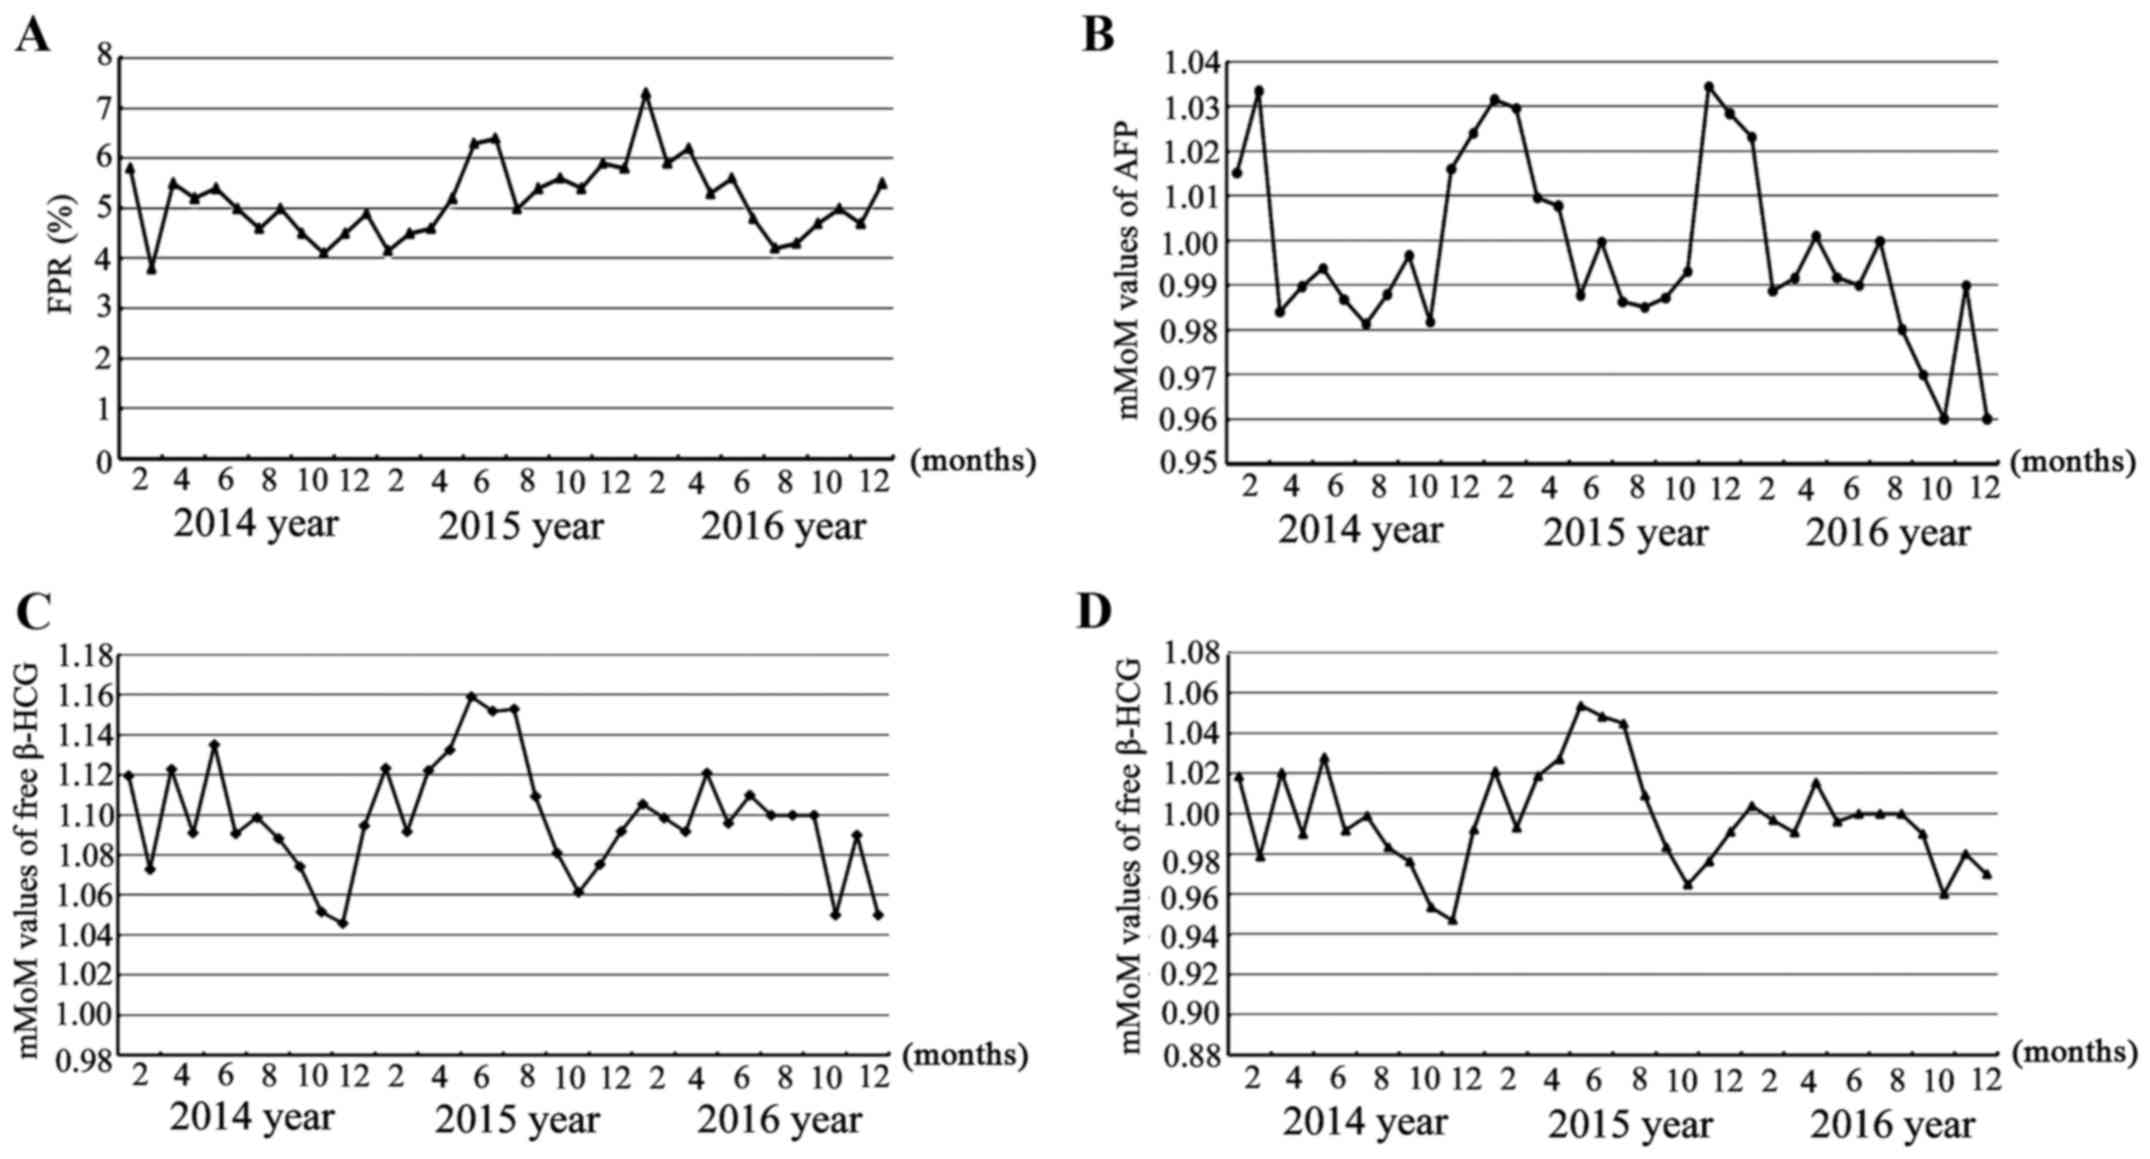
β-HCG did not achieve the desired effect. From September 2015 to
March 2016 following this adjustment, FPR was sustained at a high
level (Fig. 3A), and while mMoM
values of AFP marker fluctuated randomly in the range 0.95–1.05
(Fig. 3B), greater deviation in mMoM
values of free β-HCG occurred under different gestational ages
(Fig. 2B) and different weight groups
(Table II). Meanwhile, mMoM values
of the β-HCG marker sustained bias, fluctuating from 1.06 to 1.20
from September 2015 to May 2016 after using the adjusted local
median equation. When applying the adjusted median equation to
retrospectively analyze the data from January 2014 to December
2016, the same bias was observed (Fig.
3C). It was determined that by only changing the median
equation of weight of free β-HCG in September 2015, bias of free
β-HCG also existed, and thus the weight median equation was
adjusted as y=2.416–0.03435*weight+0.0001674*weight^2, and the
gestational age median equation as
y=10^(3.59566–0.030088*GA+0.0000794176*GA^2) in March 2016
according to data from January 2014 to December 2015, and the
medians of the software were also adjusted according to data from
January 2014 to December 2015. Subsequently, the mMoM values of
free β-HCG marker came to an ideal distribution state (Fig. 3D), fluctuating between ~0.95–1.05, and
even the mMoM values of free β-HCG under different gestational ages
(Fig. 2B) and different weights
(Table II) returned to normal range
after these measures. Additionally, the FPR from April 2016 to
December 2016 returned to an acceptable range (Fig. 3A).
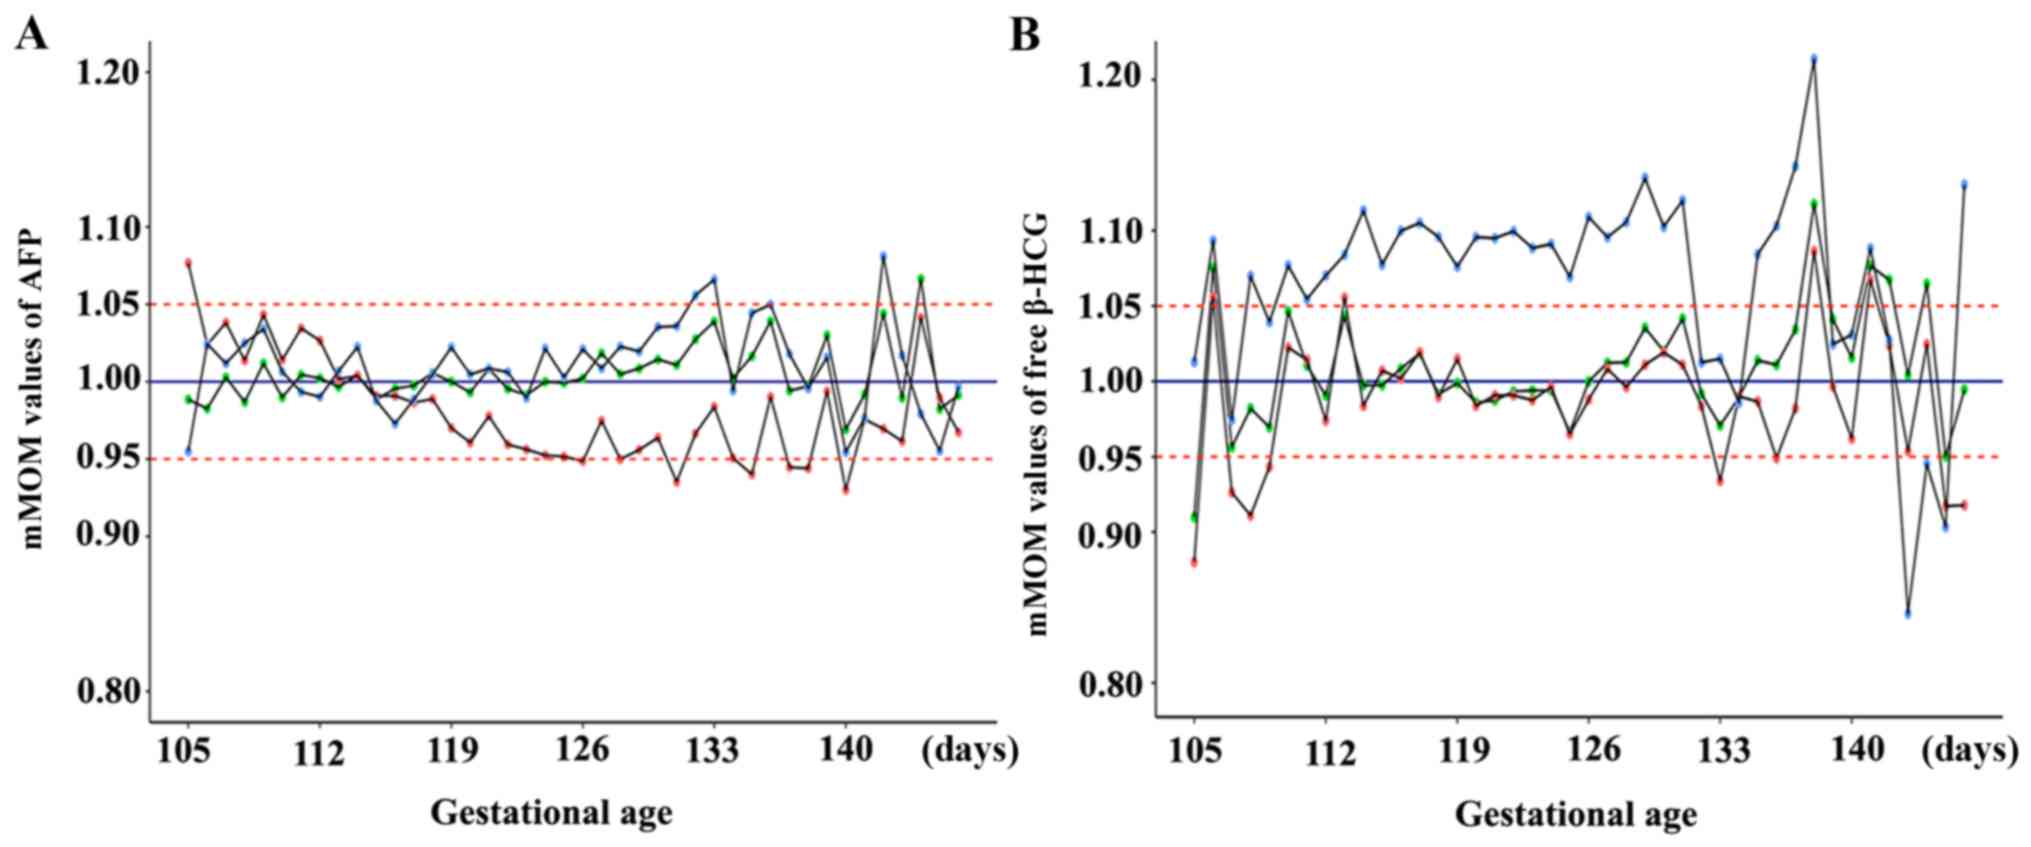 | Figure 2.mMoM values of AFP and free β-HCG
under different gestational ages analyzed by applying distinct
median equations. (A) mMoM values of AFP under different
gestational ages: Bias in mMoM values from January 2014 to July
2015 could be identified when using the median equation embedded in
LifeCycle software as indicated by the red-dot polyline; if the
gestational age median equation was adjusted based on local data
from January 2014 to August 2015, and the new gestational age
median equation was applied to retrospectively analyze data from
September 2015 to March 2016 or data from January 2014 to May 2016,
as indicated by the blue-dot and green-dot polyline, respectively,
mMoM values of AFP fluctuated in the range of 0.95–1.05, with
occasional fluctuation beyond this range. (B) mMoM values of free
β-HCG under different gestational ages: The original gestational
age median equation embedded in LifeCycle software was appropriate
from January 2014 to July 2015 before the median equation of body
weight was modified, as indicated by the red-dot polyline, but mMoM
values had more bias, almost above 1.05 from September 2015 to
March 2016 after adjusting the weight median equation, as indicated
by the blue-dot polyline; when gestational age and weight median
equations were adjusted together in March 2016, mMoM values from
January 2014 to May 2016 distributed reasonably if the new
gestational age median equation was used, as indicated by the
green-dot polyline. mMoM, median multiple of the median; AFP,
α-fetoprotein; free β-HCG, free β-human chorionic gonadotropin. |
| Table II.mMoM values of AFP and free β-HCG
prior to and following weight equation adjustment. |
Table II.
mMoM values of AFP and free β-HCG
prior to and following weight equation adjustment.
|
| AFP | Free β-HCG |
|---|
|
|
|
|
|---|
| Weight group
(kg) | mMoM values given by
LifeCycle software | mMoM values obtained
following weight equation adjustment in September 2015 | mMoM values given by
LifeCycle software | mMoM values
calculated by applying equation adjusted in September 2015 | mMoM values
calculated by applying equation adjusted in March 2016 |
|---|
| 40–50 | 1.00 | 1.00 | 1.05 | 1.07 | 0.99 |
| 51–55 | 0.99 | 1.00 | 1.02 | 1.08 | 1.00 |
| 56–60 | 0.97 | 1.00 | 0.99 | 1.11 | 1.01 |
| 61–65 | 0.96 | 1.00 | 0.95 | 1.08 | 0.99 |
| 66–70 | 0.96 | 0.99 | 0.93 | 1.08 | 1.00 |
| 71–75 | 0.94 | 0.97 | 0.92 | 1.06 | 1.00 |
| 76–80 | 0.94 | 1.00 | 0.92 | 1.13 | 1.01 |
| 81–85 | 0.93 | 1.01 | 0.91 | 1.04 | 0.99 |
| 86–90 | 0.95 | 0.99 | 0.86 | 1.18 | 0.98 |
| >90 | 0.92 | 1.03 | 0.89 | 1.20 | 1.01 |
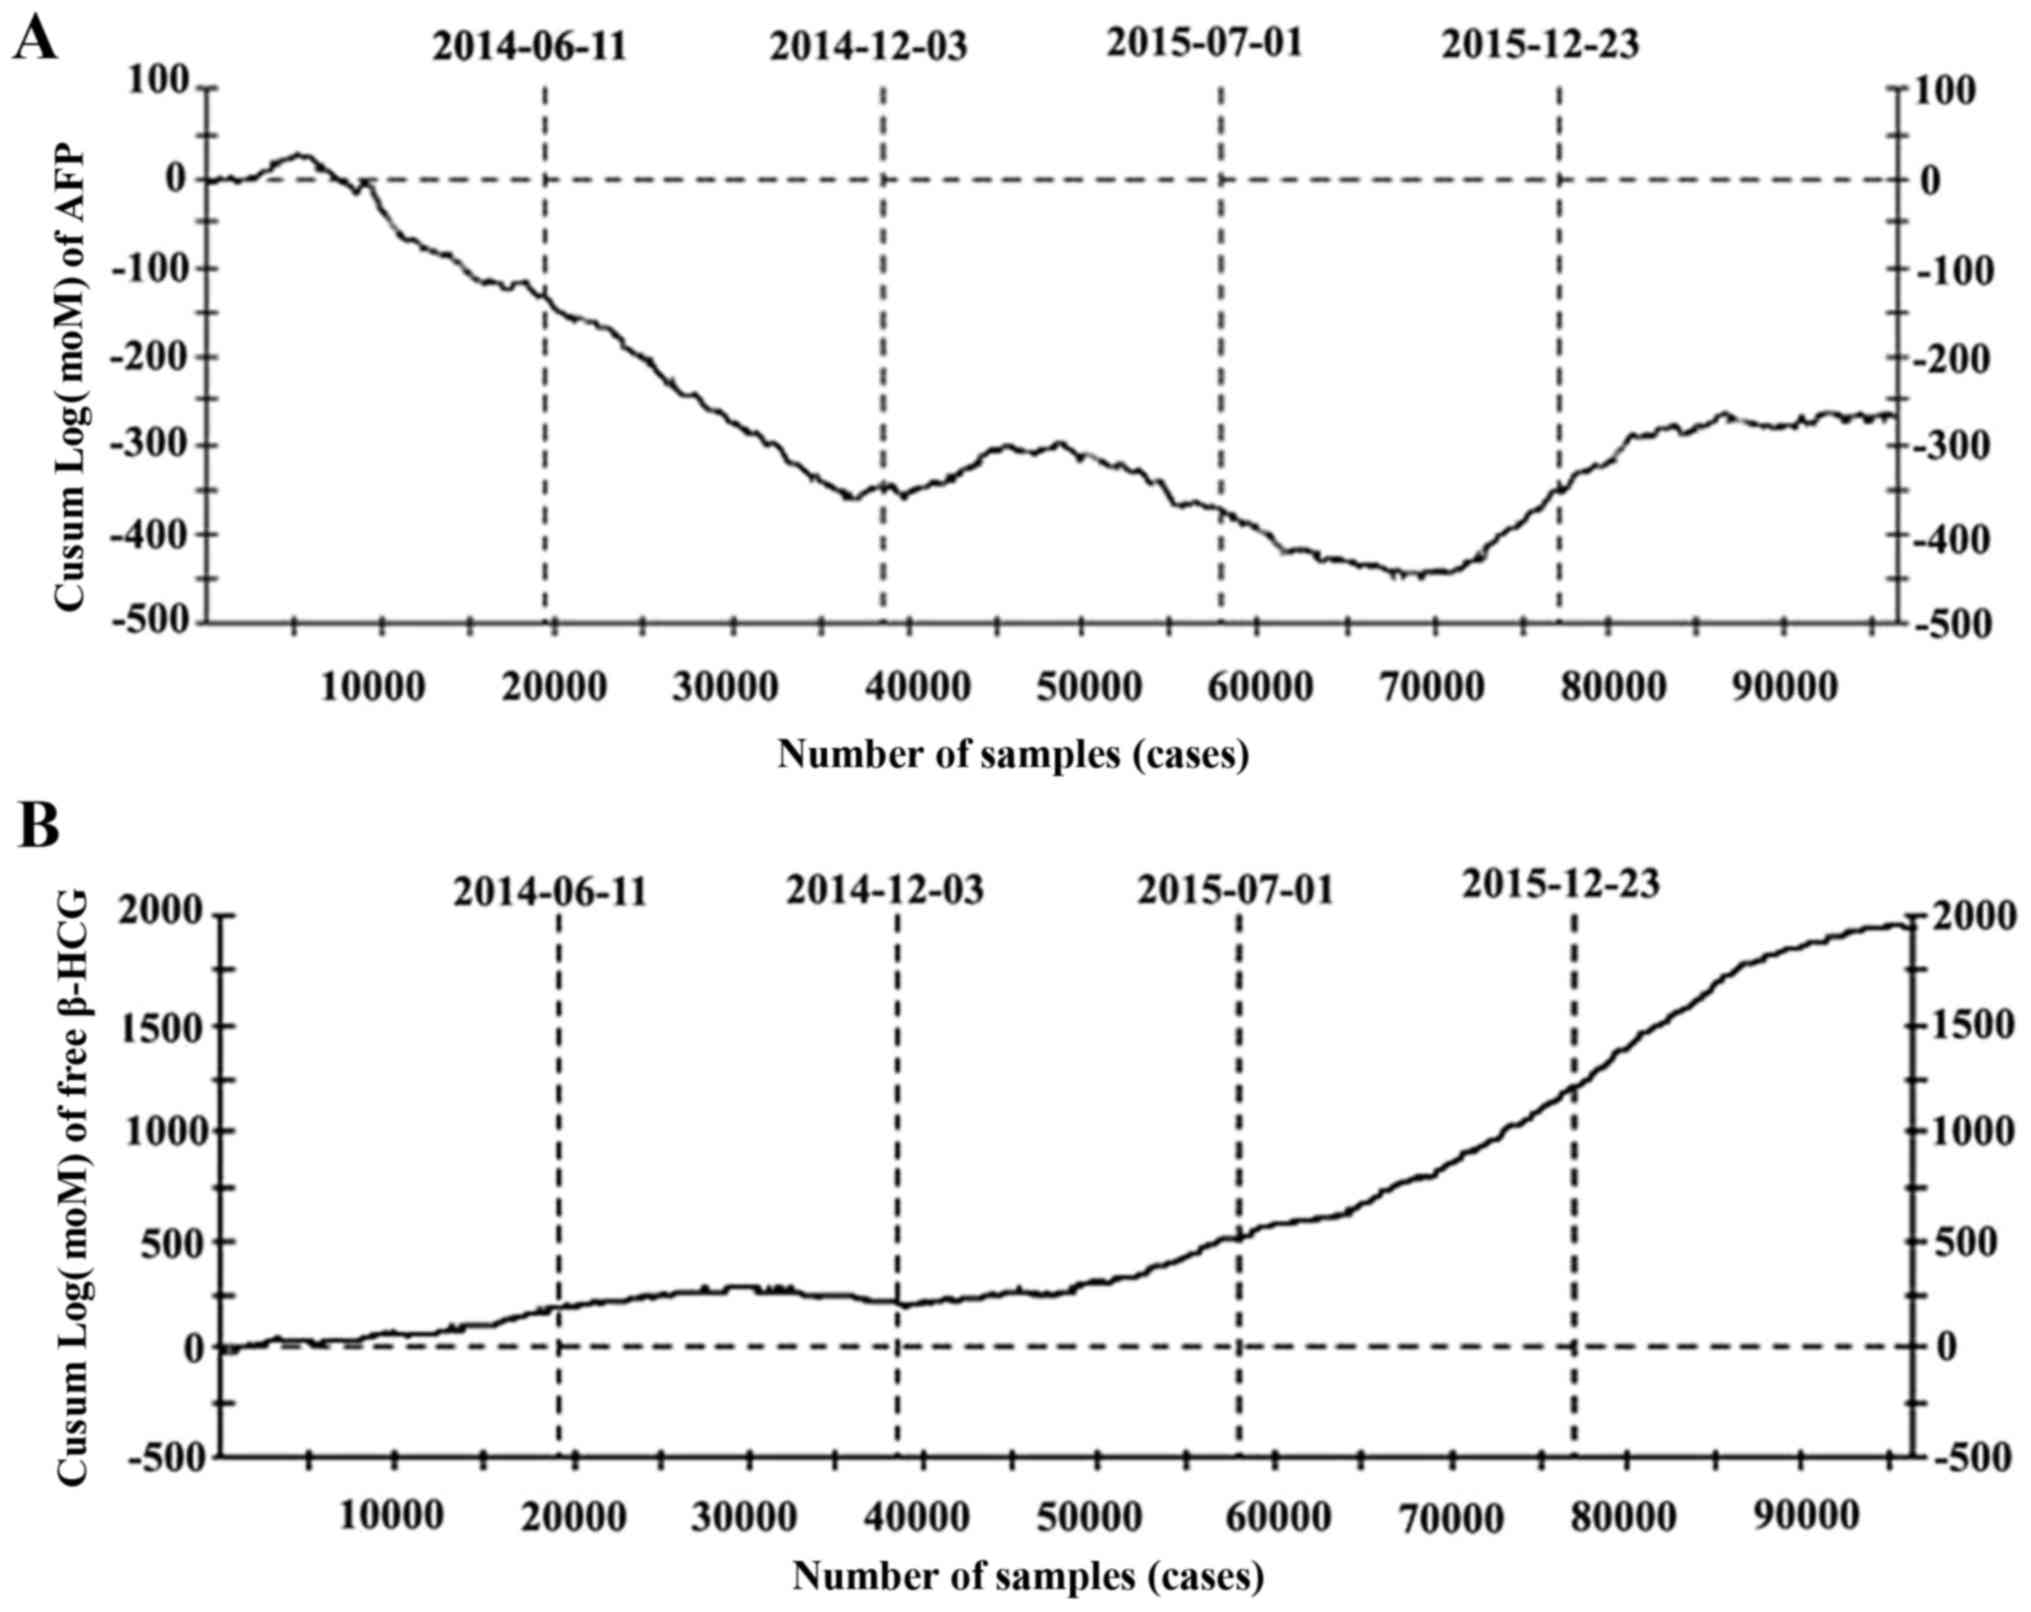
Significance of CUSUM chart in
screening quality control
CUSUM charts were considered effective for
responding to quality control, as they changed consistently with
the adjustments performed. From June 2014 to December 2014, the
slope of the curve in the CUSUM charts of AFP (Fig. 4A) continued to decline, and mMoM
values of AFP remained low (Fig. 1B).
Due to the lack of data for the CUSUM chart at that time, the
corresponding response was not determined. After this time, the
slope of the curve underwent positive and negative fluctuations,
and continuous increases or decreases were not apparent. After
December 2015, the curve became relatively proximal to the
horizontal line, indicating that the detection of AFP was stable
and the adjustment of the relevant median equation was effective
(Fig. 4A). A different phenomenon was
observed for free β-HCG (Fig. 4B).
The curve was relatively close to the horizontal line from June
2014 to May 2015, but the slope of the curve continued upward after
May 2015, indicating that some significant factor may have lead to
the increase in free β-HCG while FPR increased and bias in mMoM
values appeared. The slope of the curve was positive from September
2015 to March 2016 after adjusting the weight median equation until
the second adjustment. This phenomenon indicated that the first
adjustment was inappropriate.
Discussion
Screening efficiency is represented by both DR and
FPR. Prenatal serological screening may result in false negatives,
which can not be determined until after childbirth, and thus
regarding quality control in prenatal screening, DR seems
inadequate for immediate quality control. By contrast, FPR reflects
screening quality immediately, and thus may be considered more
meaningful in quality control. In the current study, a
significantly elevated FPR was first identified, after which the
factors that may have caused this were analyzed, including bias in
the mMoM values of AFP and free β-HCG markers, and in the mMoM
values of AFP and free β-HCG under different gestational ages and
weight groups. The present results were similar to those reported
by Nix et al (10), in that a
rise in FPR and bias in mMoM values AFP and free β-HCG toward
Down's syndrome were identified. However, an increase in FPR may
increase the number of invasive prenatal examinations, the
psychological burden to pregnant women and medical pressure, and
thus corresponding assessments were performed. The median equations
of gestational age and weight of AFP and the weight median equation
of free β-HCG were modified based on local data, while the
gestational age median equation of free β-HCG was not adjusted in
the first instance. In the follow-up work, FPR was markedly
increased and abnormally high fluctuations in mMoM values of free
β-HCG were observed. After a half-year period of observation, and
following the exclusion of all possible factors that may cause the
fluctuation, gestational age and weight median equations for free
β-HCG were modified together. All indices including FPR, mMoM
values of markers and mMoM values under different gestational ages
and weight groups generally reached an ideal state. The
corresponding results indicated that gestational age and weight
median equations must be adjusted together and not alone.
Additionally in the present study, the significant
changes in FPR and mMoM values indicated that there maybe some
factor that was influencing screening. Therefore, risk assessment
should be performed if there are no clear influencing factors from
the start of screening to the laboratory analysis. For prenatal
screening and screening management, screening data analysis is
important for the quality control of the screening system. Firstly,
by focusing on abnormal changes in screening FPR and mMoM values of
markers, bias maybe identified immediately, which will aid to find
the confounding factor at the earliest opportunity. Secondly,
analysis based on local mMoM values was the basis for the
modification of the median equation. Ethnic, geographical and other
factors may lead to differences in mMoM values of serological
indicators; therefore, establishing gestational age and weight
median equations by the median acquired from normal pregnant women
in the local region is important. However, how to modify the median
equation is not simple and must be based on comprehensive data,
accurate laboratory test results and reliable risk assessment.
Thus, medians must be obtained under strict quality control.
Thirdly, monitoring of all indices including FPR, mMoM values of
markers and mMoM values under different gestational ages and weight
groups is a reliable method for laboratory quality evaluation.
According to this method, an independently standardized data audit
method maybe established to determine a unified quality assessment
method in domestic screening agencies (11). Finally, FPR and mMoM values may be
applied to demonstrate a stable screening efficiency of the
screening system, and horizontal quality evaluation could be
performed among screening agencies. Taken together, the present
data analysis techniques may make the screening more reliable in
routine clinical together practice in the future.
Acknowledgements
Not applicable.
Funding
This study was supported by the National Natural
Science Foundation of China (grant nos. 81541064 and 81671475).
Availability of data and materials
All data generated or analyzed during this study are
included in this published article.
Authors' contributions
YL and XZ made substantial contributions to
conception, design and involved in drafting the manuscript; DH and
the first two authors were responsible for sample testing and
Down's syndrome risk calculation; XG was responsible for collecting
information; YS and all of the above authors were participated in
patient informed consent; TJ was responsible for guidance and made
sure the work went well. All authors read and approved the final
manuscript.
Ethics approval and consent to
participate
This study was approved by Medical Ethics Committee
of Nanjing Maternity and Child Health Care Hospital (Nanjing,
China). All pregnant women participating in the study signed
written informed consent following full disclosure of the study
procedures.
Consent for publication
All pregnant women participating in the study signed
written informed consent permitting the publication of relevant
data on the terms of data anonymization.
Competing interests
SL is an employee of Zhejiang Biosan Biochemical
Technologies Co., Ltd. All other authors declare that they have no
competing interests.
References
|
1
|
Smith M and Visootsak J: Noninvasive
screening tools for Down syndrome: A review. Int J Womens Health.
5:125–131. 2013.PubMed/NCBI
|
|
2
|
Duan Y, Li Y and Xue Q: Serological
prenatal screening and diagnosis for Down syndrome. Clin Exp Obstet
Gynecol. 41:572–574. 2014.PubMed/NCBI
|
|
3
|
Huang J, Chen Y and Pong RW: Factors
influencing prenatal screening for Down's syndrome: Evidence from
Zhejiang (China). Asia Pac J Public Health. 27:NP1288–NP1297. 2015.
View Article : Google Scholar : PubMed/NCBI
|
|
4
|
Sirichotiyakul S, Luewan S, Sekararith R
and Tongsong T: False positive rate of serum markers for Down
syndrome screening: Does transportation have any effect? J Med
Assoc Thai. 95:152–155. 2012.PubMed/NCBI
|
|
5
|
Wald NJ, Barnes IM, Birger R and Huttly W:
Effect on Down syndrome screening performance of adjusting for
marker levels in a previous pregnancy. Prenat Diagn. 26:539–544.
2006. View
Article : Google Scholar : PubMed/NCBI
|
|
6
|
Androutsopoulos G, Gkogkos P and Decavalas
G: Mid-trimester maternal serum HCG and alpha fetal protein levels:
Clinical significance and prediction of adverse pregnancy outcome.
Int J Endocrinol Metab. 11:102–106. 2013. View Article : Google Scholar : PubMed/NCBI
|
|
7
|
Extermann P, Bischof P, Marguerat P and
Mermillod B: Second-trimester maternal serum screening for Down's
syndrome: Free beta-human chorionic gonadotrophin (HCG) and
alpha-fetoprotein, with or without unconjugated oestriol, compared
with total HCG, alpha-fetoprotein and unconjugated oestriol. Hum
Reprod. 13:220–223. 1998. View Article : Google Scholar : PubMed/NCBI
|
|
8
|
Sayin NC, Canda MT, Ahmet N, Arda S, Süt N
and Varol FG: The association of triple-marker test results with
adverse pregnancy outcomes in low-risk pregnancies with healthy
newborns. Arch Gynecol Obstet. 277:47–53. 2008. View Article : Google Scholar : PubMed/NCBI
|
|
9
|
Shaw SW, Lin SY, Lin CH, Su YN, Cheng PJ,
Lee CN and Chen CP: Second-trimester maternal serum quadruple test
for Down syndrome screening: A Taiwanese population-based study.
Taiwan J Obstet Gynecol. 49:30–34. 2010. View Article : Google Scholar : PubMed/NCBI
|
|
10
|
Nix B, Wright D and Baker A: The impact of
bias in MoM values on patient risk and screening performance for
Down syndrome. Prenat Diagn. 27:840–845. 2007. View Article : Google Scholar : PubMed/NCBI
|
|
11
|
Bishop J, Dunstan FD, Nix BJ and Reynolds
TM: The effects of gestation dating on the calculation of patient
specific risks in Down's syndrome screening. Ann Clin Biochem.
32:464–477. 1995. View Article : Google Scholar : PubMed/NCBI
|
|
12
|
Li Y, Zhang X, Sun Y, Hong D, Wang Y, Xu Z
and Jiang T: Combined detection of α-fetoprotein and free β-human
chorionic gonadotropin in screening for trisomy 21 and management
of cases in the moderate risk value range. Mol Clin Oncol.
7:623–628. 2017. View Article : Google Scholar : PubMed/NCBI
|
|
13
|
Parikh AM, Park AM and Sumfest J:
Cumulative summation (CUSUM) charts in the monitoring of
hypospadias outcomes: A tool for quality improvement initiative. J
Pediatr Urol. 10:306–311. 2014. View Article : Google Scholar : PubMed/NCBI
|
|
14
|
Leandro G, Rolando N, Gallus G, Rolles K
and Burroughs AK: Monitoring surgical and medical outcomes: The
Bernoulli cumulative SUM chart. A novel application to assess
clinical interventions. Postgrad Med J. 81:647–652. 2005.
View Article : Google Scholar : PubMed/NCBI
|