Introduction
Esophageal cancer is among the most common
malignancies worldwide, and in the United States has a 5-year
survival rate following diagnosis of only ~19% (1). Squamous cell carcinoma and
adenocarcinoma are the two main subtypes of esophageal cancer. The
incidence of esophageal adenocarcinoma (EAC) has increased
substantially in the United States, Western Europe, Australia and
other developed countries over the past four decades (2). It is generally accepted that
gastroesophageal reflux disease and obesity are explanations for
the increased incidence of EAC (3).
However, the underlying mechanism remains unclear.
Several genes have been reported to serve important
roles in the development of EAC. The P53 gene has been found to be
dysregulated in most cancer types (4). Furthermore, it is considered that P53
may be involved in the development of different cancers. For
instance, a cohort study of chemoradiotherapy-naive surgically
treated EAC reported that p53 expression was significantly
correlated with disease-free survival and overall survival,
independent of tumor stage (5).
Meanwhile, a genome-wide association study of 2,515 EAC cases and
3,207 controls provided data to suggest that germline variations at
the cyclin-dependent kinase inhibitor 2A locus may influence
susceptibility to EAC (6). In
addition, Gli and epithelial-mesenchymal transition-related protein
expression was previously examined by western blot analysis in
paired EAC patient tissues and cell lines. The results suggested
that Gli may be critical for the metastasis and recurrence of
esophageal adenocarcinomas (7).
Osteopontin (OPN) isoforms have also been investigated in EAC,
where results indicated that all OPN isoforms were frequently
co-overexpressed in primary EACs, and that isoforms OPNb and OPNc
enhanced invasion and dissemination through collective yet distinct
mechanisms (8). However, despite
these in-depth studies to identify novel targets for the treatment
of EAC, there lacks a comprehensive presentation of the key genes
and pathways implicated in EAC.
Gene expression profile analysis is a
high-throughput method for detecting messenger RNA expression in
tissue or cell samples. By analyzing the different gene expression
between cancer patients and normal controls, an improved
understanding of the molecular pathogenesis of a tumor can be
obtained, facilitating the identification of the potential target
genes and pathways for therapy (9,10).
The present study aimed to investigate the
pathogenesis of EAC by a computational bioinformatics analysis of
gene expression. Data from the Gene Expression Omnibus (GEO)
database was extracted, and differentially expressed genes (DEGs)
between EAC and normal samples were identified. The possible
functions of the DEGs were predicted using enrichment analysis.
Furthermore, protein-protein interaction (PPI) networks were
visualized and module analysis was conducted using Cytoscape
software to search for key genes that may be involved in the
development of EAC.
Materials and methods
Affymetrix microarray data
The gene expression profiles of GSE92396,
contributed by Peng et al (11), were downloaded from the Gene
Expression Omnibus (GEO) database (http://www.ncbi.nlm.nih.gov/geo/). The platform was
GPL6244, HuGene-1_0-st Affymetrix Human Gene 1.0 ST Array. The
dataset included 12 esophageal adenocarcinoma samples and 9 normal
esophageal samples; 9 were tumor-normal pairs.
Identification of DEGs
The data were pre-processed in R language (version
3.4.3; http://www.r-project.org/) using the
oligo package (version 1.32.0; http://www.bioconductor.org/packages/release/bioc/html/oligo.html)
(12,13). Probe levels were calculated and
converted into the gene expression levels according to the
annotation files in the GEO database. The DEGs of GSE92396 between
the normal tissues and the tumor samples were analyzed with limma
package (version 3.34.8) in R language (14). Fold-changes (FCs) in the gene
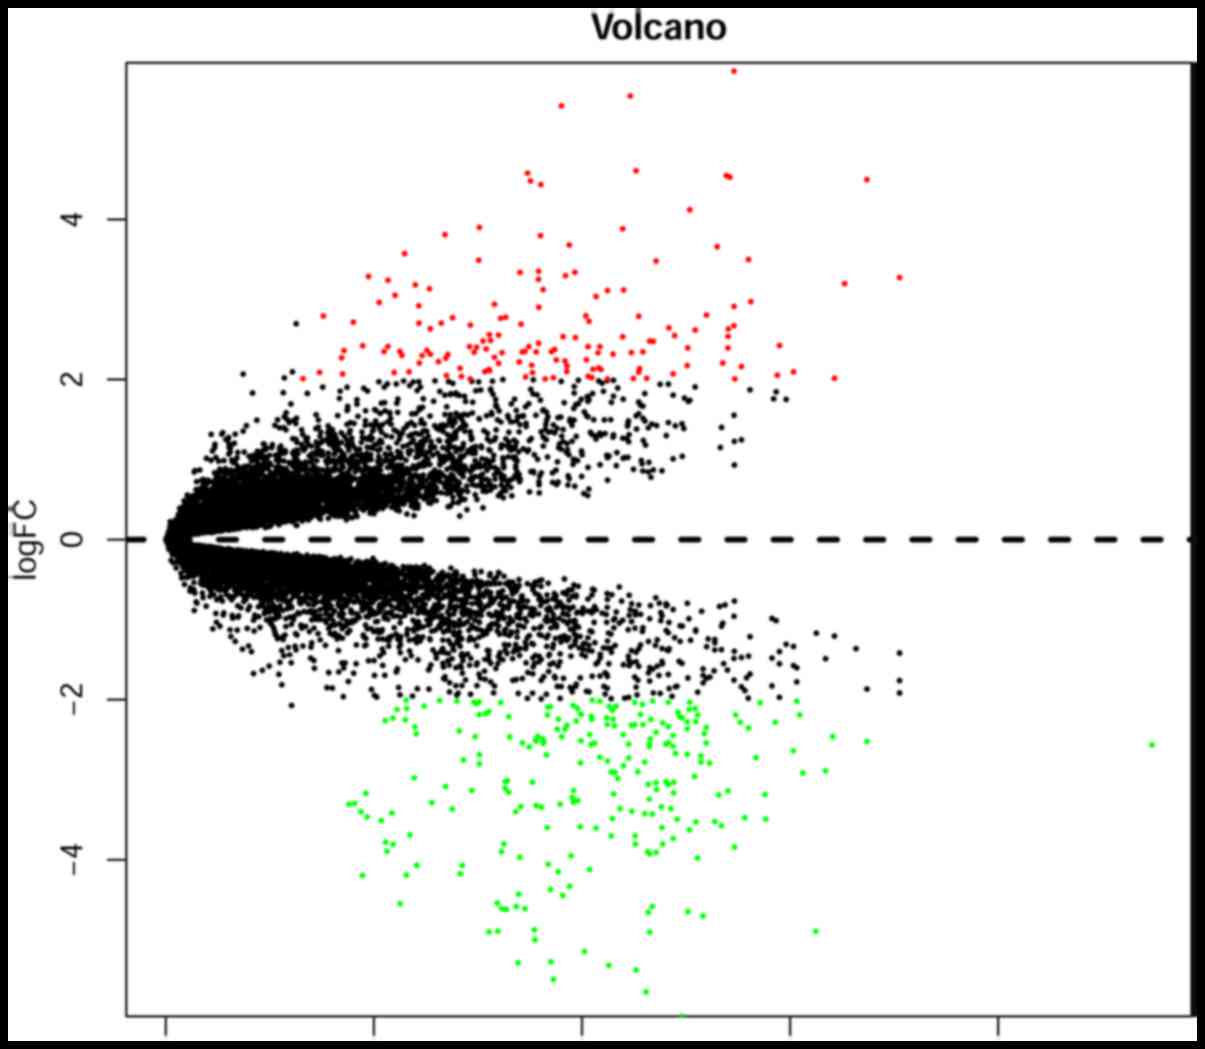
expression values were calculated. |log2 FC|>2 and
adjusted P-values <0.05 were considered to be the cut-off
criteria for the identification of DEGs. A volcano plot was drawn
using the gplots package (version 3.0.1).
Gene ontology (GO) and pathway
enrichment analysis of the DEGs
The online analysis tool, the Database for
Annotation, Visualization and Integrated Discovery (DAVID; version
6.8; http://david.abcc.ncifcrf.gov/) was
used to analyse the DEGs for GO term and Kyoto Encyclopedia of
Genes and Genomes (KEGG) pathway enrichment. Enriched terms with
>2 genes and a P-value <0.05 were considered to be
statistically significant.
Construction of PPI network and
screening of modules
The online analysis tool, the Search Tool for the
Retrieval of Interacting Genes (STRING version 10.0; http://string-db.org/) was used to assess the PPI
network of the DEGs, with the required confidence (combined score)
>0.4. Visualization of the network and module analysis were
performed with Cytoscape software (version 3.6.0; http://www.cytoscape.org/) and the MCODE plug-in
(version 1.5.1) (15). The degree was
statistically analysed using the CentiScaPe plug-in (version 2.2)
to obtain hub nodes or genes in the PPI network (16). An MCODE computed node score >4 and
node number >4 were considered as the cut-off criteria.
Subsequent GO function and KEGG pathway enrichment analyses of the
DEGs in the modules were performed using DAVID.
Results
Identification of DEGs
To identify DEGs between EAC samples and normal
controls, the microarray dataset GSE92396, obtained from the GEO
database, was screened. DEGs with |log2 FC|>2 and a
P-value <0.05 were determined. A total of 386 DEGs were
identified in EAC samples compared with in the normal controls,
including 150 upregulated and 236 downregulated DEGs. The volcano
plot is presented in Fig. 1.
GO and pathway enrichment analysis of
DEGs
To categorize the representation of DEGs and the
involved pathways, GO and KEGG pathway enrichment analyses were
performed using the online tool DAVID. The upregulated DEGs were
enriched in 60 GO terms and 3 KEGG pathways. The GO functions
enriched for the upregulated DEGs were mainly within the
extracellular exosome (P=1.09×10⁻¹⁴), extracellular
space (P=5.44×10⁻¹⁵) and extracellular region
(P=1.61×10⁻¹⁰). KEGG pathways enriched for the
upregulated DEGs were mainly in complement and coagulation cascades
(P=6.84×10⁻⁵), maturity onset diabetes of the young
(P=0.002282) and protein digestion and absorption (P=0.012483).
The downregulated DEGs were enriched in 67 GO terms
and 5 KEGG pathways. The GO functions enriched for the
downregulated DEGs were mainly within the extracellular exosome
(P=8.36×10⁻¹²), epidermis development
(P=3.26×10⁻²²) and keratinocyte differentiation
(P=2.62×10⁻²⁰). KEGG pathways enriched for the
downregulated DEGs were mainly in amoebiasis
(P=3.46×10⁻⁴), retinol metabolism (P=0.020258) and drug
metabolism-cytochrome P450 (P=0.022809). The top 10 terms of the GO
enrichment analysis for up- and downregulated genes are presented
respectively in Table I. The results
of KEGG enrichment analysis for up- and downregulated genes are
presented respectively in Table
II.
 | Table I.GO enrichment analysis of the
differentially expressed genes. |
Table I.
GO enrichment analysis of the
differentially expressed genes.
| Category | Term | Count | P-value |
|---|
| Upregulated
genes |
|
GOTERM_CC_DIRECT | GO:0005615
extracellular space | 43 |
5.44×10⁻¹⁵ |
|
GOTERM_CC_DIRECT | GO:0070062
extracellular exosome | 62 |
1.09×10⁻¹⁴ |
|
GOTERM_CC_DIRECT | GO:0005576
extracellular region | 40 |
1.61×10⁻¹⁰ |
|
GOTERM_CC_DIRECT | GO:0005578
proteinaceous extracellular matrix | 15 |
3.09×10⁻⁸ |
|
GOTERM_BP_DIRECT | GO:0022617
extracellular matrix disassembly | 9 |
2.36×10⁻⁷ |
|
GOTERM_CC_DIRECT | GO:0031012
extracellular matrix | 14 |
7.17×10⁻⁷ |
|
GOTERM_CC_DIRECT | GO:0016324 apical
plasma membrane | 13 |
3.74×10⁻⁶ |
|
GOTERM_BP_DIRECT | GO:0030198
extracellular matrix organization | 11 |
6.13×10⁻⁶ |
|
GOTERM_CC_DIRECT | GO:0005796 Golgi
lumen | 8 |
1.15×10⁻⁵ |
|
GOTERM_BP_DIRECT | GO:0030574 collagen
catabolic process | 7 |
1.58×10⁻⁵ |
| Downregulated
genes |
|
GOTERM_BP_DIRECT | GO:0008544
epidermis development | 22 |
3.26×10⁻²² |
|
GOTERM_BP_DIRECT | GO:0030216
keratinocyte differentiation | 20 |
2.62×10⁻²⁰ |
|
GOTERM_CC_DIRECT | GO:0001533
cornified envelope | 15 |
1.04×10⁻¹⁶ |
|
GOTERM_BP_DIRECT | GO:0018149 peptide
cross-linking | 14 |
1.69×10⁻¹⁴ |
|
GOTERM_BP_DIRECT | GO:0031424
keratinization | 13 |
2.97×10⁻¹³ |
|
GOTERM_MF_DIRECT | GO:0005198
structural molecule activity | 21 |
7.55×10⁻¹² |
|
GOTERM_CC_DIRECT | GO:0070062
extracellular exosome | 74 |
8.36×10⁻¹² |
|
GOTERM_CC_DIRECT | GO:0030057
desmosome | 8 |
8.15×10⁻⁹ |
|
GOTERM_MF_DIRECT | GO:0004867
serine-type endopeptidase inhibitor activity | 10 |
1.66×10⁻⁶ |
|
GOTERM_BP_DIRECT | GO:0061436
establishment of skin barrier | 6 |
1.76×10⁻⁶ |
| Table II.KEGG pathway enrichment analysis of
the differentially expressed genes. |
Table II.
KEGG pathway enrichment analysis of
the differentially expressed genes.
| Category | Term | Count | P-value |
|---|
| Upregulated
genes |
| KEGG_PATHWAY | hsa04610 Complement
and coagulation cascades | 7 |
6.84×10⁻⁵ |
| KEGG_PATHWAY | hsa04950 Maturity
onset diabetes of the young | 4 | 0.002282 |
| KEGG_PATHWAY | hsa04974 Protein
digestion and absorption | 5 | 0.012483 |
| Downregulated
genes |
| KEGG_PATHWAY | hsa05146
Amoebiasis | 7 |
3.46×10⁻⁴ |
| KEGG_PATHWAY | hsa00830 Retinol
metabolism | 4 | 0.020258 |
| KEGG_PATHWAY | hsa00982 Drug
metabolism - cytochrome P450 | 4 | 0.022809 |
| KEGG_PATHWAY | hsa05204 Chemical
carcinogenesis | 4 | 0.034682 |
| KEGG_PATHWAY | hsa00350 Tyrosine
metabolism | 3 | 0.038991 |
Construction of PPI network and
screening of modules
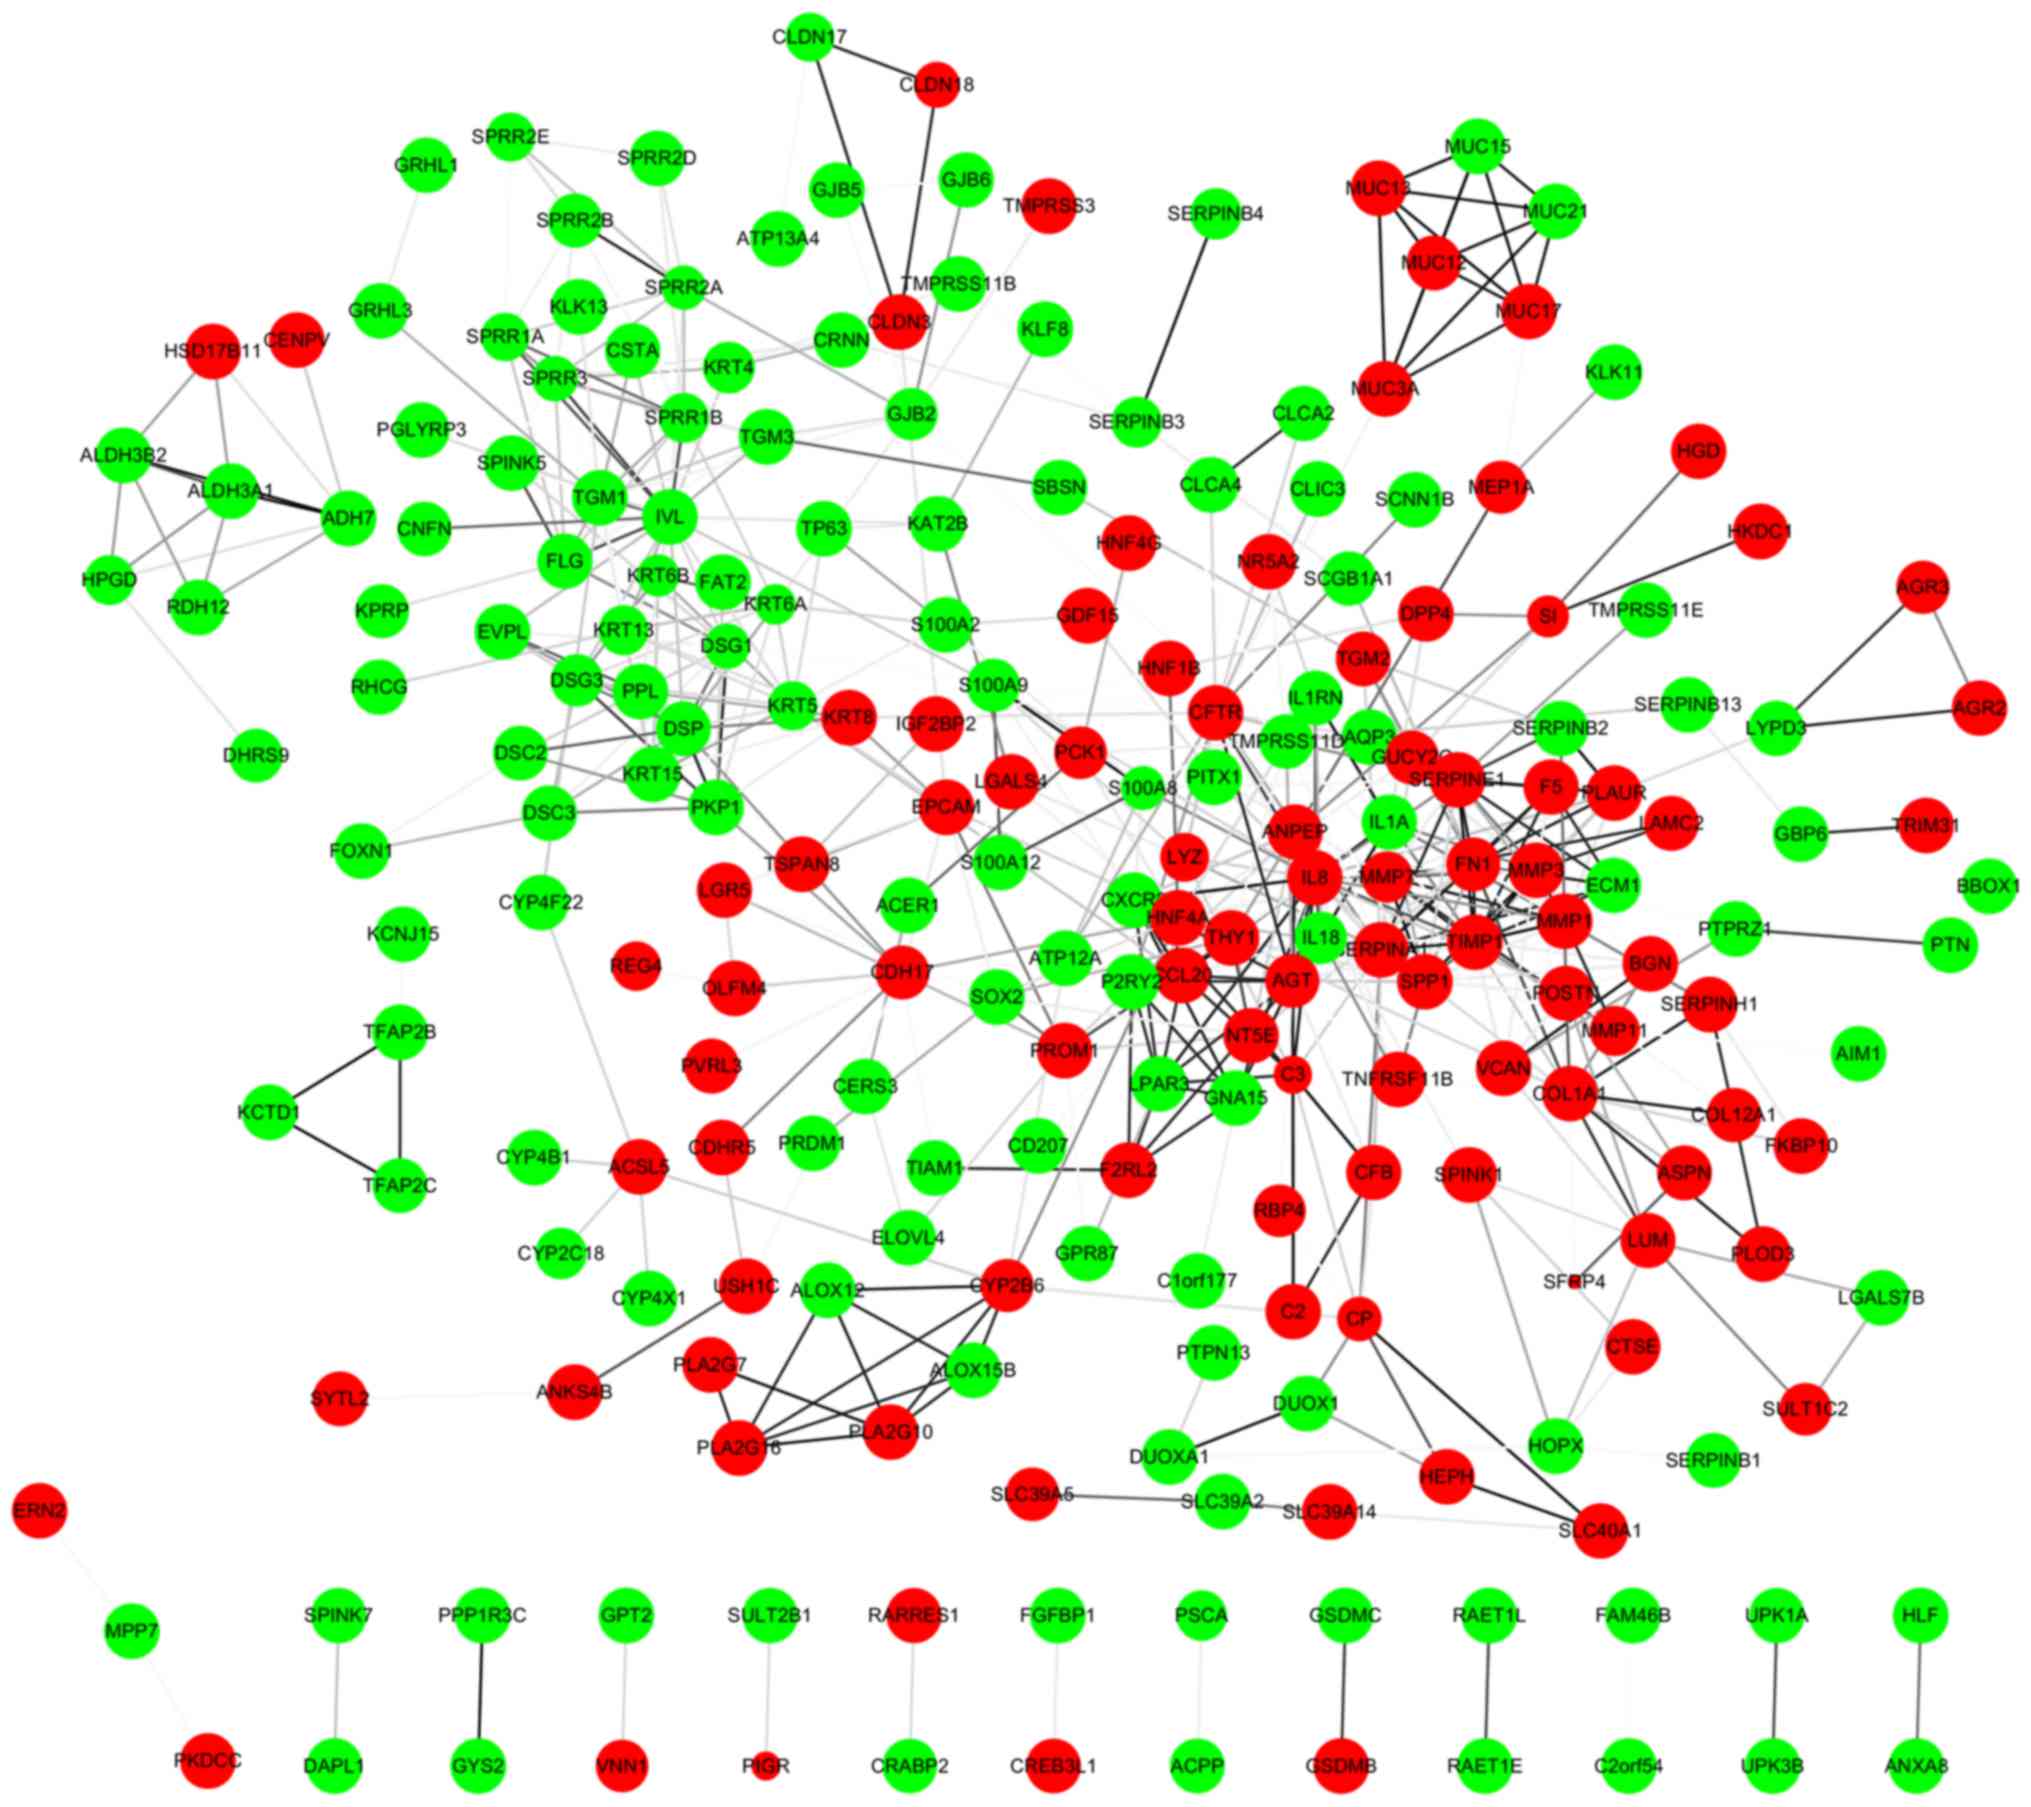
Based on information from the STRING database, a PPI
network comprising of 369 nodes and 534 edges was constructed using
the Cytoscape software (Fig. 2). The
top 10 hub nodes with the highest degrees were interleukin (IL)-8,
involucrin (IVL), tissue inhibitor of metalloproteinase 1 (TIMP1),
fibronectin 1 (FN1), serpin family E member 1 (SERPINE1), serpin
family A member 1 (SERPINA1), cystic fibrosis transmembrane
conductance regulator (CFTR), secreted phosphoprotein 1 (SPP1),
collagen type I alpha 1 chain (COL1A1) and angiotensinogen (AGT). A
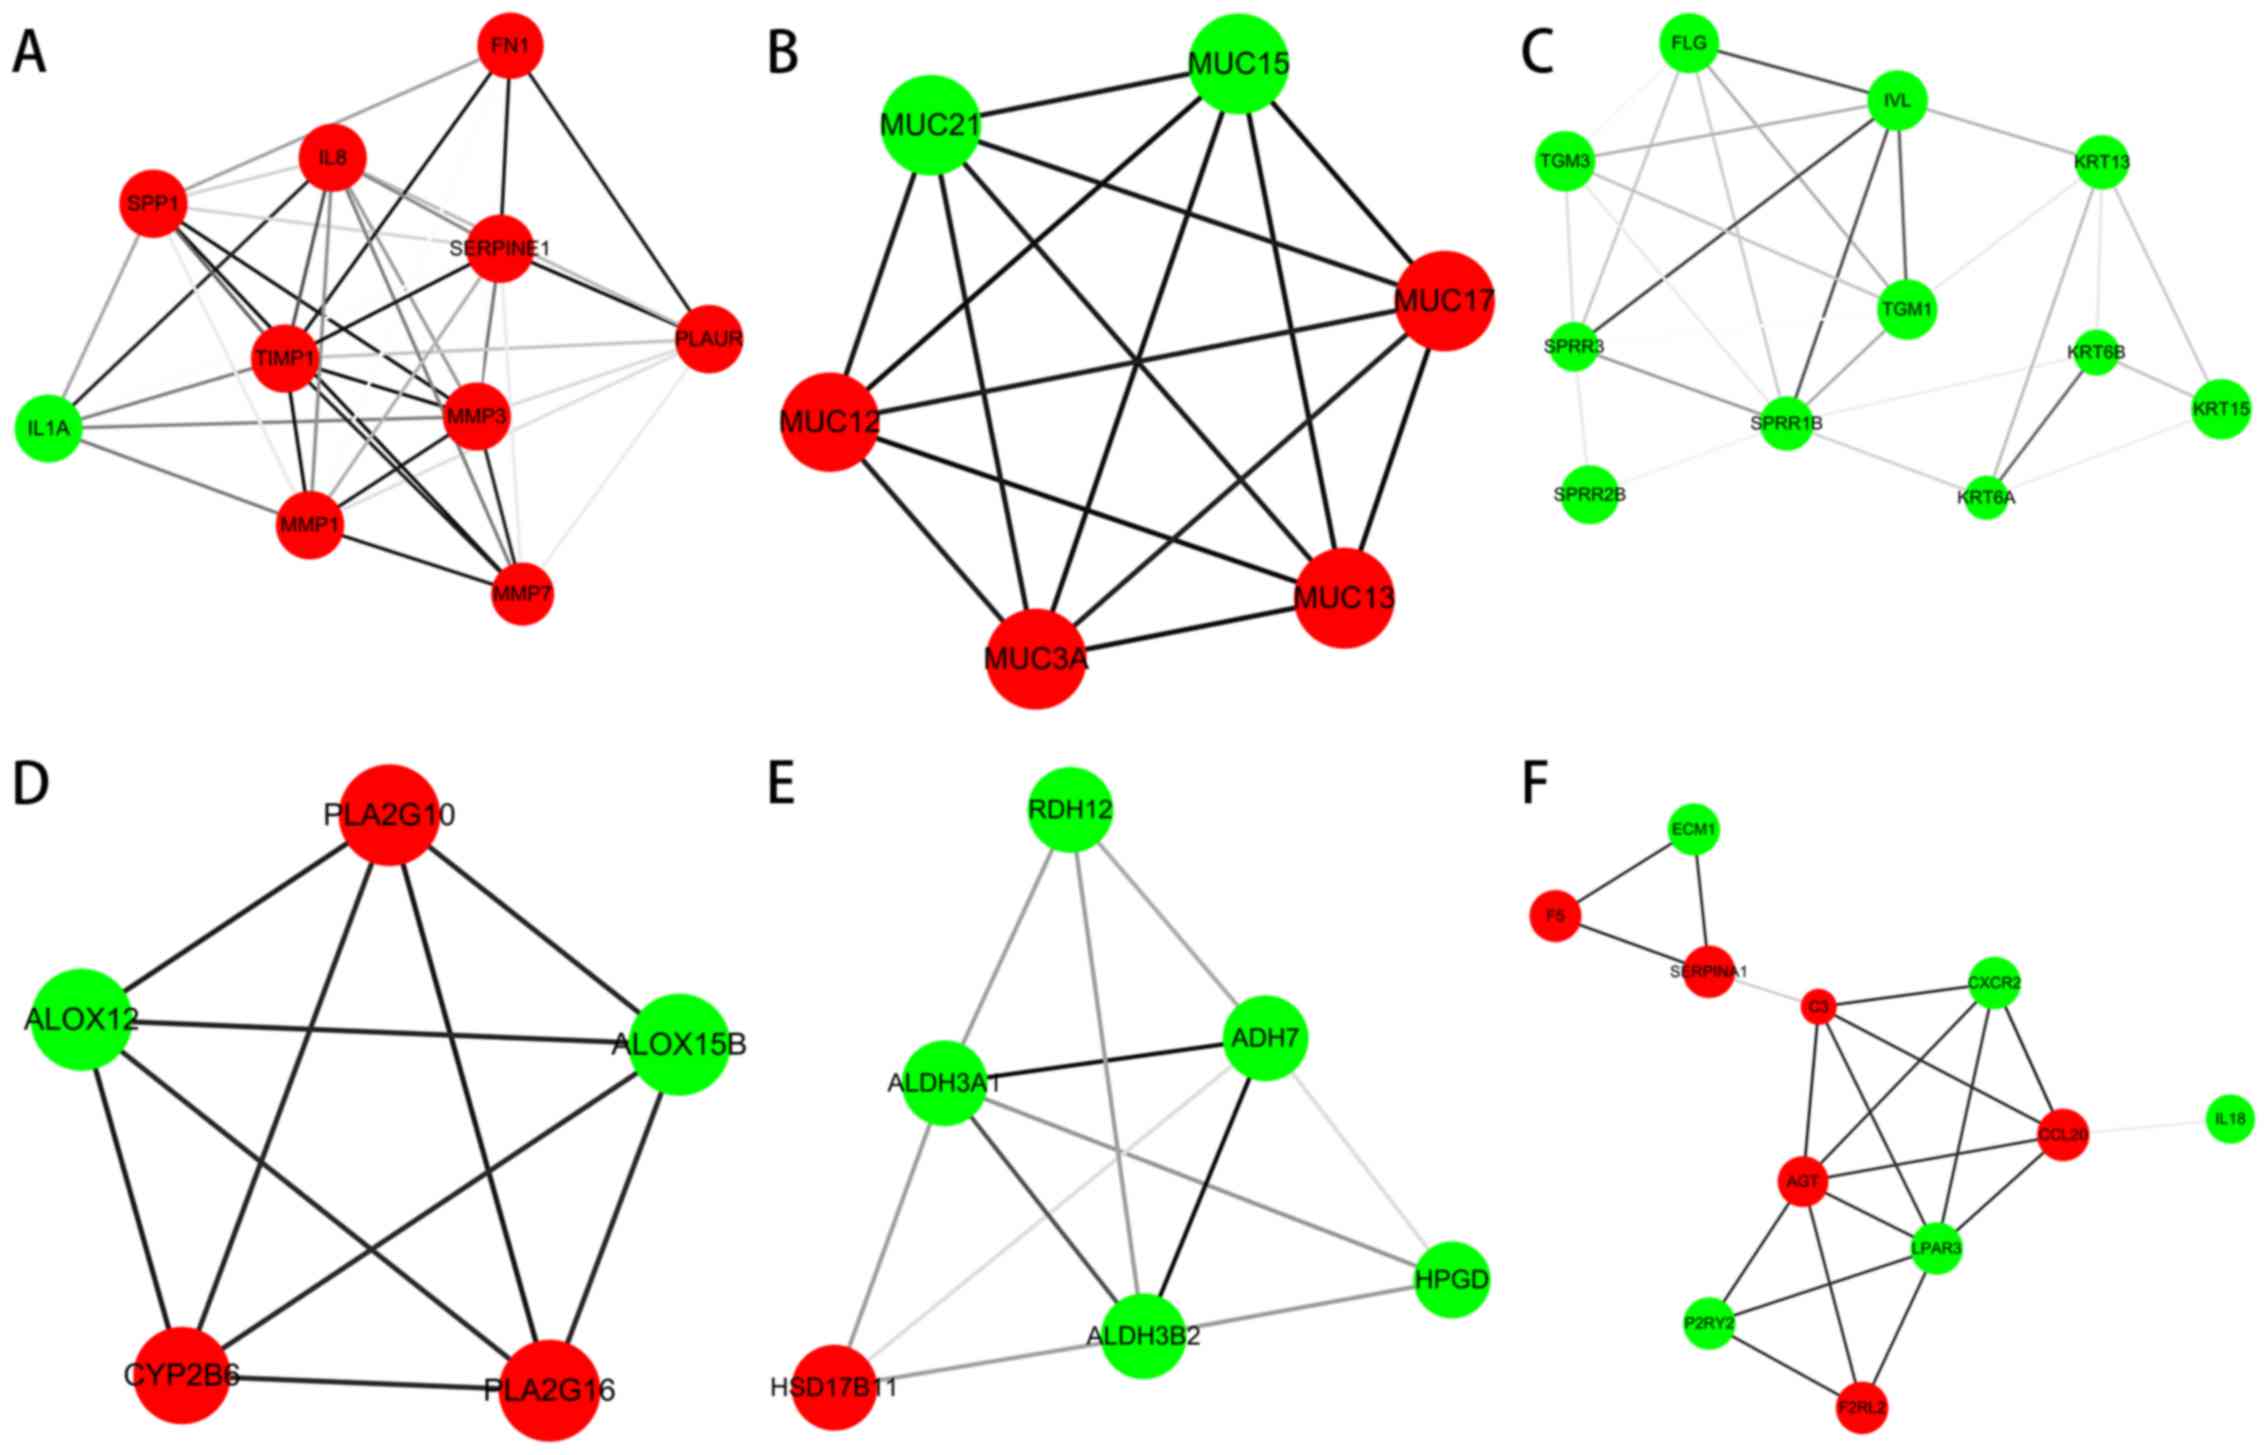
total of 6 modules from the PPI network satisfied the criteria of
an MCODE computed node score >4 and number of nodes >4. The
results are presented in Fig. 3. The
functional annotation of the DEGs involved in the modules was
determined using DAVID. The results showed that the module DEGs
were enriched in 66 GO terms and 9 KEGG pathways. The GO functions
enriched for the module DEGs were mainly within the extracellular
exosome (P=1.27×10⁻⁸), extracellular region
(P=8.63×10⁻¹¹) and extracellular space
(P=1.21×10⁻⁷). KEGG pathways enriched for the module
DEGs were mainly within arachidonic acid metabolism
(P=1.02×10⁻⁴), complement and coagulation cascades
(P=1.56×10⁻⁴), and rheumatoid arthritis
(P=3.98×10⁻⁴). The top 10 terms of the GO and KEGG
enrichment analyses for module DEGs are presented in Table III.
| Table III.GO and KEGG enrichment analyses of
the differentially expressed genes in the modules. |
Table III.
GO and KEGG enrichment analyses of
the differentially expressed genes in the modules.
| Category | Term | Count | P-value |
|---|
|
GOTERM_CC_DIRECT | GO:0005576
extracellular region | 22 |
8.63×10⁻¹¹ |
|
GOTERM_BP_DIRECT | GO:0018149 peptide
cross-linking | 7 |
5.00×10⁻⁹ |
|
GOTERM_CC_DIRECT | GO:0070062
extracellular exosome | 25 |
1.27×10⁻⁸ |
|
GOTERM_BP_DIRECT | GO:0030216
keratinocyte differentiation | 7 |
6.52×10⁻⁸ |
|
GOTERM_CC_DIRECT | GO:0005615
extracellular space | 17 |
1.21×10⁻⁷ |
|
GOTERM_BP_DIRECT | GO:0031424
keratinization | 6 |
2.16×10⁻⁷ |
|
GOTERM_BP_DIRECT | GO:0016266 O-glycan
processing | 6 |
6.72×10⁻⁷ |
|
GOTERM_BP_DIRECT | GO:0022617
extracellular matrix disassembly | 6 |
2.20×10⁻⁶ |
|
GOTERM_MF_DIRECT | GO:0005198
structural molecule activity | 8 |
3.19×10⁻⁶ |
|
GOTERM_CC_DIRECT | GO:0005796 Golgi
lumen | 6 |
4.70×10⁻⁶ |
| KEGG_PATHWAY | hsa00590
Arachidonic acid metabolism | 5 |
1.02×10⁻⁴ |
| KEGG_PATHWAY | hsa04610 Complement
and coagulation cascades | 5 |
1.56×10⁻⁴ |
| KEGG_PATHWAY | hsa05323 Rheumatoid
arthritis | 5 |
3.98×10⁻⁴ |
| KEGG_PATHWAY | hsa00982 Drug
metabolism - cytochrome P450 | 4 | 0.002504 |
| KEGG_PATHWAY | hsa00980 Metabolism
of xenobiotics by cytochrome P450 | 4 | 0.003187 |
| KEGG_PATHWAY | hsa00350 Tyrosine
metabolism | 3 | 0.008675 |
| KEGG_PATHWAY | hsa00830 Retinol
metabolism | 3 | 0.028145 |
| KEGG_PATHWAY | hsa00010
Glycolysis/Gluconeogenesis | 3 | 0.02977 |
| KEGG_PATHWAY | hsa05204 Chemical
carcinogenesis | 3 | 0.041201 |
Discussion
EAC is one of the most common subtypes of esophageal
cancer (17), and only ~19% of
patients survive 5 year after diagnosis in the United States
(1). Therefore, there is a need to
screen for key genes and pathways that are associated with the
progression of EAC, with the aim of improving its diagnosis and
treatment.
The present study used bioinformatics analysis to
identify the DEGs between EAC and normal tissue expression
profiles. The results revealed that the expression of 386 genes was
significantly altered in EAC samples (150 upregulated and 236
downregulated genes) compared with in the normal controls. A PPI
network was constructed to reveal the associations between these
genes. The top 10 genes with the highest degrees were identified.
Furthermore, 6 modules were selected according to their respective
MCODE computed node scores (>4), and their functions were
determined by GO and KEGG pathway analyses.
The GO functions enriched for the upregulated DEGs
were mainly within the extracellular exosome, extracellular space
and extracellular region. KEGG pathways enriched for the
upregulated DEGs were mainly within complement and coagulation
cascades, maturity onset diabetes of the young and protein
digestion and absorption. The GO functions enriched for the
downregulated DEGs were mainly within the extracellular exosome,
epidermis development and keratinocyte differentiation. KEGG
pathways enriched for the downregulated DEGs were mainly within
amoebiasis, retinol metabolism and drug metabolism-cytochrome P450.
Previous study has demonstrated that activation of the coagulation
cascade affected tumor development (18). The underlying mechanism through which
coagulation cascade proteins promote tumorigenesis remains unclear.
Therefore, investigating these identified signaling pathways may
aid to elucidate the carcinogenic mechanism behind EAC.
Based on the results of PPI network construction for
the DEGs, a number of hub nodes were identified. The top 10 hub
nodes with the highest degrees were IL8, IVL, TIMP1, FN1, SERPINE1,
SERPINA1, CFTR, SPP1, COL1A1 and AGT. IL8, also named C-X-C motif
(CXC) chemokine ligand 8, is a chemokine that mainly attracts
inflammatory leukocyte infiltrate by acting on CXC chemokine
receptor 1/2. Recent speculations propose that IL8 serves important
roles in angiogenesis and survival signaling for cancer stem cells,
and that the interleukin may stimulate the secretion of local
growth factors in malignant tumors (19). IL8 stimulation on endothelial cells
has been reported to begin angiogenic processes characterized by
secretion of matrix metalloproteinases (MMPs), which can break down
the extracellular matrix and stimulate the formation of new vessels
(20). One study reported that IL8
was significantly upregulated in esophageal carcinogenesis, being
detected in the serum of patients with esophageal adenocarcinoma
(21). IVL is a squamous cell
differentiation marker, and is associated with terminal
differentiation of epithelial cells (22,23). Upon
IL4 stimulation, the overall esophageal epithelia still contained
stratified morphology. However, IVL was significantly decreased in
esophageal basal and suprabasal layers, which was associated with a
disorganized morphology of stratified layers on the basal side
(24). TIMP1 is an inhibitor of
matrix metalloproteinases, which has a key role in cancer cell
dissemination and endothelial cell migration in angiogenesis
(25). High serum levels of TIMP1
have been associated with tumor progression and poor prognosis in
esophageal cancer patients (26).
FN1, a mesenchymal marker (27), is
an extracellular matrix glycoprotein that serves key roles in cell
differentiation, growth and migration; through which it is
associated with certain processes including wound healing,
embryonic development and carcinogenesis (28). SERPINE1, also known as plasminogen
activator inhibitor-1, is involved in the inhibition of
urokinase-type plasminogen activator (29). It serves important roles in increasing
tumor invasion and angiogenesis, and has been correlated with a
poor prognosis (30). A high tumor
level of plasminogen activator inhibitor-1 in patients with primary
breast cancer is reportedly suggestive of poor prognosis (31), through this association requires
verification in EAC. SERPINA1 encodes for α1-antitrypsin, which
targets several proteases, including elastase, plasmin, thrombin,
trypsin, chymotrypsin, and plasminogen activator (32). One study suggested that α1-antitrypsin
may be involved in lung adenocarcinoma metastasis by targeting
fibronectin (33). CFTR encodes an
ATP-binding cassette membrane protein that functions as a chloride
channel, and is mutated in cystic fibrosis (34,35). A
previous large-scale meta-analysis suggested that the novel single
nucleotide polymorphism (SNP) rs17451754, which is located within
intron 21 of the CFTR gene, markedly associates with the risk of
Barrett's esophagus and EAC (36).
This region is reportedly involved with the enhancer histone
modifications in the gastrointestinal tract mucosa and DNAse
hypersensitivity (37). SPP1, also
known as OPN, encodes a protein that binds hydroxyapatite, and is a
cytokine that upregulates interferon-γ and IL12 (38). A previous study reported that SPP1
isoforms collectively enhanced tumor cell invasion and
dissemination in EAC (8). COL1A1
encodes the pro-α1 chains of type I collagen. It has been reported
COL1A1 is overexpressed in many tumours, including gastric cancer,
hepatocellular carcinoma, non-small cell lung cancer, and
colorectal cancer (39–42). One study suggested that COL1A1 may
promote metastasis in colorectal cancer by regulating the
Wnt/planar cell polarity pathway (39). AGT is involved in the
renin-angiotensin system (RAS). Previous study reported that RAS
participated in the physiological control of esophageal motor
activity (43). Together with these
previous findings, the present results are suggestive that RAS may
be involved in the contraction disorder of esophageal
adenocarcinoma.
A total of 6 modules from the PPI network satisfied
the criteria of MCODE score >4 and number of nodes >4. The GO
functions enriched for the module DEGs were mainly within the
extracellular exosome, extracellular region and extracellular
space. KEGG pathways enriched for the module DEGs were mainly in
arachidonic acid metabolism, complement and coagulation cascades
and rheumatoid arthritis. A previous study suggested that the
activated arachidonic acid metabolism pathway serves an important
role in tumorigenesis (44). The
enzymes activated by this pathway and their products promote the
inflammatory response and have been implicated in multiple cellular
processes, including cell proliferation, invasion and metastasis,
and thus may promote tumorigenesis. Additionally, previous study
has demonstrated that activation of the coagulation cascade
affected tumor development (18).
Therefore, the arachidonic acid metabolism and complement and
coagulation cascades pathways may be involved in the development of
EAC.
In conclusion, the present study identified the
genes differentially expressed between EAC and normal samples. The
top most altered DEGs included IL8, IVL, TIMP1, FN1, SERPINE1,
SERPINA1, CFTR, SPP1, COL1A1 and AGT, and the pathways of
arachidonic acid metabolism, complement and coagulation cascades,
and rheumatoid arthritis may potentially be used as diagnostic and
therapeutic targets in EAC. However, the present study is limited
to an extent due to the small sample size and lack of experimental
validation. Further experimental confirmation of the expression
profile in EAC by immunoblotting or immunohistochemical staining is
therefore required to validate the current findings.
Acknowledgements
Not applicable.
Funding
Not applicable.
Availability of data and materials
The datasets used during the current study are
available in the Gene Expression Omnibus database (accession no.
GSE92396; http://www.ncbi.nlm.nih.gov/geo/query/acc.cgi?acc=GSE92396).
Authors' contributions
FH and BA designed the study. FH and LT analyzed and
interpreted the data. FH was primarily responsible for writing the
manuscript. All authors reviewed and approved the final
manuscript.
Ethics approval and consent to
participate
Not applicable.
Consent for publication
Not applicable.
Competing interests
The authors declare that they have no competing
interests.
Glossary
Abbreviations
Abbreviations:
|
EAC
|
esophageal adenocarcinoma
|
|
GEO
|
Gene Expression Omnibus
|
|
DEGs
|
differentially expressed genes
|
|
PPI
|
protein-protein interaction
|
|
GO
|
gene ontology
|
|
KEGG
|
Kyoto Encyclopedia of Genes and
Genomes
|
|
FC
|
fold-change
|
|
DAVID
|
Database for Annotation, Visualization
and Integrated Discovery
|
|
IL
|
interleukin
|
|
IVL
|
involucrin
|
|
TIMP1
|
tissue inhibitor of metalloproteinase
1
|
|
FN1
|
fibronectin 1
|
|
SERPINE1
|
serpin family E member 1
|
|
SERPINA1
|
serpin family A member 1
|
|
CFTR
|
cystic fibrosis transmembrane
conductance regulator
|
|
SPP1
|
secreted phosphoprotein 1
|
|
COL1A1
|
collagen type I alpha 1 chain
|
|
AGT
|
angiotensinogen
|
|
OPN
|
osteopontin
|
|
CXC
|
C-X-C motif
|
|
RAS
|
renin-angiotensin system
|
References
|
1
|
Siegel RL, Miller KD and Jemal A: Cancer
statistics, 2016. CA Cancer J Clin. 66:7–30. 2016. View Article : Google Scholar : PubMed/NCBI
|
|
2
|
Reid BJ, Li X, Galipeau PC and Vaughan TL:
Barrett's oesophagus and oesophageal adenocarcinoma: Time for a new
synthesis. Nat Rev Cancer. 10:87–101. 2010. View Article : Google Scholar : PubMed/NCBI
|
|
3
|
Cowie A, Noble F and Underwood T:
Strategies to improve outcomes in esophageal adenocarcinoma. Expert
Rev Anticancer Ther. 14:677–687. 2014. View Article : Google Scholar : PubMed/NCBI
|
|
4
|
Kalatskaya I: Overview of major molecular
alterations during progression from Barrett's esophagus to
esophageal adenocarcinoma. Ann NY Acad Sci. 1381:74–91. 2016.
View Article : Google Scholar : PubMed/NCBI
|
|
5
|
Ten Kate FJ, Suzuki L, Dorssers LC,
Dinjens WN, Jones DT, Nieboer D, Doukas M, Van Lanschot JJ,
Wijnhoven BP, Looijenga LH, et al: Pattern of p53 protein
expression is predictive for survival in chemoradiotherapy-naive
esophageal adenocarcinoma. Oncotarget. 8:104123–104135.
2017.PubMed/NCBI
|
|
6
|
Buas MF, Levine DM, Makar KW, Utsugi H,
Onstad L, Li X, Galipeau PC, Shaheen NJ, Hardie LJ, Romero Y, et
al: Integrative post-genome-wide association analysis of CDKN2A and
TP53 SNPs and risk of esophageal adenocarcinoma. Carcinogenesis.
35:2740–2747. 2014. View Article : Google Scholar : PubMed/NCBI
|
|
7
|
Wang L, Jin JQ, Zhou Y, Tian Z, Jablons DM
and He B: Gli is activated and promotes epithelial-mesenchymal
transition in human esophageal adenocarcinoma. Oncotarget.
9:853–865. 2017.PubMed/NCBI
|
|
8
|
Lin J, Myers AL, Wang Z, Nancarrow DJ,
Ferrer-Torres D, Handlogten A, Leverenz K, Bao J, Thomas DG, Wang
TD, et al: Osteopontin (OPN/SPP1) isoforms collectively enhance
tumor cell invasion and dissemination in esophageal adenocarcinoma.
Oncotarget. 6:22239–22257. 2015.PubMed/NCBI
|
|
9
|
Han DY, Fu D, Xi H, Li QY, Feng LJ, Zhang
W, Ji G, Xiao JC and Wei Q: Genomic expression profiling and
bioinformatics analysis of pancreatic cancer. Mol Med Rep.
12:4133–4140. 2015. View Article : Google Scholar : PubMed/NCBI
|
|
10
|
Zhang C, Peng L, Zhang Y, Liu Z, Li W,
Chen S and Li G: The identification of key genes and pathways in
hepatocellular carcinoma by bioinformatics analysis of
high-throughput data. Med Oncol. 34:1012017. View Article : Google Scholar : PubMed/NCBI
|
|
11
|
Peng D, Guo Y, Chen H, Zhao S, Washington
K, Hu T, Shyr Y and El-Rifai W: Integrated molecular analysis
reveals complex interactions between genomic and epigenomic
alterations in esophageal adenocarcinomas. Sci Rep. 7:407292017.
View Article : Google Scholar : PubMed/NCBI
|
|
12
|
Gentleman R: Bioinformatics and
Computational Biology Solutions Using R and Bioconductor. Springer
Science+Business Media; New York: 2005, View Article : Google Scholar
|
|
13
|
Carvalho B, Bengtsson H, Speed TP and
Irizarry RA: Exploration, normalization, and genotype calls of
high-density oligonucleotide SNP array data. Biostatistics.
8:485–499. 2007. View Article : Google Scholar : PubMed/NCBI
|
|
14
|
Smyth GK: Linear models and empirical
bayes methods for assessing differential expression in microarray
experiments. Stat Appl Genet Mol Biol. 3:1–25. 2004. View Article : Google Scholar
|
|
15
|
Bader GD and Hogue CW: An automated method
for finding molecular complexes in large protein interaction
networks. BMC Bioinformatics. 4:22003. View Article : Google Scholar : PubMed/NCBI
|
|
16
|
Scardoni G, Tosadori G, Faizan M, Spoto F,
Fabbri F and Laudanna C: Biological network analysis with
CentiScaPe: Centralities and experimental dataset integration.
F1000Res. 3:1392014.PubMed/NCBI
|
|
17
|
Coleman HG, Xie SH and Lagergren J: The
epidemiology of esophageal adenocarcinoma. Gastroenterology.
154:390–405. 2018. View Article : Google Scholar : PubMed/NCBI
|
|
18
|
Guglietta S and Rescigno M:
Hypercoagulation and complement: Connected players in tumor
development and metastases. Semin Immunol. 28:578–586. 2016.
View Article : Google Scholar : PubMed/NCBI
|
|
19
|
Alfaro C, Sanmamed MF, Rodríguez-Ruiz ME,
Teijeira Á, Oñate C, González Á, Ponz M, Schalper KA, Pérez-Gracia
JL and Melero I: Interleukin-8 in cancer pathogenesis, treatment
and follow-up. Cancer Treat Rev. 60:24–31. 2017. View Article : Google Scholar : PubMed/NCBI
|
|
20
|
Li A, Varney ML, Valasek J, Godfrey M,
Dave BJ and Singh RK: Autocrine role of interleukin-8 in induction
of endothelial cell proliferation, survival, migration and MMP-2
production and angiogenesis. Angiogenesis. 8:63–71. 2005.
View Article : Google Scholar : PubMed/NCBI
|
|
21
|
Shrivastava MS, Hussain Z, Giricz O,
Shenoy N, Polineni R, Maitra A and Verma A: Targeting chemokine
pathways in esophageal adenocarcinoma. Cell Cycle. 13:3320–3327.
2014. View Article : Google Scholar : PubMed/NCBI
|
|
22
|
Xiaoyun X, Chaofei H, Weiqi Z, Chen C,
Lixia L, Queping L, Cong P, Shuang Z, Juan S and Xiang C: Possible
involvement of F1F0-ATP synthase and intracellular ATP in
keratinocyte differentiation in normal skin and skin lesions. Sci
Rep. 7:426722017. View Article : Google Scholar : PubMed/NCBI
|
|
23
|
Bernard BA, Asselineau D,
Schaffar-Deshayes L and Darmon MY: Abnormal sequence of expression
of differentiation markers in psoriatic epidermis: Inversion of two
steps in the differentiation program? J Invest Dermatol.
90:801–805. 1988. View Article : Google Scholar : PubMed/NCBI
|
|
24
|
Shan J, Oshima T, Farre R, Fukui H, Watari
J and Miwa H: IL-4 induces columnar-like differentiation of
esophageal squamous epithelium through JAK/PI3K pathway: Possible
role in pathogenesis of Barrett's esophagus. Am J Physiol
Gastrointest Liver Physiol. 306:G641–G649. 2014. View Article : Google Scholar : PubMed/NCBI
|
|
25
|
Jackson HW, Defamie V, Waterhouse P and
Khokha R: TIMPs: Versatile extracellular regulators in cancer. Nat
Rev Cancer. 17:38–53. 2017. View Article : Google Scholar : PubMed/NCBI
|
|
26
|
Kozłowski M, Laudański W, Mroczko B,
Szmitkowski M, Milewski R and Łapuć G: Serum tissue inhibitor of
metalloproteinase 1 (TIMP-1) and vascular endothelial growth factor
A (VEGF-A) are associated with prognosis in esophageal cancer
patients. Adv Med Sci. 58:227–234. 2013. View Article : Google Scholar : PubMed/NCBI
|
|
27
|
Tian L, Lu ZP, Cai BB, Zhao LT, Qian D, Xu
QC, Wu PF, Zhu Y, Zhang JJ, Du Q, et al: Activation of pancreatic
stellate cells involves an EMT-like process. Int J Oncol.
48:783–792. 2016. View Article : Google Scholar : PubMed/NCBI
|
|
28
|
Pankov R and Yamada KM: Fibronectin at a
glance. J Cell Sci. 115:3861–3863. 2002. View Article : Google Scholar : PubMed/NCBI
|
|
29
|
McMahon B and Kwaan HC: The plasminogen
activator system and cancer. Pathophysiol Haemost Thromb.
36:184–194. 2008. View Article : Google Scholar : PubMed/NCBI
|
|
30
|
Placencio VR and DeClerck YA: Plasminogen
activator inhibitor-1 in cancer: Rationale and insight for future
therapeutic testing. Cancer Res. 75:2969–2974. 2015. View Article : Google Scholar : PubMed/NCBI
|
|
31
|
Jänicke F, Schmitt M and Graeff H:
Clinical relevance of the urokinase-type and tissue-type
plasminogen activators and of their type 1 inhibitor in breast
cancer. Semin Thromb Hemost. 17:303–312. 1991. View Article : Google Scholar : PubMed/NCBI
|
|
32
|
Ortiz G, Salica JP, Chuluyan EH and Gallo
JE: Diabetic retinopathy: Could the alpha-1 antitrypsin be a
therapeutic option? Biol Res. 47:582014. View Article : Google Scholar : PubMed/NCBI
|
|
33
|
Li Y, Miao L, Yu M, Shi M, Wang Y, Yang J,
Xiao Y and Cai H: α1-antitrypsin promotes lung adenocarcinoma
metastasis through upregulating fibronectin expression. Int J
Oncol. 50:1955–1964. 2017. View Article : Google Scholar : PubMed/NCBI
|
|
34
|
Mutesa L, Azad AK, Verhaeghe C, Segers K,
Vanbellinghen JF, Ngendahayo L, Rusingiza EK, Mutwa PR, Rulisa S,
Koulischer L, et al: Genetic analysis of Rwandan patients with
cystic fibrosis-like symptoms: Identification of novel cystic
fibrosis transmembrane conductance regulator and epithelial sodium
channel gene variants. Chest. 135:1233–1242. 2009. View Article : Google Scholar : PubMed/NCBI
|
|
35
|
Kerem B, Rommens JM, Buchanan JA,
Markiewicz D, Cox TK, Chakravarti A, Buchwald M and Tsui LC:
Identification of the cystic fibrosis gene: Genetic analysis.
Science. 245:1073–1080. 1989. View Article : Google Scholar : PubMed/NCBI
|
|
36
|
Gharahkhani P, Fitzgerald RC, Vaughan TL,
Palles C, Gockel I, Tomlinson I, Buas MF, May A, Gerges C, Anders
M, et al: Barrett's and Esophageal Adenocarcinoma Consortium
(BEACON); Esophageal Adenocarcinoma GenEtics Consortium (EAGLE);
Wellcome Trust Case Control Consortium 2 (WTCCC2): Genome-wide
association studies in oesophageal adenocarcinoma and Barrett's
oesophagus: A large-scale meta-analysis. Lancet Oncol.
17:1363–1373. 2016. View Article : Google Scholar : PubMed/NCBI
|
|
37
|
Ward LD and Kellis M: HaploReg: A resource
for exploring chromatin states, conservation, and regulatory motif
alterations within sets of genetically linked variants. Nucleic
Acids Res. 40:D930–D934. 2012. View Article : Google Scholar : PubMed/NCBI
|
|
38
|
Rittling SR and Singh R: Osteopontin in
immune-mediated diseases. J Dent Res. 94:1638–1645. 2015.
View Article : Google Scholar : PubMed/NCBI
|
|
39
|
Zhang Z, Wang Y, Zhang J, Zhong J and Yang
R: COL1A1 promotes metastasis in colorectal cancer by regulating
the WNT/PCP pathway. Mol Med Rep. 17:5037–5042. 2018.PubMed/NCBI
|
|
40
|
Tian ZQ, Li ZH, Wen SW, Zhang YF, Li Y,
Cheng JG and Wang GY: Identification of commonly dysregulated genes
in non-small-cell lung cancer by integrated analysis of microarray
data and qRT-PCR validation. Hai. 193:583–592. 2015.
|
|
41
|
Song Y, Kim SH, Kim KM, Choi EK, Kim J and
Seo HR: Activated hepatic stellate cells play pivotal roles in
hepatocellular carcinoma cell chemoresistance and migration in
multicellular tumor spheroids. Sci Rep. 6:367502016. View Article : Google Scholar : PubMed/NCBI
|
|
42
|
Li J, Ding Y and Li A: Identification of
COL1A1 and COL1A2 as candidate prognostic factors in gastric
cancer. World J Surg Oncol. 14:2972016. View Article : Google Scholar : PubMed/NCBI
|
|
43
|
Casselbrant A, Edebo A, Wennerblom J,
Lönroth H, Helander HF, Vieth M, Lundell L and Fändriks L: Actions
by angiotensin II on esophageal contractility in humans.
Gastroenterology. 132:249–260. 2007. View Article : Google Scholar : PubMed/NCBI
|
|
44
|
Wang D and Dubois RN: Eicosanoids and
cancer. Nat Rev Cancer. 10:181–193. 2010. View Article : Google Scholar : PubMed/NCBI
|