Introduction
Oxidative stress is a crucial factor in the
pathogenesis of atherosclerosis. Key cells in this process include
macrophages, which are responsible for production of reactive
oxygen species (ROS). Oxidative burst is a key process performed by
the innate immune system for mitigating infections. During acute
infectious illnesses, inflammatory cells generate increased
quantities of ROS to eliminate the invading pathogen. Subsequently,
a reduction of inflammation is observed, which is accompanied by a
shift from classical to alternative activation of macrophages. This
process is characterized by a reduction in the synthesis of
inflammatory cytokines and ROS and increased synthesis of enzymes
associated with tissue repair and scar formation (1). Low-grade inflammation, which is
accompanied by oxidative stress, is detected in patients suffering
from various diseases including diabetes (2), obesity (3), coronary heart disease (4) and hypertension (5). This condition is frequently associated
with a minute elevation in serum levels of high-sensitivity
C-reactive protein (hsCRP), which is in turn associated with an
increased risk of cardiovascular complications (6). Therapies that pleiotropically reduce
inflammation, such as statins, may reduce levels of CRP (7) and improve cardiovascular outcomes
(8). Additionally, a reduction in
oxidative stress level may be observed, which is accompanied by a
reduction in nicotinamide adenine dinucleotide phosphate (NADPH)
oxidase (p22phox) activity (9,10).
Type 2 diabetes is a growing health problem in
modern societies. Diabetes markedly accelerates the development of
atherosclerosis, which results from increased oxidative stress, the
glycation of proteins and insulin resistance accompanied by
hyperinsulinemia. In the treatment of diabetes, metformin has
become the drug of choice due to its ability to improve insulin
sensitivity and effectively reduce glycemia without a significant
increase in hypoglycemia event rate. In a large multi-center trial
conducted by the UK Prospective Diabetes Study group, metformin
induced a significant reduction in the cardiovascular complications
of patients with diabetes; however, it appeared that the treatment
produced activities other than just hypoglycemic effects (11). This observation may stem from the
attenuation of the inflammatory state and reduced ROS generation
resulting from p22phox, which is a major source of ROS,
or the increased expression of antioxidative enzymes that eliminate
ROS. ROS may damage cellular DNA, and alter proteins (e.g.,
enzymes) and lipids resulting in accelerated atherosclerosis or
carcinogenesis (12,13). The impact of ROS on inflammatory
potential in smooth muscles, endothelial cells and macrophages has
been explored (14). However, the
effect of metformin on the expression of antioxidative enzymes in
human macrophages has not been fully investigated. There are three
primary antioxidative enzymes that regulate ROS. Superoxide
dismutase (SOD) synthesizes H2O2 from highly
reactive peroxides. Excessive H2O2 may be
mitigated by glutathione peroxidase (GPx), which utilizes
glutathione, or by catalase (CAT), which produces water and oxygen
from two molecules of H2O2 (14).
The primary mechanism of action of metformin is
based on the activation of AMP-dependent kinase (AMPK). AMPK is a
serine/threonine kinase involved in cellular metabolism, fatty acid
oxidation and energy expenditure and conservation. Circulating
monocytes/macrophages express AMPK and thus actively participate in
atherogenesis and oxidative stress. In our previous study, it was
demonstrated that metformin induced the alternative
(anti-inflammatory) phenotype in macrophages and reduced oxidative
stress, as indicated by decreased ROS levels, which was accompanied
by increased antioxidative enzyme activity (1). The aim of the present study was to
investigate the influence of metformin on the expression levels of
p22phox (a major source of ROS) and SOD, GPx and CAT
(three enzymes connected with the cellular anti-inflammatory
properties) in human monocytes/macrophages cultured in
vitro.
Materials and methods
Cell culture
A total of 10 healthy volunteers (age, 18–40 years;
5 women and 5 men) were recruited for the study from the Department
of Internal Medicine and Clinical Pharmacology (Medical University
of Silesia, Silesia, Poland) all of whom were nonsmokers and were
taking no medication. The ethical committee of the Medical
University of Silesia accepted the study protocol. Peripheral blood
mononuclear cells were extracted from the patients using Histopaque
density gradient centrifugation (Sigma-Aldrich, St. Louis, MO,
USA), using previously described methods (15). Subsequently, monocytes were isolated
from the peripheral blood mononuclear cells via negative
immunomagnetic separation, using Pan-T and Pan-B Dynabeads
(Invitrogen Dynal AS, Oslo, Norway), according to the
manufacturer's instructions. This procedure enabled the isolation
of inactive monocytes without the use of artificial and
uncontrolled stimulation. The isolated cells were labeled with a
mouse anti-human monoclonal antibody (dilution, 1:100; F0844; Dako
Denmark A/S, Glostrup, Denmark) against the monocyte-specific
positive antigen CD14+. The procedure resulted in an
isolated fraction containing 92% CD14+ cells. Monocytes
were suspended in RPMI-1640 medium supplemented with 10% low
endotoxin fetal calf serum, 2 mM glutamine, 100 U/ml penicillin,
100 mg/ml streptomycin and 10 mg/ml Gibco fungizone (Thermo Fisher
Scientific, Inc., Grand Island, NY, USA). The cells were counted
using a TC-20 automated cell counter (Bio-Rad Laboratories, Inc.,
Hercules, CA, USA). A constant number of cells (106 monocytes per
well) were placed in a plastic 24-well plate (BD Biosciences,
Franklin Lakes, NJ, USA) and left intact for 2 h for adherence.
Then, the medium was changed and cultures were incubated for 72 h,
with a single exchange of medium after the first 24 h. Incubations
were performed in triplicate at 37°C in a humidified atmosphere
containing 5% CO2. The conversion of monocytes into
macrophages was confirmed using polyclonal mouse antibodies against
EMR1 (1:1,000; SAB1405756; Sigma-Aldrich). Following the 72-h
incubation, the supernatant was carefully removed and replaced with
medium supplemented with various combinations of metformin (0.02 or
2 mM; Sigma-Aldrich), compound C (20 µM; Sigma-Aldrich) or
lipopolysaccharide (LPS; 1 µg/ml; Sigma-Aldrich) for 24 h. Certain
cells were pre-incubated with metformin (0.02 or 2 mM) for 2 h to
activate AMPK, then LPS (1 µg/ml) was added for 24 h. Certain cells
were pre-incubated with compound C (20 µM) for 1 h to inhibit AMPK,
then metformin (0.02 or 2 mM) was added. Following an additional 2
h, LPS was administered for 24 h. Compound C, at an initial
concentration of 20 mM, was dissolved in dimethyl sulfoxide (DMSO;
Sigma-Aldrich). A total of nine groups were thus produced, as
follows: Control group (no treatment); LPS group; compound C group;
0.02 mM metformin group; 2.0 mM metformin group; compound C + 2.0
mM metformin group; LPS + 0.02 mM metformin group; LPS + 2.0 mM
metformin group; and the LPS + compound C + 2.0 mM metformin group.
Further dilutions were performed in the aforementioned RPMI medium
and the corresponding quantities of DMSO were added to the control
cultures. The final concentration of DMSO in the medium was ≤0.05%
and, as previously confirmed, did not exert any effects on the
cultured cells (16). Following the
application of the various treatments, the cells were harvested for
further analyses. Each group of experiments was performed in
triplicate (17).
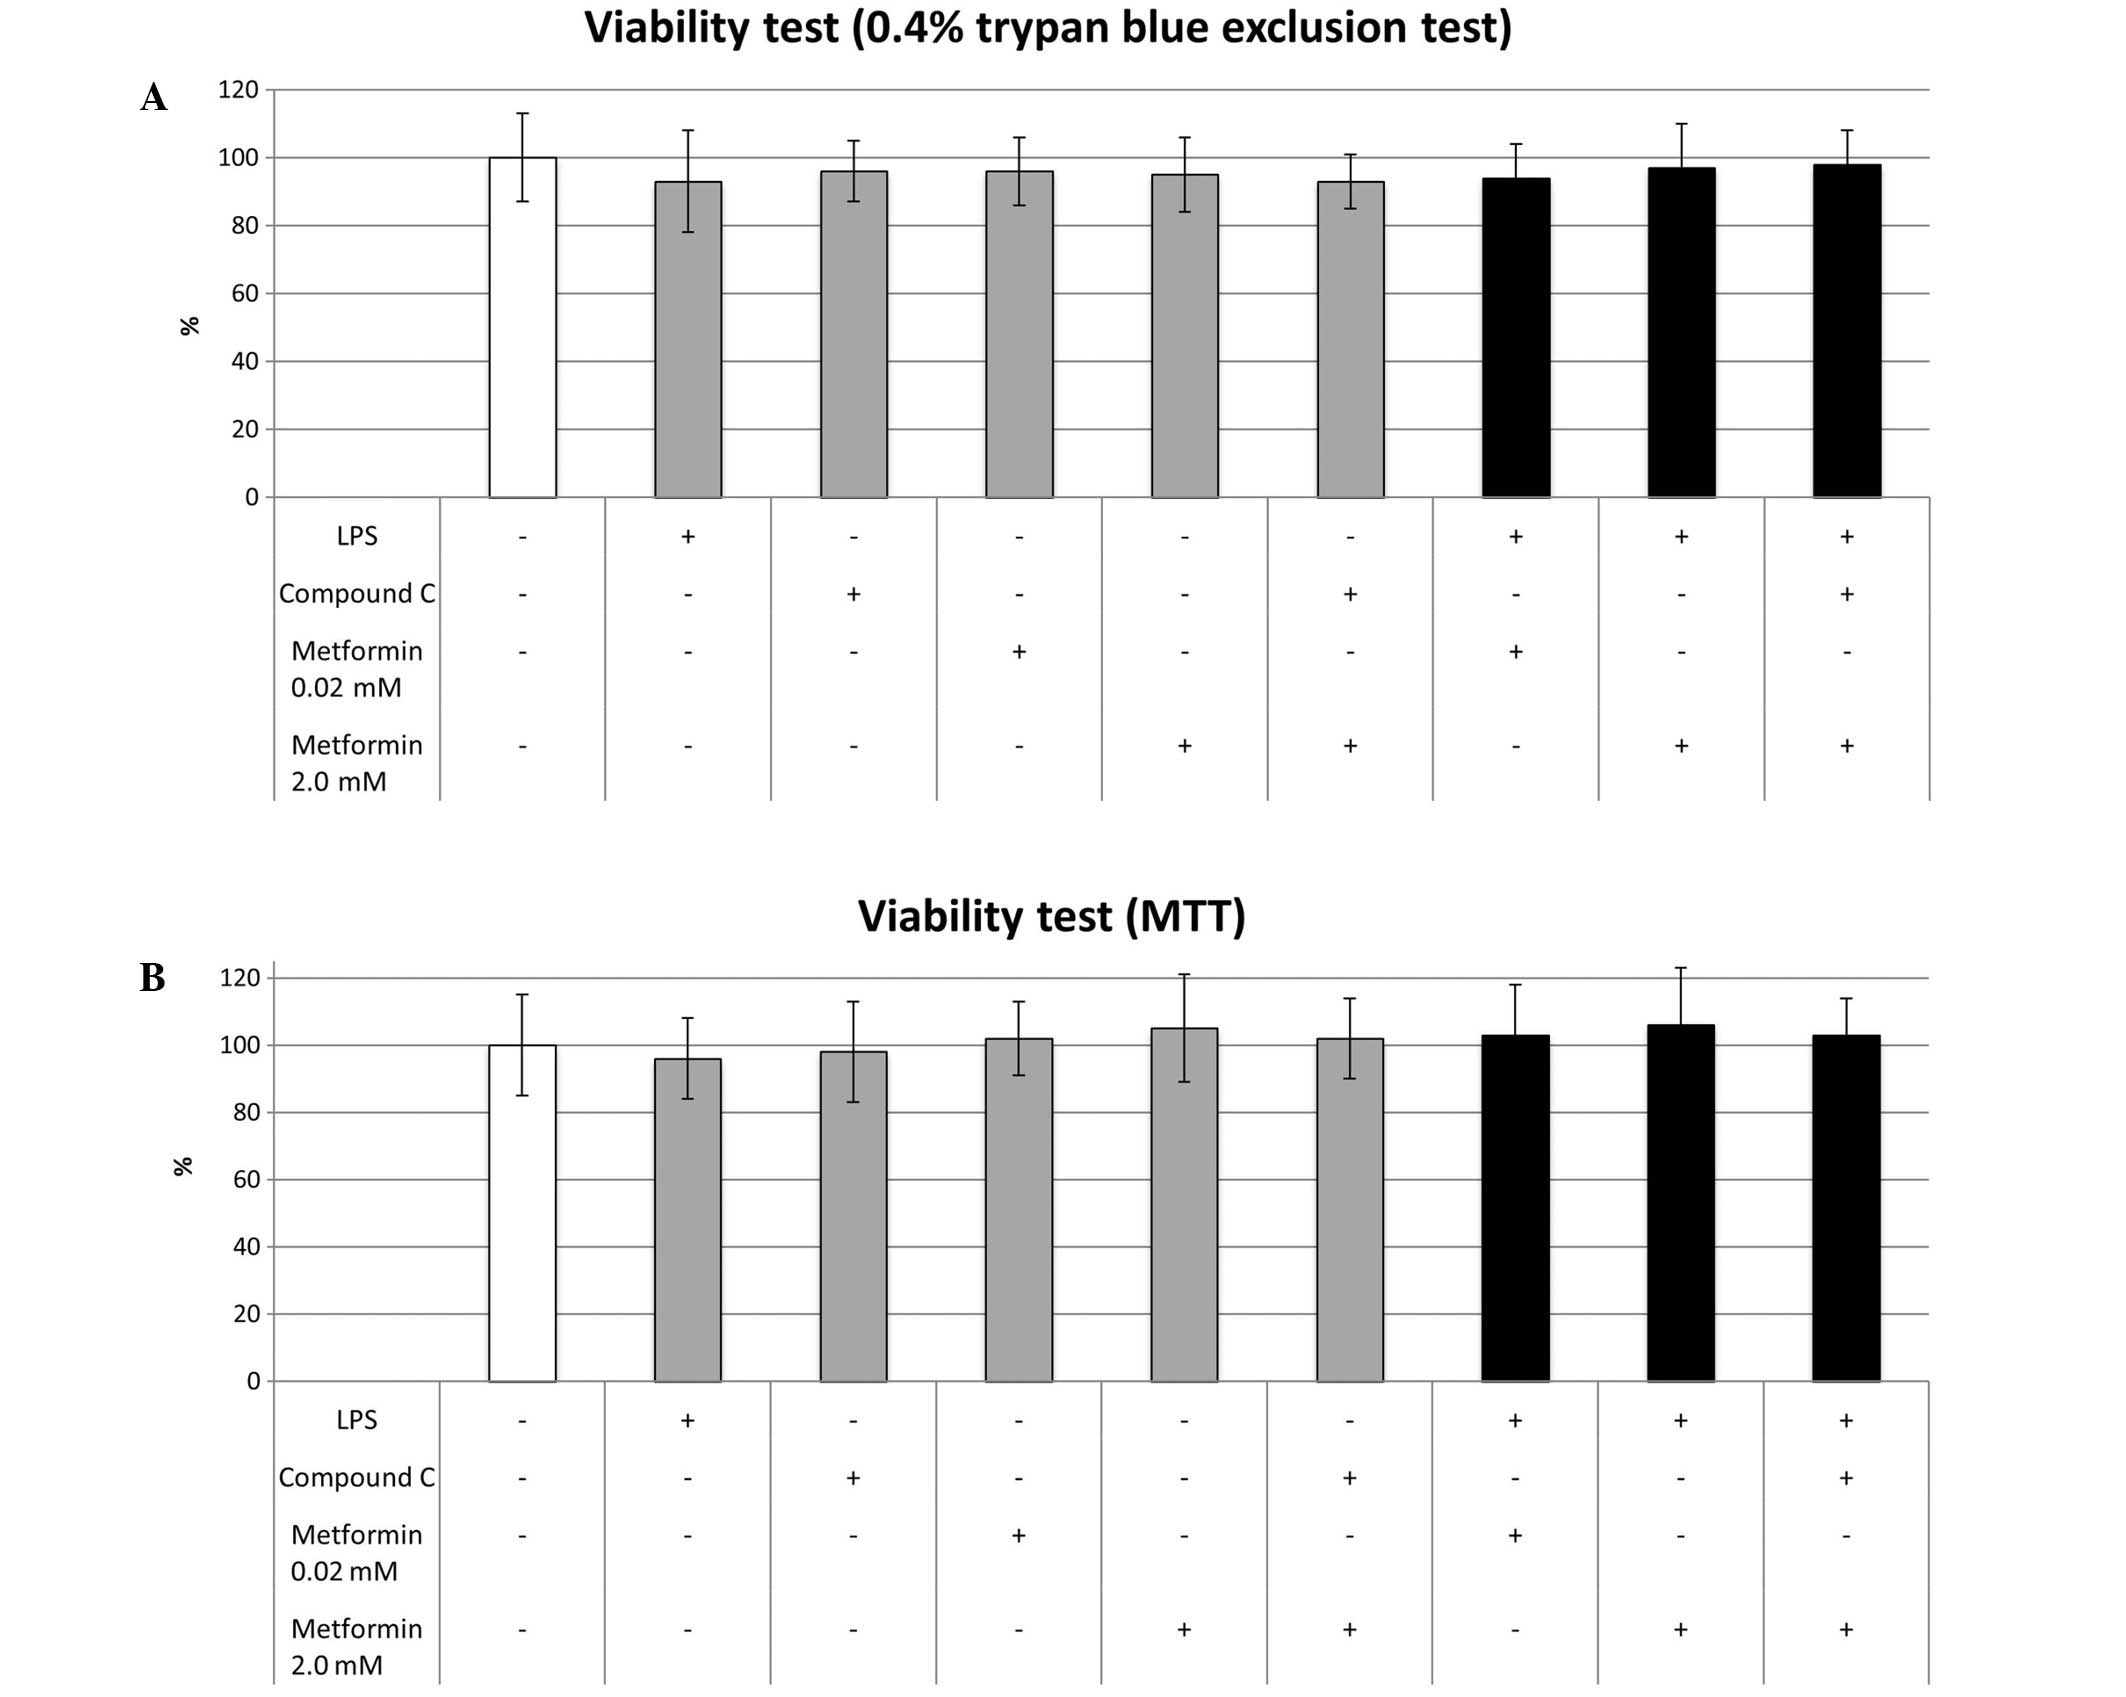
Viability tests
The cell viability was estimated using two tests.
The first was based on a 0.4% trypan blue exclusion test
(Sigma-Aldrich), according to manufacturers guidelines. Briefly,
10-µl aliquots of cultured cells suspended in RPMI medium with no
additions were mixed with 10 µl 0.4% trypan blue. Following
incubation for 3 min at 37°C, the cells were loaded onto a slide
and the viability was assessed using the TC-20 automated cell
counter. The second method involved MTT conversion (1). MTT was added to the medium (at a final
concentration of 2.5 mg/ml) 3 h prior to the scheduled end of the
experiment, then the cultures were incubated at 37°C in 5%
CO2/95% air. At the end of the experiment, after being
washed twice with phosphate-buffered saline, monocytes were lysed
in 100 µl DMSO at room temperature for 10 min in the dark, which
enabled the release of the blue reaction product formazan. Then,
200 µl lysate was transferred to a 96-well plate (Falcon 353072; BD
Biosciences). Absorbance was measured at 570 nm using a microplate
reader (Dynex Technologies, Chantilly, VA, USA) using three
measurements in each of ten independent experiments. The results
are expressed as a percentage of the control.
Reverse transcription-quantitative
polymerase chain reaction (RT-qPCR)
The relative mRNA expression levels of GPx, CAT, SOD
and p22phox were quantified using two-step RT-qPCR normalized
against the expression level of glyceraldehyde 3-phosphate
dehydrogenase (GAPDH) mRNA following 8 h of incubation. Total RNA
was extracted from cells using TriPure Isolation Reagent (Roche
Diagnostics, Basel, Switzerland) according to the manufacturer's
instructions. The concentration and quality of the RNA extracts
were estimated using spectrophotometry at 260 and 280 nm using a
BioPhotometer (Eppendorf AG, Hamburg, Germany). Subsequently, 1 µg
total RNA of each sample was reverse transcribed using an MMLV
Reverse Transcriptase 1st-Strand cDNA Synthesis kit (Epicentre
Technologies, Madison, WI, USA). A final RT reaction volume of 20
µl was diluted 5-fold in order to avoid possible reaction
inhibition by high levels of cDNA. The qPCR was conducted using
Brilliant II SYBR Green QRT-PCR 2-Step Master mix (Agilent
Technologies, Inc., Santa Clara, CA, USA). Reaction mixtures
consisted of 1X master mix, 300 nM of each (forward and reverse)
primer complementary to one of the analyzed genes (GPx, CAT, SOD,
p22phox or GAPDH), respectively, 4 µl cDNA mixture (i.e., an
equivalent of 40 ng total RNA) in a total volume of 25 µl. The
reaction mixtures were analyzed using a LightCycler 480 Real-Time
PCR system (Roche Diagnostics) with a standard two-step thermal
profile for qPCR: 95°C for 2 min, then 40 cycles of 95°C for 15 sec
and 60°C for 30 sec. Following amplification, a melting curve was
plotted for each sample in order to confirm the specificity of the
reaction. Primers used for quantitative analysis were designed
using eprimer3 software produced by European Molecular Biology Open
Software Suite (EMBOSS; http://emboss.bioinformatics.nl/cgi-bin/emboss/eprimer3)
according to the appropriate gene retrieved from the GenBank
database (http://www.ncbi.nlm.nih.gov/genbank/) and were similar
to those used in previous experiments: p22, forward
5′-TCCGGCCTGATCCTCATC-3′ and reverse
5′-AATGGAGTAGGCACCAAAGTACCA-3′; SOD, forward
5′-CTGATTTGGACAAGCAGCAA-3′ and reverse 5′-CTGGACAAACCTCAGCCCTA-3′;
GPx, forward 5′-CGGGACTACACCCAGATGAA-3′ and reverse
5′-TCTCTTCGTTCTTGGCGTTC-3′; CAT, forward
5′-TCAGGCAGAAACTTTTCCATTT-3′ and reverse
5′-TGGGTCGAAGGCTATCTGTT-3′; and GAPDH, forward
5′-GAAGGTGAAGGTCGGAGTC-3′ and reverse 5′-GAAGATGGTGATGGGATTTC-3′)
(18–20). Eprimer3, Primersearch and Water
software were used for primer design and comparisons and are freely
available on the server of the Pasteur Institute (Paris, France
http://mobyle.pasteur.fr) as a part of EMBOSS
(21). Additionally, randomly
selected samples derived from qPCR assays were loaded onto 1.3%
agarose gels (Agagel Mini; Biometra GmbH, Göttingen, Germany) in
order to confirm the specificity of amplification. No other bands
than expected for a particular primer pair were visible.
Protein extraction and western blot
analysis
Total protein concentrations in samples were
determined spectrophotometrically. Bovine serum albumin
preparations (Fermentas, Glen Burnie, MD, USA) were used for
calculation of the standard curve. Equal quantities of total
protein (50 µg) mixed 1:1 with 2X sample buffer (25% glycerol, 2%
sodium dodecyl sulfate and 0.02% bromophenol blue) were boiled for
6 min and loaded onto a 10% SDS-polyacrylamide gel (Sigma-Aldrich).
Electrophoresis was performed at 180 V (constant voltage) until the
bromophenol blue dye reached the end of the gel. Following
electrophoresis, the stacking gels were removed and resolved, and
sample gels were directly subjected to western blot analysis. After
separation in polyacrylamide gels, the aliquots were transferred to
polyvinylidene fluoride membranes (Pall Poland Ltd., Warszawa,
Poland). Nonspecific antibody binding was inhibited by incubation
in 20 mM Tris-buffered saline (pH 7.5) with 0.1% Tween 20 (TBST)
containing 5% non-fat dried milk for 1 h at room temperature.
Polyclonal antibodies against: p22phox, GPx, CAT and SOD were
obtained from Sigma-Aldrich. The antibodies were diluted in TBST
containing 5% skimmed milk. The membranes were incubated with the
antibodies overnight at 4°C, washed with TBST, incubated at room
temperature for 60 min with the appropriate goat anti-rabbit
(1706518) and goat anti-mouse (1706520) alkaline phosphatase
(AP)-conjugated secondary antibodies (1:1,000; Bio-Rad Laboratories
Inc.) and washed twice with TBST for 5 min and once with 20 mM
Tris-buffered saline (pH 7.8) for 5 min. In each assay, the colored
precipitates were developed directly on the membrane using
AP-chromogenic substrates (Bio-Rad Laboratories, Inc.). All
membranes were photocopied and subjected to further analysis. The
molecular weights of GPx, CAT, SOD and p22phox were confirmed
according to their protein markers (PageRuler Unstained Protein
Ladder; Fermentas). To control for the quantities of cytosolic
proteins loaded in each lane, α-actin was detected in parallel
using anti-α-actin antibodies (1:5,000; ab8227; Abcam, Cambridge,
MA, USA). The integrated optical density (IOD) of signals was
semi-quantified using Image-Pro Plus software, version 3.0 (Media
Cybernetics, Inc., Rockville, MD, USA) and is expressed as the
ratio of the IOD for the tested proteins to the IOD for α-actin.
The experiment was repeated three times, and the relative density
values were subjected to statistical analysis.
Statistical analysis
Results are expressed as the mean ± standard
deviation. The normality of distribution was tested using
Shapiro-Wilk's test. Statistical analysis of the data was performed
using one-way analysis of variance followed by the post-hoc Tukey's
significant difference test or Kruskal-Wallis test with
Mann-Whitney tests according to the distribution of variables. The
Bonferroni adjustment was applied for multiple comparisons.
P<0.05 was considered to indicate a statistically significant
difference. Statistical analysis was performed using a SPSS
software, version 16.0 (SPSS, Inc., Chicago, IL, USA).
Results
LPS, compound C and metformin do not
affect cell viability
No significant differences in cell viability were
observed among the cultures regardless of the reagents with which
they were treated (Fig. 1).
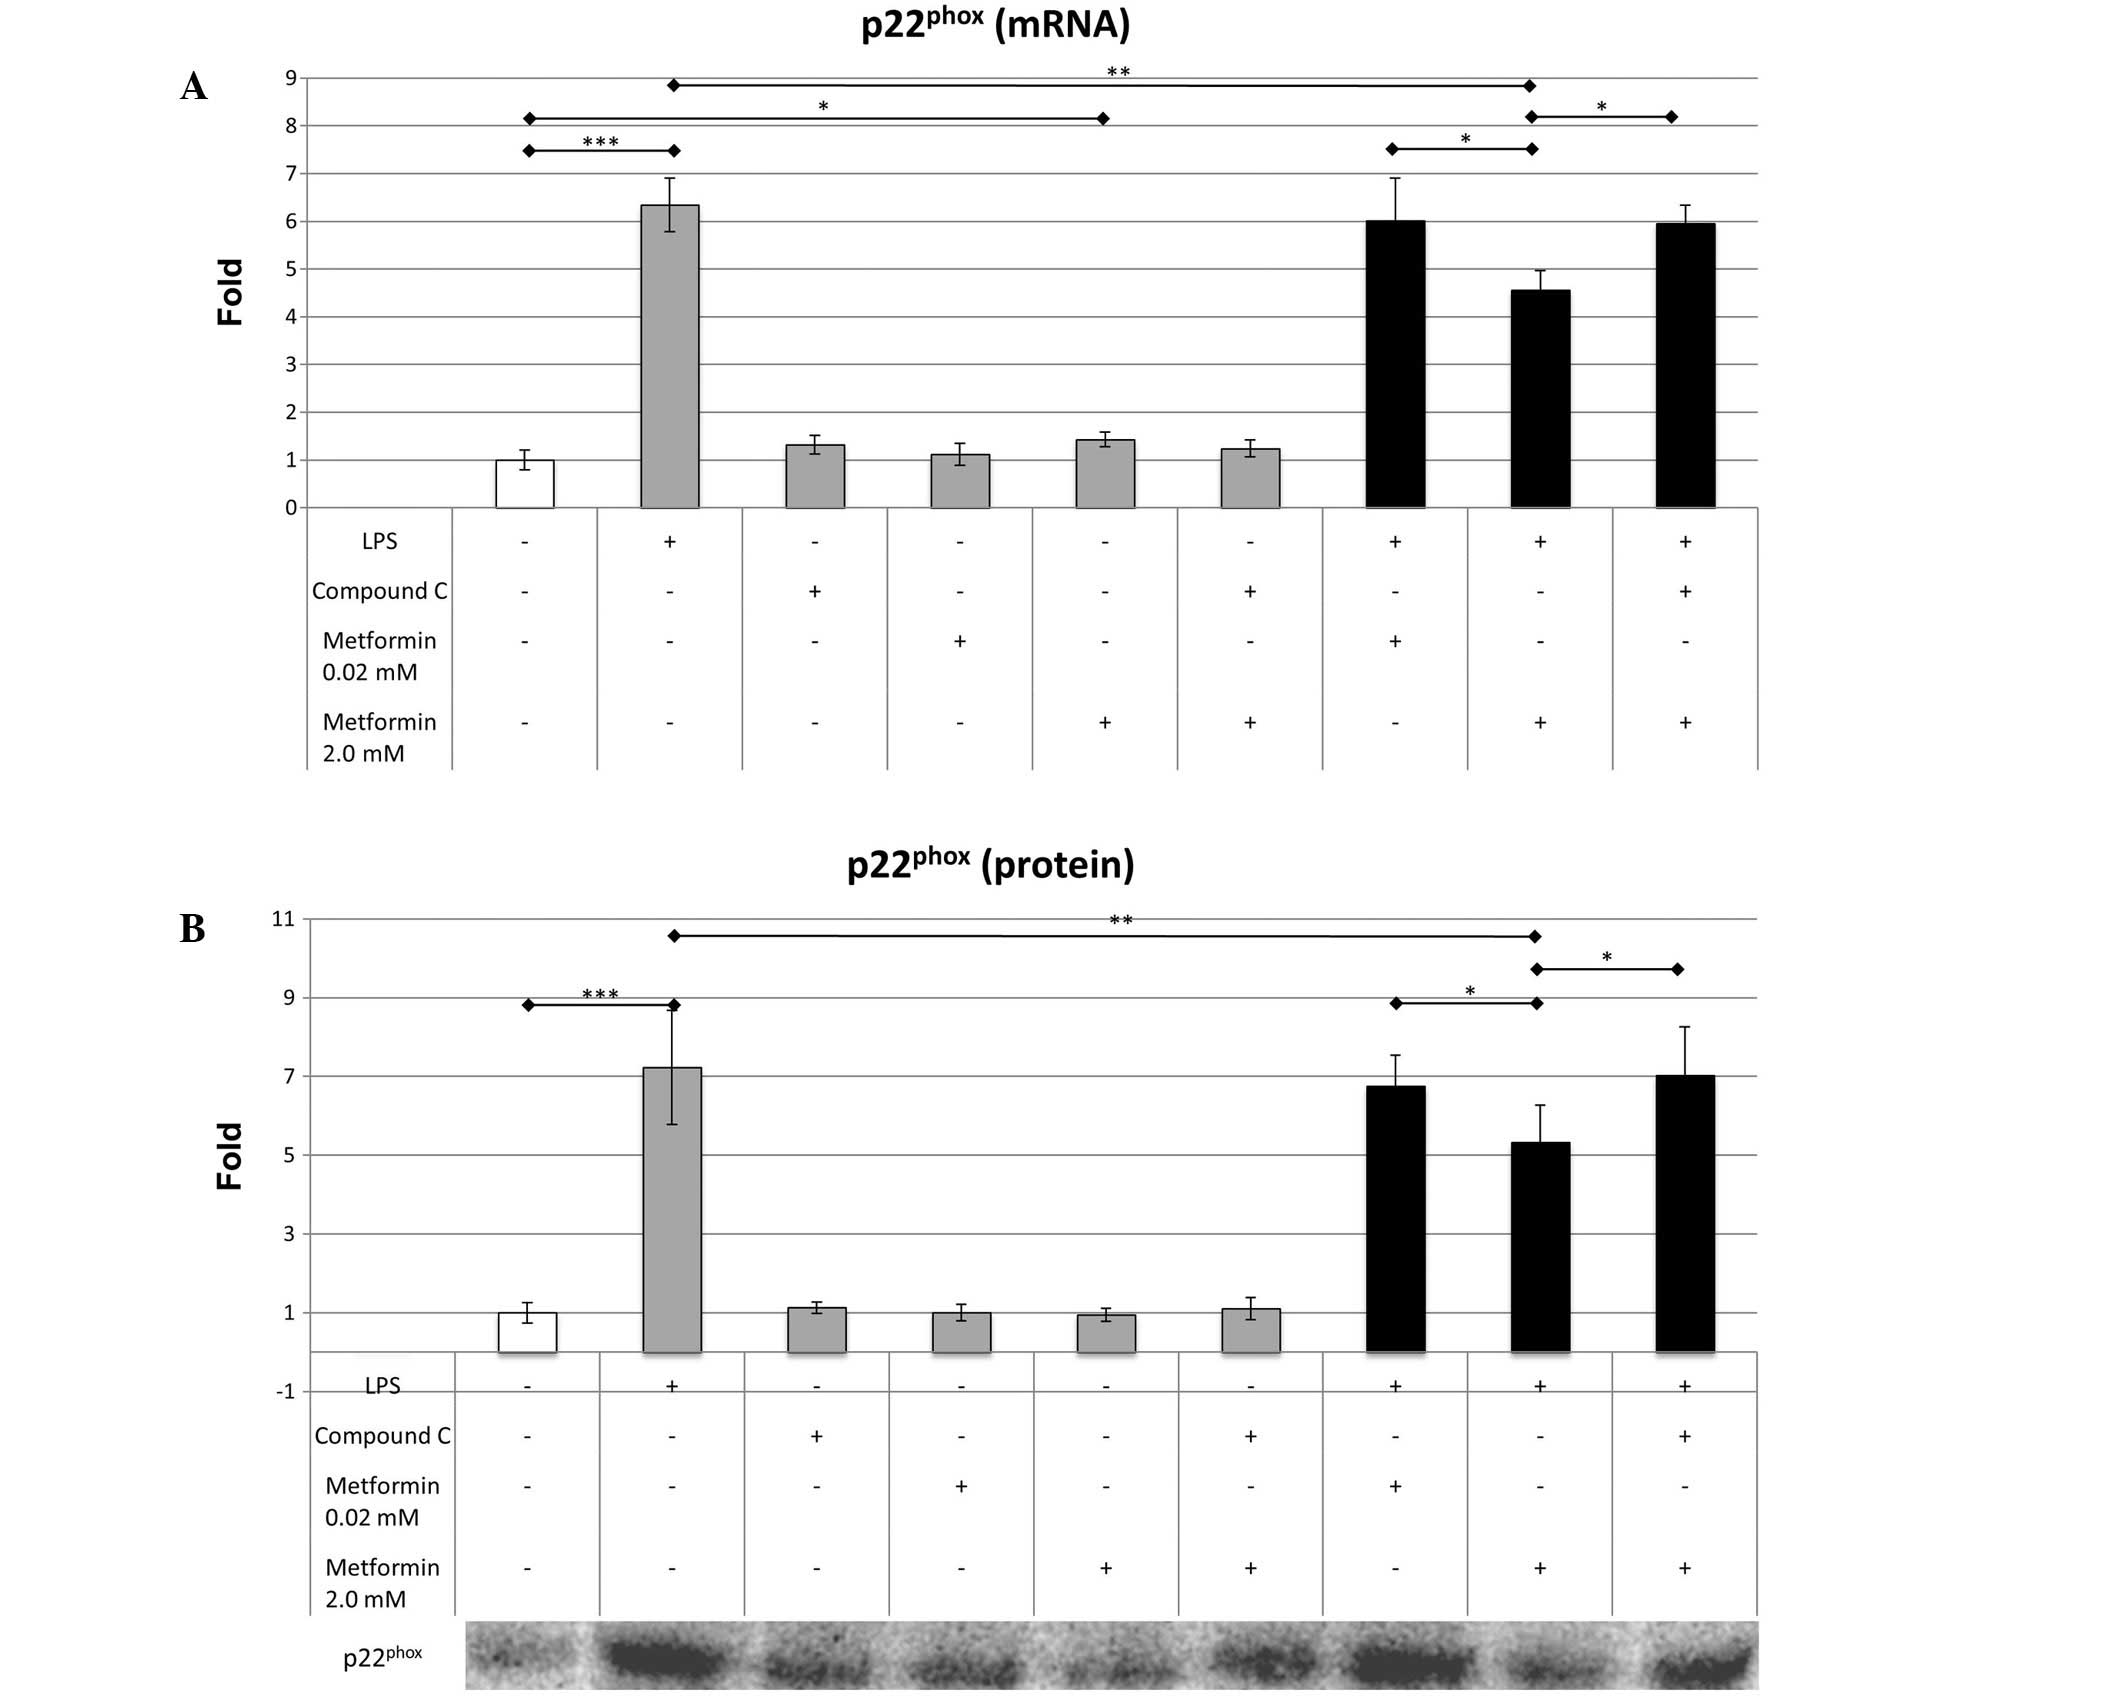
Effects of LPS, compound C and
metformin on p22phox
LPS significantly elevated the expression of p22phox
at the mRNA (6.34±0.56 vs. 1.0±0.21-fold; P<0.001) and protein
(7.23±1.45 vs. 1.0±0.26-fold; P<0.001) levels compared with that
in the control group (Fig. 2).
Metformin at a low concentration (0.02 µM) did not significantly
alter the mRNA expression levels of p22phox (1.12±0.23 vs.
1.0±0.21-fold; P=0.217); however, a high concentration of metformin
(2.0 µM) resulted in the elevation of mRNA expression levels
(1.43±0.15 vs. 1.0±0.26-fold; P=0.041) compared with those in the
control. The protein expression levels of p22phox were not
significantly affected by 0.02 or 2.0 mM metformin. In the
LPS-treated macrophages, 0.02 mM metformin did not significantly
alter the mRNA or protein expression levels of p22phox. By
contrast, 2.0 mM metformin induced a significant reduction in the
mRNA (4.56±0.41 vs. 6.34±0.56; P=0.007) and protein (5.33±0.94 vs.
7.23±1.45; P=0.002) expression levels of p22phox in the LPS-treated
macrophages. The addition of compound C significantly inhibited the
effect of metformin on the mRNA (5.95±0.39 vs. 4.56±0.51; P=0.011)
and protein (7.03±1.23 vs. 5.33±0.94; P=0.009) expression levels of
p22phox in the LPS-treated cells. Following treatment with compound
C, these levels were comparable to those of the cells treated with
LPS alone.
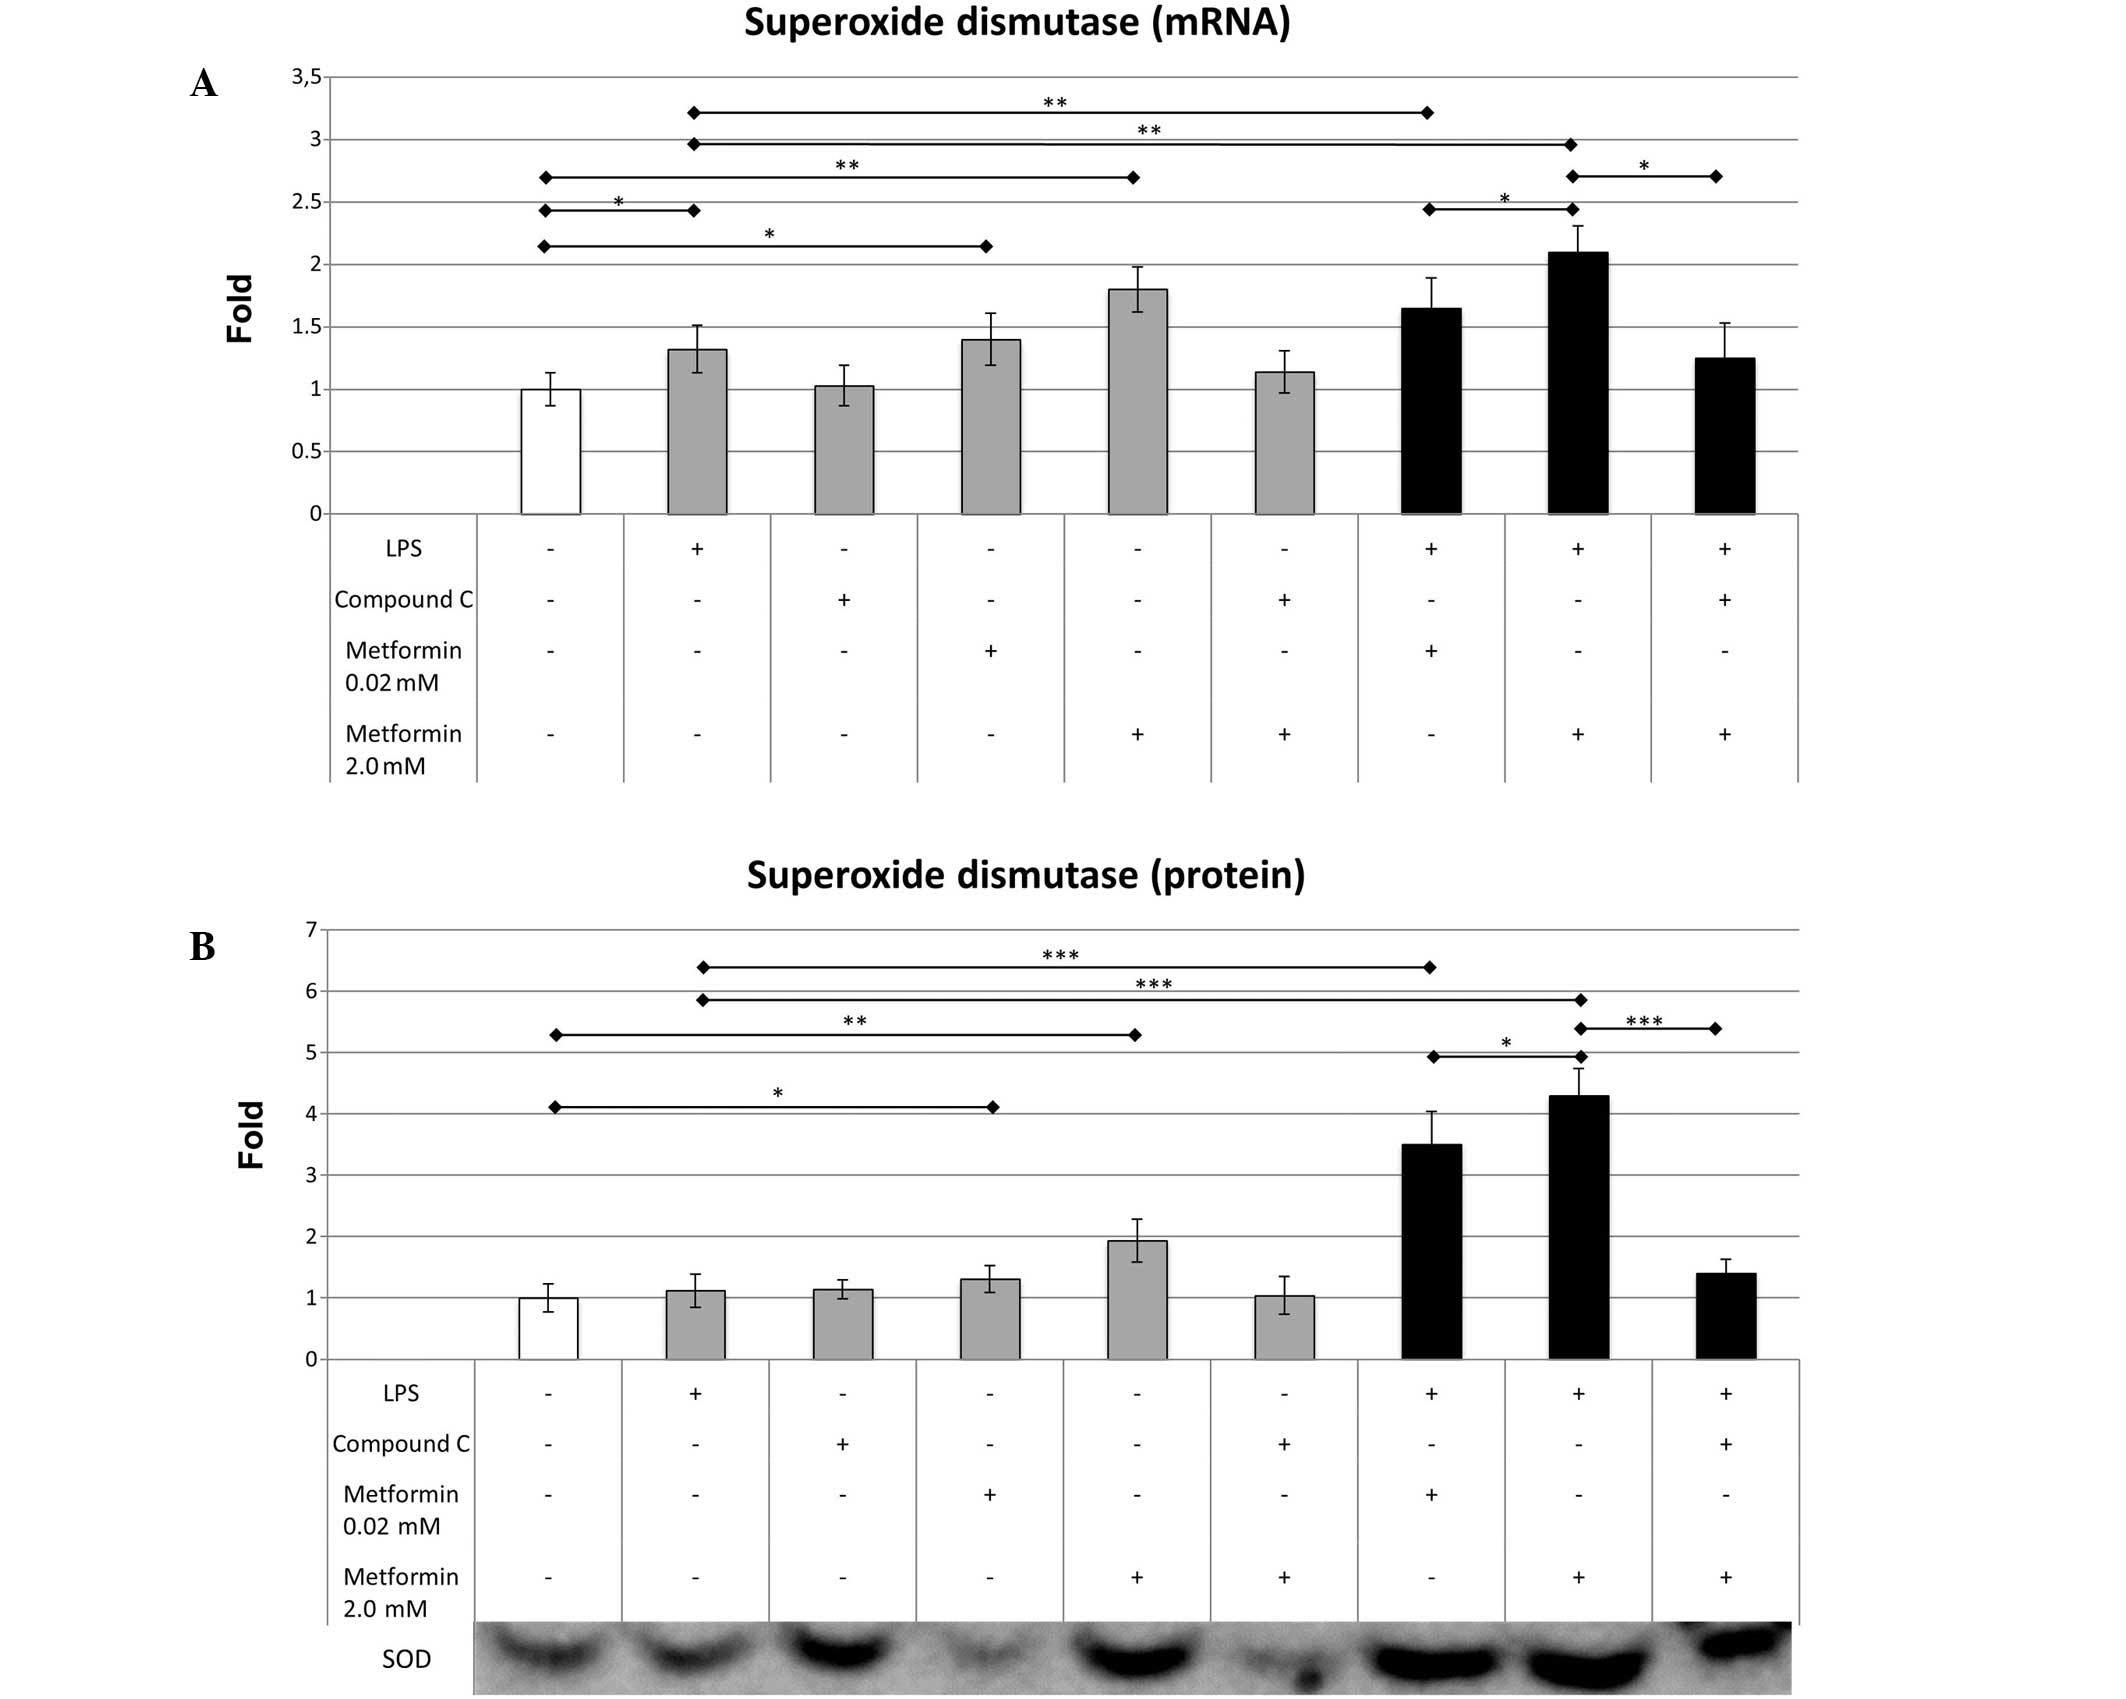
Effects of LPS, compound C and
metformin on SOD
LPS caused a small increase in the mRNA expression
level of SOD (1.32±0.19 vs. 1.0±0.13; P=0.038) compared with that
in the control cells; however, it did not significantly change SOD
protein expression (1.12±0.27 vs. 1.0±0.23) (Fig. 3). Metformin at 0.02 µM significantly
increased the mRNA expression level of SOD (1.4±0.21 vs. 1.0±0.13;
P=0.027), while 2.0 mM metformin significantly elevated the mRNA
(1.8±0.18 vs. 1.0±0.13; P=0.006) and protein (1.95±0.35 vs.
1.0±0.23; P=0.007) expression levels of SOD compared with those in
the control group. The addition of 0.02 mM metformin to LPS-treated
cells resulted in a moderate increase in SOD mRNA expression
(1.65±0.24 vs. 1.32±0.19; P=0.009) compared with that in the cells
treated with LPS alone. Metformin at 2.0 µM produced a more marked
difference in SOD mRNA expression (2.1±0.21 vs. 1.32±0.19; P=0.005)
in the LPS-treated cells. The effect of metformin on SOD protein
concentration was particularly marked in the cells treated with
0.02 µM (3.5±0.54 vs. 1.12±0.27; P<0.001) and 2.0 mM metformin
(4.3±0.44 vs. 1.12±0.27; P<0.001), indicating that metformin
increases the expression of SOD more effectively in an inflammatory
environment. Compound C reduced the effect of 2.0 mM metformin on
SOD mRNA (1.25±0.28 vs. 2.1±0.21; P=0.006) and protein (1.4±0.23
vs. 4.3±0.44; P<0.001) expression levels, which resulted in mRNA
expression levels similar to those of the LPS-treated macrophages
(1.25±0.28 vs. 1.32±0.19; P=0.425); however, the protein expression
levels of SOD remained slightly elevated (1.4±0.23 vs. 1.12±0.27;
P=0.048).
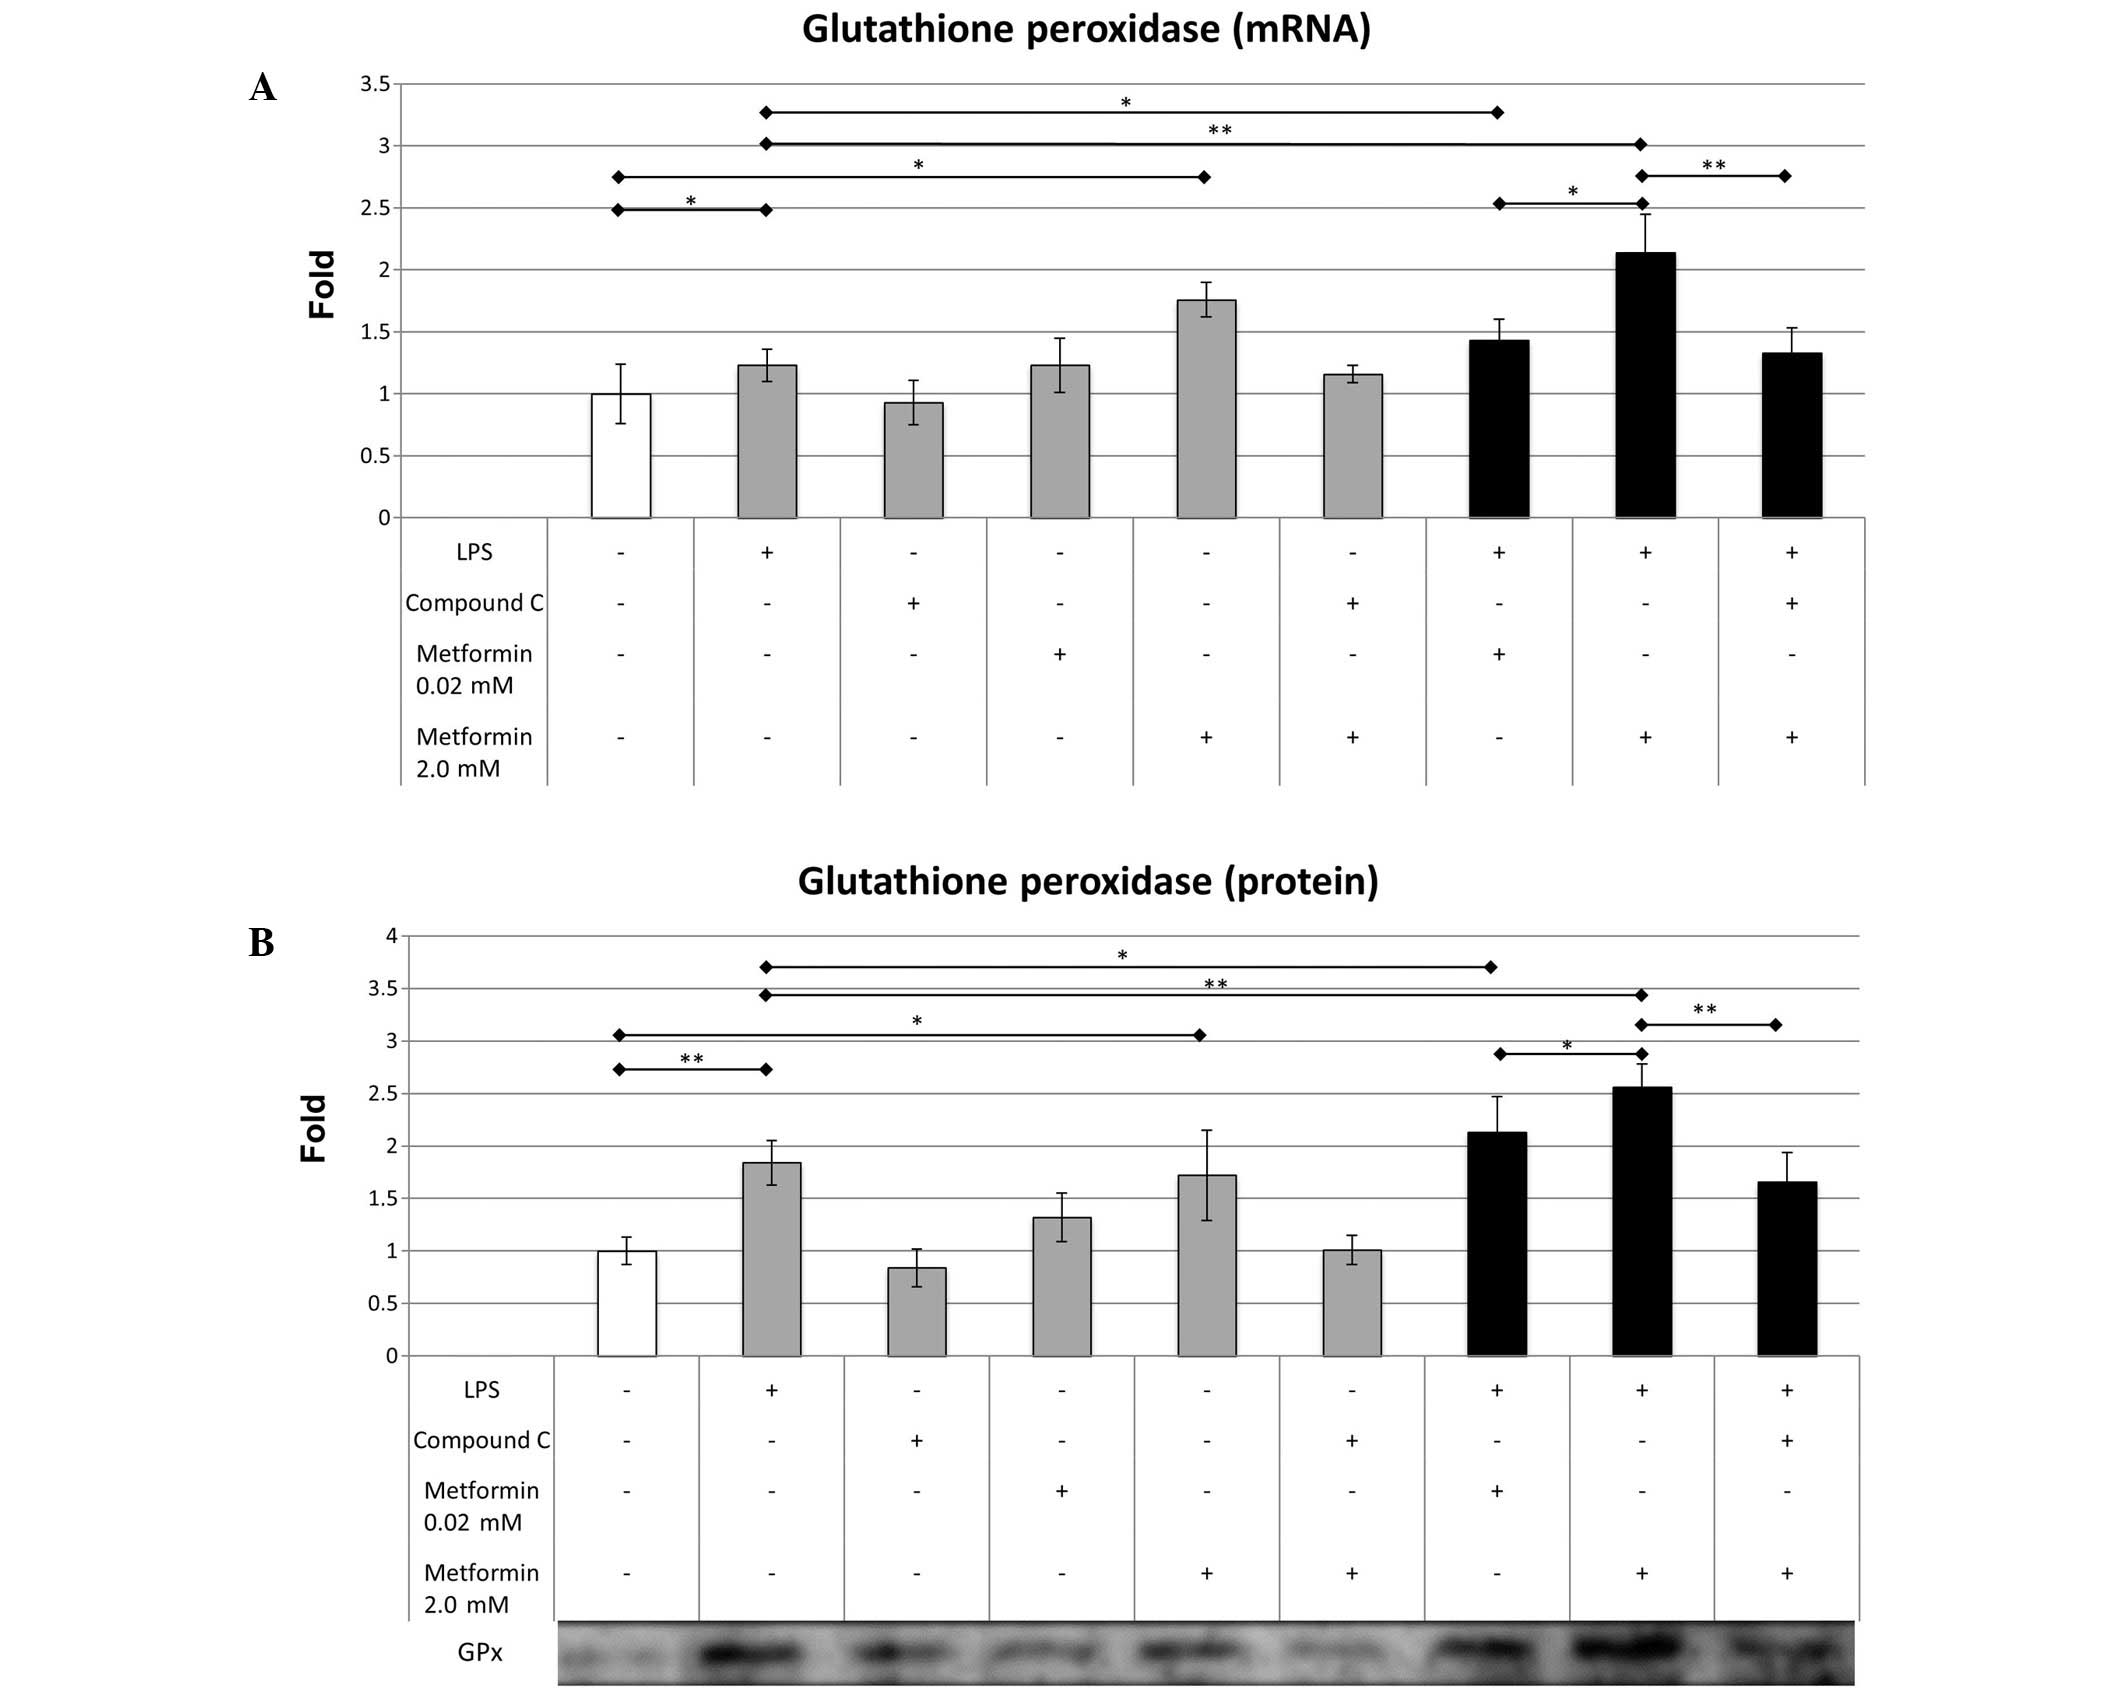
Effects of LPS, compound C and
metformin on GPx
Treatment with LPS increased the expression levels
of GPx mRNA (1.23±0.13 vs. 1.0±0.24; P=0.041) and protein
(1.84±0.21 vs. 1.0±0.13; P=0.002) compared with those in the
control group (Fig. 4). In contrast
to SOD, 0.02 mM metformin did not significantly alter the mRNA or
protein expression levels of GPx compared with those in the control
group. However, 2.0 mM metformin, similarly to its effect on SOD
expression, increased the mRNA (1.76±0.14 vs. 1.0±0.24; P=0.011)
and protein (1.72±0.43 vs. 1.0±0.13; P=0.016) expression levels of
GPx compared with the control. The addition of 0.02 mM metformin to
the LPS-treated cells resulted in a significant increase in the
mRNA (1.43±0.17 vs. 1.23±0.13; P=0.038) and protein (2.13±0.34 vs.
1.84±0.21; P=0.046) expression levels of GPx. Furthermore, 2.0 mM
metformin produced a more marked increase in the mRNA (2.14±0.33
vs. 1.23±0.13; P=0.001) and protein (2.56±0.22 vs. 1.84±0.21;
P=0.003) expression levels of GPx in the LPS-treated cells.
Experiments involving compound C and LPS indicated that metformin
expressed its effects via AMPK, as a significant inhibitory
influence of compound C on the expression of GPx mRNA and protein
was observed. Following the AMPK inhibition, the GPx expression was
comparable to that in samples treated only with LPS (1.33±0.2 vs.
1.23±0.13; P=0.289 for mRNA) and (1.66±0.28 vs. 1.84±0.21; P=0.361
for protein).
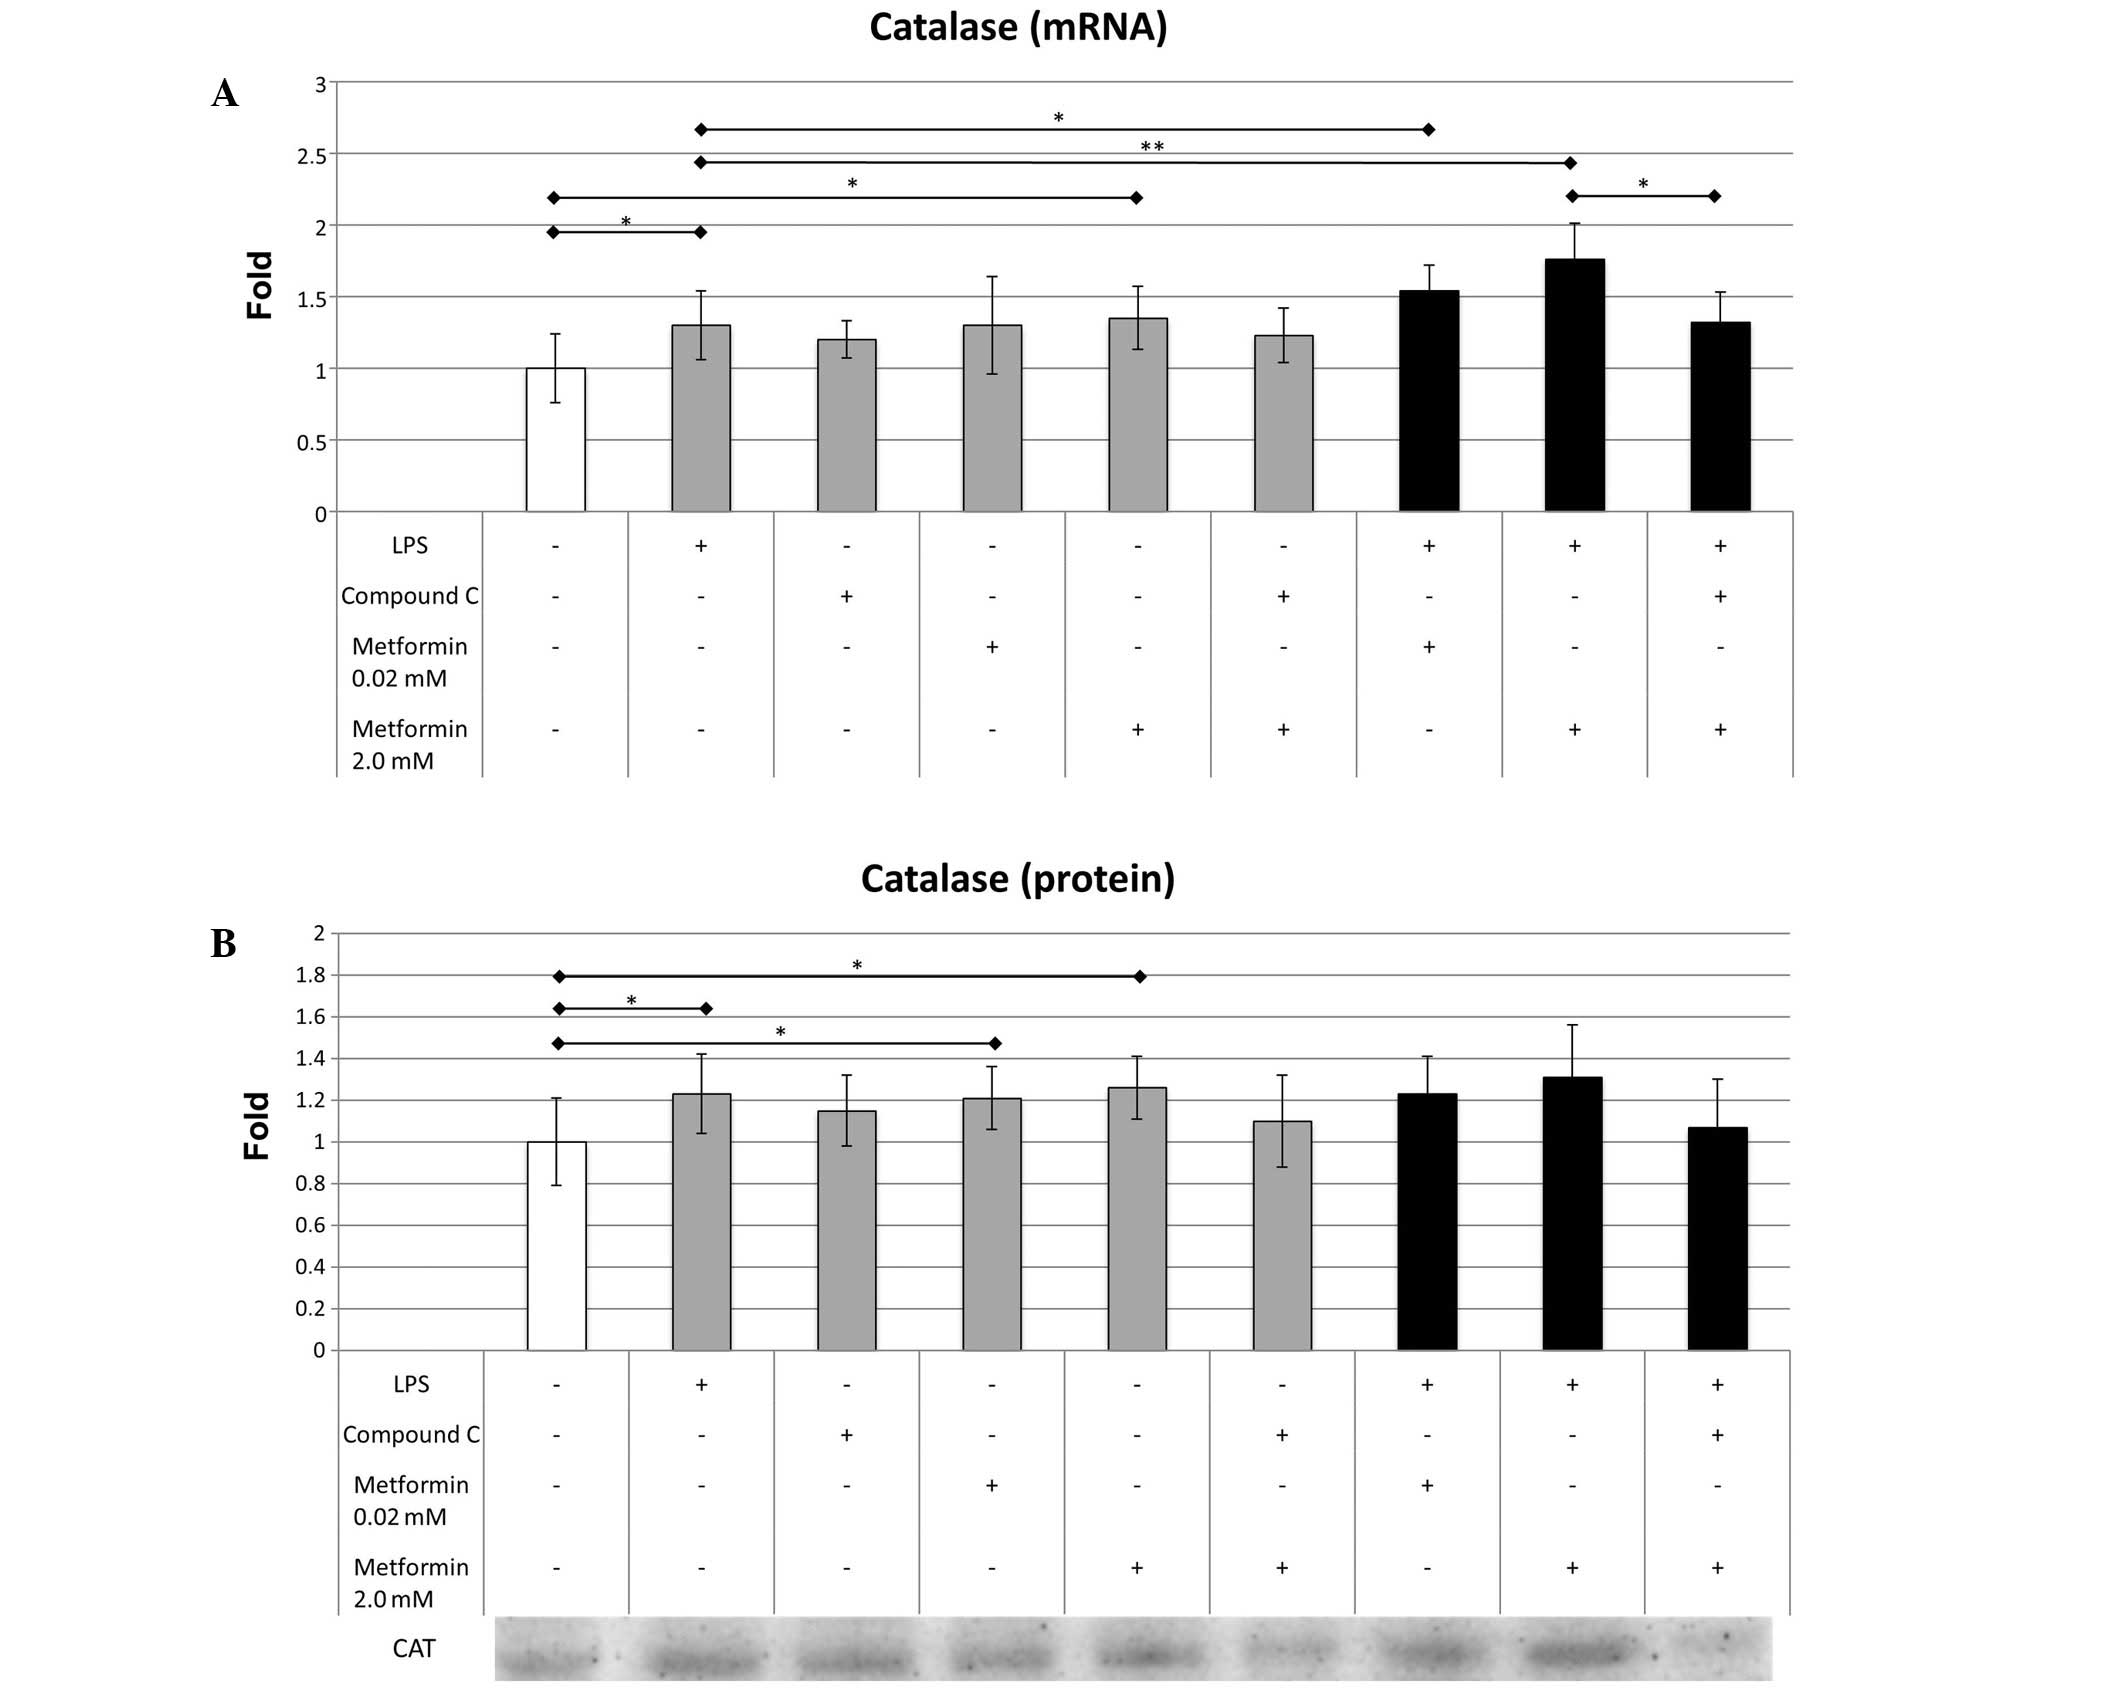
Effects of LPS, compound C and
metformin on CAT
LPS resulted in a moderate but statistically
significant increase in CAT mRNA (1.3±0.24 vs. 1.0±0.24; P=0.042)
and protein (1.23±0.15 vs. 1.0±0.21; P=0.029) expression levels in
cultured macrophages. In 2.0 mM metformin-treated samples a mild
elevation in CAT mRNA expression was observed (1.35±0.22 vs.
1.0±0.24; P=0.027); however, 0.02 mM metformin did not induce a
significant effect on CAT mRNA. Notably, metformin elevated CAT
protein synthesis by a similar degree in the 0.02 µM (1.21±0.15 vs.
1.0±0.21; P=0.049) and 2.0 µM (1.26±0.15 vs. 1.0±0.21; P=0.037)
groups of macrophages. In LPS-treated macrophages, the CAT mRNA
level was significantly increased by treatment with 0.02 µM
(1.54±0.18 vs. 1.3±0.24; P=0.023) and 2.0 µM (1.76±0.25 vs.
1.3±0.24; P=0.003) metformin. However, similar changes in protein
expression were not observed. Compound C inhibited the influence of
2.0 mM metformin on CAT mRNA expression in LPS-treated macrophages
(1.32±0.21 vs. 1.76±0.25; P=0.005), without a significant effect on
CAT protein expression (Fig. 5).
Discussion
The results of the present study indicate that
metformin significantly affected the expression of enzymes
associated with oxidative stress. In macrophages modeling an
inflammatory situation, induced using LPS, a marked increase in
p22phox was observed and a dose-dependent reduction in
p22phox expression was observed in cells treated
additionally with increasing doses of metformin. These changes were
accompanied by increased expression of SOD and GPx. By contrast,
the effect of metformin on CAT expression levels in the LPS-treated
macrophages was relatively small.
Oxidative stress is necessary for the control of
exogenous potentially harmful stimuli, such as bacterial infection.
p22phox is the primary source of ROS, and this enzyme is
predominantly located in the mitochondria. Metformin is a key
factor in the homeostasis of energy expenditure, and is also
predominantly located in the mitochondria. The generation of ROS
requires high amounts of energy. The results of the present study
suggest that metformin reduced the expression of p22phox
in LPS-treated macrophages. It was hypothesized that this effect
was mediated by AMPK activation, which was confirmed by experiments
employing compound C, a pharmacological inhibitor of AMPK. These
results are consistent with the results of previous studies on
murine podocytes and human endothelial cells (22,23).
Furthermore, a previous study reported that metformin reduced ROS
generation by inhibition of respiratory chain complex-1 (24). The results of our previous study
indicate that metformin dose-dependently reduces ROS generation in
macrophages treated with LPS (1),
and the current findings suggest that using higher concentrations
of metformin is markedly more effective for reducing
p22phox expression. However, it is notable that the
reduction of p22phox expression was not observed in
unstimulated cells, which may be because AMPK activation is a
crucial regulator of oxidative stress in cells subjected to
inflammatory conditions, and it does not significantly affect redox
status in cells that have not been subjected to LPS.
In our previous study, it was observed that
metformin was able to reduce ROS production in LPS-stimulated
macrophages. These results were associated with increased activity
of antioxidative enzymes (1). The
current study investigated the effect of metformin on the
expression levels of major antioxidative enzymes that react to
mitigate oxidative stress. ROS elimination is a multistage process
(25), firstly superoxides are
converted into H2O2 by SOD. Subsequently, CAT
converts excessive quantities of H2O2 into
water, or alternatively GPx deactivates H2O2
using glutathione (26).
Antioxidative enzymes are essential elements of the acute reaction
of macrophages against infection. The action of these enzymes is
necessary in the resolution phase of inflammation and prevents
excessive damage of peripheral tissue. The present results suggest
that these enzymes may serve a crucial function in the prevention
of atherosclerosis. Furthermore, the present results demonstrated
that an upregulation of SOD and GPx occurred in macrophages treated
with LPS. Perrotta et al reported that increased MnSOD
expression may mitigate the cytotoxic effects of oxidized
low-density lipoprotein in aortic atheromas (27). In addition, chronic inflammation has
been associated with reduced expression of SOD and GPx in patients
undergoing hemodialysis (28). In
previous animal models, SOD and GPx deficiency have led to
increased rates of foam cell formation, increased regional
inflammation and ultimately to the progression of atherosclerosis
(29,30). Therefore, a therapy that is able to
effectively reduce blood glucose in addition to increasing
antioxidative potential may underlie the additional pleiotropic
properties, for example, anticancer activity, of this biguanide
drug (31).
In the current study, metformin generally caused
only a moderate increase in CAT mRNA and protein expression. These
observations were unexpected in light of our previous results,
which indicated increased CAT activity in macrophages pretreated
with LPS (1). There are a number of
potential explanations for these contradictory results: i)
Metformin exerts a mild effect on CAT expression, and the results
may become statistically significant in experiments including a
substantial increase in sample size; ii) a predominant effect of
metformin on the catalytic activity of the CAT enzyme; iii) the
majority of H2O2 is converted in macrophages
by GPx; or iv) CAT plays an insignificant role in the pathology of
atherosclerosis. Other researchers have noted that CAT expression
is less affected by inflammation compared with that of GPx in human
monocytes (32). However, an
inherited CAT deficiency may lead to numerous diseases, including
diabetes mellitus (33).
Furthermore, certain haplotypes of CAT may prevent atherosclerotic
plaque formation (34). Hormonal
replacement therapy increases CAT activity, which coincides with
improved cardiovascular outcomes, supporting the hypothesis that
CAT is a key factor in the prevention of atherosclerosis. According
to the current results and those of our previous study, metformin
may affect the activity of CAT but not its expression. In addition,
novel methods of delivering antioxidative enzymes into
atherosclerotic plaques using macrophages enriched in CAT or
SOD-mimicking agents are currently under development and have
presented promising results (35).
In summary, the present results indicate that
metformin significantly alters the expression of enzymes associated
with the induction and resolution of oxidative stress. The effect
was AMPK-dependent and predominantly observed in
p22phox, SOD and GPx. As a result, a pattern of
enzymatic expression indicating an antioxidative profile was
observed. These results improve our understanding of the
pleiotropic effects of metformin that in addition to its glucose
lowering properties, and may provide a basis for further studies to
investigate other groups of drugs that may exert beneficial effects
by their influence on oxidative stress. The present study had a
number of limitations: i) An in vitro setting may not fully
reproduce the myriad interactions in living organisms; and ii) high
concentrations of metformin may induce effects that are not
observed in humans; however, the results indicate that in order to
mimic long-lasting effects of drugs in living organisms it is
necessary to perform in vitro cultures with
supraphysiological drug concentrations.
Acknowledgements
This study was supported by statutory grants from
the Medical University of Silesia (no. KNW-1-097/N/4/0 and
KNW-1-093/N/5/0). The authors thank Mrs. Jarosława Sprada and Mrs.
Halina Klimas for their technical support.
References
|
1
|
Bułdak Ł, Łabuzek K, Bułdak RJ, Kozłowski
M, Machnik G, Liber S, Suchy D, Duława-Bułdak A and Okopień B:
Metformin affects macrophages' phenotype and improves the activity
of glutathione peroxidase, superoxide dismutase, catalase and
decreases malondialdehyde concentration in a partially
AMPK-independent manner in LPS-stimulated human
monocytes/macrophages. Pharmacol Rep. 66:418–429. 2014. View Article : Google Scholar : PubMed/NCBI
|
|
2
|
Van Greevenbroek MM, Schalkwijk CG and
Stehouwer CD: Obesity-associated low-grade inflammation in type 2
diabetes mellitus: Causes and consequences. Neth J Med. 71:174–187.
2013.PubMed/NCBI
|
|
3
|
Jin C and Flavell RA: Innate sensors of
pathogen and stress: Linking inflammation to obesity. J Allergy
Clin Immunol. 132:287–294. 2013. View Article : Google Scholar : PubMed/NCBI
|
|
4
|
Kaptoge S, Seshasai SR, Gao P, Freitag DF,
Butterworth AS, Borglykke A, Di Angelantonio E, Gudnason V, Rumley
A, Lowe GD, et al: Inflammatory cytokines and risk of coronary
heart disease: New prospective study and updated meta-analysis. Eur
Heart J. 35:578–589. 2014. View Article : Google Scholar : PubMed/NCBI
|
|
5
|
Savoia C and Schiffrin EL: Vascular
inflammation in hypertension and diabetes: Molecular mechanisms and
therapeutic interventions. Clin Sci (Lond). 112:375–384. 2007.
View Article : Google Scholar : PubMed/NCBI
|
|
6
|
Ridker PM: High-sensitivity C-reactive
protein: Potential adjunct for global risk assessment in the
primary prevention of cardiovascular disease. Circulation.
103:1813–1818. 2001. View Article : Google Scholar : PubMed/NCBI
|
|
7
|
Madej A, Bołdys A, Bułdak L, Labuzek K,
Basiak M and Okopień B: Short-term antihypertensive therapy lowers
the C-reactive protein level. Postepy Hig Med Dosw (Online).
66:78–84. 2012.PubMed/NCBI
|
|
8
|
Ridker PM, Danielson E, Fonseca FA, Genest
J, Gotto AM Jr, Kastelein JJ, Koenig W, Libby P, Lorenzatti AJ,
MacFadyen JG, et al: JUPITER Study Group: Rosuvastatin to prevent
vascular events in men and women with elevated C-reactive protein.
N Engl J Med. 359:2195–2207. 2008. View Article : Google Scholar : PubMed/NCBI
|
|
9
|
Deo SH, Fisher JP, Vianna LC, Kim A,
Chockalingam A, Zimmerman MC, Zucker IH and Fadel PJ: Statin
therapy lowers muscle sympathetic nerve activity and oxidative
stress in patients with heart failure. Am J Physiol Heart Circ
Physiol. 303:H377–H385. 2012. View Article : Google Scholar : PubMed/NCBI
|
|
10
|
Pignatelli P, Carnevale R, Di Santo S,
Bartimoccia S, Nocella C, Vicario T, Loffredo L, Angelico F and
Violi F: Rosuvastatin reduces platelet recruitment by inhibiting
NADPH oxidase activation. Biochem Pharmacol. 84:1635–1642. 2012.
View Article : Google Scholar : PubMed/NCBI
|
|
11
|
UK Prospective Diabetes Study (UKPDS)
Group: Effect of intensive blood-glucose control with metformin on
complications in overweight patients with type 2 diabetes (UKPDS
34). Lancet. 352:854–865. 1998. View Article : Google Scholar : PubMed/NCBI
|
|
12
|
Prasad K and Dhar I: Oxidative stress as a
mechanism of added sugar-induced cardiovascular disease. Int J
Angiol. 23:217–226. 2014. View Article : Google Scholar : PubMed/NCBI
|
|
13
|
Costa A, Scholer-Dahirel A and
Mechta-Grigoriou F: The role of reactive oxygen species and
metabolism on cancer cells and their microenvironment. Semin Cancer
Biol. 25:23–32. 2014. View Article : Google Scholar : PubMed/NCBI
|
|
14
|
Park JG and Oh GT: The role of peroxidases
in the pathogenesis of atherosclerosis. BMB Rep. 44:497–505. 2011.
View Article : Google Scholar : PubMed/NCBI
|
|
15
|
Okopień B, Krysiak R, Kowalski J, Madej A,
Belowski D, Zieliński M and Herman ZS: Monocyte release of tumor
necrosis factor-alpha and interleukin-1beta in primary type IIa and
IIb dyslipidemic patients treated with statins or fibrates. J
Cardiovasc Pharmacol. 46:377–386. 2005. View Article : Google Scholar : PubMed/NCBI
|
|
16
|
Labuzek K, Liber S, Gabryel B, Adamczyk J
and Okopień B: Metformin increases phagocytosis and acidifies
lysosomal/endosomal compartments in AMPK-dependent manner in rat
primary microglia. Naunyn Schmiedebergs Arch Pharmacol.
381:171–186. 2010. View Article : Google Scholar : PubMed/NCBI
|
|
17
|
Bułdak Ł, Łabuzek K, Bułdak RJ, Machnik G,
Bołdys A and Okopień B: Exenatide (a GLP-1 agonist) improves the
antioxidative potential of in vitro cultured human
monocytes/macrophages. Naunyn Schmiedebergs Arch Pharmacol.
388:905–919. 2015. View Article : Google Scholar : PubMed/NCBI
|
|
18
|
Rebelato E, Mares-Guia TR, Graciano MF,
Labriola L, Britto LR, Garay-Malpartida HM, Curi R, Sogayar MC and
Carpinelli AR: Expression of NADPH oxidase in human pancreatic
islets. Life Sci. 91:244–249. 2012. View Article : Google Scholar : PubMed/NCBI
|
|
19
|
Kasperczyk A, Machnik G, Dobrakowski M,
Sypniewski D, Birkner E and Kasperczyk S: Gene expression and
activity of antioxidant enzymes in the blood cells of workers who
were occupationally exposed to lead. Toxicology. 301:79–84. 2012.
View Article : Google Scholar : PubMed/NCBI
|
|
20
|
Strzalka-Mrozik B, Prudlo L, Kimsa MW,
Kimsa MC, Kapral M, Nita M and Mazurek U: Quantitative analysis of
SOD2, ALDH1A1 and MGST1 messenger ribonucleic acid in anterior lens
epithelium of patients with pseudoexfoliation syndrome. Mol Vis.
19:1341–1349. 2013.PubMed/NCBI
|
|
21
|
Rice P, Longden I and Bleasby A: EMBOSS
The European Molecular Biology Open Software Suite. Trends Genet.
16:276–277. 2000. View Article : Google Scholar : PubMed/NCBI
|
|
22
|
Piwkowska A, Rogacka D, Jankowski M,
Dominiczak MH, Stepiński JK and Angielski S: Metformin induces
suppression of NAD(P)H oxidase activity in podocytes. Biochem
Biophys Res Commun. 393:268–273. 2010. View Article : Google Scholar : PubMed/NCBI
|
|
23
|
Batchuluun B, Inoguchi T, Sonoda N, Sasaki
S, Inoue T, Fujimura Y, Miura D and Takayanagi R: Metformin and
liraglutide ameliorate high glucose-induced oxidative stress via
inhibition of PKC-NAD(P)H oxidase pathway in human aortic
endothelial cells. Atherosclerosis. 232:156–164. 2014. View Article : Google Scholar : PubMed/NCBI
|
|
24
|
Batandier C, Guigas B, Detaille D, El-Mir
MY, Fontaine E, Rigoulet M and Leverve XM: The ROS production
induced by a reverse-electron flux at respiratory-chain complex 1
is hampered by metformin. J Bioenerg Biomembr. 38:33–42. 2006.
View Article : Google Scholar : PubMed/NCBI
|
|
25
|
Lu W, Ogasawara MA and Huang P: Models of
reactive oxygen species in cancer. Drug Discov Today Dis Models.
4:67–73. 2007. View Article : Google Scholar : PubMed/NCBI
|
|
26
|
Krifka S, Hiller KA, Spagnuolo G, Jewett
A, Schmalz G and Schweikl H: The influence of glutathione on redox
regulation by antioxidant proteins and apoptosis in macrophages
exposed to 2-hydroxyethyl methacrylate (HEMA). Biomaterials.
33:5177–5186. 2012. View Article : Google Scholar : PubMed/NCBI
|
|
27
|
Perrotta I, Perrotta E, Sesti S, Cassese M
and Mazzulla S: MnSOD expression in human atherosclerotic plaques:
An immunohistochemical and ultrastructural study. Cardiovasc
Pathol. 22:428–437. 2013. View Article : Google Scholar : PubMed/NCBI
|
|
28
|
Ari E, Kaya Y, Demir H, Cebi A, Alp HH,
Bakan E, Odabasi D and Keskin S: Oxidative DNA damage correlates
with carotid artery atherosclerosis in hemodialysis patients.
Hemodial Int. 15:453–459. 2011. View Article : Google Scholar : PubMed/NCBI
|
|
29
|
Fukai T and Ushio-Fukai M: Superoxide
dismutases: Role in redox signaling, vascular function and,
diseases. Antioxid Redox Signal. 15:1583–1606. 2011. View Article : Google Scholar : PubMed/NCBI
|
|
30
|
Cheng F, Torzewski M, Degreif A, Rossmann
H, Canisius A and Lackner KJ: Impact of glutathione peroxidase-1
deficiency on macrophage foam cell formation and proliferation:
Implications for atherogenesis. PLoS One. 8:e720632013. View Article : Google Scholar : PubMed/NCBI
|
|
31
|
Rizos CV and Elisaf MS: Metformin and
cancer. Eur J Pharmacol. 705:96–108. 2013. View Article : Google Scholar : PubMed/NCBI
|
|
32
|
Szuchman-Sapir A, Etzman M and Tamir S:
Human atherosclerotic plaque lipid extract impairs the antioxidant
defense capacity of monocytes. Biochem Biophys Res Commun.
423:884–888. 2012. View Article : Google Scholar : PubMed/NCBI
|
|
33
|
Góth L and Nagy T: Inherited catalase
deficiency: Is it benign or a factor in various age related
disorders? Mutat Res. 753:147–154. 2013. View Article : Google Scholar : PubMed/NCBI
|
|
34
|
Nivet-Antoine V, Labat C, El Shamieh S,
Dulcire X, Cottart CH, Beaudeux JL, Zannad F, Visvikis-Siest S and
Benetos A: Relationship between catalase haplotype and arterial
aging. Atherosclerosis. 227:100–105. 2013. View Article : Google Scholar : PubMed/NCBI
|
|
35
|
Lee S: Monocytes: A novel drug delivery
system targeting atherosclerosis. J Drug Target. 22:138–145. 2014.
View Article : Google Scholar : PubMed/NCBI
|