Introduction
Good oral hygiene behavior is necessary for the
maintenance of oral health. Periodontal diseases and tooth decay
may be exacerbated without good oral hygiene. Oral health is also
significantly associated with various systemic diseases such as
cardiovascular disease, diabetes mellitus, chronic respiratory
disease and rheumatoid arthritis (1–2).
Previous studies have examined the impact of socioeconomic status
(SES) on the health-related behaviors of adults (3–5). It has
been demonstrated that the effects of social inequalities on oral
health are observable regardless of the method of social
classification and the measure of oral health or disease (6). A previous study conducted among adults
has indicated that individuals from lower socioeconomic positions
tend to have a higher degree of clustering of multiple risk factors
for poor dental hygiene, as compared with those in higher
socioeconomic positions (3).
Individuals belonging to higher income groups are less likely to
report dental pain and more likely to be satisfied with their oral
health status than their lower socioeconomic counterparts (5). It was also observed that socioeconomic
factors are considered to be a strong risk factor for school
children caries (7). One study on
the trends in tooth loss in Swedish women observed that women in
lower social groups tended to have less remaining teeth,
irrespective of age (8). Previous
studies have investigated the association between risk of mortality
and oral care habits. Paganini-Hill et al (9) followed 5,611 men and women for 17 years
in the United States and reported that people with poor oral
hygiene habits had a higher risk of mortality (9). A study on 21,730 community residents in
Japan also reported that people with poor oral health care habits
had a higher risk of mortality (10).
In a previous study, individuals in the lower
socioeconomic groups of the Korean Population were significantly
more likely to require periodontal treatment (11). However, information regarding the
association between SES and oral health behaviors in the Korean
population remains limited.
The present study was performed to assess the
association between SES and oral health behaviors in a large sample
of the Korean population using data from Korea National Health and
Nutrition Examination Survey (KNHANES).
Materials and methods
Data collection
Data from the KNHANES, which was conducted between
2008 and 2010 by the Division of Chronic Disease Surveillance under
the Korea Centers for Disease Control and Prevention and the Korean
Ministry of Health and Welfare, were used for the present study
(12). KNHANES is a nationwide study
of non-institutionalized civilians that uses a stratified and
multi-stage probability sampling design with a rolling
survey-sampling model. Sampling units were based on the population
and housing consensus from the 2005 National Census Registry in
Korea, which includes age, gender and geographic area (13). In total, 20,730 individuals aged ≥19
years were targeted for the survey, and 19,219 participants with
complete data, including SES, were used in the present study.
Demographic and lifestyle
variables
All participants were asked about their lifestyle
and socioeconomic characteristics by trained interviewers. Age,
alcohol consumption, smoking status, residential area, daily energy
intake, fat intake and marital status were considered possible
confounding factors in the present study.
Participants were divided into three groups
according to the amount of alcohol consumption reported per day:
Non-drinker, light to moderate drinker (1–30 g/day) and heavy
drinker (>30 g/day) (14).
Smoking status was categorized into three groups in accordance with
respondents' answers on the self-report questionnaire: (i)
Non-smokers, those who had never smoked or had smoked <100
cigarettes in their life; (ii) ex-smokers, those who had smoked in
the past but had stopped smoking; and (iii) current smokers, those
who were smoking currently and had smoked ≥100 cigarettes in their
life (15). Individuals were
regarded as regular physical exercisers if they performed moderate
exercise at least 5 times per week for at least 30 min per session,
or performed vigorous exercise at least 3 times per week for at
least 20 min per session (16).
A face-to-face interview was conducted to obtain
data about place of residence (rural vs. urban) and occupation of
the participants (17). Residential
areas were categorized into urban areas (administrative divisions
of ‘dong’) and rural areas (administrative divisions of ‘eup’ or
‘myeon’) (14). Daily food intake
was assessed using the 24-h recall method, and a food frequency
questionnaire was used to determine food consumed the previous day.
Energy and fat intake were calculated using a food database
developed for the KNHANES and the food composition table published
by the National Rural Living Science Institute under the Rural
Development Administration (18).
Socioeconomic variables
In the present study, SES was assessed by monthly
household income and education level. Monthly household income
levels were divided into quartiles. The first quartile included
households with a monthly income <1092.4 USD, the second
quartile included those with an income of 1092.4–2334.3 USD, the
third included those with an income of 2334.3–3734.8 USD and the
fourth included those with an income >3734.8 USD. Education
levels were categorized into four groups according to the number of
years of schooling completed: (i) <7 years (elementary school
graduate or lower); (ii) 7–9 years (middle school graduate or some
middle school); (iii) 10–12 years (high school graduate or some
high school); and (iv) >13 years (university or higher)
(14).
Anthropometric measurements
Body weight and height were measured to the nearest
0.1 kg and 0.1 cm, respectively, whilst participants were wearing
light indoor clothing without shoes (19). Body mass index (BMI) was calculated
using the following formula: BMI=body weight
(kg)/height2 (m2). Waist circumference was
measured at the narrowest point between the lower border of the rib
cage and the iliac crest.
Oral health behaviors and periodontal
treatment
In the present study, the time of day when tooth
brushing was performed and the use of secondary oral products were
assessed. Times of day included: Before or after breakfast, lunch,
dinner and before sleeping. The frequency of daily tooth brushing
was conducted according to the total number of tooth brushing
incidences per day. Secondary oral products included dental floss,
mouthwash, interdental brushes and electric toothbrushes (15).
The World Health Organization community periodontal
index (CPI) was used to assess periodontal treatment needs and
periodontal disease was defined as CPI≥3 (20). A CPI score of 3 indicated that ≥1
site had a >3.5 mm pocket in the index teeth, which are 11, 16,
17, 26, 27, 31, 36, 37, 46 and 47 according to the Federation
Dentaire Internationale system (21). The mouth was divided into sextants. A
CPI probe (PWHO; Osung MND Co., Ltd., Seoul, Korea) with a 0.5 mm
ball tip was used. A sextant was examined only if there were ≥2
teeth present that were not scheduled for extraction. If no index
teeth were present in a sextant qualifying for examination, all
remaining teeth were examined and the highest score was recorded as
the score for that sextant. A probing force of ~20 g was used.
Trained and calibrated dentists examined the periodontal status of
the participants, and the mean inter-examiner Kappa value was 089
[95% confidence interval (CI), 0.55–1.00] (15,22–23).
Chewing and speech ability, attendance at a dental
checkup within a year and incidence of caries in permanent teeth
were evaluated.
Statistical analyses
Data were presented as either mean ± standard error
or as percentage (standard error), as indicated. Statistical
analyses were performed using the survey procedure of the SAS 9.2
statistical software package for Windows (SAS Institute, Inc.,
Cary, NC, USA) to account for the complex sampling design.
Two-sided P<0.05 were considered to indicate a statistically
significant difference. Analysis of variance was applied to examine
the relationship between the daily frequency of tooth brushing, use
of secondary oral products per day, and SES.
Multivariate logistic regression analyses were
applied to examine the odds ratios and 95% CI of tooth brushing ≥3
per day and the use of secondary oral products according to the
SES. There are four logistic regression models. Model 1 was
adjusted with age, gender and BMI. Adjustments were then made for
the same variables as Model 1 plus smoking, drinking, and regular
physical exercise (Model 2). Adjustments were made for the
variables in Model 2 plus energy intake, fat intake, and
periodontal treatment needs (CPI≥3) (Model 3). In addition,
adjustments were made for the variables in Model 3 plus education
or income (Model 4).
Results
Participant characteristics
Table I describes the
characteristics of the study population, whom were grouped
according to the daily frequency of tooth brushing and the use of
secondary oral products. Tooth brushing frequency and the use of
secondary products differed significantly depending on various
factors. Individuals who brushed ≥3 times per day were younger with
lower BMI, lower waist circumference and less periodontal treatment
needs. In current smokers, 35.8% brushed less than twice, 30.4%
brushed twice and 24.2% brushed ≥3 times per day. Similar trends
were detected in the use of secondary oral products (Table I). It should be noted that the
characteristics of the study population differed between the groups
categorized by the number of times tooth brushing was carried out
and the use of secondary oral products.
 | Table I.Characteristics of the study
population. |
Table I.
Characteristics of the study
population.
|
| Daily tooth brushing
frequency |
| Daily use of
secondary oral products |
|
|---|
|
|
|
|
|
|
|---|
| Variable | 0–1 | 2 | ≥3 | P-value | 0 | 1 | ≥2 | P-value |
|---|
| Age, years | 49.8±0.6 | 46.1±0.3 | 42.1±0.2 | <.0001 | 45.3±0.3 | 41.2±0.3 | 39.6±0.4 | <.0001 |
| Male, % | 65.7 (1.3) | 52.3 (0.7) | 46.3 (0.5) | <.0001 | 52.4 (0.4) | 45.7 (0.8) | 37.0 (1.5) | <.0001 |
| Body mass index,
kg/m2 | 24.2±0.1 | 23.9±0.1 | 23.4±0.0 | <.0001 | 23.7±0.0 | 23.4±0.1 | 23.2±0.1 | <.0001 |
| Waist circumference,
cm | 83.7±0.3 | 82.3±0.2 | 80.0±0.3 | <.0001 | 81.7±0.2 | 79.7±0.2 | 78.7±0.3 | <.0001 |
| Energy intake,
kcal/day | 1958.9±32.5 | 1963.1±16.7 | 2020.2±12.6 | 0.0098 | 1989±12.1 | 2012±17.8 | 2041.1±32.3 | <.0001 |
| Fat intake,
g/day | 15.7±0.3 | 17.2±0.2 | 18.7±0.1 | <.0001 | 17.5±0.1 | 19.2±0.2 | 19.9±0.3 | <.0001 |
| Rural residence,
% | 27.3 (2.4) | 20.7 (1.8) | 16.6 (1.7) | <.0001 | 21.1 (1.7) | 13.8 (1.4) | 11.1 (1.6) | <.0001 |
| Married, % | 66.7 (1.5) | 70.8 (0.8) | 68.3 (0.8) | 0.0102 | 66.9 (0.7) | 73.3 (1.0) | 74.5 (1.7) | <.0001 |
| Exercise, % | 23.3 (1.3) | 25.5 (0.7) | 25.3 (0.6) | 0.2833 | 24.4 (0.5) | 27.1 (0.8) | 26.5 (1.5) | 0.0073 |
| PTN, % | 39 (1.6) | 34.6 (1.0) | 24.5 (0.7) | <.0001 | 31.0 (0.8) | 24.7 (0.8) | 20.5 (1.4) | <.0001 |
| Checkup within
year, % | 22.7 (1.4) | 24.4 (0.8) | 28.6 (0.8) | <.0001 | 22.8 (0.7) | 34.2 (1.0) | 42.0 (1.6) | <.0001 |
| Caries in PT,
% | 89.7 (0.9) | 89.4 (0.5) | 90.7 (0.4) | 0.0658 | 89.3 (0.4) | 92.0 (0.5) | 93.3 (0.9) | <.0001 |
| Smoking, % |
|
|
| <.0001 |
|
|
| <.0001 |
|
Non-smoker | 43 (1.4) | 52.4 (0.7) | 59.4 (0.5) |
| 54.0 (0.4) | 59.1 (0.8) | 64.0 (1.5) |
|
|
Ex-smoker | 21.2 (1.1) | 17.1 (0.5) | 16.4 (0.4) |
| 17.3 (0.4) | 16.6 (0.6) | 15.0 (1.2) |
|
| Current
smoker | 35.8 (1.4) | 30.4 (0.7) | 24.2 (0.5) |
| 28.7 (0.5) | 24.2 (0.8) | 21.0 (1.5) |
|
| Alcohol intake,
% |
|
|
| <.0001 |
|
|
| <.0001 |
|
None | 26.3 (1.3) | 24.4 (0.7) | 21.3 (0.5) |
| 23.8 (0.5) | 20.0 (0.7) | 19.8 (1.3) |
|
|
Light-moderate | 47.9 (1.4) | 54.7 (0.8) | 61.2 (0.6) |
| 56.0 (0.5) | 62.4 (0.9) | 64.5 (1.6) |
|
|
Heavy | 25.9 (1.3) | 20.9 (0.6) | 17.5 (0.5) |
| 20.2 (0.4) | 17.5 (0.7) | 15.6 (1.3) |
|
| Chewing, % |
|
|
| <.0001 |
|
|
| <.0001 |
| Great
discomfort | 12.5 (0.9) | 7.7 (0.4) | 3.8 (0.2) |
| 6.7 (0.3) | 3.7 (0.3) | 2.4 (0.5) |
|
|
Discomfort | 24.4 (1.2) | 21.9 (0.7) | 20.2 (0.5) |
| 22.0 (0.5) | 19.6 (0.7) | 16.5 (1.1) |
|
| Minor
problems | 16.6 (1.1) | 16.6 (0.6) | 14.4 (0.6) |
| 14.6 (0.5) | 16.2 (0.6) | 19.1 (1.3) |
|
| Minimal
problems | 18.9 (1.1) | 22.9 (0.7) | 27.7 (1.0) |
| 24.5 (0.8) | 27.1 (0.9) | 30.1 (1.6) |
|
| No
discomfort | 27.6 (1.4) | 30.9 (0.9) | 33.8 (1.0) |
| 32.1 (0.9) | 33.4 (1.0) | 31.9 (1.7) |
| Speech, % |
|
|
| <.0001 |
|
|
| <.0001 |
| Great
discomfort | 4.3 (0.5) | 1.6 (0.2) | 0.8 (0.1) |
| 1.6 (0.1) | 0.8 (0.1) | 0.5 (0.2) |
|
|
Discomfort | 10.9 (0.9) | 6.9 (0.4) | 5.5 (0.3) |
| 7 (0.3) | 5.3 (0.4) | 3.6 (0.6) |
|
| Minor
problems | 12.1 (1.0) | 8.8 (0.5) | 6.3 (0.3) |
| 7.4 (0.3) | 7.9 (0.5) | 7.8 (0.9) |
|
| Minimal
problems | 20.3 (1.1) | 22.7 (0.8) | 27.3 (1.2) |
| 25.8 (0.9) | 24.3 (0.9) | 23.9 (1.6) |
|
| No
discomfort | 52.4 (1.5) | 60.0 (0.9) | 60 (1.2) |
| 58.2 (1) | 61.7 (1.1) | 64.1 (1.8) |
|
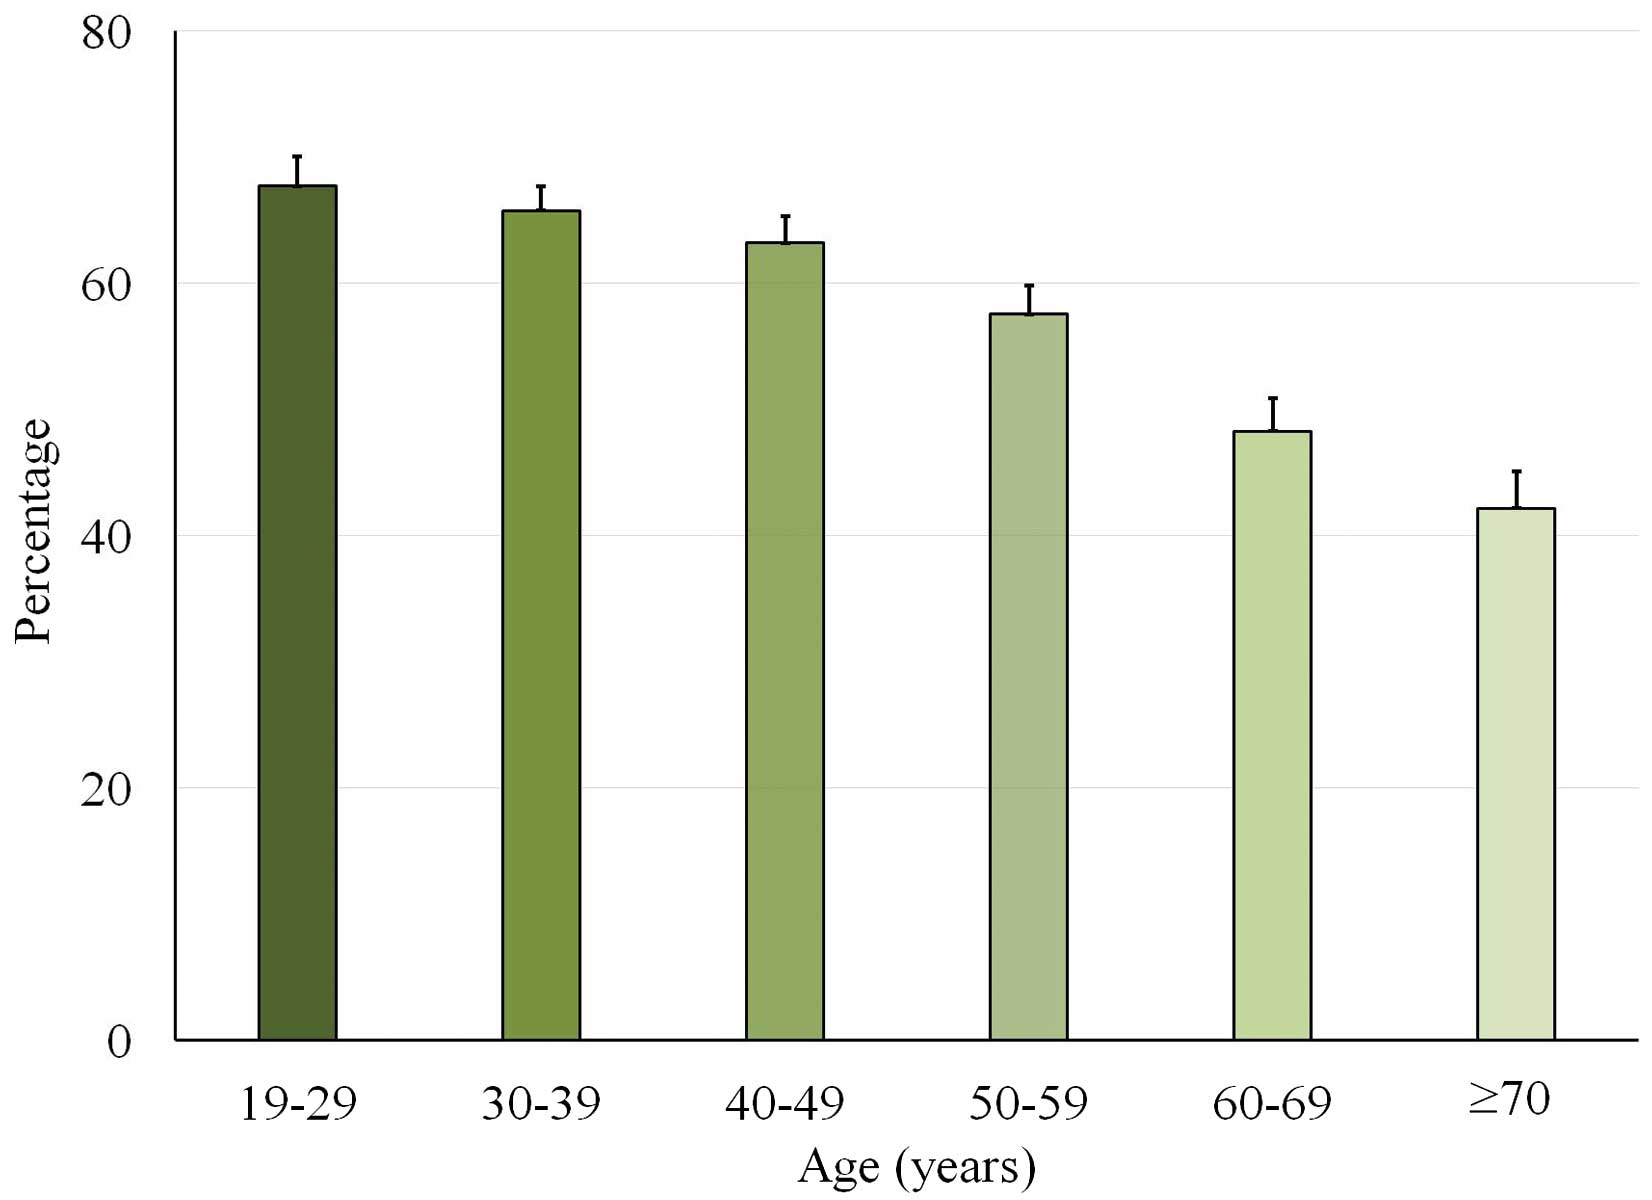
Age
Participants who brushed ≥3 times per day according
to age are presented in Fig. 1. The
incidence of individuals who brushed ≥3 times per day decreased
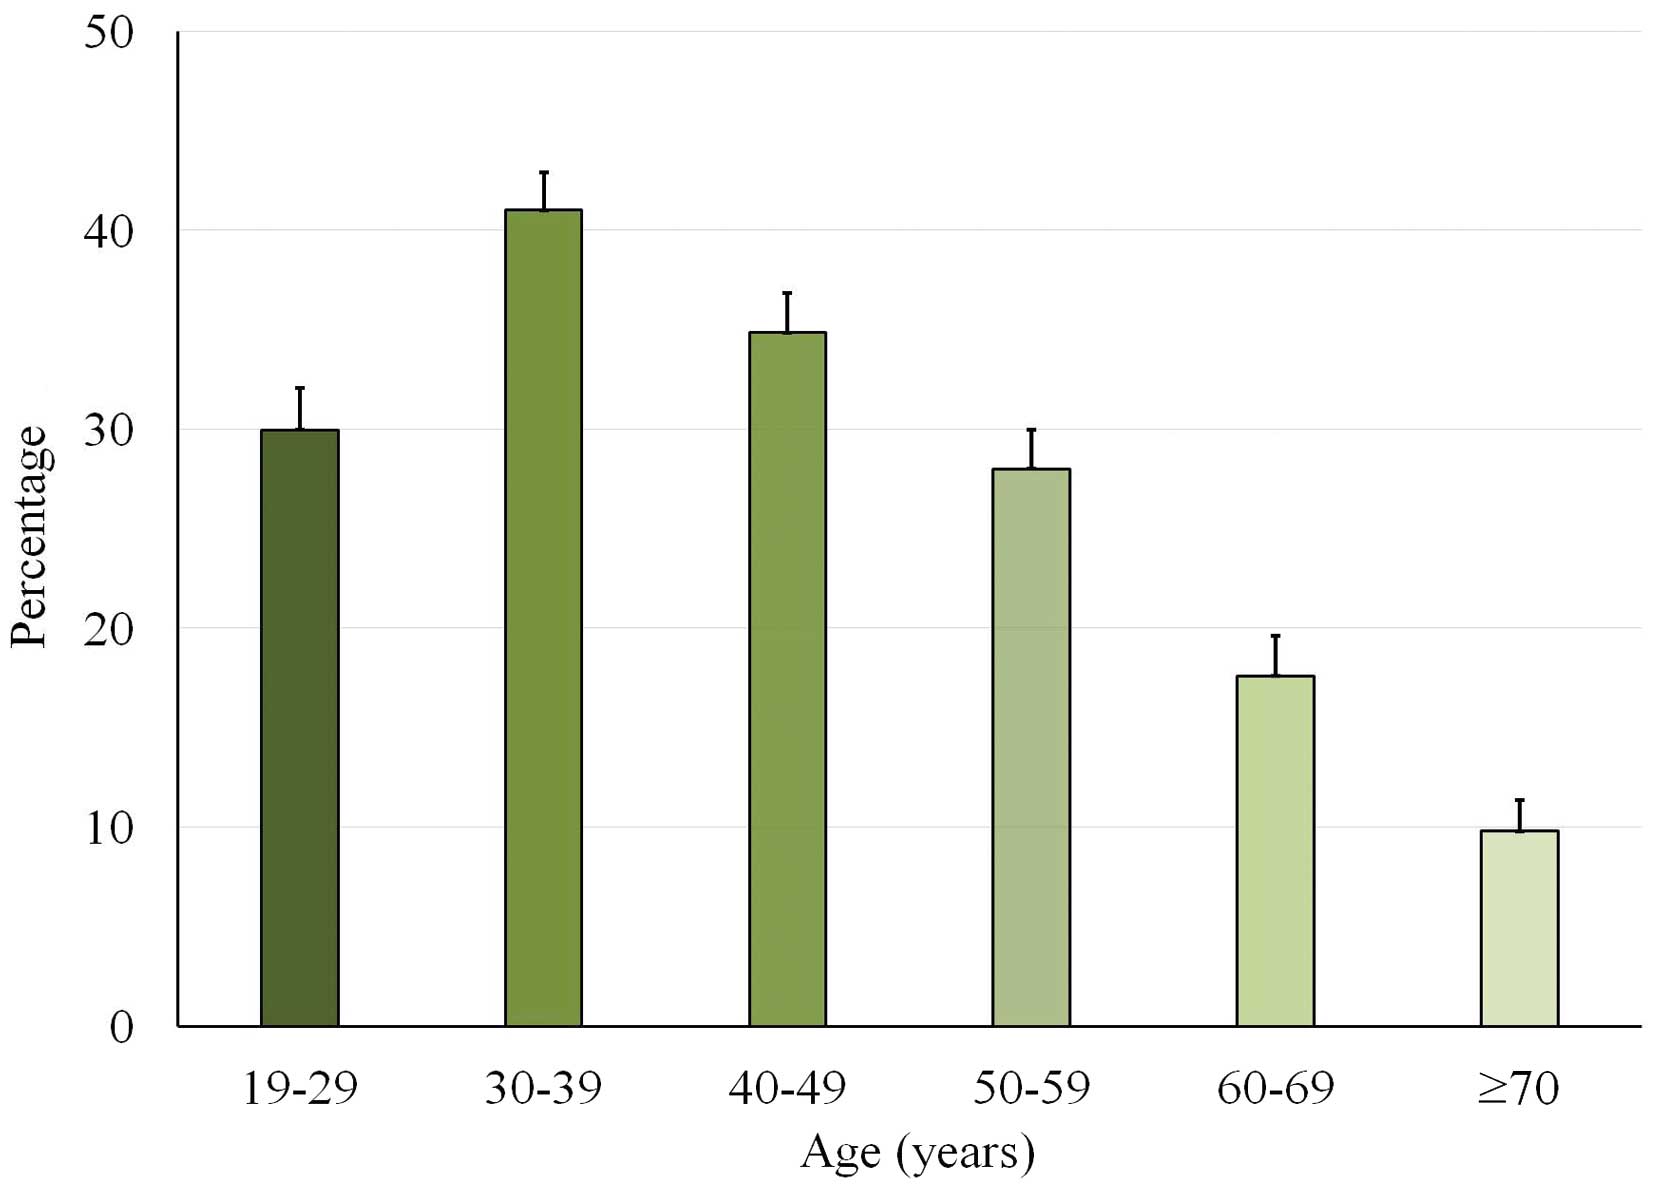
with increasing age. The use of secondary oral products according
to age is presented in Fig. 2.
Participants aged between 30 and 39 years exhibited the highest
percentage of secondary oral product usage. The results suggest
that age was associated with oral health behaviors.
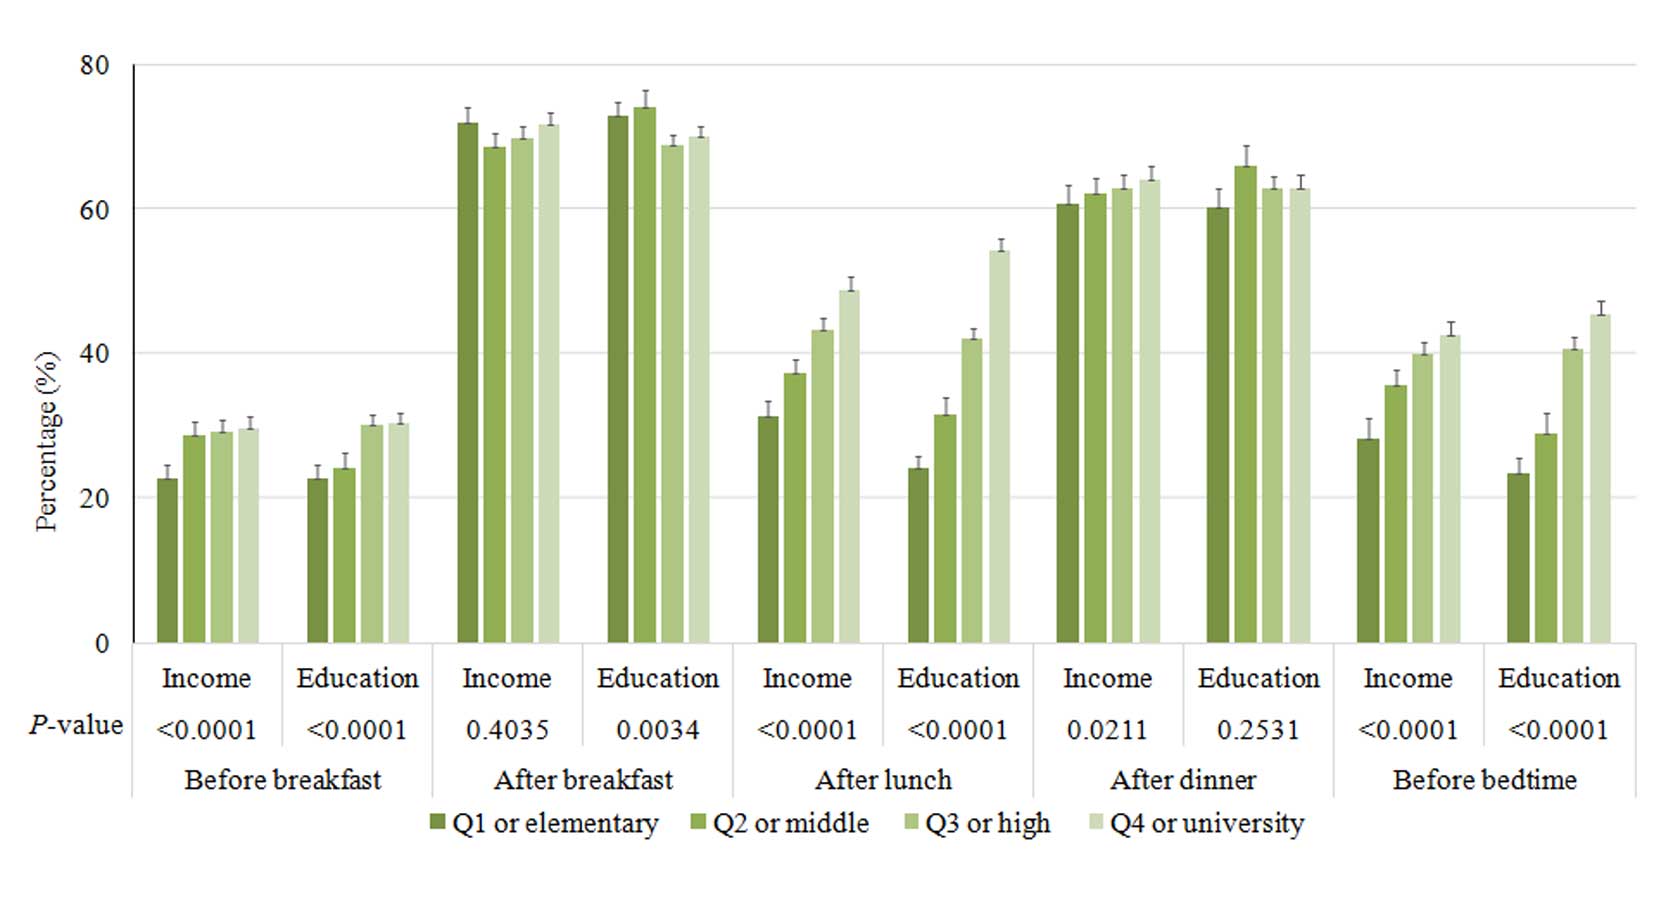
Socioeconomic factors
It was demonstrated that the time of day that tooth
brushing occurred differed according to socioeconomic factors
(Fig. 3). At the majority of the
time points, participants in the highest quartile of income were
most likely to brush their teeth. Similarly, individuals with the
highest education were more likely to brush their teeth at the most
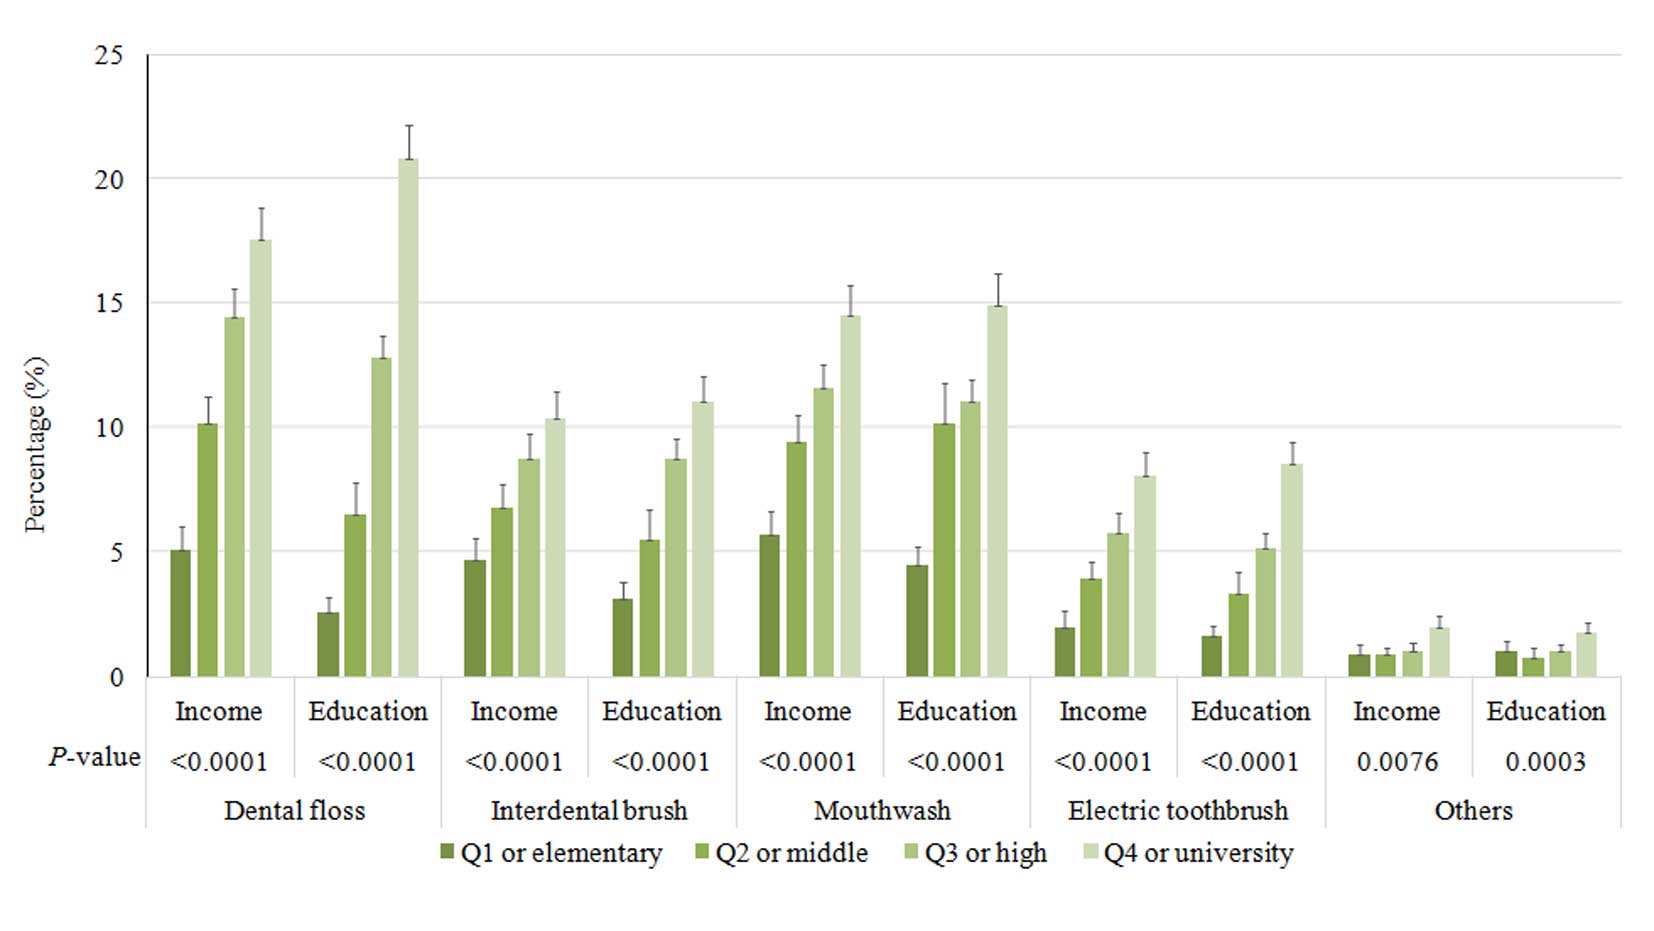
of the time points. Socioeconomic factors were also associated with
the use of secondary oral products (Fig.
4). Participants in the highest quartile of income and highest
education were more likely to use dental floss, interdental
brushes, mouthwash and electric toothbrushes. Participants who
brushed ≥3 times per day exhibited the highest proportion of
individuals in the highest quartile of income, and individuals who
used more than one type of secondary oral product had a higher
proportion in the highest quartile of income and education level,
as compared with the other groups (Table II). Furthermore, participants in the
highest quartile of income were most likely to have had a dental
examination within the past year, as compared with the other
quartiles (Table III). Similarly,
individuals who had completed a higher level of education (high
school graduate or higher) were more likely to have had a dental
examination within the past year, as compared with the lower levels
of education, which were defined as less than a high school degree.
The results suggested that socioeconomic factors are associated
with oral health behaviors.
| Table II.Association between socioeconomic
status and tooth brushing frequency and the use of secondary oral
products. |
Table II.
Association between socioeconomic
status and tooth brushing frequency and the use of secondary oral
products.
|
| Daily tooth
brushing frequency |
| Daily use of
secondary oral products |
|
|---|
|
|
|
|
|
|
|---|
| Variable | 0–1 | 2 | ≥3 | P-value | 0 | 1 | ≥2 | P-value |
|---|
| Income |
|
|
| <.0001 |
|
|
| <.0001 |
| Q1 | 26.4 (1.5) | 18.2 (0.7) | 12.9 (0.6) |
| 18.8 (0.6) | 9.5 (0.6) | 4.4 (0.7) |
|
| Q2 | 29.4 (1.5) | 26.7 (0.9) | 24.3 (0.7) |
| 27.3 (0.7) | 22.2 (0.9) | 18.5 (1.5) |
|
| Q3 | 25.1 (1.4) | 28.6 (0.9) | 30.2 (0.7) |
| 28.3 (0.7) | 31.8 (0.9) | 31.3 (1.5) |
|
| Q4 | 19.1 (1.5) | 26.5 (1.1) | 32.6 (0.9) |
| 25.7 (0.8) | 36.4 (1.3) | 45.9 (1.8) |
|
| Education |
|
|
| <.0001 |
|
|
| <.0001 |
|
Elementary school | 33.6 (1.6) | 24.2 (0.9) | 13 (0.5) |
| 23.2 (0.7) | 7.6 (0.5) | 3.5 (0.6) |
|
| Middle
school | 12.6 (0.9) | 12 (0.5) | 9 (0.3) |
| 11.4 (0.3) | 8.4 (0.5) | 4.8 (0.7) |
|
| High
school | 34.6 (1.7) | 40 (0.9) | 40.9 (0.7) |
| 39.6 (0.7) | 42.6 (0.9) | 37 (1.8) |
|
|
University | 19.3 (1.3) | 23.8 (0.9) | 37.1 (0.8) |
| 25.9 (0.7) | 41.3 (1.1) | 54.7 (1.9) |
|
| Table III.Association between socioeconomic
status and attendance at a dental checkup within a year. |
Table III.
Association between socioeconomic
status and attendance at a dental checkup within a year.
|
| Dental checkup
within a year |
|
|---|
|
|
|
|
|---|
|
| No | Yes | P-value |
|---|
| Income |
|
| <.0001 |
| Q1 | 17.6 (0.6) | 10.2 (0.7) |
|
| Q2 | 26.8 (0.7) | 21.5 (0.9) |
|
| Q3 | 29.3 (0.7) | 29.4 (1.0) |
|
| Q4 | 26.3 (0.8) | 38.9 (1.4) |
|
| Education |
|
| <.0001 |
|
Elementary school | 20.6 (0.6) | 11.6 (0.6) |
|
| Middle
school | 10.7 (0.3) | 8.8 (0.5) |
|
| High
school | 40.3 (0.7) | 39.3 (0.9) |
|
|
University | 28.4 (0.7) | 40.2 (1.1) |
|
Tables IV and
V present the adjusted odds ratios
and 95% CIs from multiple logistic regression analyses. The
association detected between the frequency of tooth brushing and
SES remained after all adjustment models (Table IV). Adjusted odds ratios and their
95% CIs were 1.086 (0.941–1.253), 1.158 (1.006–1.334), and 1.264
(1.094–1.460) for the second, third and fourth quartiles of income,
respectively (Model 4). Adjusted odds ratios and their 95% CIs for
the middle school, high school, and university or higher graduate
groups were 1.475 (1.268–1.716), 1.765 (1.537–2.026), and 2.686
(2.286–3.155), respectively (Model 4). The association between the
use of secondary oral products and SES remained after adjustment
(Table V). Adjusted odds ratios and
their 95% CIs were 1.266 (1.092–1.469), 1.599 (1.371–1.865), and
1.835 (1.559–2.161) for the second, third and fourth quartiles of
income, respectively (Model 4). Adjusted odds ratios and their 95%
CIs for the middle school, high school, and university or higher
graduate groups were 2.231 (1.849–2.692), 3.669 (3.085–4.364), and
5.736 (4.734–6.951), respectively (Model 4). The results
demonstrate an association between SES and oral health behaviors in
a large sample of the Korean population.
| Table IV.Multivariate logistic regression
model analysis of socioeconomic status for participants who
reported ≥3 tooth brushing incidences per day. |
Table IV.
Multivariate logistic regression
model analysis of socioeconomic status for participants who
reported ≥3 tooth brushing incidences per day.
| Variables | Model 1 | Model 2 | Model 3 | Model 4 |
|---|
| Income |
|
| Q1 | 1 | 1 | 1 | 1 |
| Q2 | 1.188
(1.04–1.356) | 1.178
(1.032–1.345) | 1.174
(1.017–1.354) | 1.086
(0.941–1.253) |
| Q3 | 1.384
(1.212–1.580) | 1.358
(1.190–1.548) | 1.351
(1.173–1.555) | 1.158
(1.006–1.334) |
| Q4 | 1.686
(1.468–1.936) | 1.635
(1.424–1.877) | 1.606
(1.387–1.859) | 1.264
(1.094–1.460) |
| P-value
for trend | <.0001 | <.0001 | <.0001 | 0.0007 |
| Education |
|
|
Elementary school | 1 | 1 | 1 | 1 |
| Middle
school | 1.543
(1.344–1.772) | 1.498
(1.304–1.722) | 1.530
(1.318–1.776) | 1.475
(1.268–1.716) |
| High
school | 2.002
(1.744–2.297) | 1.931
(1.684–2.215)) | 1.862
(1.618–2.142) | 1.765
(1.537–2.026) |
|
University | 3.158
(2.701–3.692) | 2.998
(2.563–3.508) | 2.920
(2.468–3.455) | 2.686
(2.286–3.155) |
| P-value
for trend | <.0001 | <.0001 | <.0001 | <.0001 |
| Table V.Multivariate logistic regression
model analysis of participants who reported using secondary oral
products. |
Table V.
Multivariate logistic regression
model analysis of participants who reported using secondary oral
products.
| Variables | Model 1 | Model 2 | Model 3 | Model 4 |
|---|
| Income |
|
| Q1 | 1 | 1 | 1 | 1 |
| Q2 | 1.548
(1.346–1.78) | 1.523
(1.324–1.751) | 1.505 (1.295,
1.75) | 1.266 (1.092,
1.469) |
| Q3 | 2.160
(1.868–2.498) | 2.121
(1.834–2.453) | 2.116 (1.815,
2.468) | 1.599 (1.371,
1.865) |
| Q4 | 2.899
(2.498–3.365) | 2.825
(2.435–3.277) | 2.730 (2.321,
3.212) | 1.835 (1.559,
2.161) |
| P for
trend | <.0001 | <.0001 | <.0001 | <.0001 |
| Education |
|
|
Elementary school | 1 | 1 | 1 | 1 |
| Middle
school | 2.647
(2.218–3.159) | 2.543
(2.128–3.038) | 2.483
(2.057–2.997) | 2.231
(1.849–2.692) |
| High
school | 4.448
(3.782–5.232) | 4.314
(3.671–5.069) | 4.279
(3.595–5.094) | 3.669
(3.085–4.364) |
|
University | 7.487
(6.284–8.920) | 7.344
(6.164–8.748) | 7.196
(5.948–8.705) | 5.736
(4.734–6.951) |
| P for
trend | <.0001 | <.0001 | <.0001 | <.0001 |
Discussion
The present study assessed the association between
SES and oral health behaviors in a large sample of the Korean
population. The results demonstrated that the oral health behavior
of the individuals investigated differed significantly depending on
their demographic characteristics. Tooth brushing frequency
differed significantly depending on age, gender, BMI, waist
circumference, energy intake, and fat intake. The type of
residential area (urban/rural), incidence of dental checkups within
a year, smoking and drinking also affected the frequency of tooth
brushing, confirming the results of a previous study (24).
Reports of tooth brushing frequency vary among
different studies (25–27). A previous study performed in the
United Kingdom, with a sample size of 13,400 households,
demonstrated that 75% of the population performed twice-daily
brushing. However, in another previous report, 761 adolescents were
randomly selected from both public and private schools in Goiania,
which is a large town in middle-west Brazil (27), and the daily tooth brushing frequency
was reported as once to twice among 22.3% of respondents and ≥3
times among 77.7%. Therefore, this study showed that the majority
of the adolescent participants brushed their teeth three times per
day. A previous study has suggested that the high levels of plaque
and calculus in individuals who brush twice daily, suggesting that
there is still room for improving the efficacy of brushing
(25).
A previous study has demonstrated that individuals
who cleaned their teeth at least twice a day exhibited less visible
plaque, as compared with those who cleaned their teeth less than
once a day or never (25).
Similarly, this study showed that the percentage of participants
who required periodontal treatment decreased as the frequency of
tooth brushing increased, confirming the results of a previous
study (24). Regular attendance at a
routine oral health examination has been encouraged for the
maintenance of oral health and this practice has acquired an
increased importance with the publication of the evidence-based
guideline on dental recall (25). It
was demonstrated that dentate adults who reported regular dental
checkups were less likely to have visible plaque (61%) than
individuals who reported only attending the dentist when it was
necessary (76%) (25). This study
suggested that participants who brushed more were more likely to
have had a dental examination within the past year.
Previous studies have demonstrated an association
between SES and oral health behavior (27–29).
Lower income and fewer years of education are reported to increase
the risk for oral disease (29). A
previous study identified the socioeconomic factors associated with
the prevalence of periodontal treatment needs, and it was
demonstrated that participants with a higher income were less
likely to require periodontal treatment (11). Income may be a barrier to the use of
dental services and the availability of dental insurance, and
individuals with lower incomes may be less aware of the need for
proper dental care (30,31). Individuals with low education levels,
defined as less than a high school degree, had a higher prevalence
of tooth loss in a previous study (29). Similarly, in young children, the
prevalence of tooth brushing was higher among the children of
mothers with higher education, as compared with those born to
mothers with a lower education (32). Furthermore, it has been demonstrated
that the type of school (middle or high) and school grade may
affect the oral health behavior of adolescents (24). Therefore, individuals who have
completed a lower level of education may lack oral health
knowledge. A previous report demonstrated that the odds ratio of
the lowest income category, as compared with the highest, was 3.74
on the decayed missing filled teeth index (33). For participants with the lowest
income and education, this study showed that the odds ratios of
tooth brushing frequency were 1.264 and 2.686, respectively.
Similarly, the odds ratios of the lowest income and education for
the use of secondary oral products were 1.835 and 5.736,
respectively. Access for dental care may be limited due to lack of
funds, which may perpetuate a lack of oral health care knowledge
and lead to a higher prevalence of individuals with periodontal
treatment needs. This suggests that it is necessary for individuals
in lower income/education quartiles to be targeted for public
health education.
The present study demonstrated an association
between SES and oral health behaviors in a large sample of the
Korean population. Within the limits of the present study, income
and education were suggested as potential risk indicators for oral
health behaviors; therefore, patients with a low SES should be
investigated further, in relation to oral health.
Acknowledgements
The present research was supported by the Basic
Science Research Program through the National Research Foundation
of Korea funded by the Ministry of Science, ICT & Future
Planning (grant no. NRF-2014R1A1A1003106). The authors thank the
Korea Centers for Disease Control and Prevention for providing
data.
References
|
1
|
Jin LJ, Lamster IB, Greenspan JS, Pitts
NB, Scully C and Warnakulasuriya S: Global burden of oral diseases:
Emerging concepts, management and interplay with systemic health.
Oral Dis. 2015.
|
|
2
|
Linden GJ, Lyons A and Scannapieco FA:
Periodontal systemic associations: Review of the evidence. J Clin
Periodontol. 40(Suppl)14:S8–19. 2013. View Article : Google Scholar : PubMed/NCBI
|
|
3
|
Singh A, Rouxel P, Watt RG and Tsakos G:
Social inequalities in clustering of oral health related behaviors
in a national sample of British adults. Prev Med. 57:102–106. 2013.
View Article : Google Scholar : PubMed/NCBI
|
|
4
|
Espinoza I, Thomson WM, Gamonal J and
Arteaga O: Disparities in aspects of oral-health-related quality of
life among Chilean adults. Community Dent Oral Epidemiol.
41:242–250. 2013. View Article : Google Scholar : PubMed/NCBI
|
|
5
|
Astrom AN, Haugejorden O, Skaret E, Trovik
TA and Klock KS: Oral Impacts on daily performance in norwegian
adults: The influence of age, number of missing teeth, and
socio-demographic factors. Eur J Oral Sci. 114:115–121. 2006.
View Article : Google Scholar : PubMed/NCBI
|
|
6
|
Thomson WM: Social inequality in oral
health. Community Dent Oral Epidemiol. 40 Suppl 2:S28–S32. 2012.
View Article : Google Scholar
|
|
7
|
Paula JS, Ambrosano GM and Mialhe FL: The
impact of social determinants on schoolchildren';s oral health in
Brazil. Braz Oral Res. 29:1–9. 2015. View Article : Google Scholar : PubMed/NCBI
|
|
8
|
Wennstrom A, Ahlqwist M, Stenman U,
Bjorkelund C and Hakeberg M: Trends in tooth loss in relation to
socio-economic status among Swedish women, aged 38 and 50 years:
Repeated cross-sectional surveys 1968-2004. BMC Oral Health.
13:632013. View Article : Google Scholar : PubMed/NCBI
|
|
9
|
Paganini-Hill A, White SC and Atchison KA:
Dental health behaviors, dentition, and mortality in the elderly:
the leisure world cohort study. J Aging Res. 2011:1560612011.
View Article : Google Scholar : PubMed/NCBI
|
|
10
|
Hayasaka K, Tomata Y, Aida J, Watanabe T,
Kakizaki M and Tsuji I: Tooth loss and mortality in elderly
Japanese adults: Effect of oral care. J Am Geriatr Soc. 61:815–820.
2013. View Article : Google Scholar : PubMed/NCBI
|
|
11
|
Kim DW, Park JC, Rim TT, Jung UW, Kim CS,
Donos N, Cha IH and Choi SH: Socioeconomic disparities of
periodontitis in Koreans based on the KNHANES IV. Oral Dis.
20:551–559. 2014. View Article : Google Scholar : PubMed/NCBI
|
|
12
|
Kim YH, Cho KH, Choi YS, Kim SM, Nam GE,
Lee SH, Ko BJ, Park YG, Han KD, Lee KS and Kim DH: Low bone mineral
density is associated with metabolic syndrome in South Korean men
but not in women: The 2008-2010 Korean national health and
nutrition examination survey. Arch Osteoporos. 8:1422013.
View Article : Google Scholar : PubMed/NCBI
|
|
13
|
Korea Center for Disease Control and
Prevention, . Korea National Health and Nutrition Examination
Survey. 2008, http://knhanes.cdc.go.kr
|
|
14
|
Nam GE, Cho KH, Park YG, Han KD, Choi YS,
Kim SM, Lee KS, Ko BJ, Kim YH, Han BD and Kim do H: Socioeconomic
status and dyslipidemia in Korean adults: The 2008-2010 Korea
national health and nutrition examination survey. Prev Med.
57:304–309. 2013. View Article : Google Scholar : PubMed/NCBI
|
|
15
|
Kim YH, Kim DH, Lim KS, Ko BJ, Han BD, Nam
GE, Park YG, Han KD, Kim JH and Cho KH: Oral health behaviors and
metabolic syndrome: The 2008-2010 Korean national health and
nutrition examination survey. Clin Oral Investig. 18:1517–1524.
2014. View Article : Google Scholar : PubMed/NCBI
|
|
16
|
Oh JY, Yang YJ, Kim BS and Kang JH:
Validity and reliability of Korean version of International
Physical Activity Questionnaire (IPAQ) short form. Journal of the
Korean Academy of Family Medicine. 28:532–541. 2007.
|
|
17
|
Lee K: Body composition and vitamin D
status: The Korea national health and nutrition examination survey
IV (KNHANES IV). J Hum Nutr Diet. 26 Suppl 1:S105–S113. 2013.
View Article : Google Scholar
|
|
18
|
Kim DW, Song S, Lee JE, Oh K, Shim J,
Kweon S, Paik HY and Joung H: Reproducibility and validity of an
FFQ developed for the Korea National Health and Nutrition
Examination Survey (KNHANES). Public Health Nutr. 18:1369–1377.
2015. View Article : Google Scholar : PubMed/NCBI
|
|
19
|
Nam GE, Kim do H, Cho KH, Park YG, Han KD,
Choi YS, Kim SM, Ko BJ, Kim YH and Lee KS: Estimate of a predictive
cut-off value for serum 25-hydroxyvitamin D reflecting abdominal
obesity in Korean adolescents. Nutr Res. 32:395–402. 2012.
View Article : Google Scholar : PubMed/NCBI
|
|
20
|
Susin C, Kingman A and Albandar JM: Effect
of partial recording protocols on estimates of prevalence of
periodontal disease. J Periodontol. 76:262–267. 2005. View Article : Google Scholar : PubMed/NCBI
|
|
21
|
Kingman A, Susin C and Albandar JM: Effect
of partial recording protocols on severity estimates of periodontal
disease. J Clin Periodontol. 35:659–667. 2008. View Article : Google Scholar : PubMed/NCBI
|
|
22
|
Kim EJ, Jin BH and Bae KH: Periodontitis
and obesity: A study of the fourth Korean national health and
nutrition examination survey. J Periodontol. 82:533–542. 2011.
View Article : Google Scholar : PubMed/NCBI
|
|
23
|
Lee JB, Yi HY and Bae KH: The association
between periodontitis and dyslipidemia based on the fourth Korea
national health and nutrition examination survey. J Clin
Periodontol. 40:437–442. 2013. View Article : Google Scholar : PubMed/NCBI
|
|
24
|
Kim HY, Kim Y, Hwang JM and Park YD: Oral
health behaviours according to demographic characteristics in
Korean adolescents: A national representative sample. Int Dent J.
61:168–173. 2011. View Article : Google Scholar : PubMed/NCBI
|
|
25
|
Hill KB, Chadwick B, Freeman R, O'Sullivan
I and Murray JJ: Adult dental health survey 2009: Relationships
between dental attendance patterns, oral health behaviour and the
current barriers to dental care. Br Dent J. 214:25–32. 2013.
View Article : Google Scholar : PubMed/NCBI
|
|
26
|
Gibson S and Williams S: Dental caries in
pre-school children: Associations with social class, toothbrushing
habit and consumption of sugars and sugar-containing foods. Further
analysis of data from the national diet and nutrition survey of
children aged 1.5-4.5 years. Caries Res. 33:101–113. 1999.
|
|
27
|
Freire MC, Sheiham A and Hardy R:
Adolescents' sense of coherence, oral health status, and oral
health-related behaviours. Community Dent Oral Epidemiol.
29:204–212. 2001. View Article : Google Scholar : PubMed/NCBI
|
|
28
|
Armfield JM, Mejia GC and Jamieson LM:
Socioeconomic and psychosocial correlates of oral health. Int Dent
J. 63:202–209. 2013. View Article : Google Scholar : PubMed/NCBI
|
|
29
|
Jiang Y, Okoro CA, Oh J and Fuller DL:
Sociodemographic and health-related risk factors associated with
tooth loss among adults in Rhode Island. Prev Chronic Dis.
10:E452013. View Article : Google Scholar : PubMed/NCBI
|
|
30
|
Bayat F, Vehkalahti MM, Zafarmand AH and
Tala H: Impact of insurance scheme on adults' dental check-ups in a
developing oral health care system. Eur J Dent. 2:3–10.
2008.PubMed/NCBI
|
|
31
|
Kiyak HA and Reichmuth M: Barriers to and
enablers of older adults' use of dental services. J Dent Educ.
69:975–986. 2005.PubMed/NCBI
|
|
32
|
Casanova-Rosado AJ, Medina-Solis CE,
Casanova-Rosado JF, Vallejos-Sánchez AA, Maupomé G and Avila-Burgos
L: Dental caries and associated factors in Mexican schoolchildren
aged 6-13 years. Acta Odontol Scand. 63:245–251. 2005. View Article : Google Scholar : PubMed/NCBI
|
|
33
|
Geyer S, Schneller T and Micheelis W:
Social gradients and cumulative effects of income and education on
dental health in the fourth german oral health study. Community
Dent Oral Epidemiol. 38:120–128. 2010. View Article : Google Scholar : PubMed/NCBI
|