Introduction
Keloid scar of skin is a soft tissue benign skin
tumor that originates from the proliferation of connective tissue
following skin injury (1). Data show
that the morbidity of keloid scars has been high in recent years,
and female cases are more common than male cases (2). There are a variety of clinical
treatment methods for keloids, including glucocorticoid injection
under the skin, freezing, compression, ultrashort wave therapy, and
simple surgery (3,4). However, clinical data reveal that the
therapeutic effects are poor due to easy recurrence and high
morbidity (5). Therefore, it is
necessary to explore some biomarkers for keloid scar therapy in
clinical practice.
The pathogenesis of keloid scar formation is
complicated, particularly the key roles of fibroblasts and
keratinocytes in this type of disease (6,7). Werner
et al demonstrated that keratinocytes interact with
fibroblasts and then function in wound healing (8). Keloid-derived keratinocytes were shown
to perform a promoting role on fibroblast growth and proliferation
in an in vitro study (7).
Furthermore, there is increasing evidence that many key molecules
play crucial roles during keloid scar development through
fibroblasts and keratinocytes from a molecular perspective. For
instance, downregulation of the inhibitors SMAD6 and SMAD7 was
found in keloid scar tissue (9), and
overexpression of bone morphogenetic protein (BMP)2 contributed to
fibroblast cell proliferation and collagen synthesis during
cholesteatoma progression (10).
Although many researchers have focused on the pathogenesis of
fibroblasts and keratinocytes in keloid scar development and
progression, the molecular mechanism remains incompletely
elucidated.
Gene expression analysis provides the basis for
predicting target genes that are associated with many diseases.
Hahn et al investigated abnormally expressed genes in keloid
keratinocytes and fibroblasts using the GSE44270 microarray
(11). In the present study, the
expression of functional genes of keloid keratinocytes and
fibroblasts was analyzed using the same gene expression profile.
Comprehensive bioinformatics methods were used to analyze the
significant biological processes and pathways of differentially
expressed genes (DEGs) that are associated with the pathogenesis of
keloids. This study aimed to identify several key genes and
investigate the key pathways that are associated with the
development and progression of keloid scarring of skin.
Materials and methods
Data resources and data
preprocessing
The gene expression profile of GSE44270, which
includes 32 samples, was downloaded from the National Center of
Biotechnology Information (NCBI) Gene Expression Omnibus database
(http://www.ncbi.nlm.nih.gov/geo/) based
on the platform [HuGene-1_0-st] Affymetrix Human Gene 1.0 ST Array
[transcript (gene) version] (Affymetrix, Inc., Santa Clara, CA,
USA). The data contains 3 control fibroblast, 3 control
keratinocyte, 9 keloid fibroblast, 9 keloid keratinocyte, 4
non-lesional fibroblast and 4 non-keratinocyte samples. Skin and
scar tissues were collected for the isolation of primary
keratinocytes and fibroblasts, and keloid scars were excised from
patients undergoing elective plastic surgery. Control samples were
from normal skin tissues. The total samples were separated into six
groups, specifically, fibroblast keloid vs. normal, fibroblast
non-lesion vs. normal, fibroblast keloid vs. non-lesion, keratocyte
keloid vs. normal, keratocyte non-lesion vs. normal, and keratocyte
keloid vs. non-lesion.
The downloaded files were preprocessed using the R
package in the Robust Multi-array Analysis (RMA) method (12). The probe IDs were transformed into
gene bank IDs using Database for Annotation, Visualization and
Integrated Discovery (DAVID) software (13).
DEG screening
The DEGs in case samples compared with the control
samples were screened using the R package in Limma (14). An adjusted P-value based on false
discovery rate (FDR) of <0.01 (15) and log2 |fold change (FC)|
>1 were chosen as the thresholds.
Hierarchical clustering analysis of
DEGs
In order to identify the selected DEGs from
different tissue samples, hierarchical clustering was used to
analyze the total selected DEGs from the fibroblast or keratinocyte
samples using the Python programming language (16). Also, Pearson correlation was used to
establish the similarity matrix of DEGs (17), and the type of linkage used was the
average linkage (18).
Protein-protein interaction (PPI)
network construction
In order to investigate the potential genes that
interacted with the selected DEGs, the total screened DEGs were
used to construct a PPI network based on the BioGRID database
(19) and the Human Protein
Reference Database (HPRD) database (20). Cytoscape (21) was used to conduct a topological
analysis of the constructed network to study the node degrees of
the DEGs.
Functional enrichment analysis of the
DEGs
The biological processes and significant pathways
for the total selected DEGs in the six groups were enriched using
the DAVID online software with (Gene Ontology) GO and Kyoto
Encyclopedia of Genes and Genomes (KEGG) terms. Terms with DEG
number >10 and P<0.05 were selected as they were considered
to be significant terms.
Deviation analysis of dynamic
capabilities
The enriched biological processes and pathways of
DEGs in the three groups (non-lesion vs. normal, keloid vs. normal
and keloid vs. non-lesion) suggested some significant pathways that
were involved in the process of skin and scar pathogenesis from
normal to non-lesion, and then to skin and scar disease. The
dynamic capability of each significant pathway term was calculated
with the following formula (22):
A(P)=1N∑i=1Nω(Xi–Yi)2
P represents function, A(P) represents the deviation
score, N represents the number of DEGs, Xi represents
the average expression value for one DEG i in disease development,
Yi represents the average gene expression value for one gene i in
normal tissues, and ω represents the node degree for DEG i in the
PPI network. Euclidean distances of the total DEGs between case
samples and normal samples were calculated to predict the deviation
degree of DEGs in case samples (non-lesion or keratocyte keloid)
compared with the normal samples.
Results
DEG screening and hierarchical
clustering analysis
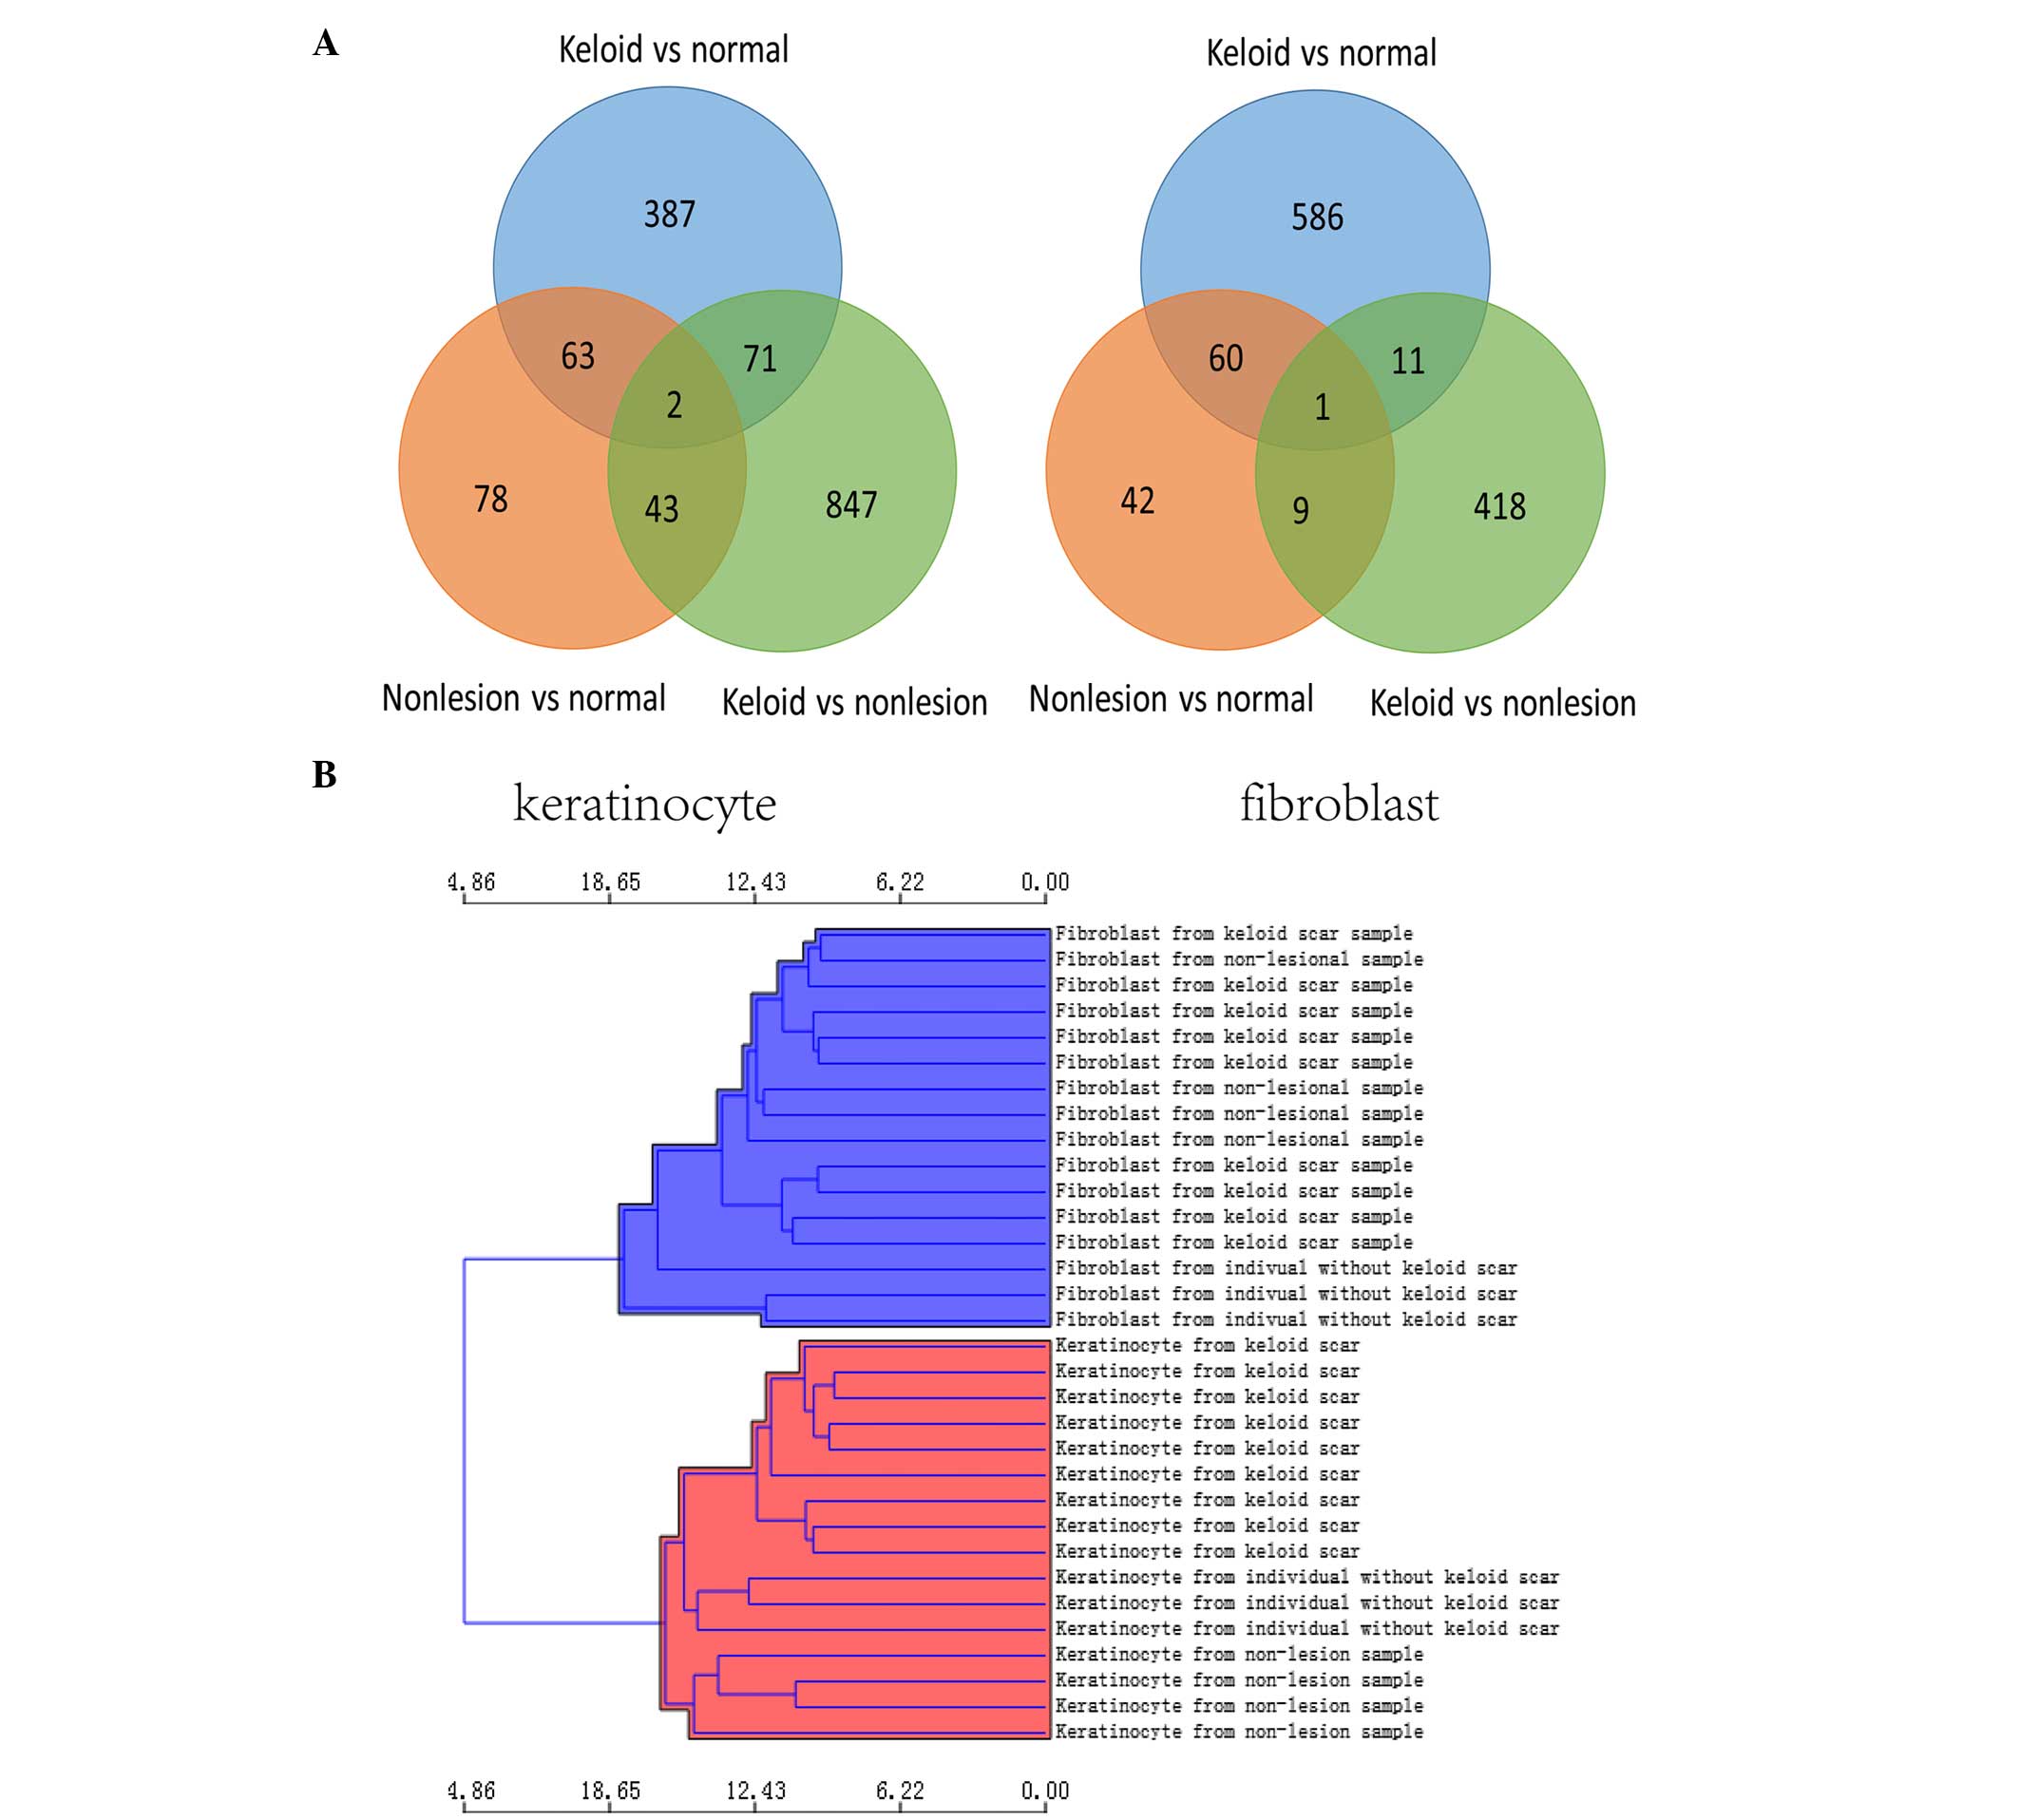
The total DEGs in the six groups were selected using
the Limma package with an adjusted P-value <0.01 and
log2|FC| >1 compared with the control samples
(Table I). There were 658 DEGs in
the fibroblast keloid vs. normal group, 112 DEGs in the fibroblast
non-lesion vs. normal group, 439 DEGs in the fibroblast keloid vs.
non-lesion group, 523 DEGs in the keratocyte keloid vs. normal
group, 186 DEGs in the keratocyte non-lesion vs. normal group, and
963 DEGs in the keratocyte keloid vs. non-lesion group. A Venn plot
of the total screened DEGs is shown in Fig. 1A; there were 2 common DEGs in
keratinocytes and 1 common DEG in fibroblasts during the
progression of skin and scar pathogenesis. In addition, the
hierarchical clustering of the DEGs in each group is shown in
Fig. 1B.
 | Table I.Differentially expressed genes in each
group. |
Table I.
Differentially expressed genes in each
group.
| Groups | Upregulated | Downregulated | Total |
|---|
| Fibroblast keloid vs.
normal | 196 | 462 | 658 |
| Fibroblast non-lesion
vs. normal | 73 | 39 | 112 |
| Fibroblast keloid vs.
non-lesion | 76 | 363 | 439 |
| Keratocyte keloid vs.
normal | 224 | 299 | 523 |
| Keratocyte non-lesion
vs. normal | 108 | 78 | 186 |
| Keratocyte keloid vs.
nonlesion | 139 | 824 | 963 |
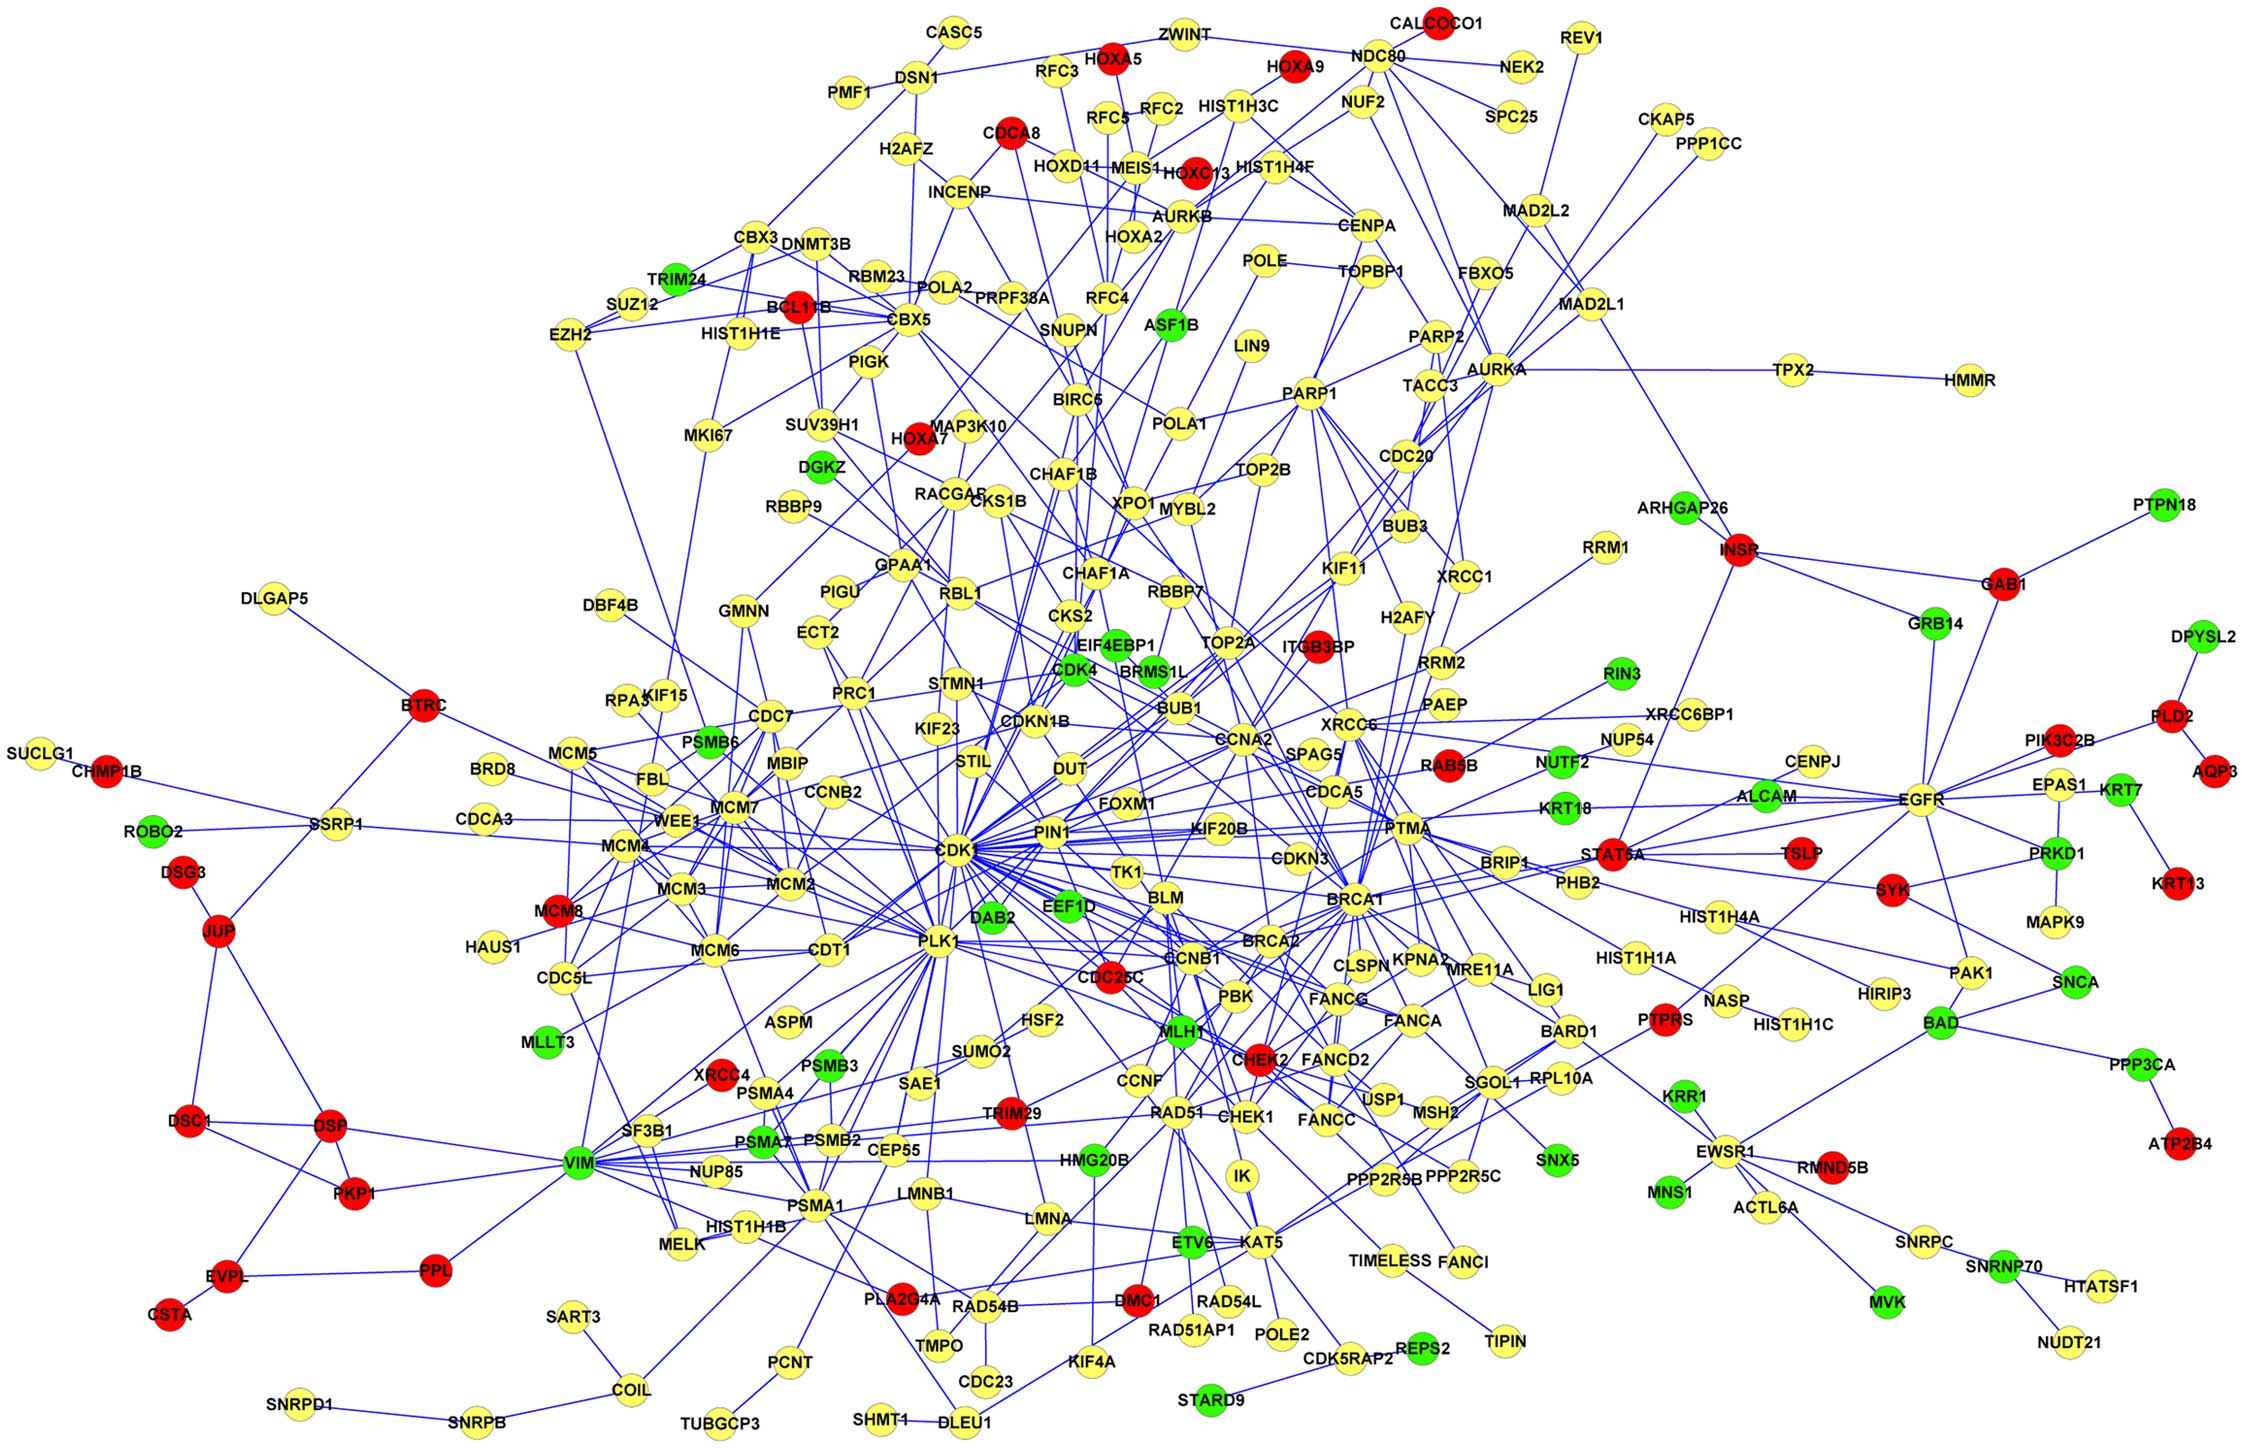
PPI network construction
The screened DEGs in the different groups were used
to construct the PPI network. The results showed that there were a
total of 456 nodes (83 upregulated, 92 downregulated and 281 other
DEGs obtained between lesion and non-lesion tissues) in the PPI
network of DEGs in keratinocytes (Fig.
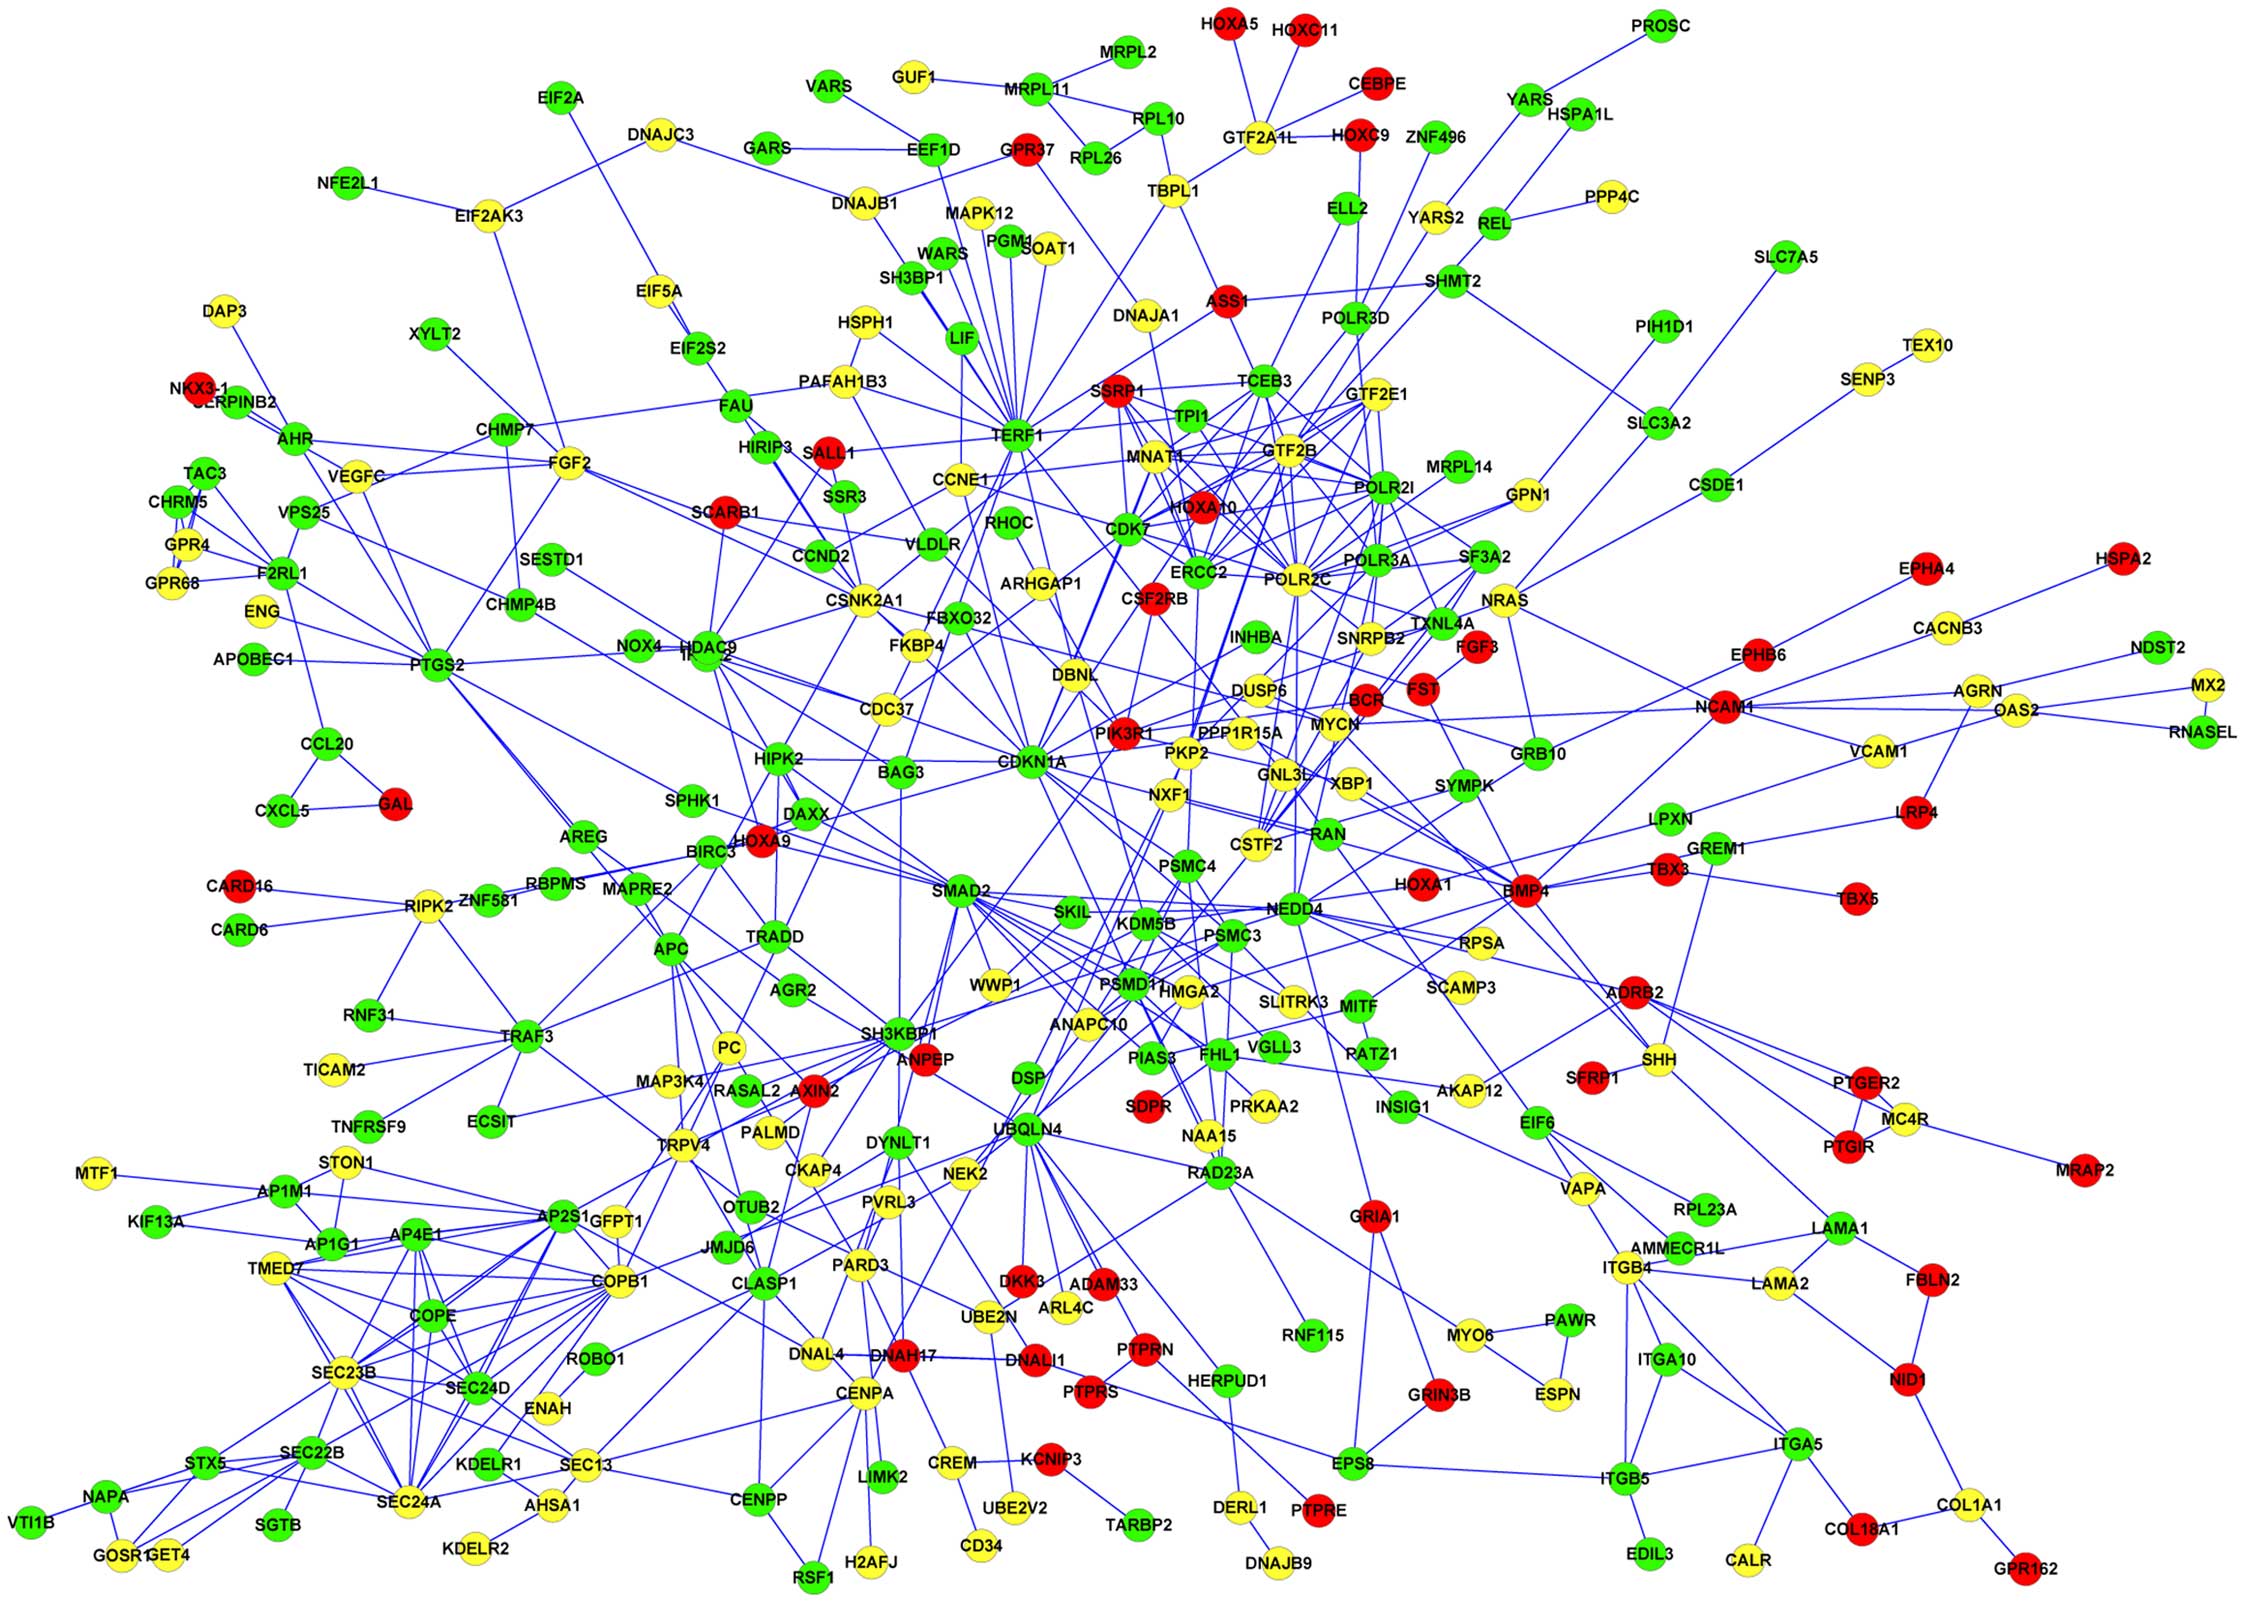
2), and there were a total of 374 nodes (74 upregulated, 181
downregulated, and 119 other DEGs obtained between lesion and
non-lesion tissues) in the PPI network of DEGs in fibroblasts
(Fig. 3). The results showed that
DEGs such as homeobox A9 (HOXA9), BMP4, and
phosphoinositide-3-kinase, regulatory subunit 1 α (PIK3R1) were
upregulated while cyclin-dependent kinase inhibitor 1A (p21, Cip1)
(CDKN1A), and SMAD family member 2 (SMAD2) were downregulated in
fibroblasts. Also, DEGs including HOXA7, minichromosome maintenance
complex component 8 (MCM8), and GRB2-associated binding protein 1
(GAB1) were upregulated while proteasome (prosome, macropain)
subunit, α type, 4 (PSMA4), PSMB2, and cyclin-dependent kinase 1
(CDK1) were downregulated in keratinocytes. In addition, structure
specific recognition protein 1 (SSRP1) was a common gene in both
keratinocytes and fibroblasts; however, it was only upregulated in
fibroblast samples.
Functional enrichment analysis of the
DEGs in each group
The significant biological processes and pathways of
screened DEGs in fibroblast and keratinocyte groups were analyzed
(Table II). The results revealed
that DEGs in fibroblast samples were enriched in significant GO
terms such as negative regulation of cellular biosynthetic process,
organ morphogenesis, and chordate embryonic development (Table IIA), and the total DEGs were
involved in significant pathways such as the amino sugar and
nucleotide sugar metabolism pathway and the extracellular matrix
(ECM)-receptor interaction pathway (Table IIB). In addition, DEGs in
keratinocyte samples were enriched in significant GO terms such as
M phase, DNA metabolic process, and M phase of mitotic cell cycle
(Table IIA), and the DEGs
participated in the significant pathways of spliceosome, cell
cycle, and DNA replication (Table
IIB).
| Table II.Enrichment analysis of DEGs in
different groups. |
Table II.
Enrichment analysis of DEGs in
different groups.
| A, Enriched GO
terms of DEGs |
|---|
|
|---|
| Term | Description | Count | P-value |
|---|
| Fibroblast
tissues |
|
GO:0009952 | Anterior/posterior
pattern formation | 24 | 7.39E-07 |
|
GO:0048706 | Embryonic skeletal
system development | 17 | 1.53E-06 |
|
GO:0048704 | Embryonic skeletal
system morphogenesis | 12 | 1.34E-04 |
|
GO:0043009 | Chordate embryonic
development | 32 | 9.87E-04 |
|
GO:0009887 | Organ
morphogenesis | 47 | 0.001376399 |
|
GO:0048705 | Skeletal system
morphogenesis | 15 | 0.001849598 |
|
GO:0048193 | Golgi vesicle
transport | 16 | 0.003092941 |
|
GO:0031327 | Negative regulation
of cellular biosynthetic process | 44 | 0.006042035 |
|
GO:0010558 | Negative regulation
of macromolecule biosynthetic process | 43 | 0.0064047 |
|
GO:0010629 | Negative regulation
of gene expression | 40 | 0.007441896 |
|
GO:0009890 | Negative regulation
of biosynthetic process | 44 | 0.008715561 |
|
GO:0045934 | Negative regulation
of nucleobase metabolic process | 40 | 0.009747494 |
| Keratinocyte
tissues |
|
GO:0000279 | M phase | 117 | 9.33E-49 |
|
GO:0000087 | M phase of mitotic
cell cycle | 89 | 2.37E-41 |
|
GO:0007067 | Mitosis | 88 | 3.71E-41 |
|
GO:0006259 | DNA metabolic
process | 114 | 6.55E-27 |
|
GO:0006260 | DNA
replication | 64 | 4.87E-25 |
|
GO:0006281 | DNA repair | 69 | 3.25E-18 |
|
GO:0007051 | Spindle
organization | 23 | 1.37E-13 |
|
GO:0000070 | Mitotic sister
chromatid segregation | 20 | 1.09E-12 |
|
GO:0010564 | Regulation of cell
cycle process | 34 | 8.10E-12 |
|
GO:0065004 | Protein-DNA complex
assembly | 29 | 6.32E-11 |
|
| B, Enriched KEGG
pathways of DEGs |
|
| Term | Pathway | Count | P-value |
|
| Fibroblast
tissues |
|
hsa00520 | Amino sugar and
nucleotide sugar metabolism | 10 | 3.92E-04 |
|
hsa00532 | Chondroitin sulfate
biosynthesis | 5 | 0.02634733 |
|
hsa00330 | Arginine and
proline metabolism | 7 | 0.02922789 |
|
hsa00970 | Aminoacyl-tRNA
biosynthesis | 6 | 0.03313658 |
|
hsa05222 | Small cell lung
cancer | 9 | 0.03478867 |
|
hsa04512 | ECM-receptor
interaction | 9 | 0.04478867 |
| Keratinocyte
tissues |
|
hsa03030 | DNA
replication | 23 | 1.19E-16 |
|
hsa04110 | Cell cycle | 34 | 4.86E-11 |
|
hsa03430 | Mismatch
repair | 10 | 2.06E-05 |
|
hsa03040 | Spliceosome | 24 | 4.27E-05 |
|
hsa04114 | Oocyte meiosis | 22 | 4.63E-05 |
|
hsa03440 | Homologous
recombination | 10 | 1.24E-04 |
|
hsa03410 | Base excision
repair | 11 | 1.59E-04 |
|
hsa03420 | Nucleotide excision
repair | 11 | 0.001171 |
|
hsa00240 | Pyrimidine
metabolism | 16 | 0.004088 |
|
hsa00230 | Purine
metabolism | 21 | 0.009136 |
Deviation analysis of dynamic
capabilities
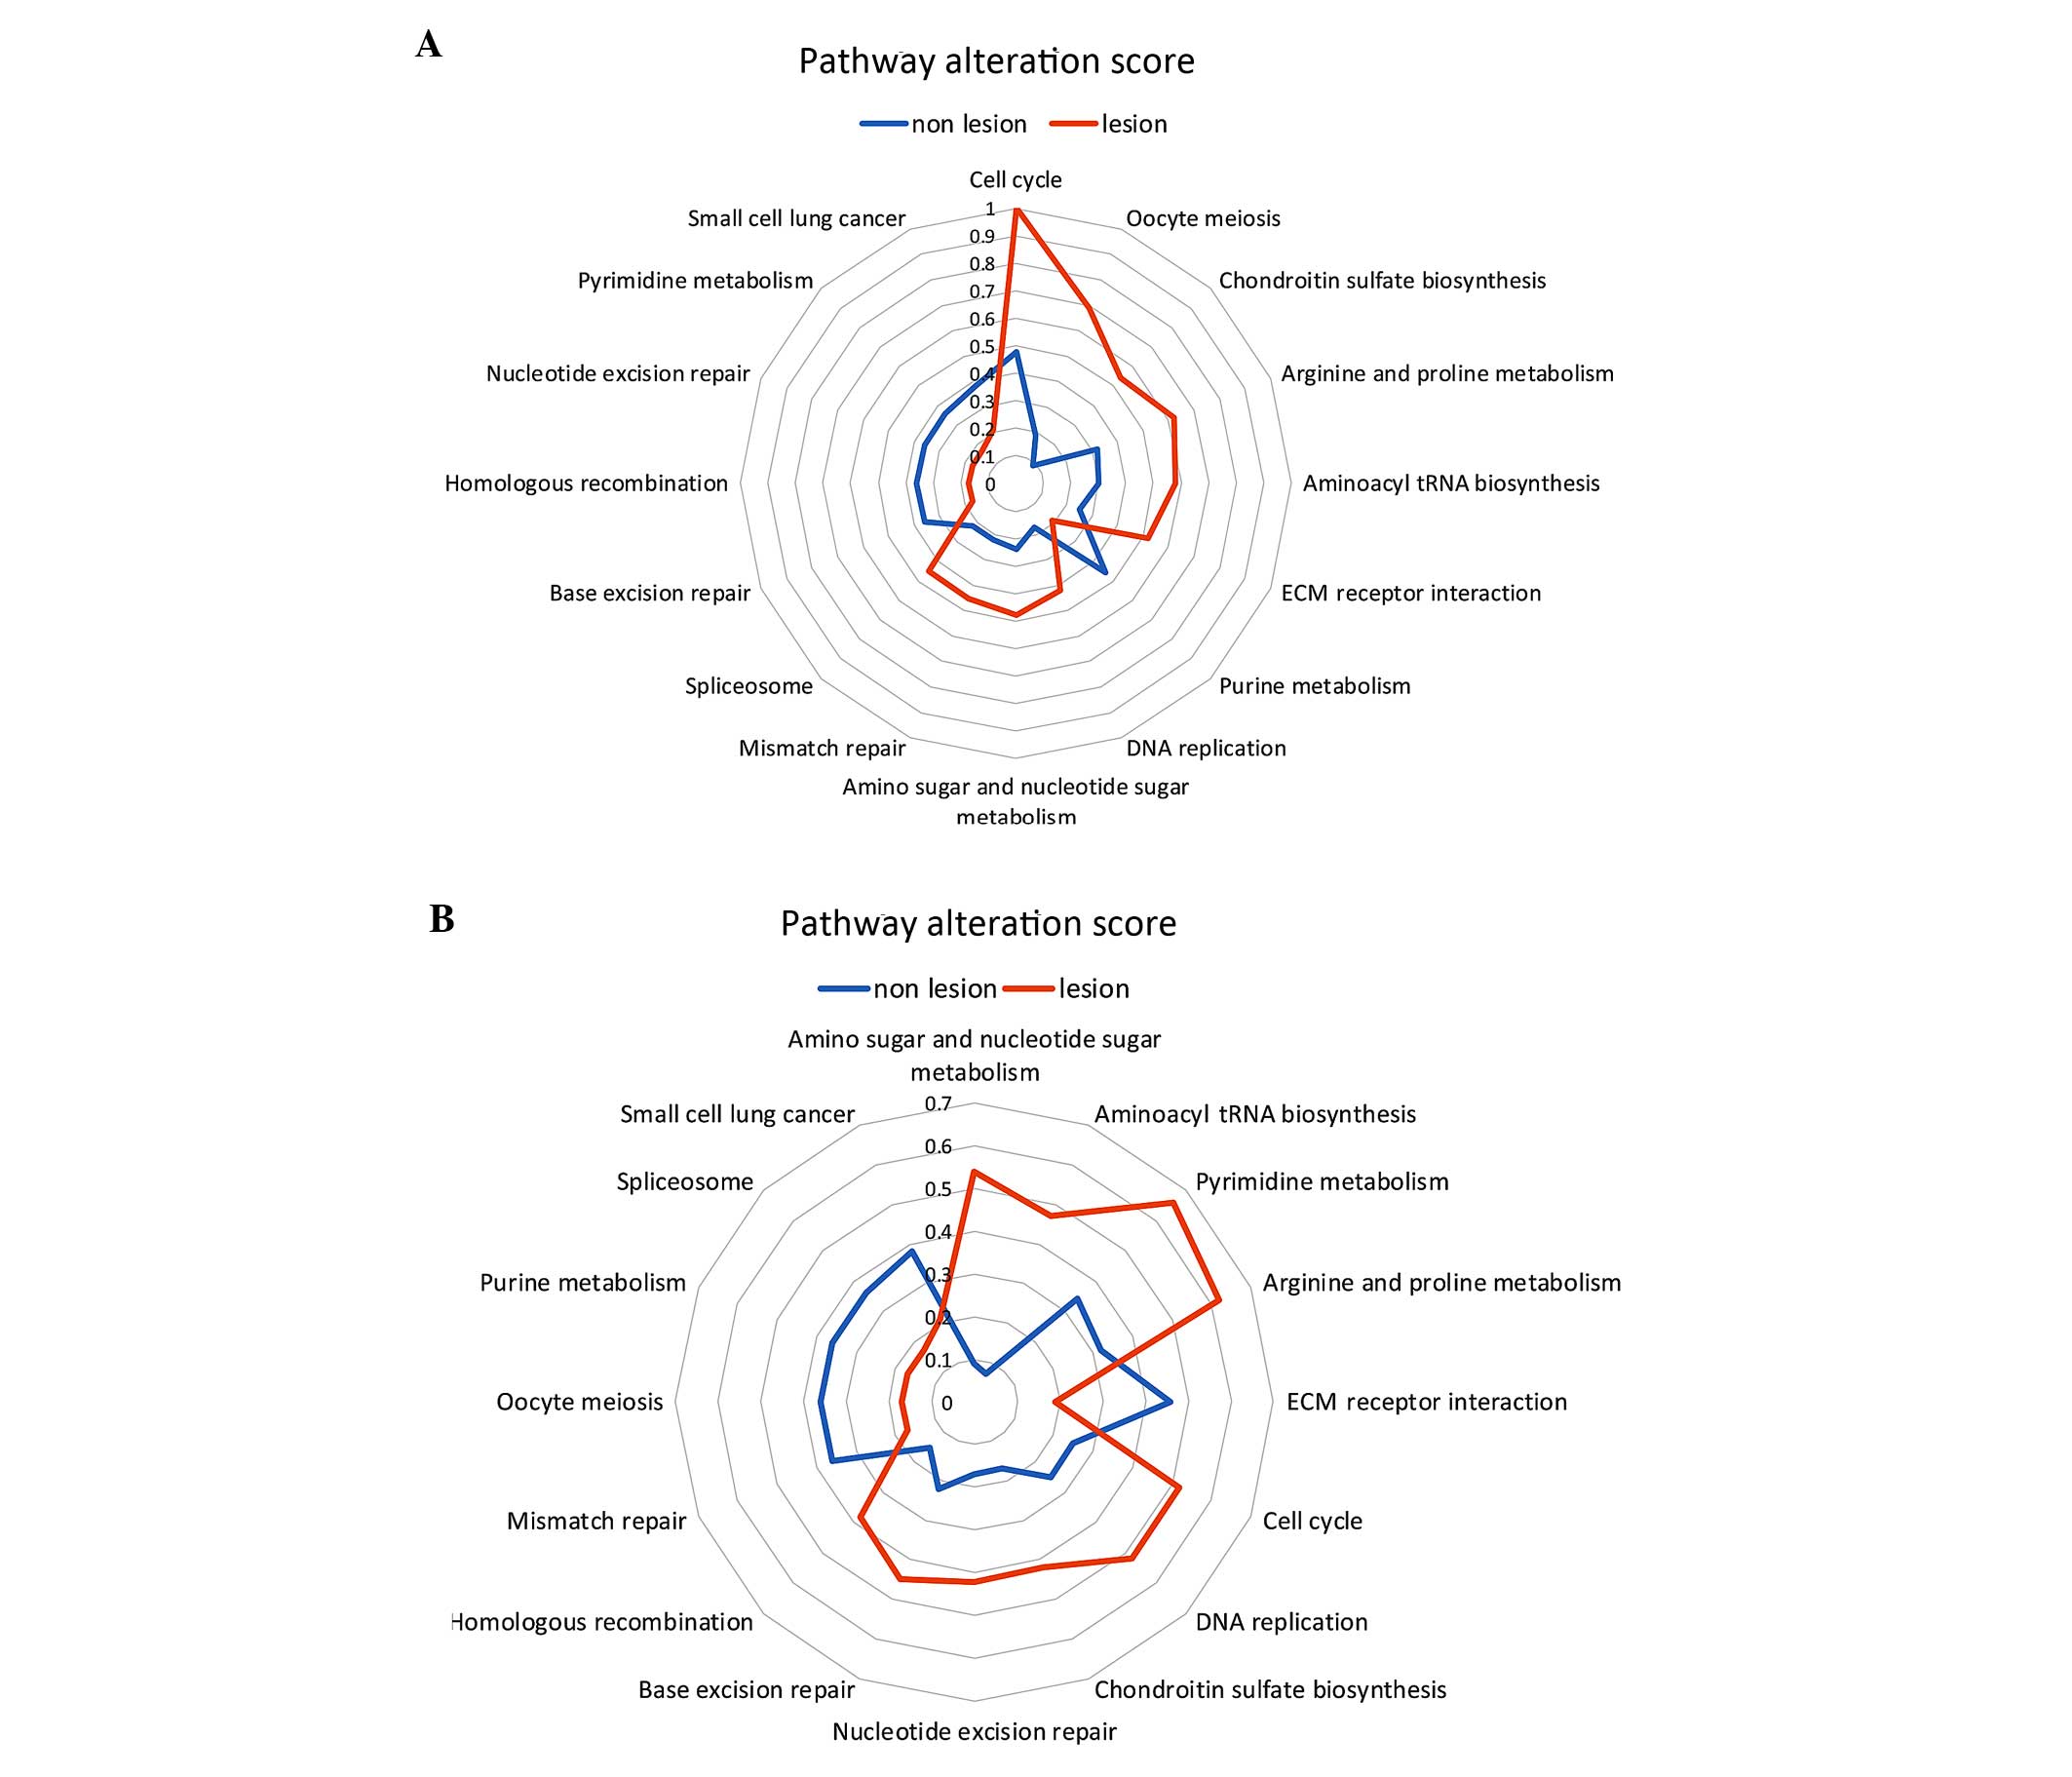
A total of 16 pathways of DEGs from the fibroblast
and keratinocyte groups were analyzed for deviation of dynamic
capabilities (Fig. 4). Scores of
pathways such as chondroitin sulfate biosynthesis (0.09) and oocyte
meiosis (0.19) in the non-lesion group, and base excision repair
(0.17), homologous recombination (0.17), and pyrimidine metabolism
(0.17) in the lesion group indicated that DEGs involved in these
pathways were similar to those in normal tissues (Table III). Furthermore, amino sugar and
nucleotide sugar metabolism (0.09) and aminoacyl tRNA biosynthesis
(0.07) in the non-lesion group, and base excision repair (0.17),
homologous recombination (0.17), and pyrimidine metabolism (0.17)
in the lesion group suggested that DEGs involved in these pathways
were similar to those of DEGs in normal tissues (Table III).
| Table III.Pathway alteration scores of DEGs in
different groups. |
Table III.
Pathway alteration scores of DEGs in
different groups.
|
| Score of the
enriched pathways of DEGs |
|---|
|
|
|
|---|
| Pathway | Non-lesion | Lesion | Distance |
|---|
| Fibroblasts |
|
|
|
| Cell
cycle | 0.48 | 1 | 0.52 |
| Oocyte
meiosis | 0.19 | 0.69 | 0.5 |
|
Chondroitin sulfate
biosynthesis | 0.09 | 0.54 | 0.45 |
|
Arginine and proline
metabolism | 0.32 | 0.62 | 0.3 |
|
Aminoacyl tRNA
biosynthesis | 0.3 | 0.58 | 0.28 |
|
ECM-receptor interaction | 0.25 | 0.52 | 0.27 |
| Purine
metabolism | 0.46 | 0.19 | 0.27 |
| DNA
replication | 0.17 | 0.42 | 0.25 |
| Amino
sugar and nucleotide sugar metabolism | 0.24 | 0.48 | 0.24 |
|
Mismatch repair | 0.22 | 0.45 | 0.23 |
|
Spliceosome | 0.22 | 0.45 | 0.23 |
| Base
excision repair | 0.36 | 0.17 | 0.19 |
|
Homologous recombination | 0.36 | 0.17 | 0.19 |
|
Nucleotide excision
repair | 0.36 | 0.17 | 0.19 |
|
Pyrimidine metabolism | 0.36 | 0.17 | 0.19 |
| Small
cell lung cancer | 0.38 | 0.21 | 0.17 |
| Keratinocytes |
|
|
|
| Amino
sugar and nucleotide sugar metabolism | 0.09 | 0.54 | 0.45 |
|
Aminoacyl tRNA
biosynthesis | 0.07 | 0.47 | 0.4 |
|
Pyrimidine metabolism | 0.34 | 0.66 | 0.32 |
|
Arginine and proline
metabolism | 0.32 | 0.62 | 0.3 |
|
ECM-receptor interaction | 0.46 | 0.19 | 0.27 |
| Cell
cycle | 0.25 | 0.52 | 0.27 |
| DNA
replication | 0.25 | 0.52 | 0.27 |
|
Chondroitin sulfate
biosynthesis | 0.17 | 0.42 | 0.25 |
|
Nucleotide excision
repair | 0.17 | 0.42 | 0.25 |
| Base
excision repair | 0.22 | 0.45 | 0.23 |
|
Homologous recombination | 0.15 | 0.38 | 0.23 |
|
Mismatch repair | 0.36 | 0.17 | 0.19 |
| Oocyte
meiosis | 0.36 | 0.17 | 0.19 |
| Purine
metabolism | 0.36 | 0.17 | 0.19 |
|
Spliceosome | 0.36 | 0.17 | 0.19 |
| Small
cell lung cancer | 0.38 | 0.21 | 0.17 |
Discussion
Keloid scar of skin is a type of benign soft tissue
skin tumor that originates from the proliferation of connective
tissue subsequent to skin injury, and has high morbidity (1,2). The
identification of some clinical biomarkers for keloid scars would
be of great significance. In the present study, the gene expression
profile of GSE44270 was analyzed to screen several key genes for
skin and keloid scars and investigate the mechanisms involving
fibroblasts and keratinocytes in keloid scar progression. The
results demonstrated that many key genes that are involved in
several significant pathways are crucial for keloid scars.
The present data indicated that BMP4 and HOXA9 are
upregulated, and SMAD2 and CDKN1A are downregulated during the
development and progression in fibroblasts. BMP4 is a protein of
the bone morphogenetic family that belongs to the transforming
growth factor superfamily, and is reported to play crucial roles in
fibroblast proliferation (23), and
an imbalance between proliferation and apoptotic cells in
fibroblasts has been shown to be associated with keloids (24). Russell et al demonstrated that
decreased expression of HOXA9 was correlated with wound healing in
keloid-derived fibroblasts (25).
Thus, overexpression of HOXA9 and BMP4 may contribute to the
development of keloid scarring of the skin. SMAD2 is a SMAD family
protein that functions as a signal transducer and transcriptional
modulator in multiple signaling pathways (26). Gao et al demonstrated that
silencing SMAD2 with siRNA modulated the synthesis of collagen in
keloid-derived fibroblasts (27),
and Cohen et al suggested that collagen synthesis may
suppress keloid scarring (28).
CDKN1A is a cyclin-CDK2 complex protein that functions as a
regulator of cell cycle progression at G1 (29), and the accumulation of the cell cycle
regulator CDKN1A has been linked to human fibroblast proliferation
(30). Therefore, the downregulation
of SMAD2 and CDKN1A may promote the progression of keloids. The
present study suggests that cell cycle pathway is the significant
pathway in keloid-derived fibroblasts tissue. Based on our data, it
may be speculated that BMP4, HOXA9, SMAD2 and CDKN1A are
suppressors for fibroblasts in keloids and function through the
cell cycle pathway.
The results of the present study also indicated that
HOXA7 is upregulated, and PSMA4, PSMB2 and CDK1 are downregulated
during the development and progression of keloids in keratinocyte
tissues. HOXA7 is a transcription factor that is encoded by HOX
family genes, and a previous study has revealed abnormal HOX gene
expression in normal keratinocytes (31). Hyland et al showed that HOXA7
is able to silence differentiation-specific genes in keratinocytes
(32). Hence, HOXA7 may be a
suppressor for progression in keloid-derived keratinocytes. PSMA4
and PSMB2 are two proteins of the PSM protein family that have key
functions in keratinocytes (33).
The roles of PSMA4 and PSMB2 in keloid-derived keratinocytes have
not been fully defined. However, Amos et al suggested that
PSMA4 may be associated with susceptibility to keloids (34), and Lim reported that PSMB2 was
correlated with keloid therapy exosome (35). The ECM-receptor interaction pathway
was found to be a common pathway in the two types of keloid-derived
cells. Gene bioinformatics analysis has shown that the ECM-receptor
interaction pathway, which is associated with several key genes, is
significant in keloids (36). Based
on the present results, it is speculated that HOXA7 may be a
suppressor while PSMA4 and PSMB2 may contributors in keloid-derived
keratinocytes through the ECM-receptor interaction pathway.
In conclusion, the present study identified key
genes involved in keloid-derived fibroblasts (BMP4, HOXA9, SMAD2,
and CDKN1A) and keratinocytes (HOXA7, PSMA4, and PSMB2) during
keloid development and progression through several key pathways
such as cell cycle and ECM-receptor interaction pathways. The
results may provide a theoretical basis for the mechanistic
investigation of keloid scar pathogenesis. However, further studies
are required to verify the predicted results.
References
|
1
|
Williams FN, Herndon DN and Branski LK:
Where we stand with human hypertrophic and keloid scar models. Exp
Dermatol. 23:811–812. 2014. View Article : Google Scholar : PubMed/NCBI
|
|
2
|
Allah K, Yéo S, Kossoko H, Assi Djè Bi Djè
V and Richard Kadio M: Keloid scars on black skin: Myth or reality.
Ann Chir Plast Esthet. 58:115–122. 2013.(In French). View Article : Google Scholar : PubMed/NCBI
|
|
3
|
Park TH, Park JH and Chang CH: Clinical
features and outcomes of foot keloids treated using complete
surgical excision and full thickness skin grafting followed by
corticosteroid injections. J Foot Ankle Res. 6:262013. View Article : Google Scholar : PubMed/NCBI
|
|
4
|
Park TH, Seo SW, Kim JK and Chang CH:
Clinical characteristics of facial keloids treated with surgical
excision followed by intra- and postoperative intralesional steroid
injections. Aesthetic Plast Surg. 36:169–173. 2012. View Article : Google Scholar : PubMed/NCBI
|
|
5
|
Kelly AP: Medical and surgical therapies
for keloids. Dermatol Ther. 17:212–218. 2004. View Article : Google Scholar : PubMed/NCBI
|
|
6
|
Funayama E, Chodon T, Oyama A and Sugihara
T: Keratinocytes promote proliferation and inhibit apoptosis of the
underlying fibroblasts: An important role in the pathogenesis of
keloid. J Invest Dermatol. 121:1326–1331. 2003. View Article : Google Scholar : PubMed/NCBI
|
|
7
|
Lim IJ, Phan TT, Song C, Tan WT and
Longaker MT: Investigation of the influence of keloid-derived
keratinocytes on fibroblast growth and proliferation in vitro.
Plast Reconstr Surg. 107:797–808. 2001. View Article : Google Scholar : PubMed/NCBI
|
|
8
|
Werner S, Krieg T and Smola H:
Keratinocyte-fibroblast interactions in wound healing. J Invest
Dermatol. 127:998–1008. 2007. View Article : Google Scholar : PubMed/NCBI
|
|
9
|
Yu H, Bock O, Bayat A, Ferguson MW and
Mrowietz U: Decreased expression of inhibitory SMAD6 and SMAD7 in
keloid scarring. J Plast Reconstr Aesthet Surg. 59:221–229. 2006.
View Article : Google Scholar : PubMed/NCBI
|
|
10
|
Schmidt M, Schler G, Gruensfelder P and
Hoppe F: Expression of bone morphogenetic protein-2 messenger
ribonucleic acid in cholesteatoma fibroblasts. Otol Neurotol.
23:267–270. 2002. View Article : Google Scholar : PubMed/NCBI
|
|
11
|
Hahn JM, Glaser K, McFarland KL, Aronow
BJ, Boyce ST and Supp DM: Keloid-derived keratinocytes exhibit an
abnormal gene expression profile consistent with a distinct causal
role in keloid pathology. Wound Repair Regen. 21:530–544. 2013.
View Article : Google Scholar : PubMed/NCBI
|
|
12
|
Wu Z and Irizarry RA: Preprocessing of
oligonucleotide array data. Nat Biotechnol. 22:656–658. 2004.
View Article : Google Scholar : PubMed/NCBI
|
|
13
|
Dennis G Jr, Sherman BT, Hosack DA, Yang
J, Gao W, Lane HC and Lempicki RA: DAVID: Database for annotation,
visualization and integrated discovery. Genome Biol. 4:P32003.
View Article : Google Scholar : PubMed/NCBI
|
|
14
|
Toedling J, Sklyar O, Krueger T, Fischer
JJ, Sperling S and Huber W: Ringo - an R/Bioconductor package for
analyzing ChIP-chip readouts. BMC Bioinformatics. 8:2212007.
View Article : Google Scholar : PubMed/NCBI
|
|
15
|
Storey JD: The positive false discovery
rate: A Bayesian interpretation and the q-value. Ann Statist.
31:2013–2035. 2003. View Article : Google Scholar
|
|
16
|
Van Rossum G and Drake FL: Python Language
Reference Manual. Network Theory Ltd.; Godalming: 2011
|
|
17
|
Wessa P: Pearson correlation (v1. 0.6) in
Free Statistics Software (v1. 1.23-r7). Office for Research
Development and Education. http://www wessa net/rwasp_correlation
wasp/2012.
|
|
18
|
Roux M: Group average linkage compared to
Ward's method in hierarchical clusteringVisualization and
Verbalization of Data. Blasius J and Greenacre M: Chapman and
Hall/CRC; Abingdon: pp. 271–288. 2014
|
|
19
|
Chatr-Aryamontri A, Breitkreutz BJ,
Oughtred R, Boucher L, Heinicke S, Chen D, Stark C, Breitkreutz A,
Kolas N, O'Donnell L, et al: The BioGRID interaction database: 2015
update. Nucleic Acids Res. 43:(Database Issue). D470–D478. 2015.
View Article : Google Scholar : PubMed/NCBI
|
|
20
|
Wang Y and Zheng T: Screening of hub genes
and pathways in colorectal cancer with microarray technology.
Pathol Oncol Res. 20:611–618. 2014. View Article : Google Scholar : PubMed/NCBI
|
|
21
|
Smoot ME, Ono K, Ruscheinski J, Wang PL
and Ideker T: Cytoscape 2.8: New features for data integration and
network visualization. Bioinformatics. 27:431–432. 2011. View Article : Google Scholar : PubMed/NCBI
|
|
22
|
Eickhoff SB, Schleicher A, Scheperjans F,
Palomero-Gallagher N and Zilles K: Analysis of neurotransmitter
receptor distribution patterns in the cerebral cortex. Neuroimage.
34:1317–1330. 2007. View Article : Google Scholar : PubMed/NCBI
|
|
23
|
Rutherford RB, Moalli M, Franceschi RT,
Wang D, Gu K and Krebsbach PH: Bone morphogenetic
protein-transduced human fibroblasts convert to osteoblasts and
form bone in vivo. Tissue Eng. 8:441–452. 2002. View Article : Google Scholar : PubMed/NCBI
|
|
24
|
Luo S, Benathan M, Raffoul W, Panizzon RG
and Egloff DV: Abnormal balance between proliferation and apoptotic
cell death in fibroblasts derived from keloid lesions. Plast
Reconstr Surg. 107:87–96. 2001. View Article : Google Scholar : PubMed/NCBI
|
|
25
|
Russell SB, Russell JD, Trupin KM, Gayden
AE, Opalenik SR, Nanney LB, Broquist AH, Raju L and Williams SM:
Epigenetically altered wound healing in keloid fibroblasts. J
Invest Dermatol. 130:2489–2496. 2010. View Article : Google Scholar : PubMed/NCBI
|
|
26
|
Park JI, Lee MG, Cho K, Park BJ, Chae KS,
Byun DS, Ryu BK, Park YK and Chi SG: Transforming growth
factor-beta1 activates interleukin-6 expression in prostate cancer
cells through the synergistic collaboration of the Smad2,
p38-NF-kappaB, JNK, and Ras signaling pathways. Oncogene.
22:4314–4332. 2003. View Article : Google Scholar : PubMed/NCBI
|
|
27
|
Gao Z, Wang Z, Shi Y, Lin Z, Jiang H, Hou
T, Wang Q, Yuan X, Zhao Y, Wu H and Jin Y: Modulation of collagen
synthesis in keloid fibroblasts by silencing Smad2 with siRNA.
Plast Reconstr Surg. 118:1328–1337. 2006. View Article : Google Scholar : PubMed/NCBI
|
|
28
|
Cohen I, Keiser H and Sjoerdsma A:
Collagen synthesis in human keloid and hypertrophic scar. Plast
Reconstr Surg. 50:2051972. View Article : Google Scholar
|
|
29
|
Pickering MT, Stadler BM and Kowalik TF:
miR-17 and miR-20a temper an E2F1-induced G1 checkpoint to regulate
cell cycle progression. Oncogene. 28:140–145. 2009. View Article : Google Scholar : PubMed/NCBI
|
|
30
|
Fournier C, Wiese C and Taucher-Scholz G:
Accumulation of the cell cycle regulators TP53 and CDKN1A (p21) in
human fibroblasts after exposure to low- and high-LET radiation.
Radiat Res. 161:675–684. 2004. View
Article : Google Scholar : PubMed/NCBI
|
|
31
|
Alami Y, Castronovo V, Belotti D,
Flagiello D and Clausse N: HOXC5 and HOXC8 expression are
selectively turned on in human cervical cancer cells compared to
normal keratinocytes. Biochem Biophys Res Commun. 257:738–745.
1999. View Article : Google Scholar : PubMed/NCBI
|
|
32
|
Hyland PL, McDade SS, McCloskey R, Dickson
GJ, Arthur K, McCance DJ and Patel D: Evidence for alteration of
EZH2, BMI1, and KDM6A and epigenetic reprogramming in human
papillomavirus type 16 E6/E7-expressing keratinocytes. J Virol.
85:10999–11006. 2011. View Article : Google Scholar : PubMed/NCBI
|
|
33
|
Tan SH, Furusato B, Fang X, He F, Mohamed
AA, Griner NB, Sood K, Saxena S, Katta S, Young D, et al:
Evaluation of ERG responsive proteome in prostate cancer. Prostate.
74:70–89. 2014. View Article : Google Scholar : PubMed/NCBI
|
|
34
|
Amos CI, Wu X, Broderick P, Gorlov IP, Gu
J, Eisen T, Dong Q, Zhang Q, Gu X, Vijayakrishnan J, et al:
Genome-wide association scan of tag SNPs identifies a
susceptibility locus for lung cancer at 15q25.1. Nat Genet.
40:616–622. 2008. View
Article : Google Scholar : PubMed/NCBI
|
|
35
|
Lim SK: Methods of detecting therapeutic
exosomes. U.S. Patent No. 20,140,031,256. Filed October 02, 2012;
issued January 30. 2014.
|
|
36
|
Huang C, Nie F, Qin Z, Li B and Zhao X: A
snapshot of gene expression signatures generated using microarray
datasets associated with excessive scarring. Am J Dermatopathol.
35:64–73. 2013. View Article : Google Scholar : PubMed/NCBI
|