Introduction
Tuberculosis (TB) is a lethal disease caused by
Mycobacterium tuberculosis that is commonly diagnosed
worldwide. In 2012 there were 8.6 million new TB cases and 1.3
million mortalities resulting from TB (1). TB primarily infects the lung; however,
1% of all TB cases involve the spinal column (2). Traditional treatments for spinal TB
involve chemotherapy and surgery. The chemotherapy regimen involves
2–4 drugs, such as isoniazid and rifampicin, with the duration of
usage ranging between 6 and 18 months (3). This long duration of chemotherapy can
have adverse effects on patients and may lower patient compliance.
Ultra-short course chemotherapy (UCCT), chemotherapy lasting <6
months, can be used as a treatment in patient's with spinal TB to
counter these issues. In the present study, the blood transcript
signatures of patients with spinal TB prior to and following
treatment with UCCT, subsequent to complete debridement of TB
lesions, were identified. The chemotherapy included streptomycin
(S), isoniazid (H), rifampicin (R) and pyrazinamide (Z). Results of
previous studies have demonstrated that UCCT with a mean duration
of 5.5 months is effective in treating patients with spinal TB
(4–6).
Although surgical treatment and UCCT improve spinal
TB, the pathways involved in clearing spinal TB are
uncharacterized. Therefore, the present study utilized DNA
microarray analysis to measure the gene expression profiles from
the whole blood of patients with spinal TB prior to and following
treatment. Spinal TB varies in the severity of infection and
prognosis (7). DNA microarray
analysis can identify the pathways associated with spinal TB
infection and provide insight into the effectiveness of the UCCT
regimen used.
Materials and methods
Patient selection
A total of 38 patients with TB that underwent
complete debridement of lesions and UCCT were recruited from the
Department of Spinal Surgery at the General Hospital of Ningxia
Medical University (Yinchuan, China) between October 2010 and June
2011. Peripheral blood samples were collected from these patients
at various treatment periods. Out of the recruited 38 patients,
only 27 patients had verified spinal TB by RNA quality testing,
this consisted of 13 males and 14 females, ranging between 17–72
years old (average 38.8±15.6 years). Tuberculous lesions were found
in the lumbar region (n=11), thoracic region (n=8), thoracolumbar
region (n=5), lumbosacral segment region (n=2), and thoracic and
lumbar damage of the region (n=1). In all cases, complete
debridement of the lesions was performed, followed by interbody
graft fusion and internal fixation between the focal vertebras
(4,5,7).
Complete debridement, based on traditional debridement, involves
tissues including the edge of lesions, the multi-cavity and bony
bridge being cleaned (4,5).
In the control group of 7 patients without TB, 5
peripheral blood samples were confirmed to not have spinal TB by
RNA quality testing. Table I
provides the study group descriptions. The Ethics Commission
(General Hospital of Ningxia Medical University, Yinchuan, China)
approved all the clinical cases and all patients involved in the
study provided informed consent.
 | Table I.Study group descriptions. |
Table I.
Study group descriptions.
| Group | Group
description | Patient
condition | Number of
individuals | Age range | Gender | ESR (mm/h) | CRP (mg/l) |
|---|
| Control | No TB infection | No TB detected | 5 | 35–50 | 3F, 2M | 2–10 | 0.23–1.23 |
| Study group 1 | TB infection, no
medical treatment | Active TB | 8 | 21–72 | 5F, 3M | 1–79 | 0.49–74.49 |
| Study group 2 | Complete debridement
and UCCT | Inactive TB | 9 | 20–52 | 6F, 3M | 3–15 | 0.58–8.58 |
| Study group 3 | 1 year follow-up
(post-treatment) | Inactive TB | 10 | 17–58 | 5F, 5M | 2–10 | 0.17–5.17 |
The inclusion criteria were as follows: Patients who
had recovered from spinal TB with complete removal of spinal
lesions and UCCT treatment. Patients with other infections, tumors,
trauma, metabolic disease and/or immunological deficiency were
excluded.
Chemotherapy regimen
Following complete debridement of spinal TB lesions,
all patients received 2SHRZ/2-4HR (Sigma-Aldrich; Merck Millipore,
Darmstadt, Germany) for 4–6 months (mean, 5.5 months). Based on the
different therapeutic periods, the peripheral blood samples of the
27 patients in the study group were divided into three groups
(Table I). Group 1 consisted of 8
untreated, TB-infected individuals that received no treatment prior
to hospitalization, with clinical data indicating active spinal TB.
Group 2 consisted of 9 TB-infected individuals that had thorough
clearance of focal lesions and UCCT for 4–6 months (mean, 5.5
months). Their clinical data indicated lesion healing and fusion of
the interbody graft. Group 3, the 1 year follow-up group, consisted
of 10 individuals that had not been taking medications for 5–6
months following initial UCCT. The clinical results of groups 2 and
3 showed a similar recovery of spinal function and interbody
healing. Additionally, a control group consisting of 5 uninfected
individuals was used for this study.
In the control group, there were 5 cases of carpal
tunnel syndrome (2 males and 3 females, aged between 35 and 50
years old, mean age 40.6±7.4 years old). All individuals in the
control group were free of TB and other related diseases, with
normal erythrocyte sedimentation rates, and negative C-reactive
protein and TB skin tests.
Imaging analysis
The study group of 27 patients with TB that
underwent complete debridement of lesions and UCCT were
subsequently scanned by computed topography (CT) and magnetic
resonance imaging (MRI; both, General Electric Company, Fairfield,
CT, USA).
Blood sample collection and
preparation
Fasting peripheral blood was collected from patients
with spinal TB and anti-coagulated with EDTA. Whole blood (250 µl)
was collected and placed into a 1.5 ml centrifuge tube that
contained TRI pure RNA preserving liquid (RNA long preservation
solution; RP2101; Beijing Biotech, Inc., Beijing, China). Following
mixing, the samples were stored at −80°C.
Extraction of total RNA from
peripheral blood and quality testing
Total RNA was extracted from peripheral blood with
an RNA extraction kit (RP4002; Beijing Biotech, Inc.) and purified
using the RNAClean kit (ORP1801; Beijing Biotech, Inc.).
Quantitative detection of RNA was performed with a NanoDrop ND-1000
spectrophotometer (Thermo Fisher Scientific, Inc., Wilmington, DE,
USA). Denaturing agarose gel electrophoresis (1.3 g agarose gel/100
ml 1X TAE; 120 V; 25 min) was employed to determine the integrity
and quality of the RNA.
Preparation of labeled genes
Total RNA (100 ng) was reverse transcribed into
double-stranded DNA using the RevertAid First strand cDNA Synthesis
kit (K1622; Thermo Fisher Scientific, Inc., Waltham, MA, USA),
followed by in vitro transcription to prepare
biotin-conjugated complementary RNA (cRNA) using the cRNA
Amplification and Biotin Labeling kit (C5201s; ORANGENE, China).
Next, the purified cRNA underwent fragmentation in a reaction
system (total, 25 µl) containing: 5 µl cRNA (1,000 ng), 2.5 µl
klenow buffer (5X), 1 µl klenow enzyme, 2.5 µl DNTP (2.5 mM), 14 µl
ddH2O. Reaction conditions were as follows: 37°C for 1.5
h and 70°C for 10 min using DNA Polymerase I Large Klenow Fragment
(M0210L; New England Biolabs Inc., Ipswich, UK).
Hybridization, washing and scanning of
the microarrays
The molecular hybridization instrument used in the
present study was a Affymetrix Genchip Scan System, which included
a GeneChip Scanner 3000, GeneChip Hybridization Oven 645 and
Fluidics Station 450 (Affymetrix, Inc., Santa Clara, CA, USA) along
with a GeneChip Human Genome U133 Plus 2.0 Array (Affymetrix,
Inc.). Briefly, the fragmented cRNA was used to prepare a
hybridization solution, which was added to the microarray, followed
by overnight hybridization at 45°C. The microarray was then placed
in a fluid workstation for washing and staining by GeneChip
Hybridization, Wash, and Stain kit (900720; Affymetrix, Inc.).
Scanning and imaging of the microarrays following hybridization was
performed using the Affymetrix GeneChip System 3000Dx (version 2;
Affymetrix, Inc.).
Reverse transcription-quantitative PCR
(RT-qPCR)
Representative genes with high expression levels
were selected from the differentially expressed genes identified.
Following the design and synthesis of primers (Table II), total RNA was extracted as
described. Total RNA (100 ng) was reverse transcribed into
double-stranded DNA using the RevertAid First strand cDNA Synthesis
kit (K1622; Thermo Fisher Scientific, Inc.). qPCR was performed to
amplify these target genes using Fast SYBR-Green Master Mix
(4385610; Thermo Fisher Scientific, Inc.) by ABI 7900HT system
(Applied Biosystems; Thermo Fisher Scientific, Inc.). The reaction
system (total, 20 µl) contained: 1 µl total RNA (200 ng), 0.5 µl
sense primer, 0.5 µl reverse primer, 8 µl ddH2O and 10
µl SYBR Real-time PCR Mix. Thermal cycling conditions were as
follows: One cycle of 94°C for 3 min, followed by 35 cycles of 94°C
for 1 min, 56°C for 40 sec and 72°C for 40 sec; and final extension
at 72°C for 5 min. Following 1.5% agarose gel electrophoresis, the
PCR products were compared with their anticipated consequences.
GAPDH was used as the internal control (Table II). Expression levels were analyzed
using the 2-ΔΔCq method (8).
| Table II.Quantitiative polymerase chain
reaction primer sequences and size of products (bp). |
Table II.
Quantitiative polymerase chain
reaction primer sequences and size of products (bp).
| Gene | Primer (5′-3′) | Product (bp) |
|---|
| TMX4 | F:
AAGTCATCCCAGCCCTCTGAATCT | 104 |
|
| R:
AGTGAAGAGTGTGGAGAGCCTGAA |
| FGL2 | F:
AATGTCAAGGCAGGCAGATCACTT | 171 |
|
| R:
CCTCTCAGGTTCAAGCGATTCTCC |
| GNLY | F:
CACCTTGTCCTGTGGAAGAAGCA | 109 |
|
| R:
GGAGACTGGAGAGTGGATTCTGGA |
| PF4V1 | F:
GAGATGCTGTTCTTGGCGTTGCT | 189 |
|
| R:
CGTGGCTATGAGTTGGGCAGTG |
| USP33 | F:
GTTCAAGCGATTCTCCTGCCTCA | 188 |
|
| R:
TCACACCTGTAATCCCAGCACTTT |
| GAPDH | F:
CAGCAAGAGCACAAGAGGAAGAG | 109 |
|
| R:
GGTCTACATGGCAACTGTGAGGAG |
| GBP1 | F:
AGAAGAAGAAGTGAAGGCGGGAAT | 183 |
|
| R:
AGTCTGGTCTGTCTGGAGAATTGC |
| LY96 | F:
GCCGAGGATCTGATGACGATTACT | 190 |
|
| R:
GGTGTAGGATGACAAACTCCAAGC |
| GAPDH | F:
CCAGCAAGAGCACAAGAGGAAGAG | 109 |
|
| R:
GGTCTACATGGCAACTGTGAGGAG |
Data analysis
The microarray data was obtained from both groups
significance analysis of microarrays was performed using Affymetrix
Expression Console Software 1.3 (Affymetrix, Inc.) and Microsoft
Office Excel 2013 (Microsoft Corporation, Redmond, WA, USA),
followed by analysis with the robust multi-array average method
(9). Relative expression between
genes was calculated, where a difference of ≤0.5 or ≥2 fold
(P<0.05) and a false discovery rate of 0.05 was used to
determine differentially expressed genes (10). To evaluate pathways associated with
the microarray data, gene cluster analysis was performed using
DAVID Bioinformatics Resources (11). Briefly, gene cluster identification
numbers were uploaded onto DAVID and the KEGG Pathway (12) was selected to identify the pathways
associated with the microarray data.
Results
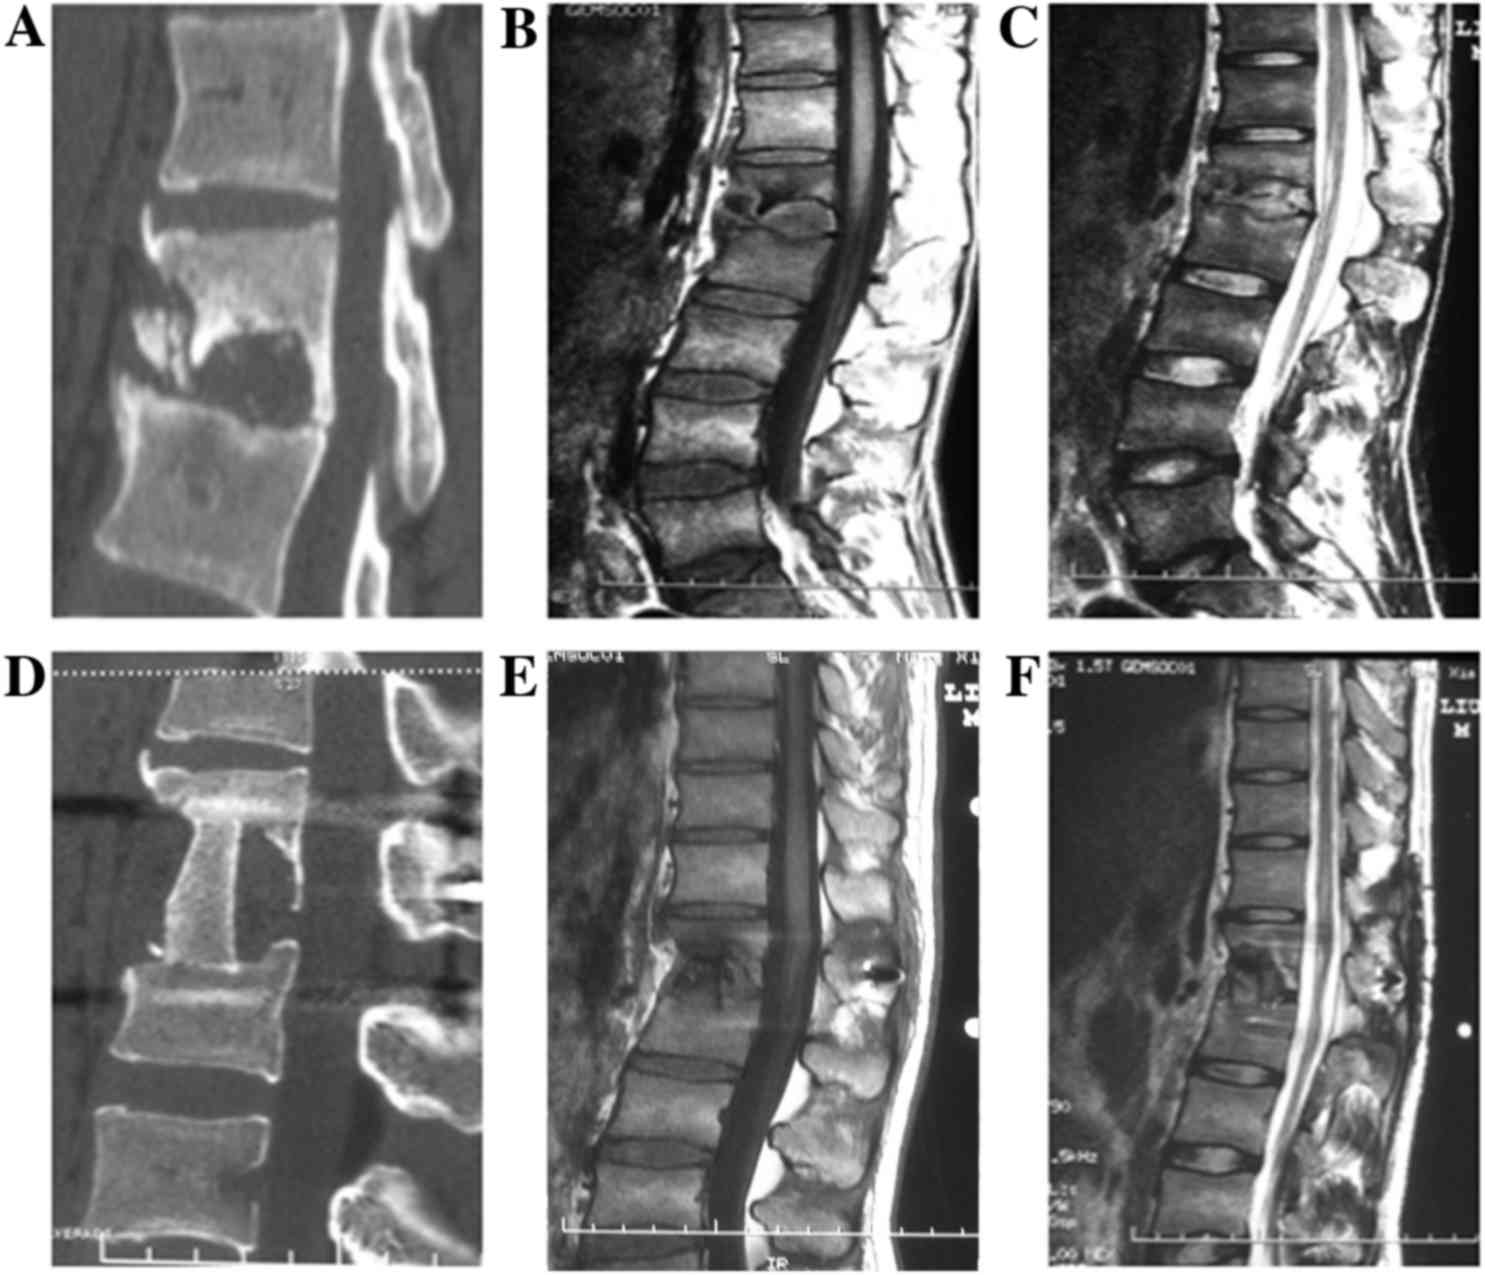
Spinal CT and MRI
CT and MRI scans were taken prior to and following
surgical debridement in patients with spinal TB, as shown in
Fig. 1. For example, the example CT
scan of a patient with spinal TB displayed a lost bone at lumbar
vertebrae 1–2 (L1-2; Fig. 1A). MRI
confirmed this loss of bone (Fig. 1B and
C). The diseased area of the spine was removed through complete
debridement and an interbody graft fusion was made at L1-2. CT and
MRI scans 1 year following surgical debridement and UCCT confirmed
interbody graft fusion and lesion healing (Fig. 1D and E).
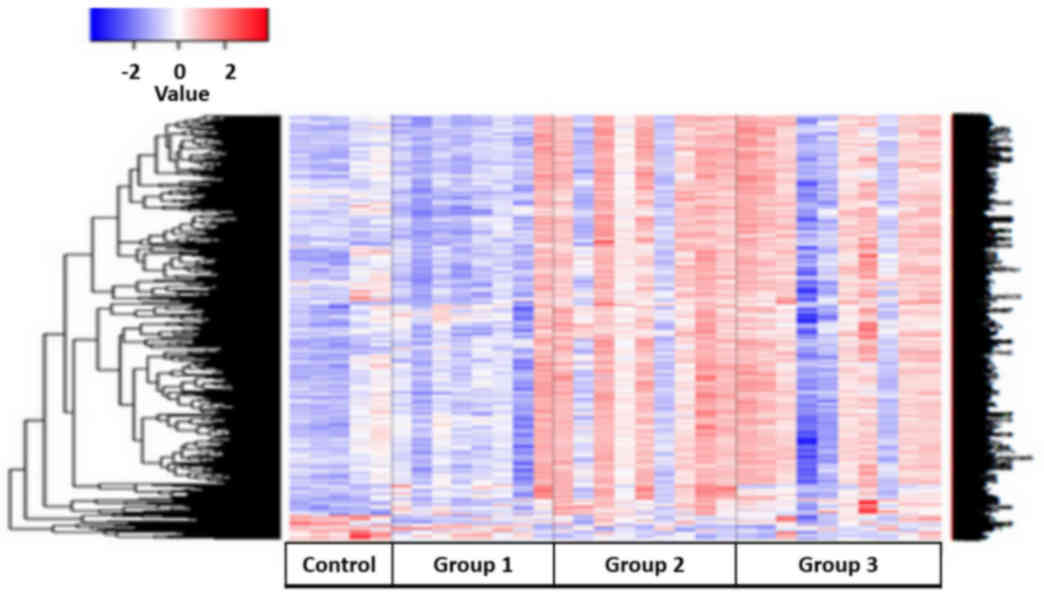
Differentially expressed genes between
the study and control groups
Following analysis for the microarray data, from the
54,675 genes evaluated, 2,971 statistically differentially
expressed genes (fold-change ≤0.5 or ≥2; P<0.05) were found
between the study groups and the control (Fig. 2). This suggests that over the course
of spinal TB treatment, there was an upregulation of genes.
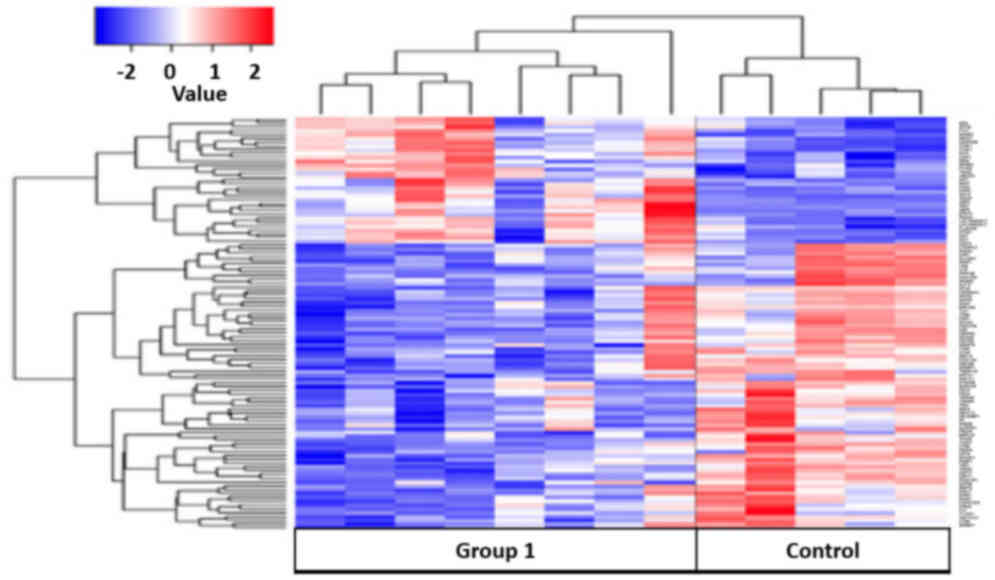
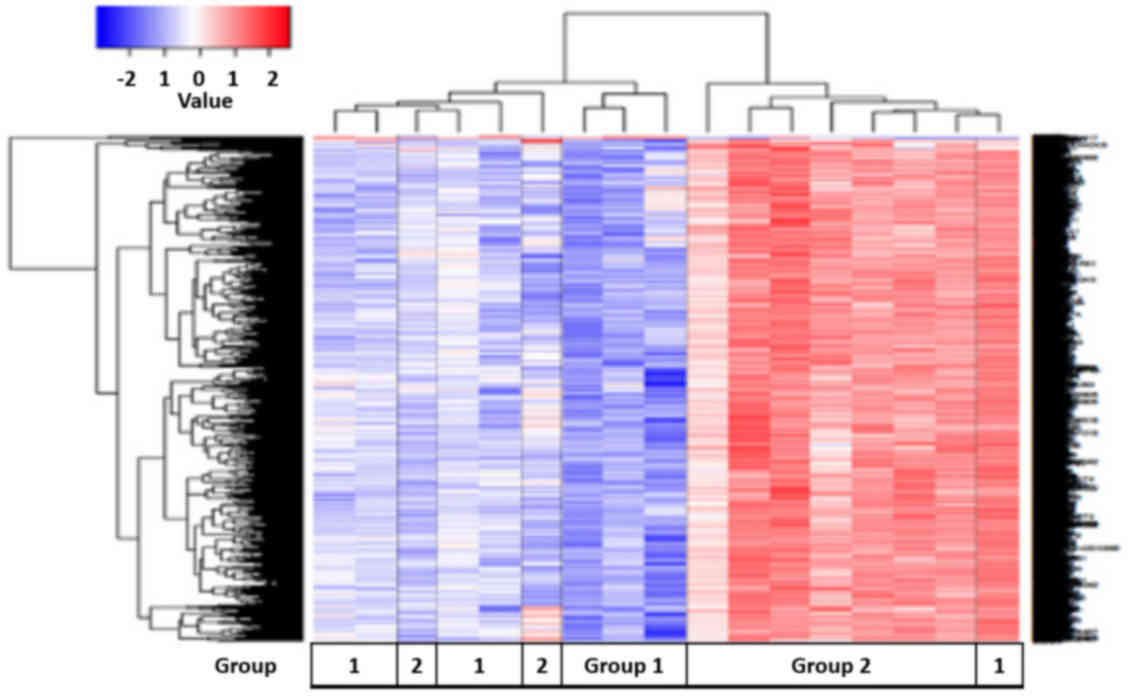
Whole blood transcriptional profiling
of patients with active spinal TB
Patients with active TB were compared with healthy
controls. A total of 125 differential genes were identified by gene
cluster analysis (Fig. 3). Of these
genes, 79 were upregulated and 46 were downregulated when comparing
the control group with group 1 (untreated, TB-infected). Using the
DAVID knowledgebase, analysis of the microarray data for pathways
identified 2 pathways that were significantly different between
patients with active TB and healthy controls: The antigen
processing and presentation (APP) pathway and a small cell lung
cancer related pathway. Furthermore, it showed that genes that were
upregulated in the controls were found to be downregulated or
unexpressed in group 1 (Fig. 3).
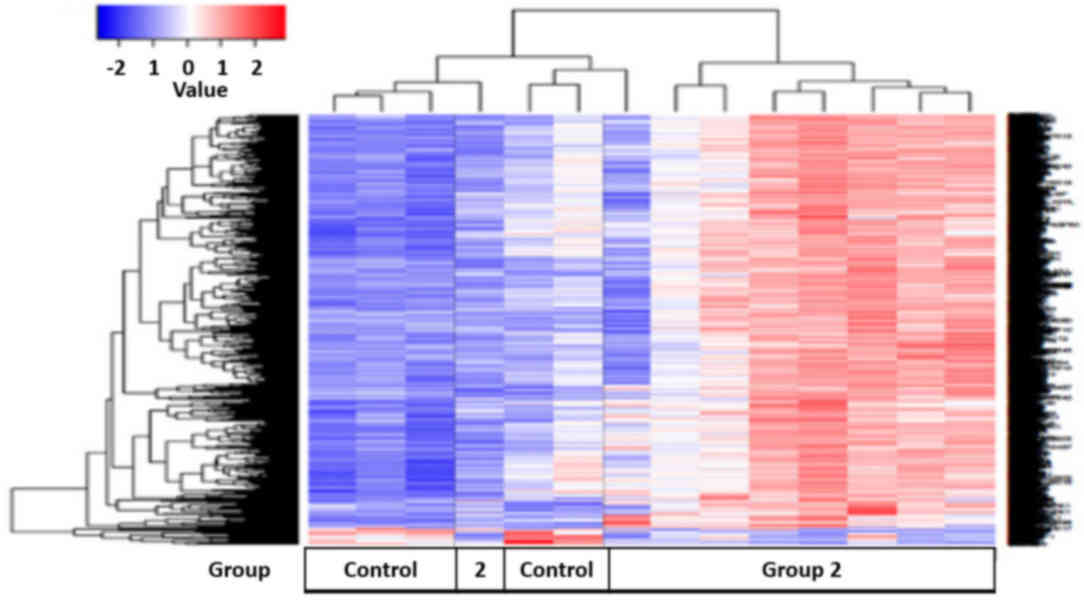
Whole blood transcriptional profiling
of patients following treatment
Spinal TB patients were treated with UCCT following
complete debridement. Gene expression profiles were measured from
these patients and compared with healthy controls. Cluster analysis
identified 1,550 differential genes (Fig. 4). Of these genes, 66 genes were
upregulated, while 1,484 genes were downregulated when comparing
the control group with group 2 (treated, TB-infected). Analysis of
the microarray data for pathways involved, using the DAVID
knowledgebase, identified 35 pathways that differed between group 2
and the control group (Table III).
These included immunoregulatory and inflammatory pathways, such as
chemokine signaling pathways, B and T cell receptor pathways, and
leukocyte transendothelial migration. The majority of genes that
were downregulated in the healthy controls were upregulated in
group 2 (Fig. 4). Additionally,
changes in genes that were upregulated in the control groups were
downregulated in group 2 (Fig.
4).
| Table III.Pathway analysis between the control
group vs. group 2. |
Table III.
Pathway analysis between the control
group vs. group 2.
| Pathway | Count | P-value | Q-value |
|---|
| Natural killer cell
mediated cytotoxicity | 31 | 8.40E-08 | 1.40E-05 |
| Spliceosome | 28 | 1.10E-06 | 6.30E-05 |
| B cell receptor
signaling | 27 | 1.90E-04 | 3.90E-03 |
| Chemokine
signaling | 27 | 3.00E-03 | 2.90E-02 |
| Endocytosis | 23 | 3.20E-02 | 2.10E-01 |
| Antigen processing
and presentation | 22 | 1.10E-06 | 8.80E-05 |
| T cell receptor
signaling | 21 | 2.50E-04 | 4.50E-03 |
| Lysosome | 20 | 1.80E-03 | 2.20E-02 |
| Toll-like receptor
signaling | 19 | 8.00E-04 | 1.20E-02 |
| Leukocyte
transendothelial migration | 16 | 4.40E-02 | 2.50E-01 |
| Cell adhesion
molecules | 16 | 9.60E-02 | 3.80E-01 |
| RIG-I-like receptor
signaling | 11 | 5.10E-02 | 2.70E-01 |
| NOD-like receptor
signaling | 10 | 5.30E-02 | 2.80E-01 |
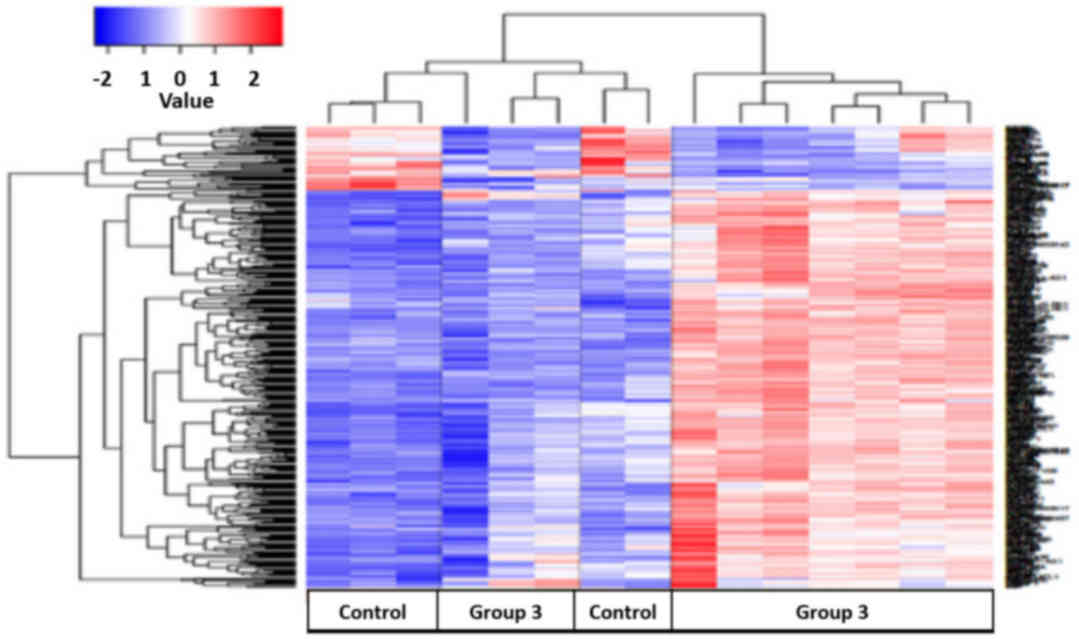
Whole blood gene transcriptional
profiling of patients with spinal TB 1 year post-treatment
Patients with spinal TB were treated with UCCT
following complete debridement. Peripheral blood samples were
collected and gene expression profiles of these patients were
compared with healthy controls. Cluster analysis identified 400
differentially expressed genes (Fig.
5). Of these genes, 65 were upregulated and 335 were
downregulated when comparing the control group with group 3 (1 year
follow-up). Bioinformatical pathway analysis, using the DAVID
knowledgebase, identified 9 pathways that differed between the
control group and the majority of group 3 (Table IV). A number of notable pathways
that differed were as follows: Natural killer cell mediated
cytotoxicity signaling, p53 signaling, T cell receptor signaling
and apoptosis. Additionally, genes that were downregulated in the
control group were upregulated in group 3 (Fig. 5).
| Table IV.Pathway analysis between the control
group vs. group 3. |
Table IV.
Pathway analysis between the control
group vs. group 3.
| Pathway | Count | P-value | Q-value |
|---|
| Ribosome | 10 | 5.60E-05 | 5.20E-03 |
| Natural killer cell
mediated cytotoxicity | 9 | 5.20E-03 | 2.20E-01 |
| Spliceosome | 7 | 4.20E-02 | 5.50E-01 |
| p53 signaling
pathway | 6 | 1.20E-02 | 3.10E-01 |
| Apoptosis | 6 | 3.10E-02 | 5.20E-01 |
| T cell receptor
signaling | 6 | 6.70E-02 | 5.60E-01 |
| Graft-vs.-host
disease | 4 | 4.40E-02 | 5.00E-01 |
| Type I diabetes
mellitus | 4 | 5.20E-02 | 5.10E-01 |
| GPI-anchor
biosynthesis | 3 | 9.00E-02 | 6.30E-01 |
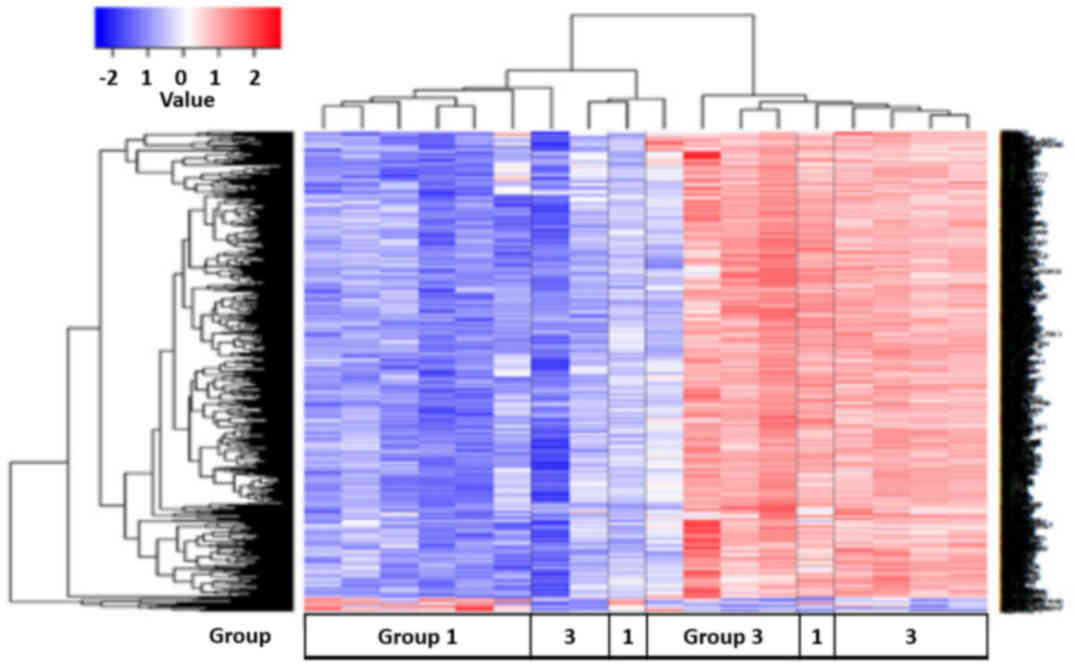
Comparison of whole blood gene
transcriptional profiles of untreated vs. treated spinal TB
patients. Gene expression profiles were compared between untreated
(group 1) and treated (group 2) spinal TB patients
A total of 1,989 differentially expressed genes were
identified (Fig. 6). Of these genes,
24 genes were upregulated and 1,965 genes were downregulated when
comparing group 1 with group 2. Pathway analysis using the DAVID
knowledgebase identified 41 pathways that differed between these
two groups (Table V). The pathways
identified were associated with immunoregulation, such as toll-like
receptor signaling and FcγR receptor-mediated phagocytosis, and
inflammation, such as chemokine and p53 signaling. A variety of
cancer-associated pathways were activated, such as cell cycle
signaling and pathways associated with non-small cell lung cancer,
prostate cancer, colorectal cancer and glioma. In addition,
ribosomal, proteasomal and apoptotic pathways were activated, which
are associated with TB infection. The majority of group 2 displayed
an upregulation of genes that were downregulated in group 1
(Fig. 6). There were a number of
exceptions; one untreated patient with TB displayed an excessive
upregulation of these genes, while two treated patients with TB did
not show an increase in the upregulation of these genes.
| Table V.Pathway analysis between group 1 vs.
group 2. |
Table V.
Pathway analysis between group 1 vs.
group 2.
| Pathway | Count | P-value | Q-value |
|---|
| Spliceosome | 33 | 3.40E-07 | 2.90E-05 |
| Regulation of actin
cytoskeleton | 33 | 1.20E-02 | 1.00E-01 |
| Ribosome | 31 | 3.10E-10 | 5.40E-08 |
| Endocytosis | 28 | 2.40E-02 | 1.60E-01 |
| Chemokine
signaling | 27 | 4.70E-02 | 2.40E-01 |
| Natural killer cell
mediated cytotoxicity | 27 | 5.00E-04 | 2.10E-02 |
| Leukocyte
transendothelial migration | 24 | 1.10E-03 | 3.10E-02 |
| T cell receptor
signaling | 20 | 9.10E-03 | 1.10E-01 |
| Antigen processing
and presentation | 17 | 6.70E-03 | 1.00E-01 |
| Toll-like receptor
signaling | 16 | 7.20E-02 | 3.00E-01 |
| NOD-like receptor
signaling | 12 | 4.00E-02 | 2.20E-02 |
| Graft-vs.-host
disease | 9 | 3.50E-02 | 2.10E-02 |
Comparison of whole blood gene
transcriptional profiles of untreated vs. 1 year post-treatment
patients with spinal TB
Gene expression profiles were compared between group
1 (untreated) and group 3 (1 year post-treatment) patients with
spinal TB. A total of 824 differentially expressed genes were
identified (Fig. 7). Of these genes,
46 were upregulated and 778 were downregulated when comparing group
1 with group 3. Pathway analysis using the DAVID knowledgebase
identified 5 pathways that differed between these two groups
(Table VI). These pathways were
associated with the ribosome, spliceosome, APP, retinoic
acid-inducible gene (RIG)-I-like receptor signaling and RNA
degradation. The majority of group 3 displayed an upregulation of
genes that were downregulated in group 1 (Fig. 7).
| Table VI.Pathway analysis between group 1 vs.
group 3. |
Table VI.
Pathway analysis between group 1 vs.
group 3.
| Pathway | Count | P-value | Q-value |
|---|
| Ribosome | 42 | 2.70E-35 | 3.40E-33 |
| Spliceosome | 16 | 1.40E-04 | 9.10E-03 |
| Antigen processing
and presentation | 8 | 4.90E-02 | 8.80E-01 |
| RIG-I-like receptor
signaling | 7 | 6.50E-02 | 8.90E-01 |
| RNA
degradation | 6 | 7.80E-02 | 8.80E-01 |
Comparison of whole blood gene
transcriptional profiles of treated vs. 1 year post-treatment
patients with spinal TB
The gene expression profiles of group 2 (treated)
and group 3 (1 year post-treatment) patients with spinal TB were
compared. A total of 27 differentially expressed genes were
upregulated when comparing group 2 with group 3 (Fig. 8). Pathway analysis using the DAVID
knowledgebase identified 1 pathway that differed between these two
groups; the RIG-I-like receptor signaling pathway
(P=2.80×10²; Q=5.50×10²). The majority of
group 3 displayed a downregulation of the genes that were
upregulated in group 2 (Fig. 8).
RT-PCR validation
RT-PCR validations were run on several genes. From
the total microarray data, the upregulated genes TMX4 (thioredoxin
related transmembrane protein 4), FGL2 (fibrinogen like 2) and GNLY
(granulysin), and the downregulated genes PF4V1 (platelet factor 4
variant 1) and USP33 (ubiquitin specific peptidase 33), were
selected for RT-PCR validation with GAPDH as the internal control
(Table II). In a separate analysis,
GBP1 (guanylate binding protein 1) and LY96 (lymphocyte antigen 96)
expression levels, with GAPDH as an internal reference, were
validated with RT-PCR (Table II).
The findings from this RT-PCR were similar to those observed in the
microarray assays.
Discussion
The Affymetrix GeneChip has ~50,000 probes for
examining gene expression. Considering the differences between
individuals, peripheral blood samples were collected from patients
at various treatment periods. The consistency of the study and
clinical results demonstrated the reliability of this detection
method. Previous studies reported that UCCT lasting <6 months
has proved effective in the initial treatment of pulmonary TB
(10–13). In addition, complete debridement and
UCCT for spinal TB have proven to be clinically effective (4–6). In the
present study, it is demonstrated that using DNA microarray
technology to determine whole blood transcriptional profiles at
various stages of spinal TB treatment is a promising adjunctive
therapeutic tool. Transcriptional profiling can be used to measure
the changes in gene expression prior to and following treatment, so
it can be used to indirectly evaluate the therapeutic efficacy of
treatment and accurately determine the type and severity of
infection (10,14–17).
DNA microarray technology and gene cluster analysis
using the DAVID knowledgebase were used to detect the gene
expression profiles from the peripheral blood of patients with
spinal TB at the three different stages: Prior to spinal TB
treatment (group 1), following the completion of UCCT treatment
(group 2) and 1 year post-UCCT treatment (group 3). These profiles
were then compared with those of healthy controls. As shown in the
heat map of all the groups, a transition from the downregulation of
certain genes to upregulation of certain genes was identified over
the course of spinal TB treatment. It was observed that following
the removal of TB lesions with surgical debridement and subsequent
UCCT, the expression of certain genes increased in the peripheral
blood of the treated groups (group 2 and group 3). This heat maps
provide an overview of the changes in the gene expression from the
microarray data. The 2,971-transcriptional profile can be used to
observe whether the treatment has an effect on spinal TB.
Furthermore, analysis of the groups in comparison to
one another provided an overview of the effects of spinal TB
treatment on changes in gene expression. For example, although few
changes were identified between the control group and group≈1, a
separate analysis identified 125 differentially expressed genes
between the two groups. Profiling expression of these 125 genes may
prove useful in separating TB-infected individuals from uninfected
individuals. In addition, transcriptional profiling provided an
indication of the infection phases of TB. Bioinformatical pathway
analysis using the DAVID knowledgebase between TB infected patients
and healthy controls identified 2 pathways that are associated with
TB infection: Small cell lung cancer associated signaling and the
APP pathway. These pathway changes are consistent with TB
infection, since TB primarily infects the lung. The changes
observed in small cell lung cancer-associated signaling indicated
the infectious phase of TB spread from the lungs to the spine.
Observed activity in the APP pathway indicated that TB infection
was triggering an immune response. One explanation for the
downregulation of genes that were upregulated in the control group,
is that TB infection is downregulating the expression of genes that
would interfere with its spread. Further studies are needed to
explore the genes that are downregulated following TB
infection.
In patients with spinal TB who underwent UCCT
treatment, 1,550 differentially expressed genes were identified
from cluster analysis. It was observed that genes that were
downregulated in the control group were upregulated in UCCT-treated
patients. This transcriptional profile was found to be associated
with several immune response-related pathways including the
following: Autophagy, inflammation, apoptosis and protein
degradation. This shows that the clearance of TB and UCCT treatment
serve a primary role in inducing an immune response. This
1,550-gene transcriptional profile reflects the changes in gene
expression between individuals exposed to UCCT compared with
healthy controls. The activation of apoptosis and protein
degradation pathways are indicative of the toxic side effects of
chemotherapy. However, activation of B and T cell receptors, APP
and natural killer cell-mediated cytotoxicity pathways were
additionally noted. This suggests that treatment with UCCT and
complete debridement supports the clearance of spinal TB.
In patients who had completed treatment (1 year
follow-up), there was a change in the expression of 400 genes and a
reduced number of altered cell death pathways compared to healthy
controls. A continued upregulation in these genes in comparison to
the control group was observed. The upregulation of these genes is
not attributable to UCCT, as treatment was 1 year ago. Pathway
analysis identified that, compared with the control group, a lesser
number of immune response, inflammation and apoptosis associated
pathways were changed. These changes demonstrate that patients are
recovering both from TB and the chemotherapy treatment as spinal
tuberculosis itself is an inflammatory reaction; as the
inflammatory response after one year follow-up indicators are
decreased, the treatment is effective.
The present study identified transcriptional
profiles that changed over the course of spinal TB treatment. In
addition to evaluating the profile changes, the transcriptional
profiles of untreated and treated spinal TB groups were compared,
along with comparing the 1 year follow-up group with the treated TB
group. The transcriptional profiles of 1,989 genes were found to
differ between the untreated and treated spinal TB patients.
Pathway analysis identified 41 pathways that differed between the
two groups. These pathways were associated with cancer,
inflammation, the immune response and apoptosis. The heat map
confirmed that the treated patient displayed an upregulation of
genes associated with those pathways. Interestingly, when comparing
the untreated and the 1-year post-treatment of patients with spinal
TB, the number of differentially expressed genes reduced to 824,
which were associated with protein degradation and the immune
system. Although the genes associated with these pathways are
upregulated in group 3, the decreased number of upregulated genes
compared with the untreated group showed that the individuals were
recovering.
The difference in the transcriptional profiles
between the treated spinal TB group and the 1 year post-treatment
group was examined to evaluate the changes in gene expression
following UCCT and complete debridement. There was no increase in
the number of differentially expressed gene. Instead, it was
observed that there were only 27 differentially expressed genes
between group 2 and group 3. These genes are associated with the
RIG-1 like receptor pathway. These receptors recognize viruses,
which trigger an innate immune response. The reduced number of
differentially expressed genes showed that patient's gene
expression levels are returning to normal 1 year post-treatment.
The heat maps showed that the differentially expressed genes were
downregulated when comparing group 3 with group 2. In addition, the
heat maps confirmed that following therapy, a number of genes are
downregulated to similar levels of those in the control group.
The present study shows that the gene expression in
the peripheral blood of spinal TB patients changes over the course
of treatment. The gene expression levels measured are consistent
with the clinical results in the current study, indicating that
complete surgical debridement and 5–6 months of UCCT have
therapeutic efficacy on spinal TB. The complete debridement of TB
lesions removes the barriers that prevent the medication from
targeting the infected area (9).
Analysis of the upregulated differentially expressed genes found
that they are involved in immune response pathways. These changes
at the different stages of treatment indicate the clearance of TB
with UCCT and complete debridement. The removal of TB from the
lesion relieved the host immune system and promoted expression of
regulatory factors that are involved in clearing the bacteria
(18).
In conclusion, to the best of our knowledge, the
present study has demonstrated for the first time that DNA
microarray technology can detect and monitor the changes in gene
expression in the peripheral blood cells of patients with spinal TB
at different therapeutic stages. This is shown through the
consistency of the study results, clinical results and the
differentially expressed genes associated with immune responses
between groups. Evaluating the therapeutic efficacy of spinal TB
treatments could prove an important application of DNA microarray
technology. In addition, the microarray data allowed the use of
heat maps to monitor changes during TB infection and treatment with
UCCT. These heat maps can be used to determine how effective TB
treatments are. Additionally, the present study provides an
important insight into novel genes involved in the immune response
against TB. The next step is to screen for UCCT-specific gene
targets, in order to elucidate genes involved in the
chemotherapeutic response.
Acknowledgements
The present study was funded by the National Natural
Science Foundation of China (grant no. 81260282) and the Ningxia
Natural Science Foundation (grant nos. NZ11195 and NZ11275).
References
|
1
|
Onozaki I: National surveys of the
prevalence of tuberculosis disease-overview, progress and lessons
learnt. Kekkaku. 88:777–783. 2013.(In Japanese). PubMed/NCBI
|
|
2
|
Rasouli MR, Mirkoohi M, Vaccaro AR,
Yarandi KK and Rahimi-Movaghar V: Spinal tuberculosis: Diagnosis
and management. Asian Spine J. 6:294–308. 2012. View Article : Google Scholar : PubMed/NCBI
|
|
3
|
Karaeminogullari O, Aydinli U, Ozerdemoglu
R and Ozturk C: Tuberculosis of the lumbar spine: Outcomes after
combined treatment of two-drug therapy and surgery. Orthopedics.
30:55–59. 2007.PubMed/NCBI
|
|
4
|
Wang Z, Shi J, Geng G and Qiu H:
Ultra-short-course chemotherapy for spinal tuberculosis: Five years
of observation. Eur Spine J. 22:274–281. 2013. View Article : Google Scholar : PubMed/NCBI
|
|
5
|
Jin W and Wang Z: Clinical evaluation of
the stability of single-segment short pedicle screw fixation for
the reconstruction of lumbar and sacral tuberculosis lesions. Arch
Orthop Trauma Surg. 132:1429–1435. 2012. View Article : Google Scholar : PubMed/NCBI
|
|
6
|
Wang Z, Ge Z, Jin W, Qiao Y, Ding H, Zhao
H, Lin Z, Chen J and Yang W: Treatment of spinal tuberculosis with
ultrashort-course chemotherapy in conjunction with partial excision
of pathologic vertebrae. Spine J. 7:671–681. 2007. View Article : Google Scholar : PubMed/NCBI
|
|
7
|
Wang Z: Complete removal of the lesions of
spinal tuberculosis and its related issues opinion. Chinese Journal
of Spine and Spinal Cord. 18:568–570. 2008.
|
|
8
|
Livak KJ and Schmittgen TD: Analysis of
relative gene expression data using real-time quantitative PCR and
the 2(−Delta Delta C(T)) Method. Methods. 25:402–408. 2001.
View Article : Google Scholar : PubMed/NCBI
|
|
9
|
Ge Z, Wang Z and Wei M: Measurement of the
concentration of three antituberculosis drugs in the focus of
spinal tuberculosis. Eur Spine J. 17:1482–1487. 2008. View Article : Google Scholar : PubMed/NCBI
|
|
10
|
Eisen MB, Spellman PT, Brown PO and
Botstein D: Cluster analysis and display of genome-wide expression
patterns. Proc Natl Acad Sci USA. 95:14863–14868. 1998. View Article : Google Scholar : PubMed/NCBI
|
|
11
|
Dennis G Jr, Sherman BT, Hosack DA, Yang
J, Gao W, Lane HC and Lempicki RA: DAVID: Database for Annotation,
visualization, and Integrated Discovery. Genome Biol. 4:P32003.
View Article : Google Scholar : PubMed/NCBI
|
|
12
|
Liu Y, Wang Y, Teng Z, Zhang X, Ding M,
Zhang Z, Chen J and Xu Y: DNA microarray analysis in screening
features of genes involved in spinal cord Injury. Med Sci Monit.
22:1571–1581. 2016. View Article : Google Scholar : PubMed/NCBI
|
|
13
|
Young DB, Perkins MD, Duncan K and Barry
CE III: Confronting the scientific obstacles to global control of
tuberculosis. J Clin Invest. 118:1255–1265. 2008. View Article : Google Scholar : PubMed/NCBI
|
|
14
|
Mistry R, Cliff JM, Clayton CL, Beyers N,
Mohamed YS, Wilson PA, Dockrell HM, Wallace DM, van Helden PD,
Duncan K and Lukey PT: Gene-expression patterns in whole blood
identify subjects at risk for recurrent tuberculosis. J Infect Dis.
195:357–365. 2007. View
Article : Google Scholar : PubMed/NCBI
|
|
15
|
Jacobsen M, Repsilber D, Gutschmidt A,
Neher A, Feldmann K, Mollenkopf HJ, Ziegler A and Kaufmann SH:
Candidate biomarkers for discrimination between infection and
disease caused by Mycobacterium tuberculosis. J Mol Med (Berl).
85:613–621. 2007. View Article : Google Scholar : PubMed/NCBI
|
|
16
|
Ockenhouse CF, Bernstein WB, Wang Z and
Vahey MT: Functional genomic relationships in HIV-1 disease
revealed by gene-expression profiling of primary human peripheral
blood mononuclear cells. J Infect Dis. 191:2064–2074. 2005.
View Article : Google Scholar : PubMed/NCBI
|
|
17
|
Bleharski JR, Li H, Meinken C, Graeber TG,
Ochoa MT, Yamamura M, Burdick A, Sarno EN, Wagner M, Röllinghoff M,
et al: Use of genetic profiling in leprosy to discriminate clinical
forms of the disease. Science. 301:1527–1530. 2003. View Article : Google Scholar : PubMed/NCBI
|
|
18
|
Cooper AM: Cell-mediated immune responses
in tuberculosis. Annu Rev Immunol. 27:393–422. 2009. View Article : Google Scholar : PubMed/NCBI
|