Introduction
With the increasing age and obesity rate of the
world's population (1), the
incidence of knee osteoarthritis (OA) is increasing. Knee OA is the
main cause of disability and functional limitation among elderly
individuals (2,3). Radiological and physical examinations
represent noninvasive methods for OA diagnosis. However, ordinary
X-ray can only identify a change of bone structure under the
articular surface and joint space narrowing (4). By contrast, high-resolution magnetic
resonance imaging (MRI) can be used to detect changes in bone
structure, cartilage damage (CD), meniscal tears, synovitis,
subchondral cysts, bone attrition, ligament trauma and bone marrow
edema (BME) (5,6).
The knee joint is composed of the patellofemoral
joint (PFJ) and the tibiofemoral joint (TFJ). Previous studies have
mainly focused on TFJ-OA, whereas PFJ-OA has been less studied
(7). A previous study suggested that
PFJ-OA is at least as common as TFJ-OA (8). Alone or in combination with TFJ-OA,
PFJ-OA may account for up to 65% of cases of symptomatic knee OA.
Therefore, more attention must be paid to the changes that occur in
PFJ-OA (9). In particular, PFJ-OA is
closely associated with knee joint pain and dysfunction. Which
region of the knee is the first to be affected by OA and the most
likely to lead to knee pain are clinically important questions for
clinicians (10).
The aims of the present study were as follows: i) To
compare the distribution and severity of CD and BME between the PFJ
and TFJ in knee OA by MRI; and ii) to determine whether a
correlation exists between BME and CD in knee OA.
Materials and methods
Participants and study design
Approval of the present study was obtained from the
Institutional Review Board of the First Affiliated Hospital of
Xi'an Jiaotong University Medical College (Xi'an, China). All
participants signed informed consent forms prior to participating.
Between December 2013 and December 2014, 45 individuals with knee
OA who underwent MR examination at The First Affiliated Hospital of
Xi'an Jiaotong University Medical College (Xi'an, China) were
selected for the present study (KOA group). During the same period,
20 healthy volunteers were selected from inside and outside the
hospital.
The 1995 revised diagnostic criteria (11) for knee OA of the American College of
Rheumatism Association are as follows: i) Knee pain of at least 1
month's duration, ii) bone friction with knee activity, iii)
morning stiffness lasting ≤30 min, iv) age >38 years, and v)
presence of bone osteophytes. Participants who met criteria i-iv,
criteria i, ii and v or criteria i, iv and v were diagnosed with
knee OA and included in the study. Exclusion criteria for the KOA
group were as follows: Diagnosis with ankylosing spondylitis,
rheumatoid arthritis, reactive arthritis, psoriatic arthritis or
any other type of chronic immune disease, a history of knee trauma
or surgery, treatment with systemic corticosteroids,
intra-articular injections or drugs for other bone-associated
diseases, contraindication for MR examination and refusal to
participate.
For all participants, body height and weight were
recorded and the body mass index (BMI) was calculated as the weight
divided by height squared (kg/m2). The Western Ontario
and McMaster Universities Osteoarthritis Index (WOMAC) was used to
evaluate knee joint function for subjects in the KOA group.
MR scan sequence and parameters
All 65 participants underwent MR scans with the GE
OPTIMA fiber MR 360 1.5 T MRI machine (GE Healthcare Systems,
Pittsburgh, PA, USA) using a phased array knee coil. MR sequences
included the following four conventional knee scan sequences:
Oblique Sagittal (OSAG) T2 proton density-weighted (PD)
fat-suppression (FS) fast spin echo (FSE) imaging, OSAG-T1-FSE,
coronary T2 PD-FS-FSE and cross-sectional T2 PD-FS-FSE imaging. In
addition, the OSAG multi-echo gradient imaging sequence was used,
with the following scan parameters: Repetition time, 529; echo
time, 16; echo train length, 6; echo sequence, 1; slice thickness
(ST), 4 mm; slice spacing (SS), 0.4 mm; spin echo, 16; filed of
vies, 18×18; MATRIX, 256×256; NEX, 2; bandwidth, 63; and acquire
time (TA), 4:35.
Semi-quantitative assessment of MR
images
By applying the whole-organ MRI scoring (WORMS)
method (12), knee joint cartilage
was divided in 15 anatomic subregions on MRI (13). Knee joint cartilage in the sagittal
position was divided into subregions designated as femoral or
tibial, lateral or medial, and central, posterior or anterior. The
patella was divided into medial and lateral subregions in the axial
plane. Medial and lateral regions of the femoral trochlea cartilage
were defined. The subspinous subregion of the tibia has no
cartilage and was excluded from analysis. The PFJ comprises five
subregions: The patella medial and lateral subregions, and the
femoral medial, lateral anterior and lateral trochlea subregions.
The TFJ comprises 10 subregions: The femoral medial, lateral
central and posterior subregions, and the tibial medial, lateral,
anterior, central and posterior subregions.
Evaluation of CD and BME by
semi-quantitative MRI
MRIs of the knee joint cartilage were inputted into
the Centricity DICOM Viewer 3.1.3 post-processing workstation (GE
Healthcare Life Sciences, Chalfont, UK). Two trained comprehensive
radiologists who were blinded to the patient groups assessed the
cartilage morphology (i.e., damaged or undamaged), CD score
(described in detail in Fig. 1) and
BME score for each of the 15 WORMS subregions. For subregions with
CD, the highest CD score for the subregion was recorded. BME with
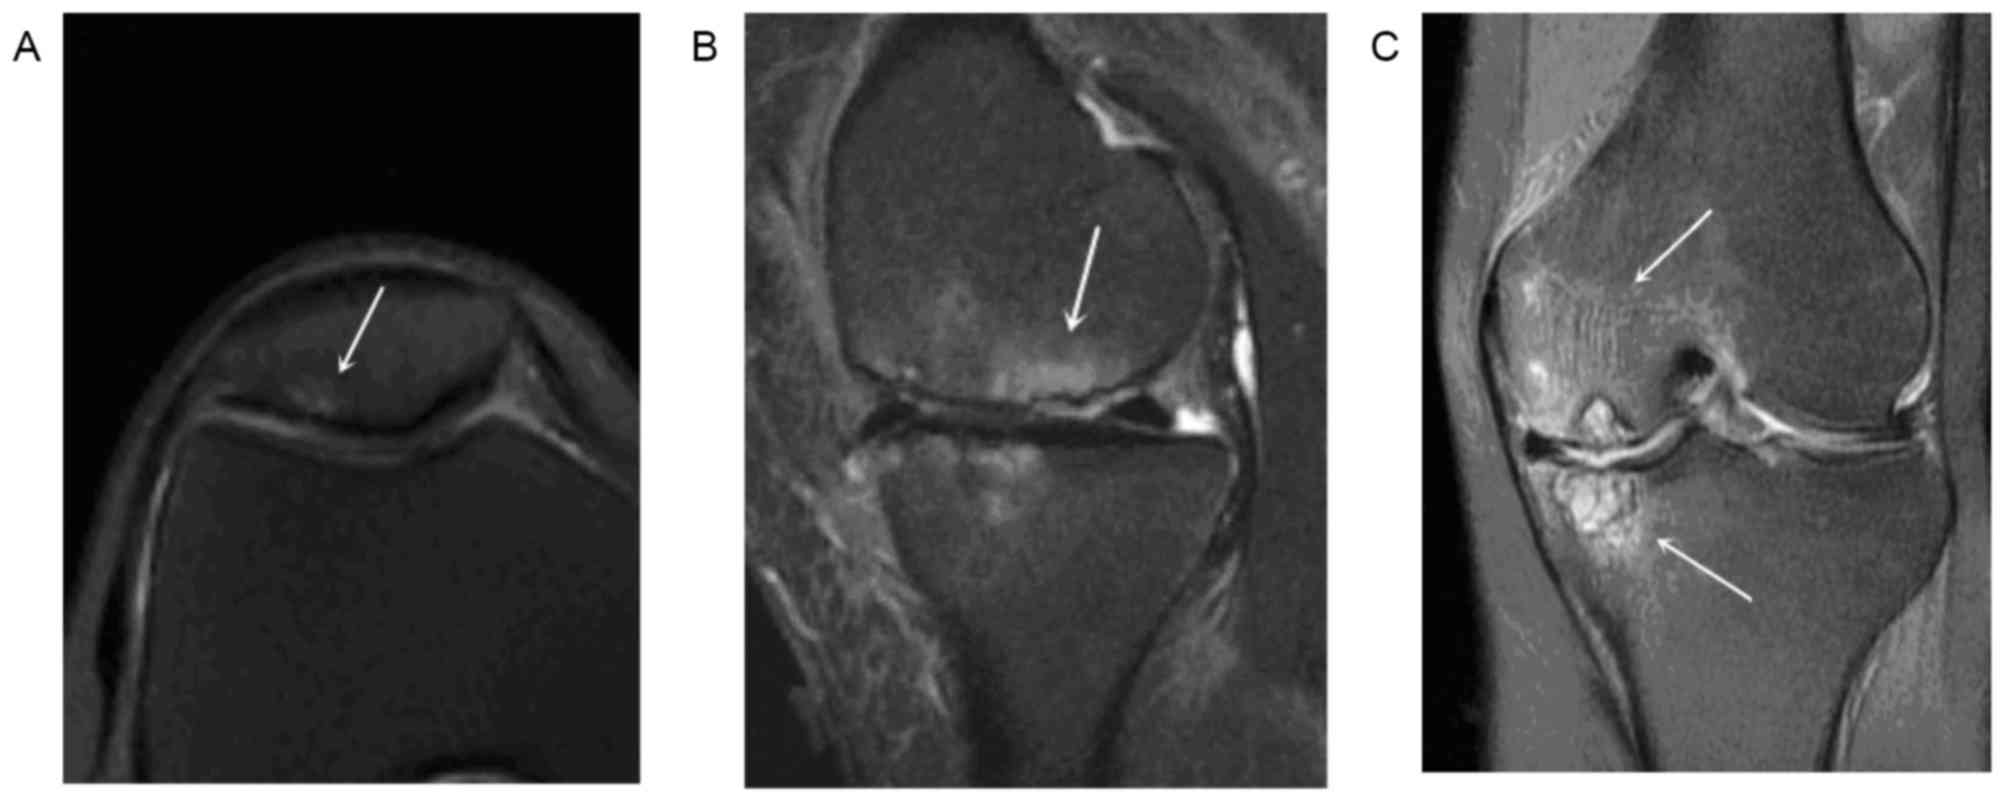
high signal intensity was scored as follows (10): 0, Normal bone marrow without edema;
1, mild edema of <25% of the area (Fig. 2A); 2, moderate edema of 25–50% of the
area (Fig. 2B); and 3, severe edema
of ≥50% of the area (Fig. 2C). In
the case of disagreement between observers, a consensus was
achieved through discussion.
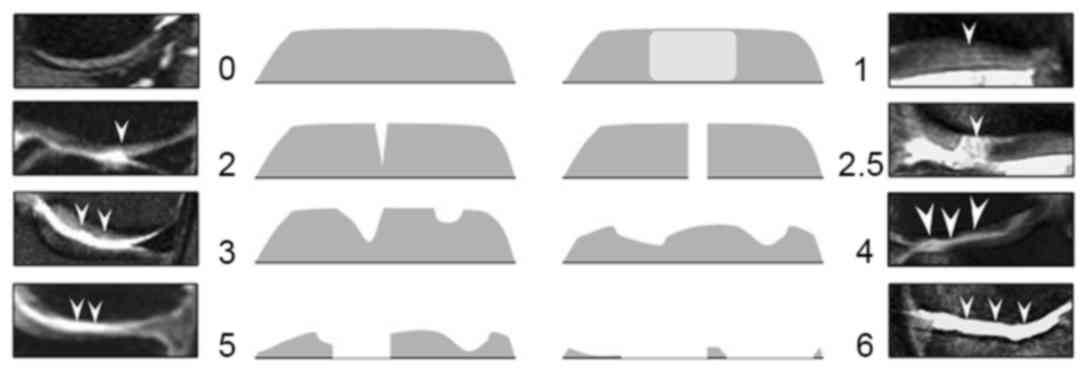 | Figure 1.Cartilage signal intensity and
morphology were scored using an 8-point scale from Hayashi et
al (13): 0, normal thickness
and signal; 1, normal thickness but increased signal on
fat-suppression proton density-weighted turbo spin echo image; 2.0,
partial-thickness focal defect <1 cm in greatest width; 2.5,
full-thickness focal defect <1 cm in greatest width; 3, multiple
areas of partial-thickness (grade 2.0) defects intermixed with
areas of normal thickness, or a grade 2.0 defect >1 cm
comprising <75% of the subregion; 4, diffuse (≥75% of the
subregion) partial-thiwness loss; 5, multiple areas of
full-thickness loss (grade 2.5), or a grade 2.5 lesion >1 cm
comprising <75% of the subregion; 6, diffuse (≥75% of the
subregion) full-thickness loss. Arrowheads indicate cartilage
damage degree from 0 to 6 standard atlas in cases. |
Statistical analysis
Excel 2013 (Microsoft Corp., Redmont, WA, USA) and
the SPSS 18.0 statistical software package (SPSS, Inc., Chicago,
IL, USA) were used for data entry and statistical analysis. Values
are expressed as the mean value ± standard deviation. Chi-squared
tests were used to compare the articular CD and BME scores between
the PFJ and TFJ. Cartilage morphology, CD score and BME score were
compared between the KOA and control groups by the Student's
t-test. Multivariate linear regression and Pearson's correlation
coefficient were used to assess whether a correlation existed in
the KOA group among the CD score, BME score, WOMAC pain score and
BMI. P<0.05 was considered to indicate a statistically
significant difference. A positive correlation was defined as an
R>0.
Results
Demographic data
Table I summarizes
the demographic information for the KOA and control groups. There
were no significant differences between the two groups in terms of
gender distribution or BMI (BMI, t=1.048, P=0.298), while the
groups differed in terms of age (t=4.498, P<0.001).
 | Table I.Demographic characteristics of the
study population. |
Table I.
Demographic characteristics of the
study population.
| Characteristic | Control group
(n=20) | KOA group (n=45) |
|---|
| Gender
(male/female) | 14/6 | 12/33 |
| Age (years) | 35.0±10.8 | 50.0±13.3 |
| Body mass index
(kg/m2) | 23.5±3.0 | 24.4±3.2 |
| Left/right knee | 12/8 | 19/26 |
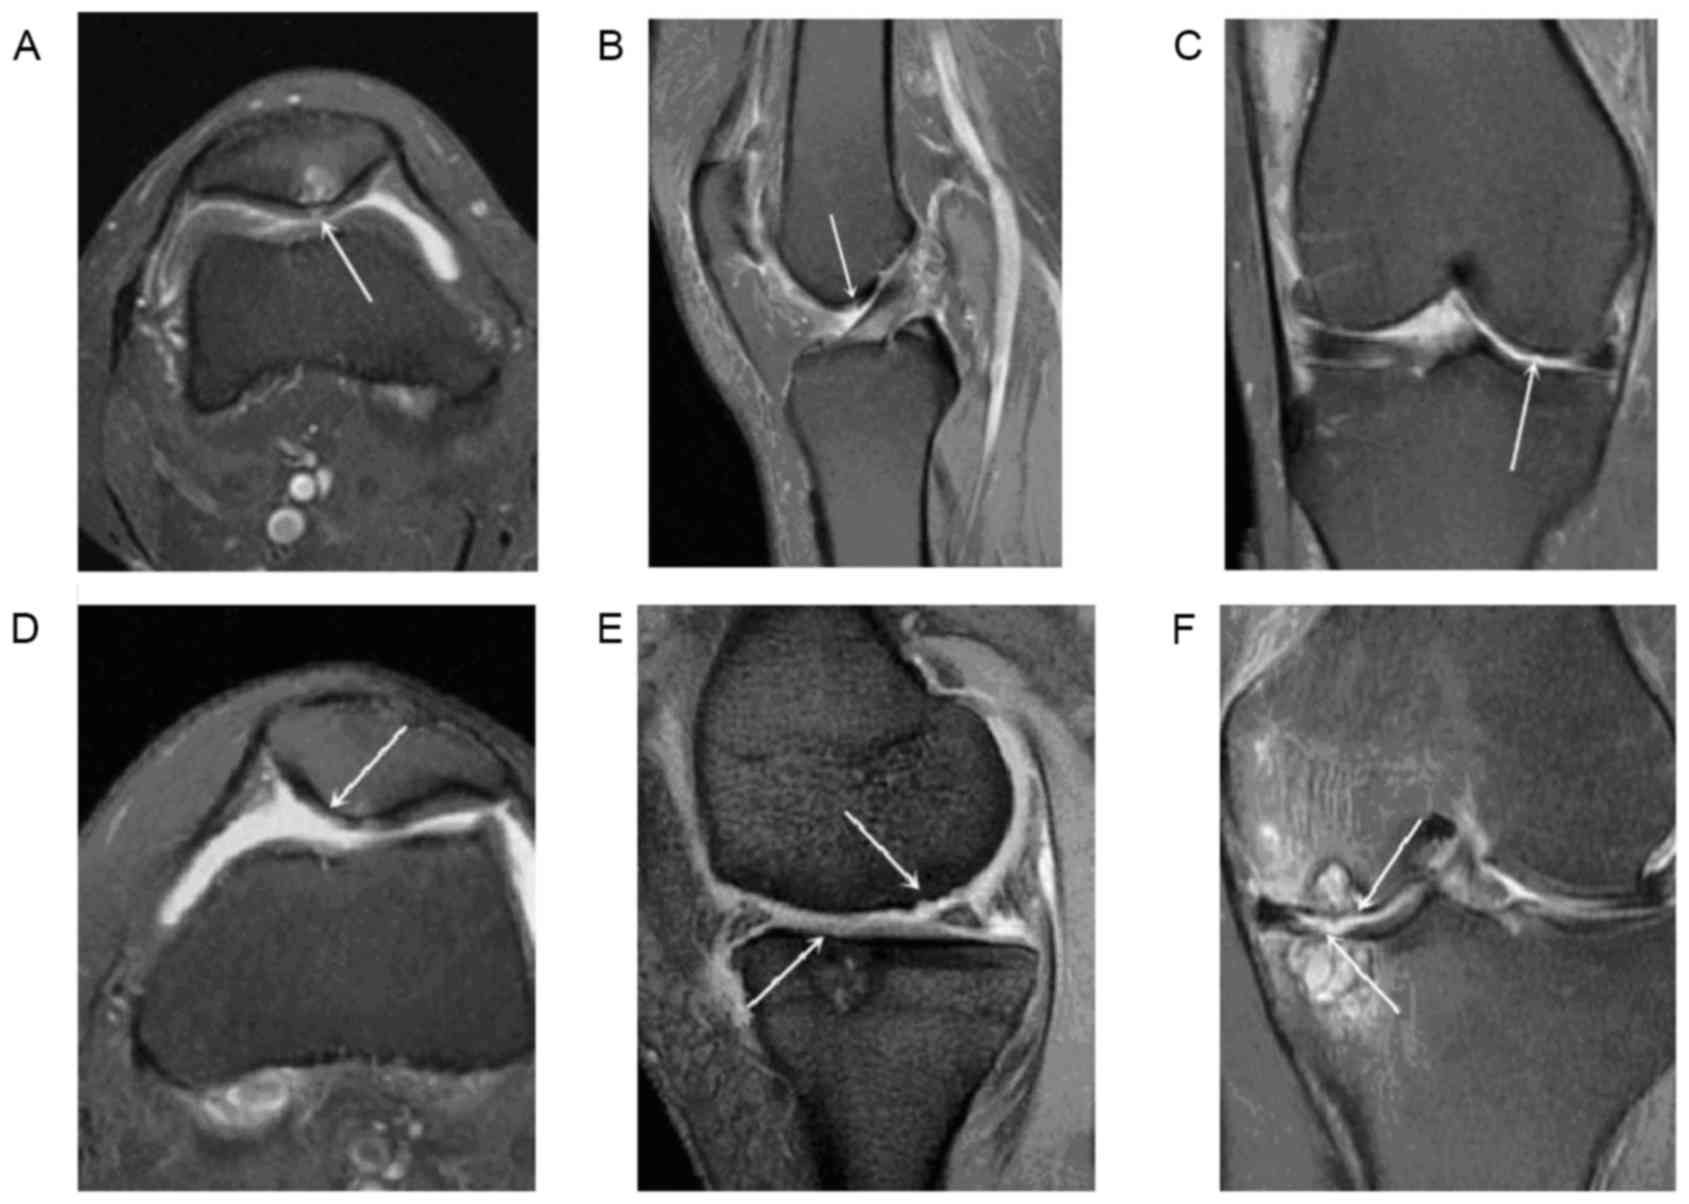
Distribution and characteristics of CD
in the KOA group
Among the 675 subregions examined in the KOA group,
there were 131 subregions with CD scores of 1–6. A CD score of 2.5
frequently indicated more serious damage. However, as no
participant had a score of exactly 2.5, subregions were divided
into those having CD scores of 1–3 (48 subregions) or 4–6 (83
subregions). Among the 131 subregions with CD, 80 subregions
(61.07%) were in the PFJ and 51 subregions (38.93%) were in the TFJ
(χ2=56.267, P<0.001). Two instances of CD were in the
femoral lateral trochlea subregion. Thirty-three subregions had a
CD score of 1, including 24 subregions (72.73%) in the PFJ and 9
subregions (27.27%) in the TFJ (χ2=24.230, P<0.001;
Fig. 3).
BME distribution and characteristics
in the KOA group
BME was identified in 103 of the 675 examined
subregions, with a BME score of 1 in 54 subregions, 2 in 34
subregions and 3 in 54 subregions. Among the 103 subregions with a
BME score of 1–3, 60 subregions (58.25%) were in the PFJ and 43
subregions (41.75%) were in the TFJ (χ2=33.961,
P<0.001). There were 54 ‘early’ BME lesions (BME score, 1),
which were more frequently found in the PFJ (35 subregions, 64.8%)
compared to the TFJ (19 subregions, 35.2%) (χ2=26.178,
P<0.001).
Correlation among BMI and the CD, BME
and WOMAC pain scores
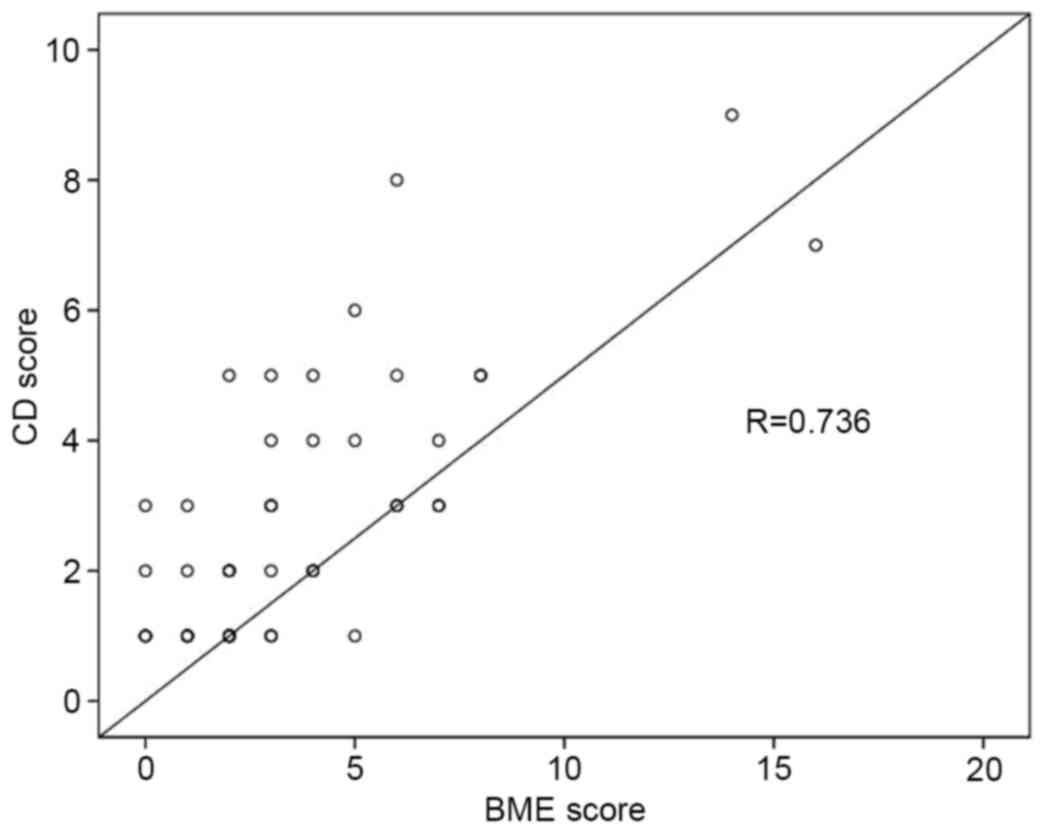
Table II reports the
correlation coefficients among BMI, WOMAC pain score, BME score and
CD score. There was a significant positive correlation between the
BME and CD scores, which was confirmed by a strong linear
correlation in the scatter diagram (P<0.001, R=0.736; Fig. 4).
| Table II.Correlation among BMI and BME, WOMAC
pain and CD scores. |
Table II.
Correlation among BMI and BME, WOMAC
pain and CD scores.
| Parameter | BME score | WOMAC pain
score | BMI | CD score |
|---|
| BME score |
|
|
|
|
| Pearson
correlation | 1 | −0.036 | 0.132 |
0.736 |
|
P-value | – |
0.825 | 0.389 |
<0.001a |
| N | 45 | 41 | 45 | 45 |
| WOMAC pain
score |
|
|
|
|
| Pearson
correlation | −0.036 | 1 | −0.129 | −0.028 |
|
P-value |
0.825 | – | 0.423 |
0.864 |
| N | 41 | 41 | 41 | 41 |
| BMI |
|
|
|
|
| Pearson
correlation | 0.132 | −0.129 | 1 | 0.103 |
|
P-value | 0.389 |
0.423 | – | 0.501 |
| N | 45 | 41 | 45 | 45 |
| CD score |
|
|
|
|
| Pearson
correlation |
0.736 | −0.028 | 0.103 | 1 |
|
P-value |
<0.001a |
0.864 | 0.501 | – |
| N | 45 | 41 | 45 | 45 |
Discussion
In the present study, the incidence of PFJ-OA was
significantly higher than that of TFJ-OA. The incidence of
early-stage CD without obvious morphological alterations (CD score,
1) was significantly higher in the PFJ compared to the TFJ. In the
control group, regions of CD with a high signal intensity were not
found on MRI. These findings are similar to those of Hayashi et
al (13), who used MRI to
examine the distribution and incidence of cartilage lesions (damage
grade >2) in different knee joints of 696 elderly OA patients
without X-ray evidence of disease. The incidence of cartilage
lesions was highest in the patellar subregions (medial, 47.7%;
lateral, 29.9%) followed by the femoral subregions (medial
anterior, 24.0%; medial central, 26.5%).
Duncan et al (14) stated that articular cartilage of the
femoral anterior subregion, particularly in the PFJ, should not be
ignored in the assessment of OA. The role of the PFJ in knee OA
symptoms may be even more important than the role of the TFJ
(15). Results from a longitudinal
cohort study (16) and an animal
model study (17) indicated that the
PFJ is more susceptible to degeneration than the TFJ for cases with
decreased muscle strength of the quadriceps femoris. Another study
stated that isolated PFJ-OA may lead to obvious functional
limitation of the knee joint (9).
According to a recent community survey, osteophytes were found at
higher rates in cases of PFJ-OA than TFJ-OA during plain film
examination (218/334 vs. 184/334; P<0.01) (18).
Hunter et al (19) considered the volume reduction of
patellar cartilage to be more closely associated with knee joint
pain than the reduction of tibial cartilage. In isolated PFJ-OA or
TFJ-OA of 407 knee joints, 193 (47%) knee joints had isolated
damage of the PFJ articular cartilage, compared to 112 (28%) with
isolated damage of the TFJ cartilage (10). Another 25% of knee joints had no CD.
Peat et al (20) found 236
(32%), 178 (24%), 30 (4%) and 301 (40%) cases with no radiological
features of OA, isolated PFJ-OA, isolated TFJ-OA, and combined
PFJ-and TFJ-OA.
Considering the results of the present and previous
studies, it is indicated that PFJ articular CD occurs earlier and
more frequently than TFJCD in patients with knee OA. There are
several possible reasons for these findings. First, the patellar
cartilage is in direct contact with cartilage of the femoral
anterior subregion in the PFJ. The PFJ does not have a meniscus
that can buffer the force in the knee. Furthermore, the areas of
activity and mobility are large in the PFJ. By contrast, the TFJ
has a double protective structure of articular cartilage and
meniscus. Thus, TFJ degeneration occurs later than PFJ
degeneration.
Second, PFJ-OA has a unique pathogenesis, with the
surface pressure distribution and size of the joint having
important roles (2). When the PFJ is
in the horizontal plane of translational motion (e.g., a person is
standing with their knees unbent), the joint does not experience
stress from body weight. However, the patellar cartilage surface
experiences mechanical pressure-associated friction from 0° and 90°
during activities involving bending or direct pulling of the
quadriceps tendon and patellar ligament. Moreover, the PFJ has a
physiological leverage function, in which the mechanical pressure
of the knee is concentrated at a point on the PFJ surface. During
knee weight-bearing activities, the PFJ surface bears the summation
vector of force from the femoral quadriceps and patellar ligament.
Any increase in this force will aggravate the PFJ reaction force,
which can reach levels of three times the body weight during
stair-climbing and seven to eight times the body weight during
squatting activities (21,22). Under repeated pressure action, the
PFJ cartilage can experience stress overload, internal damage,
fracture of the collagen fiber frame and local edema, with damage
spreading outward from the cartilage.
High signals for the internal cartilage morphology
were obtained on T2-weighted images, but the external morphology
and surface changes of the cartilage were not obvious from the
images. The damaged cartilage surface generally appears coarse,
with a temporary increase in the cartilage thickness, resulting in
softening, fibrosis and fissure of the cartilage surface. As the
cartilage cells themselves have limited repair ability,
degeneration of the cartilage morphology is inevitable under these
conditions. Internal degeneration of the cartilage may occur due to
knee overuse or locally uneven mechanical pressure. The femoral
cartilage has a higher overall coefficient of compressive
deformation and lower permeability than the patellar cartilage
(23). The BMI is a critical factor
in determining the cartilage pressure. Excess weight places stress
on the joints and quickly wears down the cartilage. Numerous
studies have reported that CD is more severe and occurs more
frequently in obese adult female populations compared to age- and
gender-matched (female) normal weight groups (24–26).
Felson (27) found that age-matched
elderly obese women had greater progression of knee OA compared to
women of a normal weight, which was proposed to be due to abnormal
mechanical stress of the knee joint.
Subchondral bone changes are crucial pathological
changes in OA. Under conditions of CD, MRI shows local BME under
the damaged cartilage. Articular cartilage has no pain receptors
(28), whereas BME is rich in pain
fibers. Numerous studies have proposed that BME may be the
underlying cause of pain in OA and epidemiological studies have
demonstrated a clear association between pain and osteophytes
(1,29,30).
Moreover, an association between pain and sclerosis of subchondral
bone has been indicated (4).
Cartilage nutrition, particularly of deep-layer cartilage, is
provided by the subchondral bone and synovial fluid. Microvascular
changes may cause an imbalance in cartilage nutrition, with
subsequent damage. Mild bone damage (microdamage) and BME are the
earliest pathological changes of the subchondral bone, and these
changes can lead to bone pain. Accumulation of extracellular fluid
in BME leads to increased bone internal pressure and stimulation of
the pain receptors. Further development of BME can cause
hyperplasia of the subchondral bone and thinning/stripping of
cartilage until the compact bone of the articular surface is
exposed.
Numerous studies have considered BME to be
associated with cartilage degeneration and the development of OA
(31–34). For instance, Baranyay et al
(32) found that large BME lesions
were more common in patients with knee pain than in those without.
In the present study, statistical analysis showed that CD in 15
knee joint subregions was positively correlated with BME around the
cartilage lesions (R=0.736, P<0.001). If morphological changes
are regarded as direct signs of CD, BME can be considered as an
indirect sign of CD.
The WOMAC scoring system is used to assess pain,
stiffness, feeling and physical function in patients with knee and
hip OA (35). The higher the WOMAC
score, the more severe the clinical manifestations of knee OA. The
WOMAC is a clinically practical and important means of evaluation
for knee pain, which has been extensively validated and tested. In
the present study, the correlation coefficient between the WOMAC
and CD scores was not statistically significant. One possible
reason for the lack of correlation is that the WOMAC score does not
reflect microscopic changes in CD, such as morphological changes of
the cartilage. Severe CD involves the subchondral bone, which
contains pain fibers, and affects the activity of the knee joint.
In this case, the WOMAC score would be expected to correlate with
the CD score.
In contrast to numerous studies demonstrating that
cartilage volume decreases with increasing BMI (36,37), the
present study revealed no significant correlation between BMI and
the CD score. One possible reason for this finding is that the
Chinese average BMI differs from standard BMI designations. In the
Chinese standard, individuals with a BMI<18.5 kg/m2
are defined as underweight, those with a BMI of 18.5–23.9
kg/m2 are considered to be of normal weight, those with
24–27.9 kg/m2 are overweight and those with a BMI>28
kg/m2 are obese. Therefore, the correlation between BMI
and CD in the present study may not be comparable to that
determined by previous studies.
The present study had certain limitations. First,
due to the small number of subjects, stratified data analysis could
not be performed. The second limitation was the lack of an
arthroscopic control. Although arthroscopic data are more intuitive
than MR data, arthroscopy is an invasive procedure and is less
commonly performed than MRI. Finally, no comparative continuous
longitudinal tracking study has been made.
In conclusion, the PFJ has an important role in
cartilage degeneration of the knee joint. Damage occurs earlier and
more often in PFJ cartilage compared to TFJ cartilage during knee
OA. Furthermore, BME occurs synchronously with cartilage damage in
knee OA. Future research should include a longitudinal quantitative
study of the earliest high-intensity signal to appear on MRI in the
articular cartilage during OA-associated degeneration of the PFJ
and TFJ.
References
|
1
|
Guermazi A, Niu J, Hayashi D, Roemer FW,
Englund M, Neogi T, Aliabadi P, McLennan CE and Felson DT:
Prevalence of abnormalities in knees detected by MRI in adults
without knee osteoarthritis: Population based observational study
(Framingham Osteoarthritis Study). BMJ. 345:e53392012. View Article : Google Scholar : PubMed/NCBI
|
|
2
|
Crema MD, Guermazi A, Sayre EC, Roemer FW,
Wong H, Thorne A, Singer J, Esdaile JM, Marra MD, Kopec JA, et al:
The association of magnetic resonance imaging (MRI)-detected
structural pathology of the knee with crepitus in a
population-based cohort with knee pain: The MoDEKO study.
Osteoarthritis Cartilage. 19:1429–1432. 2011. View Article : Google Scholar : PubMed/NCBI
|
|
3
|
Bedson J and Croft PR: The discordance
between clinical and radiographic knee osteoarthritis: A systematic
search and summary of the literature. BMC Musculoskelet Disord.
9:1162008. View Article : Google Scholar : PubMed/NCBI
|
|
4
|
Amin S, LaValley MP, Guermazi A, Grigoryan
M, Hunter DJ, Clancy M, Niu J, Gale DR and Felson DT: The
relationship between cartilage loss on magnetic resonance imaging
and radiographic progression in men and women with knee
osteoarthritis. Arthritis Rheum. 52:3152–3159. 2005. View Article : Google Scholar : PubMed/NCBI
|
|
5
|
Sowers M, Karvonen-Gutierrez CA, Jacobson
JA, Jiang Y and Yosef M: Associations of anatomical measures from
MRI with radiographically defined knee osteoarthritis score, pain,
and physical functioning. J Bone Joint Surg Am. 93:241–251. 2011.
View Article : Google Scholar : PubMed/NCBI
|
|
6
|
Guermazi A, Roemer FW and Hayashi D:
Imaging of osteoarthritis: Update from a radiological perspective.
Curr Opin Rheumatol. 23:484–491. 2011. View Article : Google Scholar : PubMed/NCBI
|
|
7
|
Farrokhi S, Piva SR, Gil AB, Oddis CV,
Brooks MM and Fitzgerald GK: Association of severity of coexisting
patellofemoral disease with increased impairments and functional
limitations in patients with knee osteoarthritis. Arthritis Care
Res (Hoboken). 65:544–551. 2013. View Article : Google Scholar : PubMed/NCBI
|
|
8
|
Stefanik JJ, Niu J, Gross KD, Roemer FW,
Guermazi A and Felson DT: Using magnetic resonance imaging to
determine the compartmental prevalence of knee joint structural
damage. Osteoarthritis Cartilage. 21:695–699. 2013. View Article : Google Scholar : PubMed/NCBI
|
|
9
|
Duncan R, Peat G, Thomas E, Wood L, Hay E
and Croft P: Does isolated patellofemoral osteoarthritis matter?
Osteoarthritis Cartilage. 17:1151–1155. 2009. View Article : Google Scholar : PubMed/NCBI
|
|
10
|
Stefanik JJ, Neogi T, Niu J, Roemer FW,
Segal NA, Lewis CE, Nevitt M, Guermazi A and Felson DT: The
diagnostic performance of anterior knee pain and activity-related
pain in identifying knees with structural damage in the
patellofemoral joint: The multicenter osteoarthritis study. J
Rheumatol. 41:1695–1702. 2014. View Article : Google Scholar : PubMed/NCBI
|
|
11
|
Singh AK, Kalaivani M, Krishnan A,
Aggarwal PK and Gupta SK: Prevalence of osteoarthritis of knee
among elderly persons in urban slums using American college of
rheumatology (ACR) criteria. J Clin Diagn Res. 8:JC09–JC11.
2014.PubMed/NCBI
|
|
12
|
Peterfy CG, Guermazi A, Zaim S, Tirman PF,
Miaux Y, White D, Kothari M, Lu Y, Fye K, Zhao S and Genant HK:
Whole-organ magnetic resonance imaging score (WORMS) of the knee in
osteoarthritis. Osteoarthritis Cartilage. 12:177–190. 2004.
View Article : Google Scholar : PubMed/NCBI
|
|
13
|
Hayashi D, Felson DT, Niu J, Hunter DJ,
Roemer FW, Aliabadi P and Guermazi A: Pre-radiographic
osteoarthritic changes are highly prevalent in the medial patella
and medial posterior femur in older persons: Framingham OA study.
Osteoarthritis Cartilage. 22:76–83. 2014. View Article : Google Scholar : PubMed/NCBI
|
|
14
|
Duncan RC, Hay EM, Saklatvala J and Croft
PR: Prevalence of radiographic osteoarthritis-it all depends on
your point of view. Rheumatology (Oxford). 45:757–760. 2006.
View Article : Google Scholar : PubMed/NCBI
|
|
15
|
Duncan R, Peat G, Thomas E, Wood L, Hay E
and Croft P: How do pain and function vary with compartmental
distribution and severity of radiographic knee osteoarthritis?
Rheumatology (Oxford). 47:1704–1707. 2008. View Article : Google Scholar : PubMed/NCBI
|
|
16
|
Amin S, Baker K, Niu J, Clancy M, Goggins
J, Guermazi A, Grigoryan M, Hunter DJ and Felson DT: Quadriceps
strength and the risk of cartilage loss and symptom progression in
knee osteoarthritis. Arthritis Rheum. 60:189–198. 2009. View Article : Google Scholar : PubMed/NCBI
|
|
17
|
Youssef Rehan A, Longino D, Seerattan R,
Leonard T and Herzog W: Muscle weakness causes joint degeneration
in rabbits. Osteoarthritis Cartilage. 17:1228–1235. 2009.
View Article : Google Scholar : PubMed/NCBI
|
|
18
|
Szebenyi B, Hollander AP, Dieppe P, Quilty
B, Duddy J, Clarke S and Kirwan JR: Associations between pain,
function, and radiographic features in osteoarthritis of the knee.
Arthritis Rheum. 54:230–235. 2006. View Article : Google Scholar : PubMed/NCBI
|
|
19
|
Hunter DJ, Zhang Y, Niu J, Goggins J, Amin
S, LaValley MP, Guermazi A, Genant H, Gale D and Felson DT:
Increase in bone marrow lesions associated with cartilage loss: A
longitudinal magnetic resonance imaging study of knee
osteoarthritis. Arthritis Rheum. 54:1529–1535. 2006. View Article : Google Scholar : PubMed/NCBI
|
|
20
|
Peat G, Duncan RC, Wood LR, Thomas E and
Muller S: Clinical features of symptomatic patellofemoral joint
osteoarthritis. Arthritis Res Ther. 14:R632012. View Article : Google Scholar : PubMed/NCBI
|
|
21
|
van Eijden TM, Kouwenhoven E, Verburg J
and Weijs WA: A mathematical model of the patellofemoral joint. J
Biomech. 19:219–229. 1986. View Article : Google Scholar : PubMed/NCBI
|
|
22
|
Reilly DT and Martens M: Experimental
analysis of the quadriceps muscle force and patello-femoral joint
reaction force for various activities. Acta Orthop Scand.
43:126–137. 1972. View Article : Google Scholar : PubMed/NCBI
|
|
23
|
Froimson MI, Ratcliffe A, Gardner TR and
Mow VC: Differences in patellofemoral joint cartilage material
properties and their significance to the etiology of cartilage
surface fibrillation. Osteoarthritis Cartilage. 5:377–386. 1997.
View Article : Google Scholar : PubMed/NCBI
|
|
24
|
Mansuripur PK, Deren ME, Hayda R and Born
CT: Initial management of ankle fractures in the overweight and
obese: The providence pinch. J Emerg Med. 47:561–564. 2014.
View Article : Google Scholar : PubMed/NCBI
|
|
25
|
Gudbergsen H, Lohmander LS, Jones G,
Christensen R, Bartels EM, Danneskiold-Samsøe B, Bliddal H and
Boesen M: Correlations between radiographic assessments and MRI
features of knee osteoarthritis-a cross-sectional study.
Osteoarthritis Cartilage. 21:535–543. 2013. View Article : Google Scholar : PubMed/NCBI
|
|
26
|
Novais EN and Millis MB: Slipped capital
femoral epiphysis: Prevalence, pathogenesis, and natural history.
Clin Orthop Relat Res. 470:3432–3438. 2012. View Article : Google Scholar : PubMed/NCBI
|
|
27
|
Felson DT: Osteoarthritis as a disease of
mechanics. Osteoarthritis Cartilage. 21:10–15. 2013. View Article : Google Scholar : PubMed/NCBI
|
|
28
|
Ulrich-Vinther M, Maloney MD, Schwarz EM,
Rosier R and O'Keefe RJ: Articular cartilage biology. J Am Acad
Orthop Surg. 11:421–430. 2003. View Article : Google Scholar : PubMed/NCBI
|
|
29
|
Benichou OD, Hunter DJ, Nelson DR,
Guermazi A, Eckstein F, Kwoh K, Myers SL, Wirth W and Duryea J:
Osteoarthritis Initiative Investigators: One-year change in
radiographic joint space width in patients with unilateral joint
space narrowing: Data from the Osteoarthritis Initiative. Arthritis
Care Res (Hoboken). 62:924–931. 2010. View Article : Google Scholar : PubMed/NCBI
|
|
30
|
Spector TD, Hart DJ, Byrne J, Harris PA,
Dacre JE and Doyle DV: Definition of osteoarthritis of the knee for
epidemiological studies. Ann Rheum Dis. 52:790–794. 1993.
View Article : Google Scholar : PubMed/NCBI
|
|
31
|
Link TM, Steinbach LS, Ghosh S, Ries M, Lu
Y, Lane N and Majumdar S: Osteoarthritis: MR imaging findings in
different stages of disease and correlation with clinical findings.
Radiology. 226:373–381. 2003. View Article : Google Scholar : PubMed/NCBI
|
|
32
|
Baranyay FJ, Wang Y, Wluka AE, English DR,
Giles GG, Sullivan RO and Cicuttini FM: Association of bone marrow
lesions with knee structures and risk factors for bone marrow
lesions in the knees of clinically healthy, community-based adults.
Semin Arthritis Rheum. 37:112–118. 2007. View Article : Google Scholar : PubMed/NCBI
|
|
33
|
Felson DT, McLaughlin S, Goggins J,
LaValley MP, Gale ME, Totterman S, Li W, Hill C and Gale D: Bone
marrow edema and its relation to progression of knee
osteoarthritis. Ann Intern Med. 139:330–336. 2003. View Article : Google Scholar : PubMed/NCBI
|
|
34
|
Roemer FW, Guermazi A, Javaid MK, Lynch
JA, Niu J, Zhang Y, Felson DT, Lewis CE, Torner J and Nevitt MC:
MOST Study investigators: Change in MRI-detected subchondral bone
marrow lesions is associated with cartilage loss: The MOST Study. A
longitudinal multicentre study of knee osteoarthritis. Ann Rheum
Dis. 68:1461–1465. 2009. View Article : Google Scholar : PubMed/NCBI
|
|
35
|
Bellamy N: The WOMAC knee and hip
osteoarthritis indices: Development, validation, globalization and
influence on the development of the AUSCAN hand osteoarthritis
indices. Clin Exp Rheumatol. 23:(5 Suppl 39). S148–S153.
2005.PubMed/NCBI
|
|
36
|
Hanna FS, Bell RJ, Davis SR, Wluka AE,
Teichtahl AJ, O'Sullivan R and Cicuttini FM: Factors affecting
patella cartilage and bone in middle-aged women. Arthritis Rheum.
57:272–278. 2007. View Article : Google Scholar : PubMed/NCBI
|
|
37
|
Teichtahl AJ, Wluka AE, Proietto J and
Cicuttini FM: Obesity and the female sex, risk factors for knee
osteoarthritis that may be attributable to systemic or local leptin
biosynthesis and its cellular effects. Med Hypotheses. 65:312–315.
2005. View Article : Google Scholar : PubMed/NCBI
|