Introduction
Paraquat (PQ; 1,1′-dimethyl-4,4′-bipyridinium), also
known as Gramoxone or methyl viologen, is an organic nitrogen
heterocyclic herbicide utilized in agriculture worldwide (1,2). PQ can
gradually damage human health via bioaccumulation in the food
chain, and ingestion of >15–30 ml of 20% (w/v) PQ can be fatal
in humans (3). Severe PQ poisoning
affects multiple organs, predominantly the lung, liver, kidneys,
adrenal cortex and myocardium (4).
Severe cases of acute PQ poisoning may also exhibit neurological
symptoms, such as dysphoria, somnolence, and impaired consciousness
(5). It is estimated that
250,000–370,000 individuals succumb to pesticide poisoning each
year globally, and >90% of patients with acute poisoning have
attempted suicide by ingesting concentrated PQ in a liquid form
(6). The principal biochemical
mechanism of PQ poisoning is based on redox cycling and
intracellular oxidative stress generation, and pulmonary fibrosis
and edema are the major clinical symptoms (7). A previous study has investigated
various treatment modalities for acute PQ poisoning, but the
fatality rate remains high (8). In
this context, biomarkers for the prognosis and clinical monitoring
of acute PQ poisoning are urgently required to guide appropriate
treatment plans and develop future PQ antidotes (2).
To date, several diagnostic methods have been
developed to evaluate the severity of acute PQ poisoning in
patients, including urine PQ concentration, the Acute Physiology
and Chronic Health Evaluation (APACHE) II score, arterial blood
lactate and ingestion dose of PQ (9,10).
Plasma and urine PQ concentrations obtained within the first 24 h
after ingestion are excellent predictors of the outcomes of PQ
poisoning (2). However, the
measurement of plasma PQ concentrations requires personnel support
and apparatus, including strict quality standards and controls to
predict severity, which may not be readily available in most
hospitals because of the expense of equipment and the associated
technical problems (11). Therefore,
urine analysis may have a higher predictive value and may more
rapidly assess prognosis compared with estimating PQ concentrations
in plasma (7). APACHE II is a
severity-of-disease classification system applied within 24 h of
admission of a patient to an intensive care unit (ICU), which has
been extensively used in the prediction of the outcomes of PQ
poisoning (12). Lactate estimation
is a prognostic tool that can predict the mortality rate among
patients with severe sepsis and ST elevation myocardial infarction
(13,14). It is used in numerous critical-care
patients, including patients who have recently undergone surgery
and those with burns, trauma, and septic shock. Arterial blood
lactate is a manifestation of organ dysfunction and has good
predictive power in evaluating patient prognosis during acute PQ
poisoning (9,13). Ingestion of >15–30 ml of 20% (w/v)
PQ can lead to mortality from multi-organ failure or respiratory
failure within a month of poisoning (3). Due to the fact that PQ intoxication has
a dose-response relationship, it is appropriate to evaluate the PQ
dose at a given time (10). In this
regard, the present study investigated the values of urine PQ
concentration, dose of poison, arterial blood lactate and APACHE II
score for predicting the prognosis of acute PQ poisoning.
Materials and methods
Subjects
A total of 194 patients with acute PQ poisoning who
were hospitalized between April 2012 and January 2014 at the First
Affiliated Hospital of China Medical University (Shenyang, China)
in the Intensive Care Unit of the Emergency Department were
selected as the research subjects. Selection criteria were as
follows: i) Patients were selected according to the diagnostic
criteria of acute PQ poisoning in The Diagnosis and Treatment of
Acute Poisoning (15), and clinical
diagnostic results were available; ii) patients were treated within
24 h after poisoning, and there was evidence of PQ poisoning or
circumstantial evidence of PQ poisoning provided by patients or
caregivers; iii) patients had not received therapy before admission
to the hospital, including blood purification treatment or gastric
lavage; and iv) patients had no history of serious heart, liver,
kidney and lung diseases. Exclusion criteria were: i) Patients had
a history of chronic kidney disease; ii) PQ combined with other
drug poisoning; iii) emergency observation was no more than 24 h;
iv) patients were admitted 24 h after they took poison; and v)
pregnant women, patients that gave up therapy or died due to
reasons unrelated to PQ poisoning. A total of 194 patients (72 men;
122 women) aged 12–75 years (mean, 32.51±12.72 years) were enrolled
in this study. The characteristics of PQ pesticide treatment were
as follows: 20% PQ pesticide dose, 10–150 ml; mean dose,
55.00±33.27 ml; time interval between PQ exposure and the first
urine sample, 0.5–11.5 h; and mean time interval, 4.8±6.9 h.
This study was performed in accordance with the
standard in medical ethics and was approved by the Medical Ethics
committee the First Affiliated Hospital of China Medical University
(Shenyang, China). Written informed consent was obtained prior to
treatment from patients or their family members. This study
conformed to the guidelines outlined in the Declaration of Helsinki
(16).
Data collection
Patients received auxiliary examinations
immediately, and 4 h (immediately following the peak of drug plasma
concentration) and within 24 h after poisoning, peripheral venous
blood and arterial blood samples were collected and immediately
sent to the Pathology Department to test the relevant indices.
Patient data were collected by two clinicians based on the unified
form, including sex and age of patients, poison dose, the time
interval between PQ exposure and the first urine sample, results of
routine blood and urine tests, fasting blood glucose, liver
function, kidney function, myocardial enzymes, serum potassium,
artery blood gas analysis, and amylase detection at admission to
hospital and at deterioration or improvement. Within the first 24 h
after admission to hospital, the APACHE II score was evaluated
according to the general condition and vital signs of patients and
the worst inspection results. Urine PQ concentration of patients
was dynamically monitored. Initial urine PQ concentration (C0) and
urine PQ concentration after hemoperfusion (HP) were calculated. Cx
indicates the urine PQ concentration after undergoing HP × times,
and Csec indicates the urine PQ concentration the following day
after HP was measured. The rebound rate of urine PQ concentration
the following day after HP was also calculated, as follows: Rebound
rate=(Csec-Cla)/la, where Cla is urine PQ concentration after the
final round of HP. Urine PQ concentration was detected each day
during the observation period until the PQ concentration in urine
was below the detectable level for 2 consecutive days, which was
defined as the point at which the urinary concentration became
negative.
Patients were divided into either the mortality
group, which included an early mortality subgroup (fatality within
7 days after poisoning) and a delayed mortality subgroup (fatality
between 7–28 days after poisoning), or the survival group (alive at
the 28-day follow-up). There were 80 patients in the survival group
(29 men and 51 women; mean age, 30.58±12.34 years) and 114 patients
in the mortality group (43 men and 71 women; mean age, 33.68±12.19
years). The levels of all the indices between the mortality and
survival groups were compared, the comparable indices were
analyzed, and superior predictors of mortality in patients were
explored using receiver operator characteristic (ROC) curve.
Treatment methods
The 194 patients were treated with unified treatment
options, including: i) removing unabsorbed poison via gastric
lavage and catharsis (oral administration of 100–250 ml of 20%
mannitol); ii) excluding absorbed poison via HP, hydration and
diuresis; iii) antioxidant therapy in the form of applying vitamins
C and E; and iv) symptomatic and supportive treatments, including
organ function support and correction of acid-base and electrolyte
imbalance.
Detection of urine paraquat
concentration
The PQ concentration in urine was detected using
colorimetric methods based on sodium hyposulfite (17). Under alkaline conditions, the sodium
hyposulfite deoxidizes PQ into blue-colored products. Based on the
change in color at different concentrations of PQ dichloride and
excess sodium hyposulfite under alkaline conditions, a standard
curve for determining PQ concentration was obtained and the PQ
concentration in the urine of patients was quantitatively
detected.
A total of 100 g sodium dithionite was added to
sodium hydroxide solution (2 ml; 2 M) and remained stable for
approximately 2 h. Urine samples were collected from patients in
colorless tubes and maintained at −20°C for 10 min, followed by
centrifugation at 9660 × g for 5 min at room temperature. A total
of 200 µl alkaline dithionite solution was added to 2 ml of the
pretreated urine. Following gentle mixing, 50 µl supernatant was
collected to measure the absorbance. Absorbance was measured at 395
nm and a working curve of concentration-absorbance was prepared.
Linear regression curve: y=0.0895x+0.0151, with a correlation
coefficient of r=0.9999 when the urine PQ concentration was 0.01 to
100 µg/ml. Recovery rate ranged from 92.5 to 104.0%, with relative
standard deviation (RSD) ranging from 2.7 to 4.5%, and the limit of
detection (LOD) was 0.01 µg/ml. According to the test sample and
above formula, the urine PQ concentration was calculated.
Statistical analysis
SPSS 18.0 software (SPSS, Inc., Chicago, IL, USA)
was used for statistical analysis. Measurement data were expressed
as the mean ± standard deviation, Student's t-test was applied to
detect inter-group comparisons, and χ2 test was
performed to detect enumeration data. Valuable detection indices
were screened out by logistic regression analysis and ROC curve
analysis and Kaplan-Meier curve was applied to evaluate their
diagnostic efficiency. P<0.05 was considered to indicate a
statistically significant difference.
Results
Comparisons of baseline
characteristics
The 194 patients were all poisoned with oral doses
of PQ. Within the 28-day follow-up period after poisoning, 114
patients succumbed to poisoining and 80 patients survived, with a
mortality rate of 58.8%. Dose of poison, arterial blood lactate,
initial urine PQ concentration and APACHE II score were all
significantly higher in the mortality group compared with the
survival group (all P<0.05). Additionally, no significant
difference in the comparisons of other indices, including but not
limited to mean arterial pressure, heart rate, respiratory
frequency and body temperature, were observed between the two
groups (all P>0.05; Table I).
 | Table I.Comparisons of all indexes between
survival and mortality groups. |
Table I.
Comparisons of all indexes between
survival and mortality groups.
| Characteristic | Survival group
(n=80) | Mortality group
(n=114) | t/χ2 | P-value |
|---|
| Age, years | 30.58±12.34 | 33.68±12.19 | 1.530 | 0.128 |
| Sex, N (%) |
|
| 1.511 | 0.223 |
| Male | 29 (32.58) | 43 (40.09) |
|
|
|
Female | 51 (67.42) | 71 (59.91) |
|
|
| Dose of poison,
ml | 30.72±15.14 | 72.52±31.42 | 12.31 |
<0.001a |
| Mean arterial
pressure, mmHg | 92.29±17.08 | 88.67±15.94 | 1.512 | 0.132 |
| Heart rate,
beats/min | 88.49±19.25 | 92.87±26.25 | 1.262 | 0.209 |
| Respiratory
frequency, breaths/min | 24.26±7.13 | 26.31±8.84 | 1.358 | 0.176 |
| Body temperature,
°C | 36.29±0.914 | 36.34±0.71 | 0.429 | 0.668 |
| White blood cells,
per 109/l | 12.30±4.39 | 13.65±5.22 | 1.891 | 0.060 |
| Hemoglobin, g/dl | 14.07±4.15 | 14.45±5.86 | 0.499 | 0.619 |
| Platelet, per
109/l | 243.77±89.32 | 251.04±101.74 | 0.515 | 0.607 |
| Alanine
aminotransferase, U/l | 44.74±25.89 | 52.04±30.03 | 1.760 | 0.080 |
| Total bilirubin,
µmol/l | 21.14±12.56 | 24.09±12.52 | 1.613 | 0.108 |
| Albumin, g/l | 37.97±9.82 | 36.26±10.70 | 0.158 | 0.248 |
| Serum amylase,
U/l | 90.65±42.66 | 97.52±46.22 | 1.052 | 0.294 |
| Serum lipase,
U/l | 101.14±38.27 | 112.63±58.14 | 1.659 | 0.099 |
| Urea nitrogen,
mmol/l | 7.69±3.79 | 8.40±4.64 | 1.129 | 0.260 |
| Creatinine,
µmol/l | 92.83 ±44.39 | 106.38±56.22 | 1.873 | 0.063 |
| Serum CK-MB
isoenzyme, U/l | 20.26 ±13.15 | 23.19±12.98 | 1.361 | 0.175 |
| Serum troponin I,
ng/ml | 0.23±0.14 | 0.27±0.19 | 1.688 | 0.093 |
| Blood glucose,
mmol/l | 9.70±5.41 | 10.79±5.84 | 1.319 | 0.189 |
| Serum potassium,
mmol/l | 4.24±1.39 | 3.94±2.05 | 1.138 | 0.257 |
| Serum sodium,
mmol/l | 140.35±41.95 | 137.96±40.86 | 0.397 | 0.692 |
| pH | 7.36±0.25 | 7.40±0.30 | 0.978 | 0.329 |
| PaO2,
mmHg | 94.87±33.03 | 97.70±40.66 | 0.515 | 0.607 |
| PaCO2,
mmHg | 32.86±10.24 | 30.41±7.8 | 1.804 | 0.073 |
|
HCO3−, mmol/l | 21.31±4.27 | 20.31±3.51 | 1.785 | 0.076 |
| Base excess,
mmol/l | −2.82±1.35 | −3.21±1.89 | 1.677 | 0.095 |
| Arterial blood
lactate, mmol/l | 1.50±0.97 | 2.90±1.21 | 8.925 |
<0.001a |
| C0,
µg/ml | 20.28±19.95 | 48.67±17.27 | 11.350 |
<0.001a |
| APACHE II | 8.74±6.16 | 11.98±7.02 | 3.326 |
<0.001a |
Logistic regression analysis
Logistic regression analysis was performed on the
independent variables that had statistical differences in single
factor analysis, suggesting that only dose of poison (OR, 1.081;
95% CI, 1.046–1.118; P<0.001), initial urine PQ concentration
(C0) (OR, 1.076; 95% CI, 1.038–1.115; P<0.001) and arterial
blood lactate (OR, 2.580; 95% CI, 1.462–4.556; P=0.001) were
associated with the risk of mortality from PQ poisoning (Table II).
| Table II.Logistic regression analysis for dose
of poison, initial concentration of paraquat in urine, arterial
blood lactate and APACHE II scores. |
Table II.
Logistic regression analysis for dose
of poison, initial concentration of paraquat in urine, arterial
blood lactate and APACHE II scores.
|
|
|
|
|
|
| 95% CI |
|---|
|
|
|
|
|
|
|
|
|---|
| Variable | B | S.E | Wals | P-value | Exp (B) | LL | UL |
|---|
| Dose of poison,
ml | 0.078 | 0.017 | 20.981 | <0.001 | 1.081 | 1.046 | 1.118 |
| Initial
concentration of paraquat in urine (C0), µg/ml | 0.073 | 0.018 | 16.023 | <0.001 | 1.076 | 1.038 | 1.115 |
| Arterial blood
lactate, mmol/l | 0.948 | 0.290 | 10.682 | 0.001 | 2.580 | 1.462 | 4.556 |
| APACHE II
scores | 0.054 | 0.044 | 1.472 | 0.225 | 1.055 | 0.967 | 1.151 |
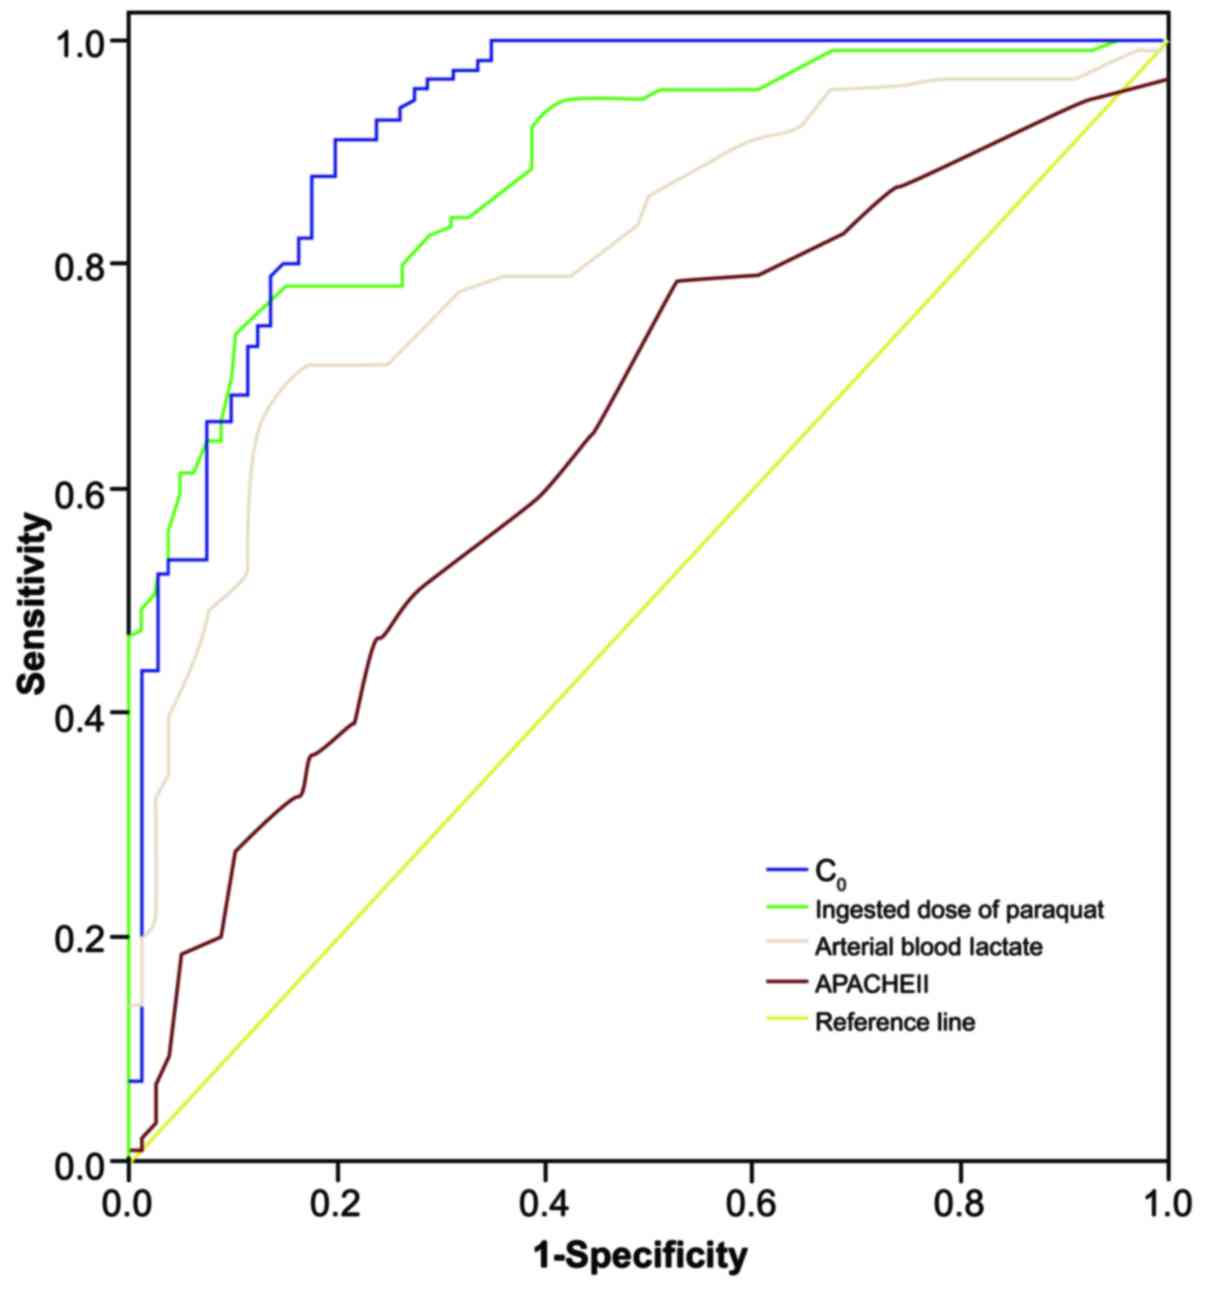
Receiver operating characteristic
curve analysis
Results of ROC curve analysis of dose of poison,
initial urine PQ concentration and arterial blood lactate in
predicting the mortality rate of patients within 28 days of
poisoning are presented in Table
III and Fig. 1. The area under
the curve (AUC) of initial urine PQ concentration (C0) was the
largest at 0.921, which has a relatively more accurate
discrimination for patient prognosis. The AUC of dose of poison and
arterial blood lactate were 0.887 and 0.808, respectively, and
their discrimination for the prognosis of acute PQ poisoning was
only second to initial urine PQ concentration (C0). The AUC of
APACHE II score was 0.648, suggesting it is relatively poor at
predicting the prognosis of acute PQ poisoning.
| Table III.ROC curve analysis for the initial
concentration of paraquat in urine, dose of poison, arterial blood
lactate and APACHE II scores in predicting fatality rate within 28
days. |
Table III.
ROC curve analysis for the initial
concentration of paraquat in urine, dose of poison, arterial blood
lactate and APACHE II scores in predicting fatality rate within 28
days.
| Variable | Area under ROC
curve | 95% CI | Cutoff value | Sensitivity
(%) | Specificity
(%) | Youden index |
|---|
| Initial
concentration of paraquat in urine | 0.921 | 0.880–0.961 | 32.20 | 91.20 | 80.00 | 0.712 |
| Dose of poison | 0.887 | 0.842–0.931 | 46.50 | 73.70 | 90.00 | 0.637 |
| Arterial blood
lactate | 0.808 | 0.747–0.869 | 2.45 | 69.28 | 75.01 | 0.543 |
| APACHE II | 0.648 | 0.570–0.726 | 6.50 | 78.11 | 47.52 | 0.256 |
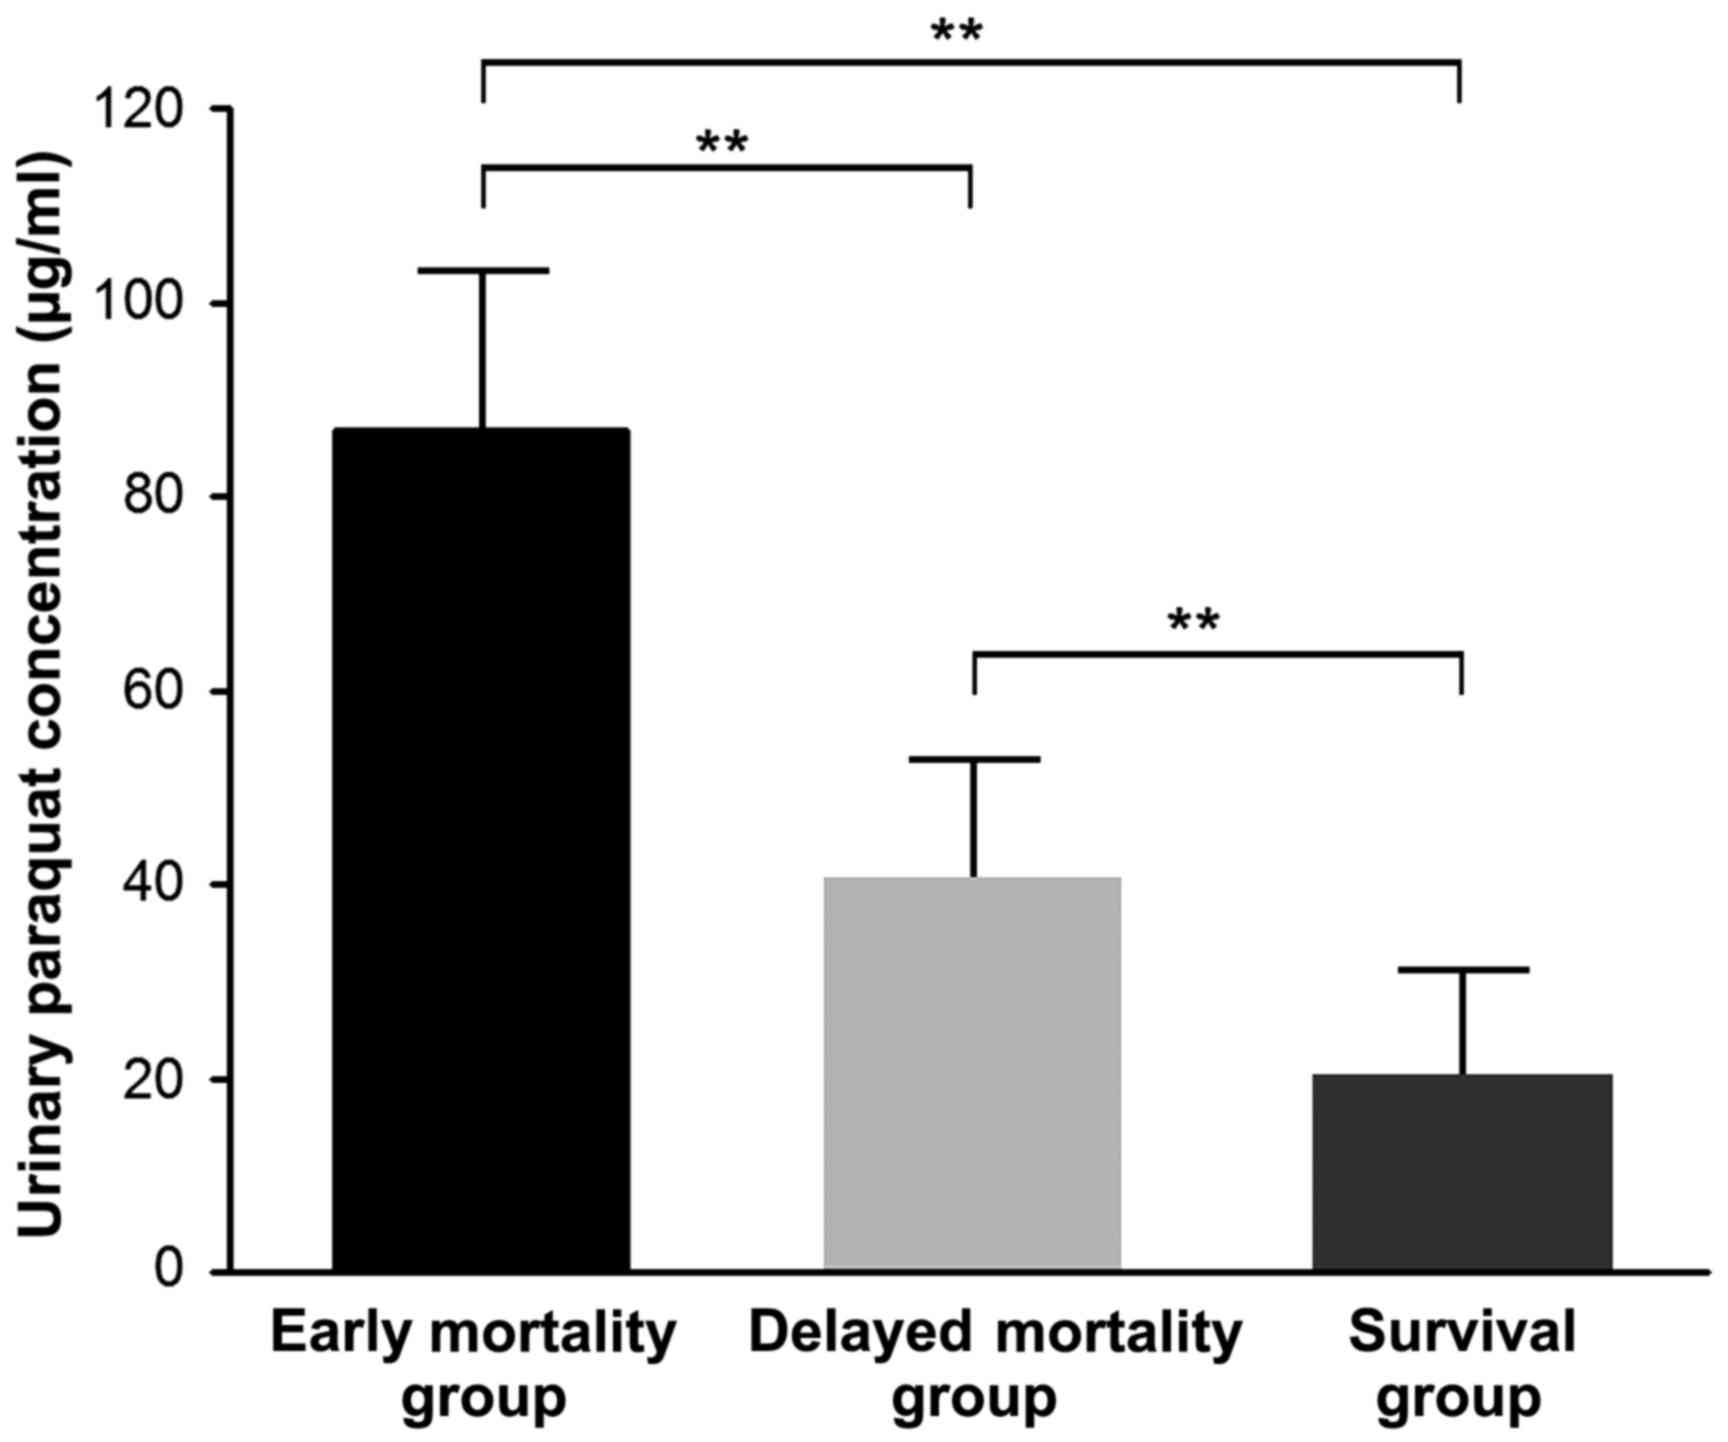
Among the 80 patients in the survival group and 114
in the mortality group, 20 patients died within 7 days of
poisoning, including 11 from sudden cardiac arrest and 9 from
multiple organ failure. The remaining 94 patients died within 7–28
days of poisoning, including 81 from refractory hypoxemic
respiratory failure (minimum value of arterial partial pressure of
oxygen, 27–46 mmHg; mean value, 38±16 mmHg) and 13 from multiple
organ failure. Initial urine PQ concentration of patients in the
early and delayed mortality groups was significantly higher than in
the survival group (all P<0.01), and initial urine PQ
concentration in early mortality group was significantly higher
compared with the delayed mortality group (86.73±16.62 vs.
40.57±12.36; t=3.808; P=0.001) (Fig.
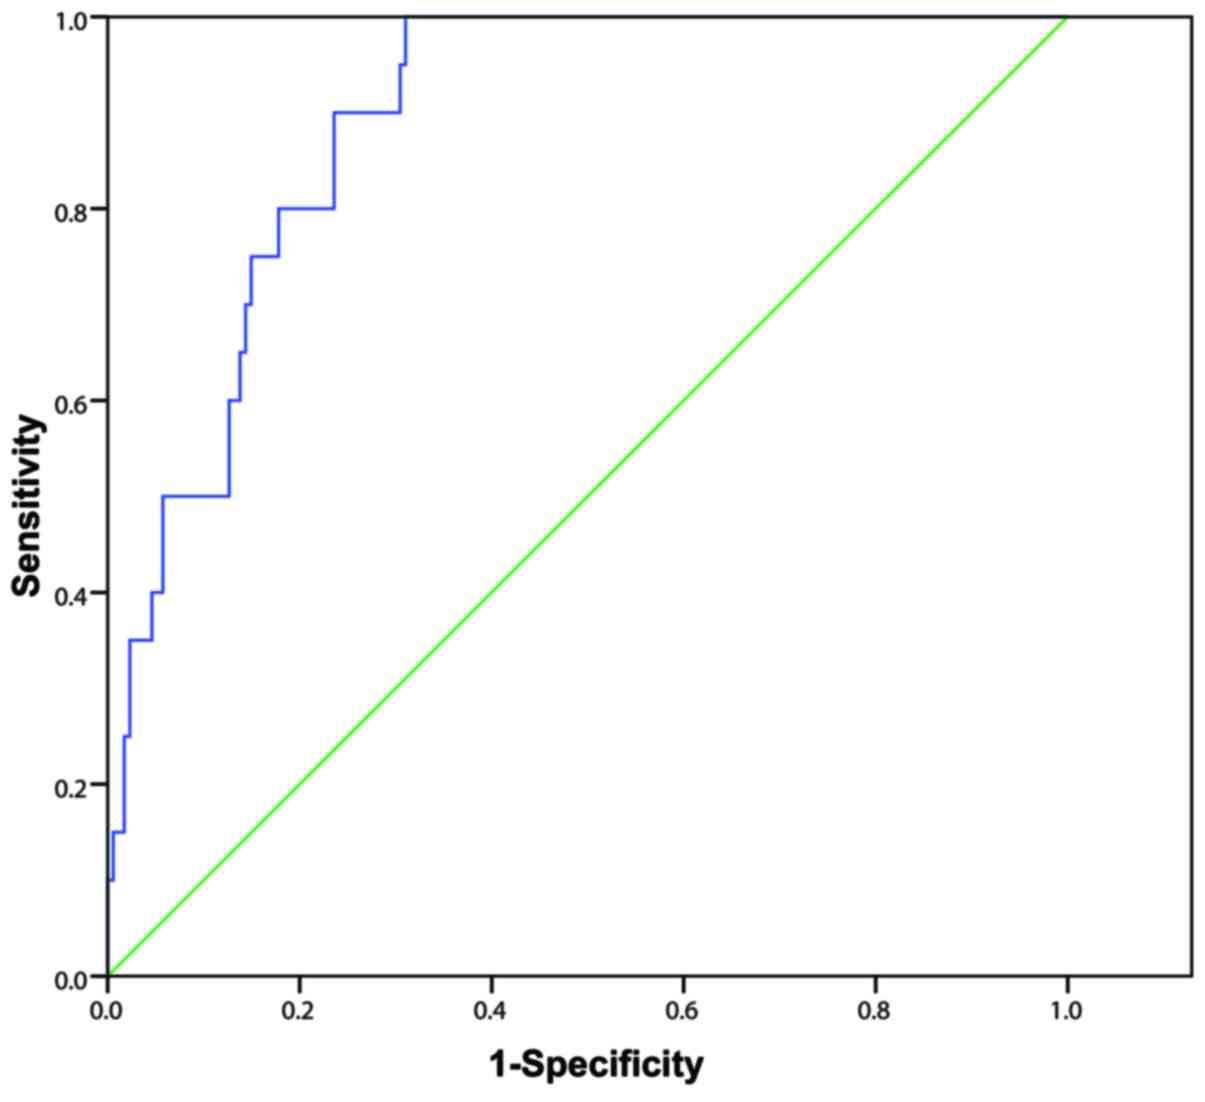
2). The AUC of the initial urine PQ concentration of patients
in predicting early mortality after poisoning was 0.890 (95% CI,
0.837–0.944) with a cutoff value of 49.3 µg/ml, sensitivity and
specificity values of 100.0 and 69.0%, respectively, and a Youden
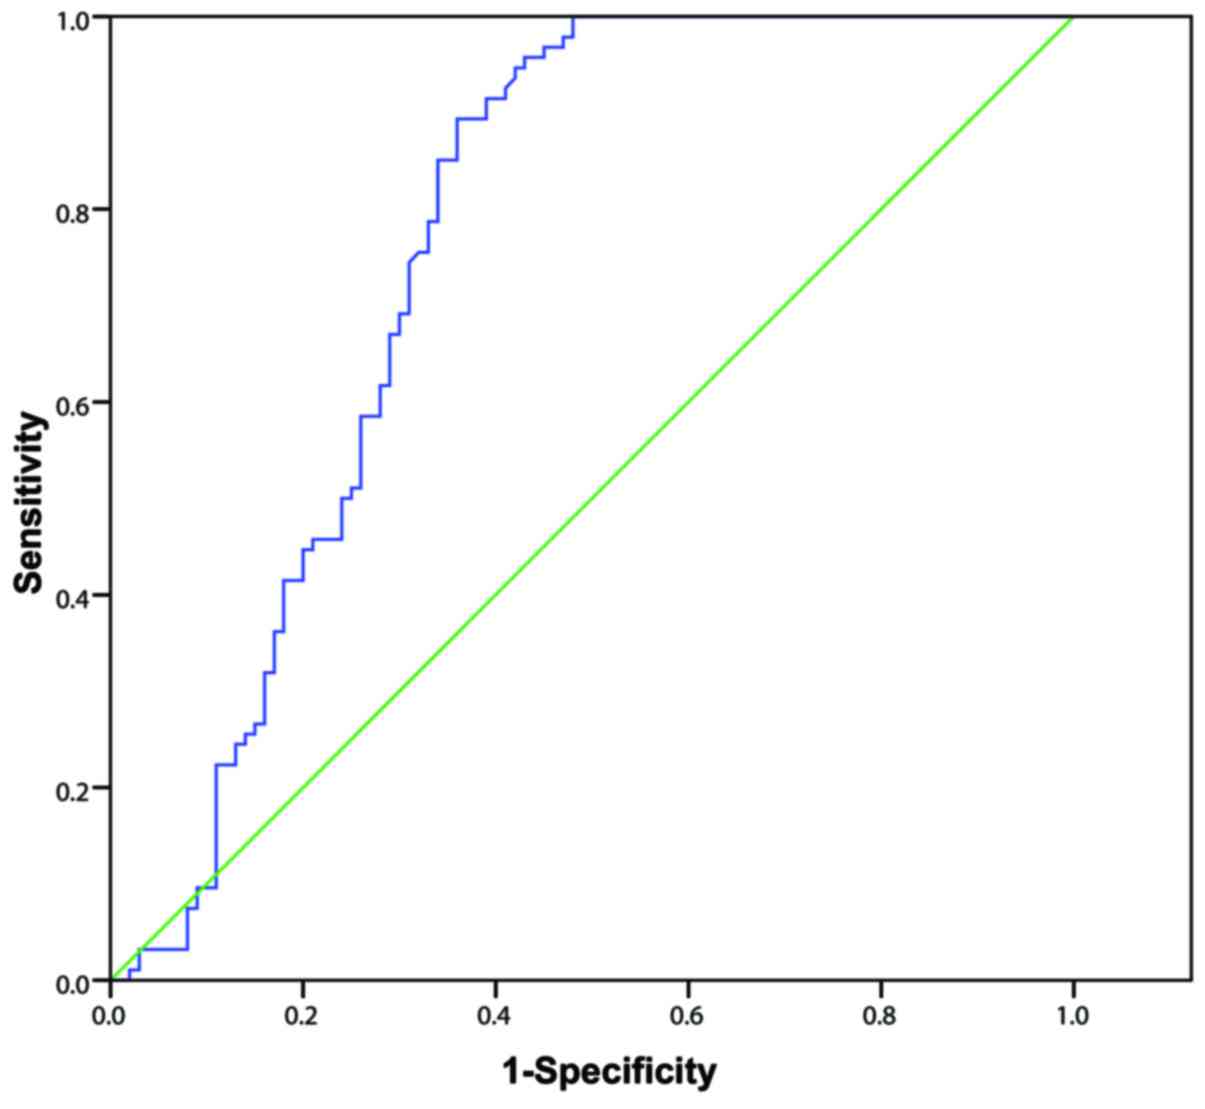
index score of 0.690 (Fig. 3). The
AUC of the initial urine PQ concentration of patients in predicting
delayed mortality was 0.764 (95% CI, 0.693–0.834) with a cutoff
value of 37.5 µg/ml, sensitivity and specificity values of 89.4 and
64.0%, respectively, and a Youden index score of 0.534 (Fig. 4). These findings indicate that the
efficacy of the initial urine PQ concentration in predicting early
mortality was higher when compared with delayed mortality.
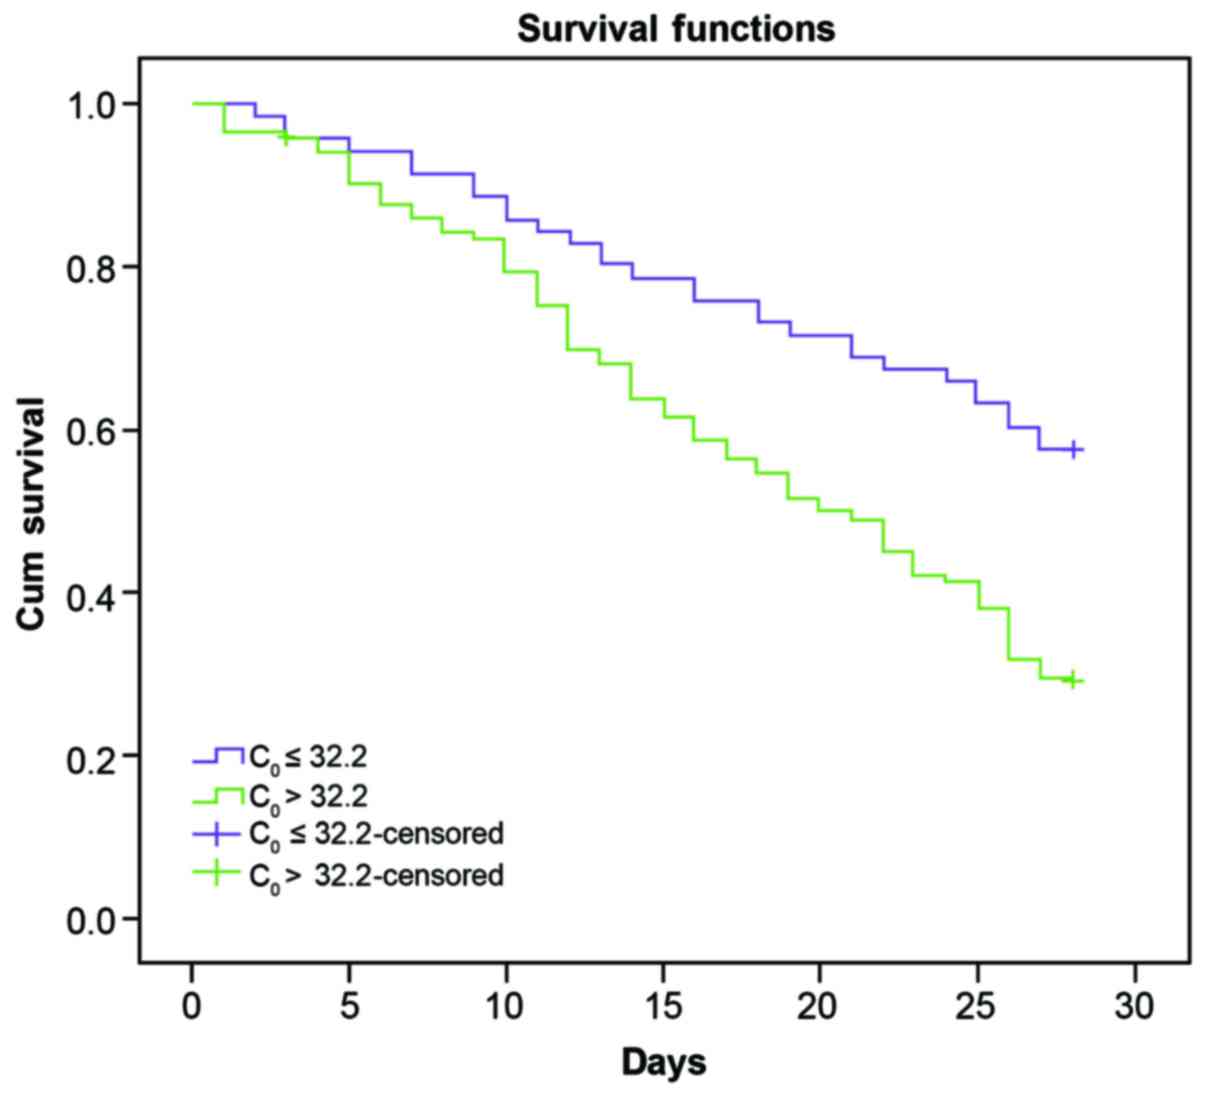
Prognostic value of urine paraquart
concentration
Patients were divided into two groups according to
the initial urine PQ concentration (C0, 32.2 µg/ml). During the
observation period (28-day follow-up after poisoning), the survival
rate of patients with C0 ≤32.2 µg/ml (42/71; 59.2%) was
significantly higher when compared with those with C0>32.2 µg/ml
(38/123; 30.9%; Fig. 5), suggesting
that C0 was an important index for predicting mortality rate in
patients within 28 days (OR: 14.33, 95% CI, 1.728–5.838;
χ2=14.33; P<0.001).
Rebound rate of urine paraquart
concentration after hemoperfusion
Selected patients received HP 2–5 times (3.7±2.2)
within 24 h after poisoning, among which 11 received HP 5 times,
123 received HP 4 times, 46 received HP 3 times and 14 received HP
2 times. Urine PQ concentration levels in patients who received HP
4 times within 24 h after poisoning was dynamically monitored. We
found that the average urine PQ concentration of patients in the
mortality and survival groups dropped to 1 µg/ml, but both
rebounded the next day to different degrees. On the day after
poisoning, urine PQ concentration in the mortality group was
significantly higher compared with the survival group
(t=2.232; P=0.036). The rebound rate in the mortality group
was also markedly higher compared with the survival group
(t=2.254; P=0.022; Table
IV).
| Table IV.Changes in urine paraquat
concentration before and after blood perfusion in patients with
acute paraquat poisoning. |
Table IV.
Changes in urine paraquat
concentration before and after blood perfusion in patients with
acute paraquat poisoning.
| Urine paraquat
concentration (µg/ml) | C0 | C1 | C4 |
Csec | Rebound rate
(%) |
|---|
| Mortality group
(n=72) |
48.67±17.27a |
16.29±6.97a,b |
0.66±0.32a,b |
0.94±0.38a,b |
39.80±28.56a |
| Survival group
(n=51) | 20.28±19.95 |
12.44±6.06b |
0.25±0.13b |
0.28±0.16b | 13.71±18.97 |
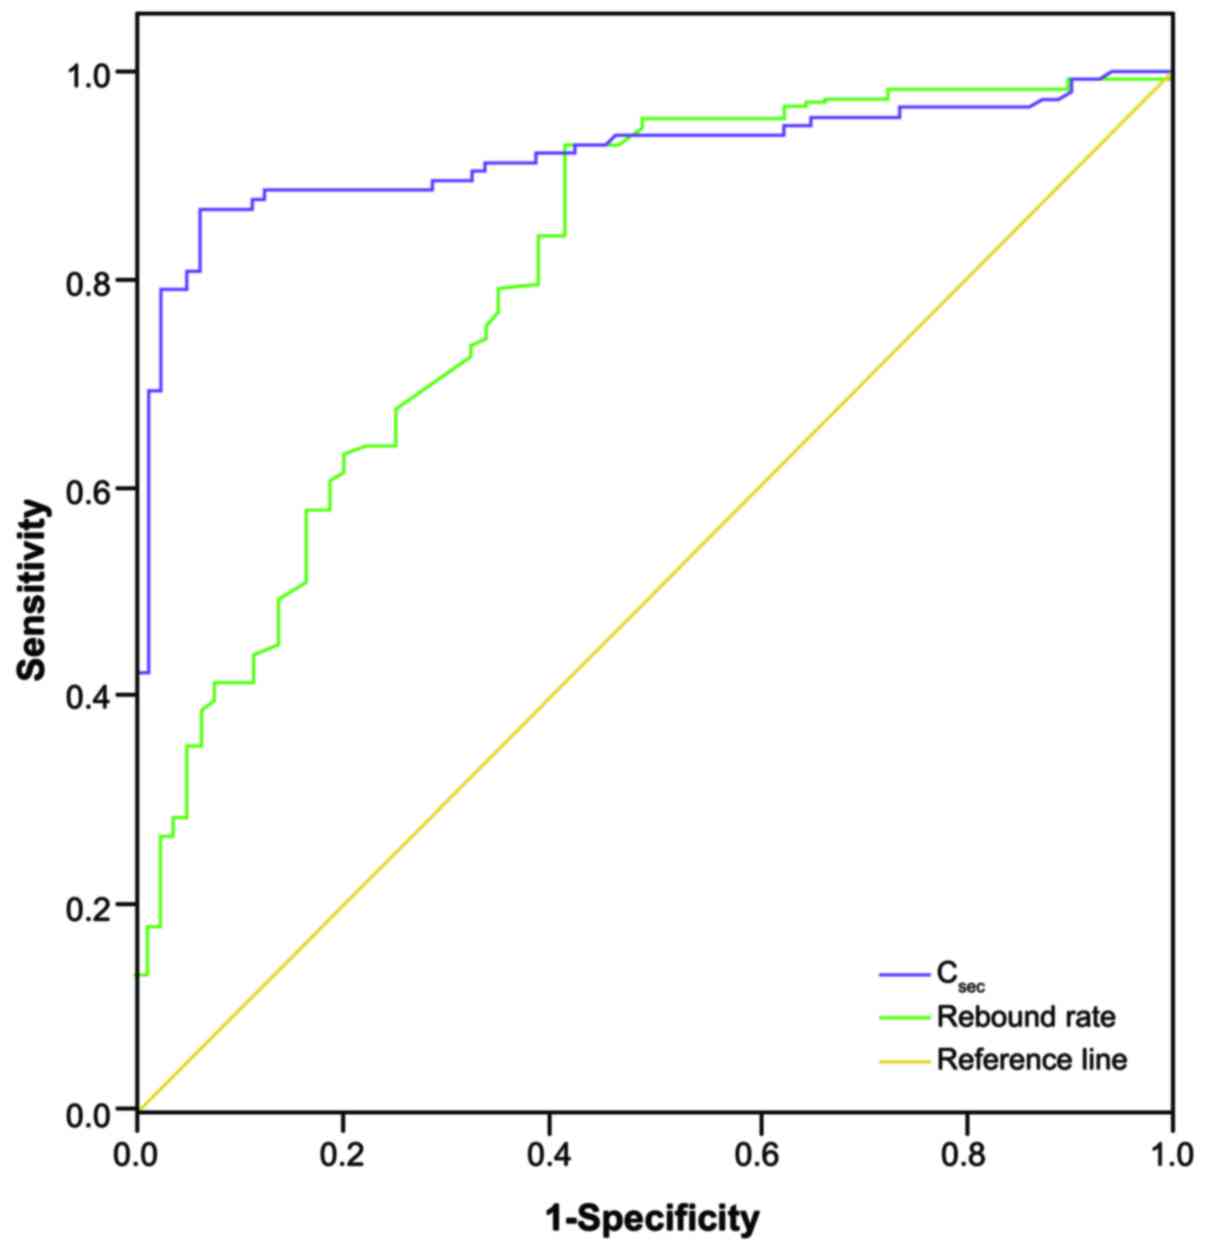
In the 123 patients that received HP 4 times within
24 h of poisoning, the area under the ROC curve of urine PQ
concentration on the day after HP (Csec) in predicting
the mortality rate within 28 days was 0.919 (95% CI, 0.878–0.960;
P<0.001). The area under the ROC curve of the rebound rate of
urine PQ concentration on the next day in predicting mortality rate
within 28 days was 0.805 (95% CI, 0.742–0.867; P<0.001; Fig. 6).
Discussion
This study investigated the efficacy of urine PQ
concentration, dose of poison, arterial blood lactate and APACHE II
scoring in predicting the prognosis of patients with acute PQ
poisoning. By comparing indices between the survival and mortality
groups, we found that initial urine PQ concentration, dose of
poison, arterial blood lactate and the APACHE II score of patients
in the mortality group were all significantly higher compared with
the survival group, suggesting that all four indices were able to
predict the prognosis of patients with acute PQ poisoning to some
extent, compared with other indices, such as arterial pressure,
heart rate and serum potassium. Consistent with our results, Ruan
et al (7) reported that the
PQ concentration in urine served as an invaluable predictive index
for the prognosis of patients in acute PQ poisoning and, in another
study, urine PQ concentrations reflected the severity of acute PQ
poisoning (18). PQ can cause acute
tubular necrosis and therefore lead to renal failure at high doses
(19). However, if patients ingest
<40 mg/kg PQ, renal damage is reversible and the mortality rate
is lower compared with patients who have ingested higher doses of
PQ (20). Consequently, dose of PQ
is a stable index for predicting the prognosis of patients with
acute PQ poisoning. APACHE II is a severity-of-disease
classification system applied within 24 h of admission of a patient
to the Intensive Care Unit (12). It
has also been used as a proxy indicator to reflect the intermediate
effect of PQ poisoning dose and the severity of PQ intoxication
responses (21). An integer score
from 0 to 71 is computed based on several measurements. The higher
scores correspond to more severe disease and a higher risk of
mortality. Consistent with our results, Chang et al
(22) revealed that APACHE II scores
>9 had a sensitivity of 64% and a specificity of 88% in
predicting 30-day mortality in acute PQ-poisoned patients. PQ
produces reactive oxygen species, which have a leading role in
causing multiple organ failure and the elevated lactate
concentration in the serum is a manifestation of the underlying
organ dysfunction (13). Our results
further support the predictive power of arterial blood lactate in
evaluating the prognosis of patients with acute PQ poisoning.
Consistent with our study outcomes, Lee et al (9) also revealed that arterial lactate
measurement provides useful information for patients with acute PQ
poisoning and may potentially lead to improved decision making.
In the present study, multiple factor logistic
regression analysis revealed that only dose of poison, initial
urine PQ concentration (C0) and arterial blood lactate
were associated with the risk of mortality from PQ poisoning,
suggesting that, compared with APACHE II scoring, dose of poison,
initial urine PQ concentration and arterial blood lactate were more
sensitive in predicting the mortality risk of PQ poisoning.
However, in direct contrast with our results, a study by Huang
et al (21), showed that an
APACHE II score of >13, calculated 24 h after admission,
predicted in-hospital mortality with relatively high sensitivity
(67%) and specificity (94%) and concluded that the APACHE II system
yielded superior discriminative power than plasma PQ concentration
or estimated PQ ingestion dosage. Limitations of the APACHE II
system, including reduced applicability in patients with more
severe disease, may contribute to this difference (21). and APACHE II scoring does not include
parameters reflecting liver damage, which is a major complication
in PQ poisoning (15). Therefore,
evaluation of APACHE II score is complex and not advisable for
typical hospital inpatients (20).
ROC curve analysis ranked the accuracy of the three
indices as follows: Initial urine PQ concentration with the best
accuracy, dose of poison, and arterial blood lactate. Though
arterial blood lactate is a useful index in predicting the
prognosis of acute PQ poisoning patients, determination of the
circulating levels of lactate is more practical and technically
simpler, is frequently used, and is a clinically available
technique with a rapid turnaround (23). Initial urine PQ concentrations, and a
comparison of urine PQ concentrations associated with patient
survival, in the early and delayed mortality groups suggested that
the initial urine PQ concentration of patients in the early and
delayed mortality groups was significantly higher compared with the
survival group. Notably, initial urine PQ concentration in the
early mortality group was also significantly higher compared with
the delayed mortality group. ROC curve analysis suggested that the
efficacy of initial urine PQ concentration in predicting early
mortality was higher than its efficiency in predicting delayed
mortality. The survival rate of patients with C0≤32.2
µg/ml was significantly higher when compared with patients
exhibiting C0>32.2 µg/ml, suggesting that
C0 is an important index for predicting mortality rate
within the 28-day period. In addition, the rebound rate of PQ
concentration in the mortality group was also markedly higher when
compared with the survival group, suggesting that the rebound rate
may be an important risk factor for fatality from acute PQ
poisoning and may have a predictive role in the prognosis of
patients with acute PQ poisoning.
In conclusion, the initial urine PQ concentration
may be the optimal index for predicting the prognosis of patients
with acute PQ poisoning. Additionally, dose of poison, arterial
blood lactate, Csec and the rebound rate also have has
some referential significance. In view of the relatively small
sample size, the results of this study will need to be confirmed in
future studies that involve larger sample sizes.
References
|
1
|
Sun IO and Lee KY: Cyclophosphamide dose:
How much is needed to win the war against paraquat poisoning?
Korean J Intern Med. 28:410–412. 2013. View Article : Google Scholar : PubMed/NCBI
|
|
2
|
Liu XW, Ma T, Qu B, Ji Y and Liu Z:
Prognostic value of initial arterial lactate level and lactate
metabolic clearance rate in patients with acute paraquat poisoning.
Am J Emerg Med. 31:1230–1235. 2013. View Article : Google Scholar : PubMed/NCBI
|
|
3
|
Wunnapuk K, Mohammed F, Gawarammana I, Liu
X, Verbeeck RK, Buckley NA, Roberts MS and Musuamba FT: Prediction
of paraquat exposure and toxicity in clinically ill poisoned
patients: A model based approach. Br J Clin Pharmacol. 78:855–866.
2014. View Article : Google Scholar : PubMed/NCBI
|
|
4
|
Dinis-Oliveira RJ, Duarte JA,
Sánchez-Navarro A, Remião F, Bastos ML and Carvalho F: Paraquat
poisonings: Mechanisms of lung toxicity, clinical features, and
treatment. Crit Rev Toxicol. 38:13–71. 2008. View Article : Google Scholar : PubMed/NCBI
|
|
5
|
Wu B, Song B, Yang H, Huang B, Chi B, Guo
Y and Liu H: Central nervous system damage due to acute paraquat
poisoning: An experimental study with rat model. Neurotoxicology.
35:62–70. 2013. View Article : Google Scholar : PubMed/NCBI
|
|
6
|
Liu Z, Zhao H, Liu W, Li T, Wang Y and
Zhao M: NLRP3 inflammasome activation is essential for
paraquat-induced acute lung injury. Inflammation. 38:433–444. 2015.
View Article : Google Scholar : PubMed/NCBI
|
|
7
|
Ruan XL, Qiu JJ, Wu C, Huang T, Meng RB
and Lai YQ: Magnetic single-walled carbon nanotubes-dispersive
solid-phase extraction method combined with liquid
chromatography-tandem mass spectrometry for the determination of
paraquat in urine. J Chromatogr B Analyt Technol Biomed Life Sci.
965:85–90. 2014. View Article : Google Scholar : PubMed/NCBI
|
|
8
|
Yeo CD, Kim JW, Kim YO, Yoon SA, Kim KH
and Kim YS: The role of pentraxin-3 as a prognostic biomarker in
paraquat poisoning. Toxicol Lett. 212:157–160. 2012. View Article : Google Scholar : PubMed/NCBI
|
|
9
|
Lee Y, Lee JH, Seong AJ, Hong CK, Lee HJ,
Shin DH and Hwang SY: Arterial lactate as a predictor of mortality
in emergency department patients with paraquat intoxication. Clin
Toxicol (Phila). 50:52–56. 2012. View Article : Google Scholar : PubMed/NCBI
|
|
10
|
Seok S, Kim YH, Gil HW, Song HY and Hong
SY: The time between paraquat ingestion and a negative dithionite
urine test in an independent risk factor for death and organ
failure in acute paraquat intoxication. J Korean Med Sci.
27:993–998. 2012. View Article : Google Scholar : PubMed/NCBI
|
|
11
|
Gil HW, Kang MS, Yang JO, Lee EY and Hong
SY: Association between plasma paraquat level and outcome of
paraquat poisoning in 375 paraquat poisoning patients. Clin Toxicol
(Phila). 46:515–518. 2008. View Article : Google Scholar : PubMed/NCBI
|
|
12
|
Hassanian-Moghaddam H, Amiri H, Zamani N,
Rahimi M, Shadnia S and Taherkhani M: QT dispersion and
prognostication of the outcome in acute cardiotoxicities: A
comparison with SAPS II and APACHE II scoring systems. Cardiovasc
Toxicol. 14:129–133. 2014. View Article : Google Scholar : PubMed/NCBI
|
|
13
|
Mikkelsen ME, Miltiades AN, Gaieski DF,
Goyal M, Fuchs BD, Shah CV, Bellamy SL and Christie JD: Serum
lactate is associated with mortality in severe sepsis independent
of organ failure and shock. Crit Care Med. 37:1670–1677. 2009.
View Article : Google Scholar : PubMed/NCBI
|
|
14
|
Weil MH and Tang W: Clinical correlates of
arterial lactate levels in STEMI patients. Crit Care. 15:1132011.
View Article : Google Scholar : PubMed/NCBI
|
|
15
|
Yang CJ, Lin JL, Lin-Tan DT, Weng CH, Hsu
CW, Lee SY, Lee SH, Chang CM, Lin WR and Yen TH: Spectrum of toxic
hepatitis following intentional paraquat ingestion: Analysis of 187
cases. Liver Int. 32:1400–1406. 2012. View Article : Google Scholar : PubMed/NCBI
|
|
16
|
M PN: World Medical Association publishes
the Revised Declaration of Helsinki. Natl Med J India.
27:562014.PubMed/NCBI
|
|
17
|
Berry DJ and Grove J: The determination of
paraquat (I,I'-dimethyl-4,4′-bipyridylium cation) in urine. Clin
Chim Acta. 34:5–11. 1971. View Article : Google Scholar : PubMed/NCBI
|
|
18
|
Liu Z, Liu D, Zhang X, Wang H and Hao F:
Prognosis value of urine paraquat semi-quantitative in the patients
with acute paraquat poisoning. Chinese Journal of Industrial
Hygiene and Occupational Diseases. 32:378–380. 2014.(In Chinese).
PubMed/NCBI
|
|
19
|
Singh AP, Junemann A, Muthuraman A, Jaggi
AS, Singh N, Grover K and Dhawan R: Animal models of acute renal
failure. Pharmacol Rep. 64:31–44. 2012. View Article : Google Scholar : PubMed/NCBI
|
|
20
|
Weng CH, Hu CC, Lin JL, Lin-Tan DT, Huang
WH, Hsu CW and Yen TH: Sequential organ failure assessment score
can predict mortality in patients with paraquat intoxication. PLoS
One. 7:e517432012. View Article : Google Scholar : PubMed/NCBI
|
|
21
|
Huang NC, Hung YM, Lin SL, Wann SR, Hsu
CW, Ger LP, Hung SY, Chung HM and Yeh JH: Further evidence of the
usefulness of acute physiology and chronic health evaluation II
scoring system in acute paraquat poisoning. Clin Toxicol (Phila).
44:99–102. 2006. View Article : Google Scholar : PubMed/NCBI
|
|
22
|
Chang MW, Chang SS, Lee CC, Sheu BF and
Young YR: Hypokalemia and hypothermia are associated with 30-day
mortality in patients with acute paraquat poisoning. Am J Med Sci.
335:451–456. 2008. View Article : Google Scholar : PubMed/NCBI
|
|
23
|
Howell MD, Donnino M, Clardy P, Talmor D
and Shapiro NI: Occult hypoperfusion and mortality in patients with
suspected infection. Intensive Care Med. 33:1892–1899. 2007.
View Article : Google Scholar : PubMed/NCBI
|