Introduction
Obesity is a medical condition in which excess body
fat has accumulated to a certain degree, and affected individuals
may have a reduced life expectancy and increased health problems
(1). Child obesity is becoming a
health problem in developed and developing countries (2,3). Obesity
is caused by a combination of genetic, behavioral, social,
cultural, metabolic and physiological factors (4). Child obesity increases the likelihood
of certain diseases, such as hyperlipidemia, insulin resistance and
hypertension (5). The physiological
mechanisms associated with obesity have been investigated in-depth
(6), but certain key molecular
mechanisms involved in obesity have remained to be identified.
Previous studies have determined certain
pathological mechanisms associated with obesity. One study
indicated that body fat and weight were inversely associated with
25-hydroxyvitamin D levels and volumetric dilution may explain for
the low vitamin D levels in obese individuals (7). It also has been suggested that a
high-fat diet accelerated obesity via the Toll-like receptor 4
signaling pathway (8). In addition,
leptin-melanocortin signaling is a key pathway in regulating food
intake and body weight, and mutation of ligands or receptors in
this pathway may cause obesity (9).
Iodothyronine deiodinase type 2 has a role in the progression of
obesity via the c-Jun N-terminal kinase (JNK) signaling pathway
(10). Activation of the adenosine
monophosphate-activated protein kinase signaling pathway has been
reported to prevent obesity (11).
Furthermore, Vohl et al (12)
reported that 216 and 131 genes were overexpressed in visceral fat
and subcutaneous adipose tissues, respectively. Linder et al
(13) reported that several genes,
including the phospholipid transfer gene, ras, adipsin and
calcyclin were differentially expressed in adipose tissue of male
or female patients. In addition, two previous studies indicated
that variation in the fat mass and obesity-associated gene was
associated with childhood obesity and severe adult obesity
(14,15). However, to the best of our knowledge,
few articles have reported the genes or pathways of childhood
obesity alone. Therefore, further significant genes or pathways
associated with child obesity are required to be identified.
The microarray data of GSE29718 have been previously
used to reveal the links between type 2 diabetes and obesity
(16) or used to detect molecular
mechanisms for the association between obesity and colorectal
cancer (17). The present study
identified the differentially expressed genes (DEGs) in obese
children compared with those in lean children based on the
microarray data of GSE29718. Functional enrichment analyses of DEGs
were then performed. In addition, a protein-protein interaction
(PPI) network was established and important genes associated with
obesity were analyzed. The present study aimed to identify critical
genes or pathways associated with child obesity and explored
possible underlying molecular mechanisms.
Materials and methods
Affymetrix microarray data
The array dataset GSE29718 deposited by Tam et
al (18) was downloaded from the
Gene Expression Omnibus database (http://www.ncbi.nlm.nih.gov/geo/). The dataset
contained 5 visceral adipose tissue samples and 15 subcutaneous
adipose tissue samples from children. Only the subcutaneous adipose
tissue samples derived from 7 obese and 8 lean children were used
for the subsequently analysis. The array data were based on the
GPL6244 Affymetrix Human Gene 1.0 ST Array platform, transcript
(gene) version (Affymetrix Inc., Santa Clara, CA, USA).
Data pre-processing
The raw data were pre-processed by the robust
multiarray average (19) algorithm
with the use of oligo (20) in the R
software of Bioconductor (Seattle, Washington). The process of
pre-processing included background correction, normalization and
calculation of gene expression. Finally, a total of 18,977 gene
expression values was obtained.
DEG analysis
The DEGs in samples from obese children compared
with those from lean children were analyzed by the limma package
(21) in Bioconductor. The P-values
of the DEGs were calculated by using the unpaired Student's t-test
(22) in the limma package in the
process of analysis. |log2FC|≥0.4 and P<0.05 were set
as cut-off criteria.
Gene ontology (GO) and pathway
enrichment analyses
GO includes 3 categories, namely molecular function,
biological processes (BP) and cellular components, and is a tool
used for gene annotation by using a defined, structured and
controlled vocabulary (23). The
Kyoto Encyclopedia of Genes and Genomes (KEGG) is a database used
to assign sets of DEGs to specific pathways (24). Reactome is a database used for
forging a link between metabolome and genome (25).
Up and downregulated genes were subjected to GO
annotation as well as KEGG and Reactome pathway enrichment
analyses. P<0.05 was used as the threshold value, and the number
of genes enriched in each pathway was ≥2.
PPI network analysis
The Search Tool for the Retrieval of Interacting
Genes (STRING) (26) can be used to
provide information regarding predicted and experimental
interactions of proteins and the prediction method of this database
is from neighborhood, gene fusion, co-occurrence, co-expression
experiments, databases and textmining. The DEGs were mapped into
PPIs and a combined score of >0.4 was set as a threshold value
in this study. PPI networks were constructed with Cytoscape
software (27). Moreover, the nodes
with higher degrees of interaction were considered as hub
nodes.
The association among nodes with a higher degree of
interaction in the network and the associated biological functions
were analyzed by literature mining. GenCLiP 2.0 (28) (http://ci.smu.edu.cn/GenCLiP2.0/confirm_keywords.php)
is an online tool used for the literature mining analysis of human
genes and networks. Hub gene sets obtained from the PPI network
were used as input gene sets. Based on the user-defined query
terms, the Literature Mining Gene Networks module can construct
gene networks, generate sub-networks and calculate the likelihood
of the networks' random occurrence using random simulation
(29). In order to annotate the
input genes, Gene Cluster with Literature Profiles module can
generate statistically over-represented keywords. The keywords
grouped by a fuzzy algorithm can be provided by the user or are
generated according to occurrence of free terms in the literature
on the respective gene. The relevant Medline abstracts
(co-occurrence of genes and keywords are highlighted) are linked
via the associations between genes and keywords. The co-citation
network of key genes in the literature was analyzed using the
‘Literature Mining Gene Networks’ module in GenCLiP to analyze hot
associated genes in a literature research. Subsequently, the
associated biological function of these hot genes by ‘Gene Cluster
with Literature Profiles’ modules with P≤ 1×10⁻⁶ and hit
≥6.
Analyses of important genes and
transcription factors associated with obesity
The comparative toxicogenomics database (CTD)
(30) is a tool used to formalize,
harmonize and centralize data of genes and proteins across
different species. The present study assessed whether any of the
marker genes among the DEGs identified had been previously listed
as markers of obesity in the CTD database. ‘Obesity’ was used as an
input key word in CTD. Subsequently, the cytoscape plugin iRegulon
(31) was used to analyze
transcription factors regulating marker genes. iRegulon uses
cis-regulatory sequence analysis to reverse-engineer the
transcriptional regulatory network underlying a co-expressed gene
set. It integrates the transcription factor information from
databases such as Transfac, Jaspar, Encode, Swissregulon and Homer,
and detects enriched transcription factor motifs and optimal sets
of their direct targets by means of genome-wide ranking and
recovery. Parameter settings were as follows: Minimum identity
between orthologous genes=0.05 and maximum false discovery rate on
motif similarity=0.001. The Normalized Enrichment Score (NES) was
the output result. The higher the scores were, the more reliable
the results were. Transcription factors and target gene pairs with
NES>5 were selected.
Results
DEG analysis
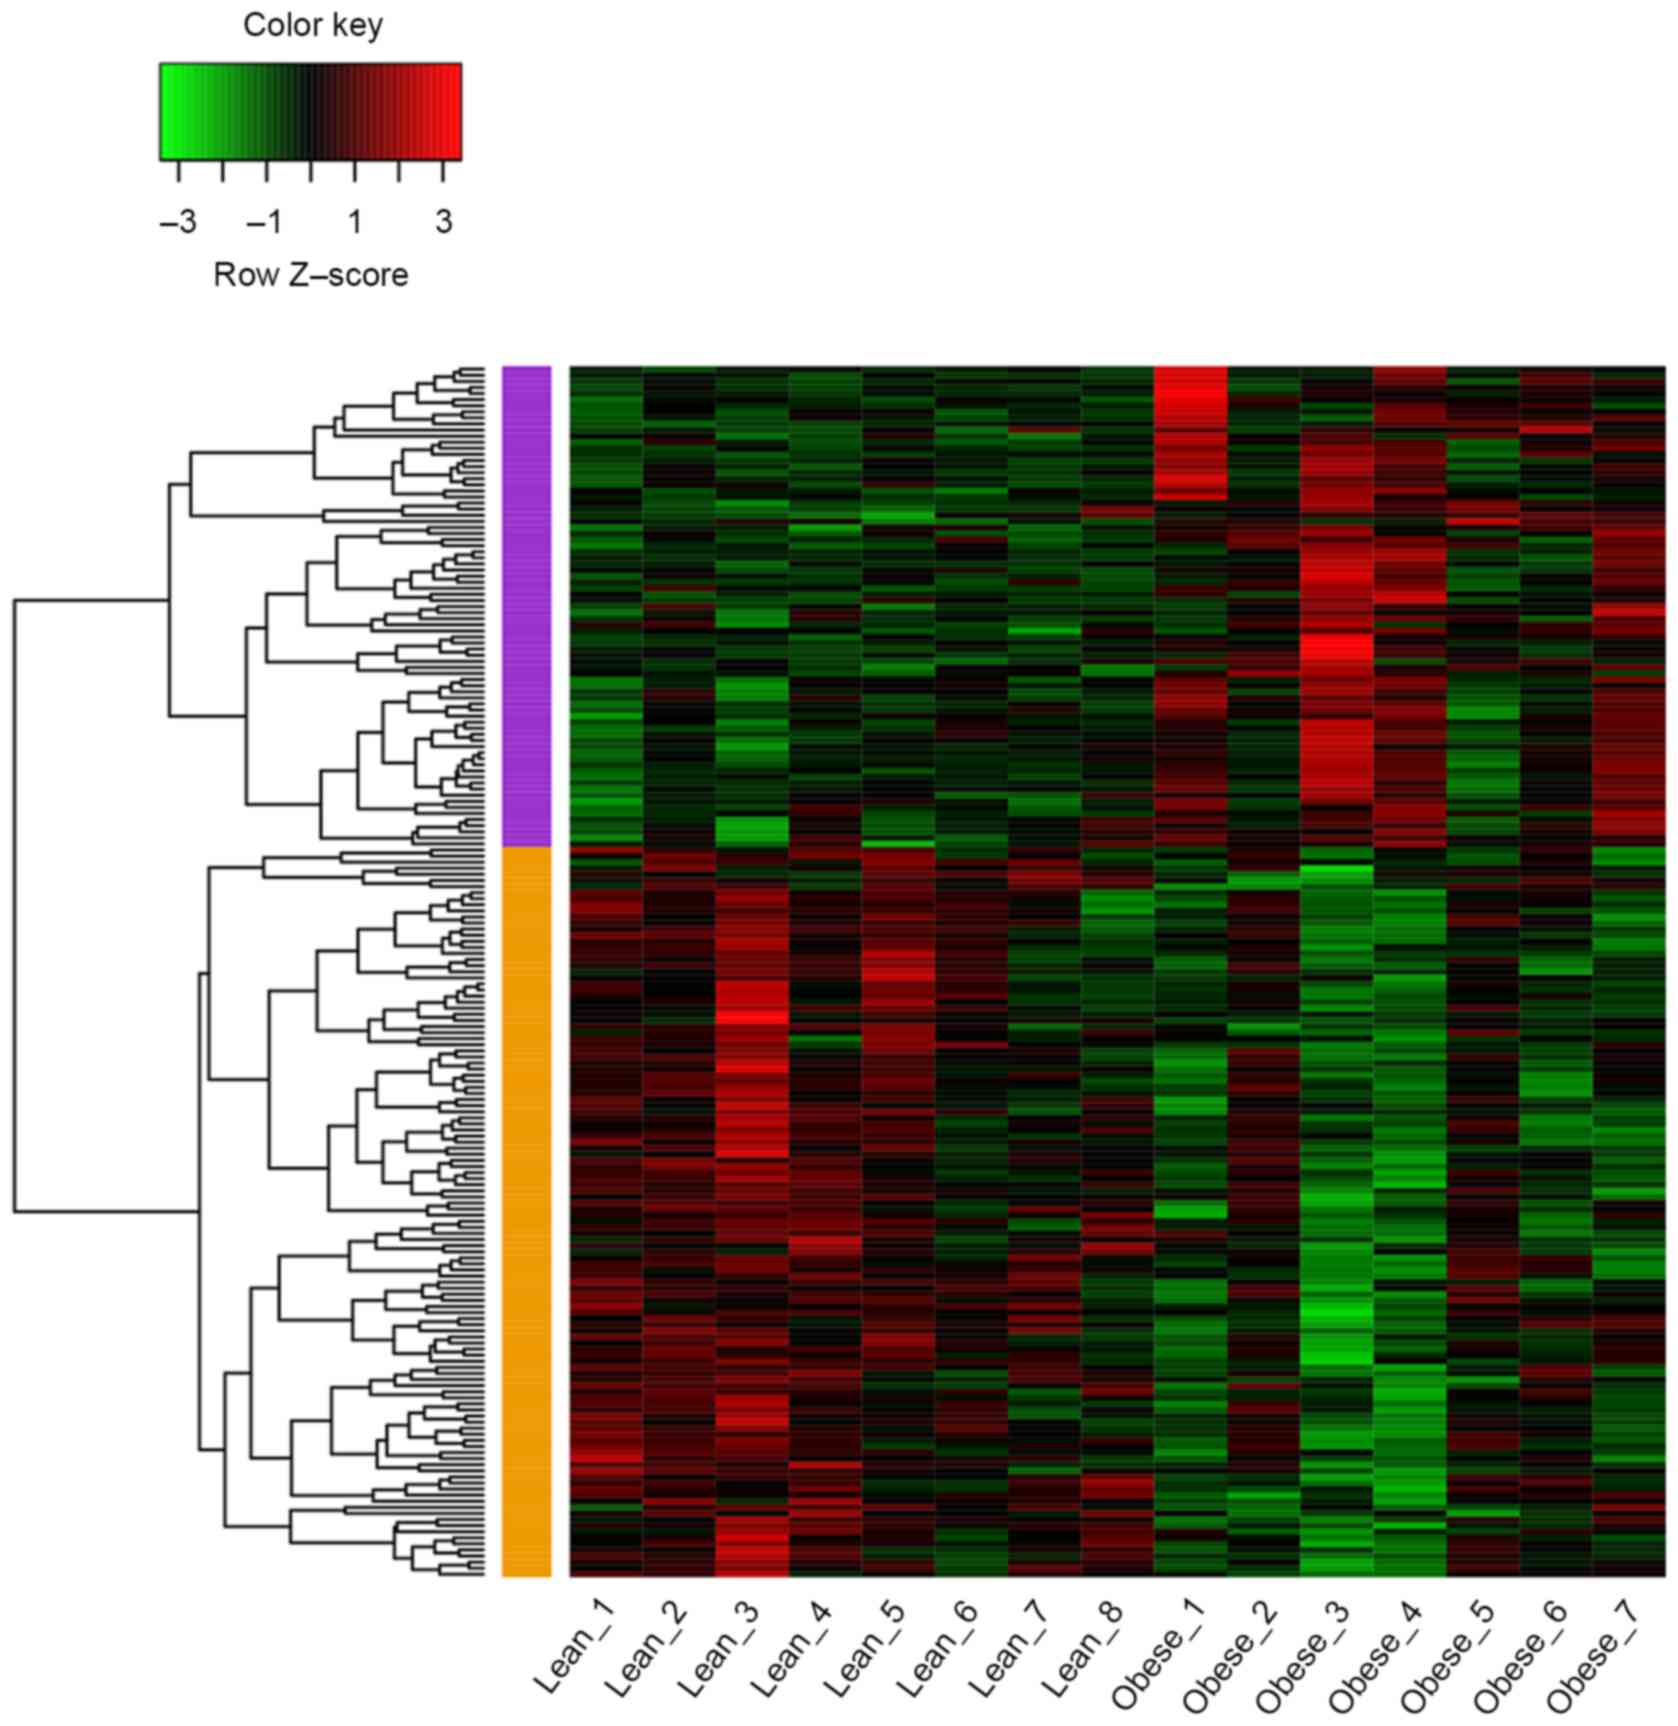
As shown in Fig. 1, a
total of 199 DEGs (79 up and 120 downregulated genes) were
identified in samples from obese children compared with those from
lean children with P<0.05 and |log2FC|≥0.4. The
average log2FC of upregulated genes was 0.585 and that
of downregulated genes was −0.558.
GO and pathway enrichment
analyses
GO, KEGG pathway and Reactome pathway analyses were
performed for up and downregulated DEGs. Upregulated DEGs were
mainly enriched in the GO terms of extracellular space, immune
response and immune system process (Table I). In addition, matrix
metalloproteinases 9 (MMP9) was significantly enriched in pathways
of immune system processes. The downregulated DEGs were mainly
associated with the regulation of system process and cyclic
guanosine monophosphate (cGMP)-inhibited cyclic nucleotide
(Table I).
 | Table I.GO analysis of differentially
expressed genes (P<0.05). |
Table I.
GO analysis of differentially
expressed genes (P<0.05).
| GO ID | Term | No. of genes | P-value |
|---|
| Upregulated
genes |
| GO-BP
terms |
|
|
|
|
GO:0006955 | Immune
response | 25 | 2.25×10⁻¹⁰ |
|
GO:0002376 | Immune system
process | 31 | 6.67×10⁻¹⁰ |
|
GO:0006954 | Inflammatory
response | 15 | 1.57×10⁻⁸ |
|
GO:0009605 | Response to
external stimulus | 27 | 2.20×10⁻⁸ |
|
GO:0006952 | Defense
response | 23 | 2.41×10⁻⁸ |
| GO-CC
terms |
|
|
|
|
GO:0005615 | Extracellular
space | 21 | 1.26×10⁻⁸ |
|
GO:0005576 | Extracellular
region | 36 | 4.13×10⁻⁶ |
|
GO:0044421 | Extracellular
region part | 32 | 5.06×10⁻⁶ |
|
GO:0005578 | Proteinaceous
extracellular matrix | 7 | 4.62×10⁻⁴ |
|
GO:0005886 | Plasma
membrane | 32 | 9.04×10⁻⁴ |
| GO-MF
terms |
|
|
|
|
GO:0043394 | Proteoglycan
binding | 3 | 1.83×10⁻⁴ |
|
GO:0001948 | Glycoprotein
binding | 4 | 3.47×10⁻⁴ |
|
GO:0008061 | Chitin binding | 2 | 4.62×10⁻⁴ |
|
GO:0043395 | Heparan sulfate
proteoglycan binding | 2 | 1.94×10⁻³ |
|
GO:0030246 | Carbohydrate
binding | 5 | 5.04×10⁻³ |
| Downregulated
genes |
| GO-BP
terms |
|
|
|
|
GO:0044057 | Regulation of
system process | 16 | 4.50×10⁻⁹ |
|
GO:0008015 | Blood
circulation | 15 | 3.72×10⁻⁸ |
|
GO:0003013 | Circulatory system
process | 15 | 3.97×10⁻⁸ |
|
GO:0051239 | Regulation of
multicellular organismal process | 36 | 5.25×10⁻⁸ |
|
GO:2000021 | Regulation of ion
homeostasis | 10 | 1.20×10⁻⁷ |
| GO-CC
terms |
|
|
|
|
GO:0031093 | Platelet alpha
granule lumen | 4 | 1.00×10⁻⁴ |
|
GO:0031091 | Platelet alpha
granule | 4 | 6.00×10⁻⁴ |
|
GO:0034774 | Secretory granule
lumen | 4 | 6.00×10⁻⁴ |
|
GO:0009925 | Basal plasma
membrane | 3 | 7.00×10⁻⁴ |
|
GO:0060205 | Cytoplasmic
membrane-bounded vesicle lumen | 4 | 1.40×10⁻³ |
| GO-MF
terms |
|
|
|
|
GO:0004119 | cGMP-inhibited
cyclic nucleotide phosphodiesterase activity | 2 | 3.65×10⁻⁵ |
|
GO:0043168 | Anion binding | 31 | 1.00×10⁻⁴ |
|
GO:0004740 | Pyruvate
dehydrogenase (acetyl-transferring) kinase activity | 2 | 2.00×10⁻⁴ |
|
GO:0004114 | 3′,5′-Cyclic
nucleotide phosphodiesterase activity | 3 | 4.00×10⁻⁴ |
|
GO:0097367 | Carbohydrate
derivative binding | 26 | 4.00×10⁻⁴ |
The significantly enriched KEGG pathways of
upregulated DEGs were cell adhesion molecules and phagosome
(Table IIA). The significantly
enriched KEGG pathways of downregulated DEGs were nitrogen
metabolism and propanoate (Table
IIA). The significantly enriched Reactome pathways of
upregulated DEGs were immune system and adaptive immune system
(Table IIB). The significantly
enriched Reactome pathways by downregulated DEGs were signaling by
retinoic acid and cGMP effects (Table
IIB).
| Table II.KEGG and Reactome pathway enrichment
analyses for differentially expressed genes (P<0.05). |
Table II.
KEGG and Reactome pathway enrichment
analyses for differentially expressed genes (P<0.05).
| A, KEGG
pathway |
|---|
|
|---|
| ID | Description | No. of genes | P-value |
|---|
| Upregulated |
|
|
|
|
04514 | Cell adhesion
molecules | 4 | 1.12×10⁻² |
|
04145 | Phagosome | 4 | 1.80×10⁻² |
|
00520 | Amino sugar and
nucleotide sugar metabolism | 2 | 4.01×10⁻² |
|
04670 | Leukocyte
transendothelial migration | 3 | 4.11×10⁻² |
|
05144 | Malaria | 2 | 4.47×10⁻² |
|
05320 | Autoimmune thyroid
disease | 2 | 4.63×10⁻² |
| Downregulated |
|
|
|
|
00910 | Nitrogen
metabolism | 3 | 1.00×10⁻³ |
|
00640 | Propanoate
metabolism | 3 | 2.60×10⁻³ |
|
04270 | Vascular smooth
muscle contraction | 4 | 1.77×10⁻² |
|
05412 | Arrhythmogenic
right ventricular cardiomyopathy | 3 | 2.60×10⁻² |
|
00250 | Alanine, aspartate
and glutamate metabolism | 2 | 3.11×10⁻² |
|
00564 | Glycerophospholipid
metabolism | 3 | 3.18×10⁻² |
|
05414 | Dilated
cardiomyopathy | 3 | 4.28×10⁻² |
|
| B, Reactome
pathway |
|
| ID | Description | No. of genes | P-value |
|
| Upregulated |
|
|
|
|
168256 | Immune system | 12 | 4.20×10⁻³ |
|
1280218 | Adaptive immune
system | 7 | 9.10×10⁻³ |
|
1474244 | Extracellular
matrix organization | 5 | 1.22×10⁻² |
|
2173782 | Binding and uptake
of ligands by scavenger receptors | 2 | 2.10×10⁻² |
|
199992 | Trans-golgi network
vesicle budding | 2 | 2.41×10⁻² |
|
421837 | Clathrin-derived
vesicle budding | 2 | 2.41×10⁻² |
|
168249 | Innate immune
system | 7 | 3.70×10⁻² |
|
1433557 | Signaling by
SCF-KIT | 3 | 3.82×10⁻² |
|
2219530 | Constitutive
signaling by aberrant PI3K in cancer | 2 | 4.32×10⁻² |
| Downregulated |
|
|
|
|
5362517 | Signaling by
retinoic acid | 4 | 4.00×10⁻⁴ |
|
418457 | cGMP effects | 3 | 9.00×10⁻⁴ |
|
392154 | Nitric oxide
stimulates guanylate cyclase | 3 | 9.7×10⁻⁴ |
|
109582 | Hemostasis | 10 | 3.00×10⁻³ |
|
204174 | Regulation of
pyruvate dehydrogenase complex | 2 | 4.10×10⁻³ |
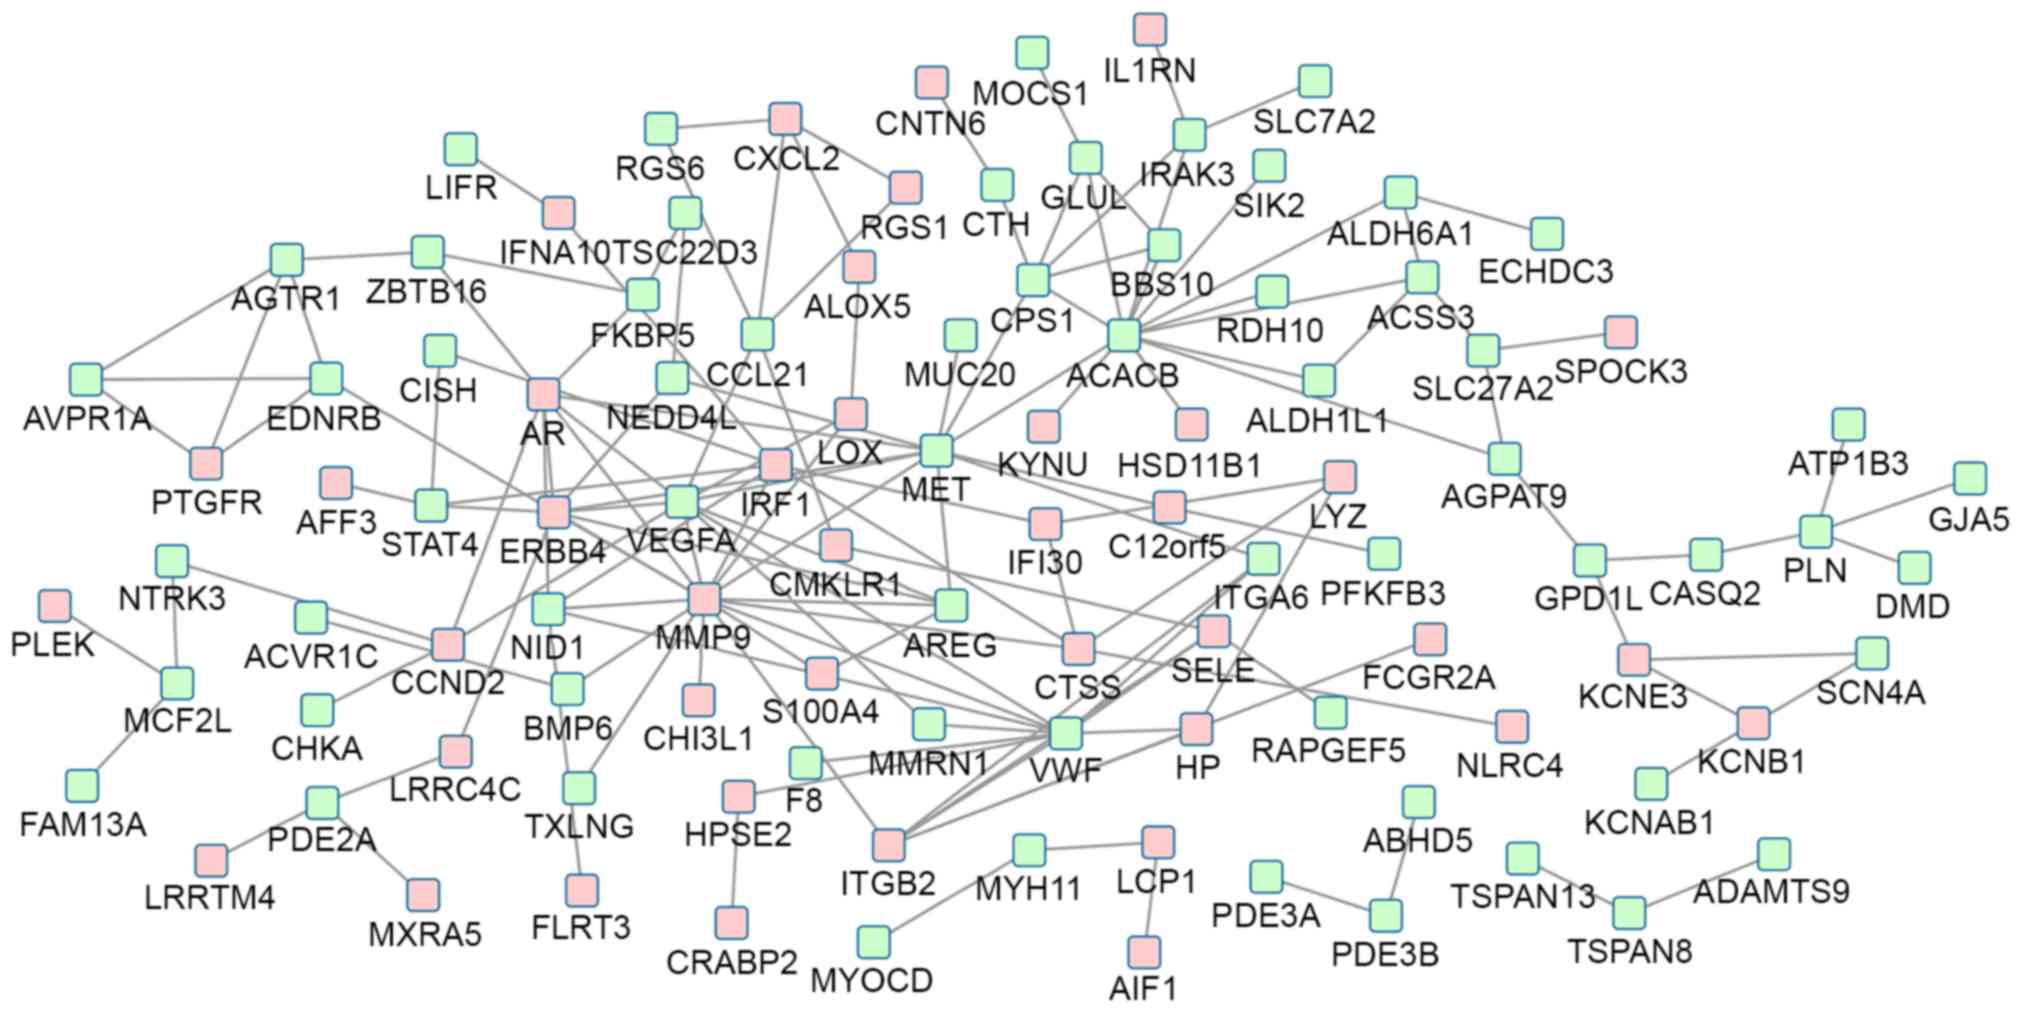
PPI network analysis
A total of 103 nodes and 147 protein pairs were
obtained with a PPI score of >0.4 based on the STRING database
(Fig. 2). The interactions of
proteins encoded by the DEGs were inconspicuous. The proteins that
were closely associated with other proteins with a degree of
interaction ≥10 were MMP9 (degree=16), Acetyl-CoA carboxylase β
(ACACB; degree=13), MET proto-oncogene, receptor tyrosine dinase
(MET; degree=11) and von Willebrand factor (VWF; degree=10).
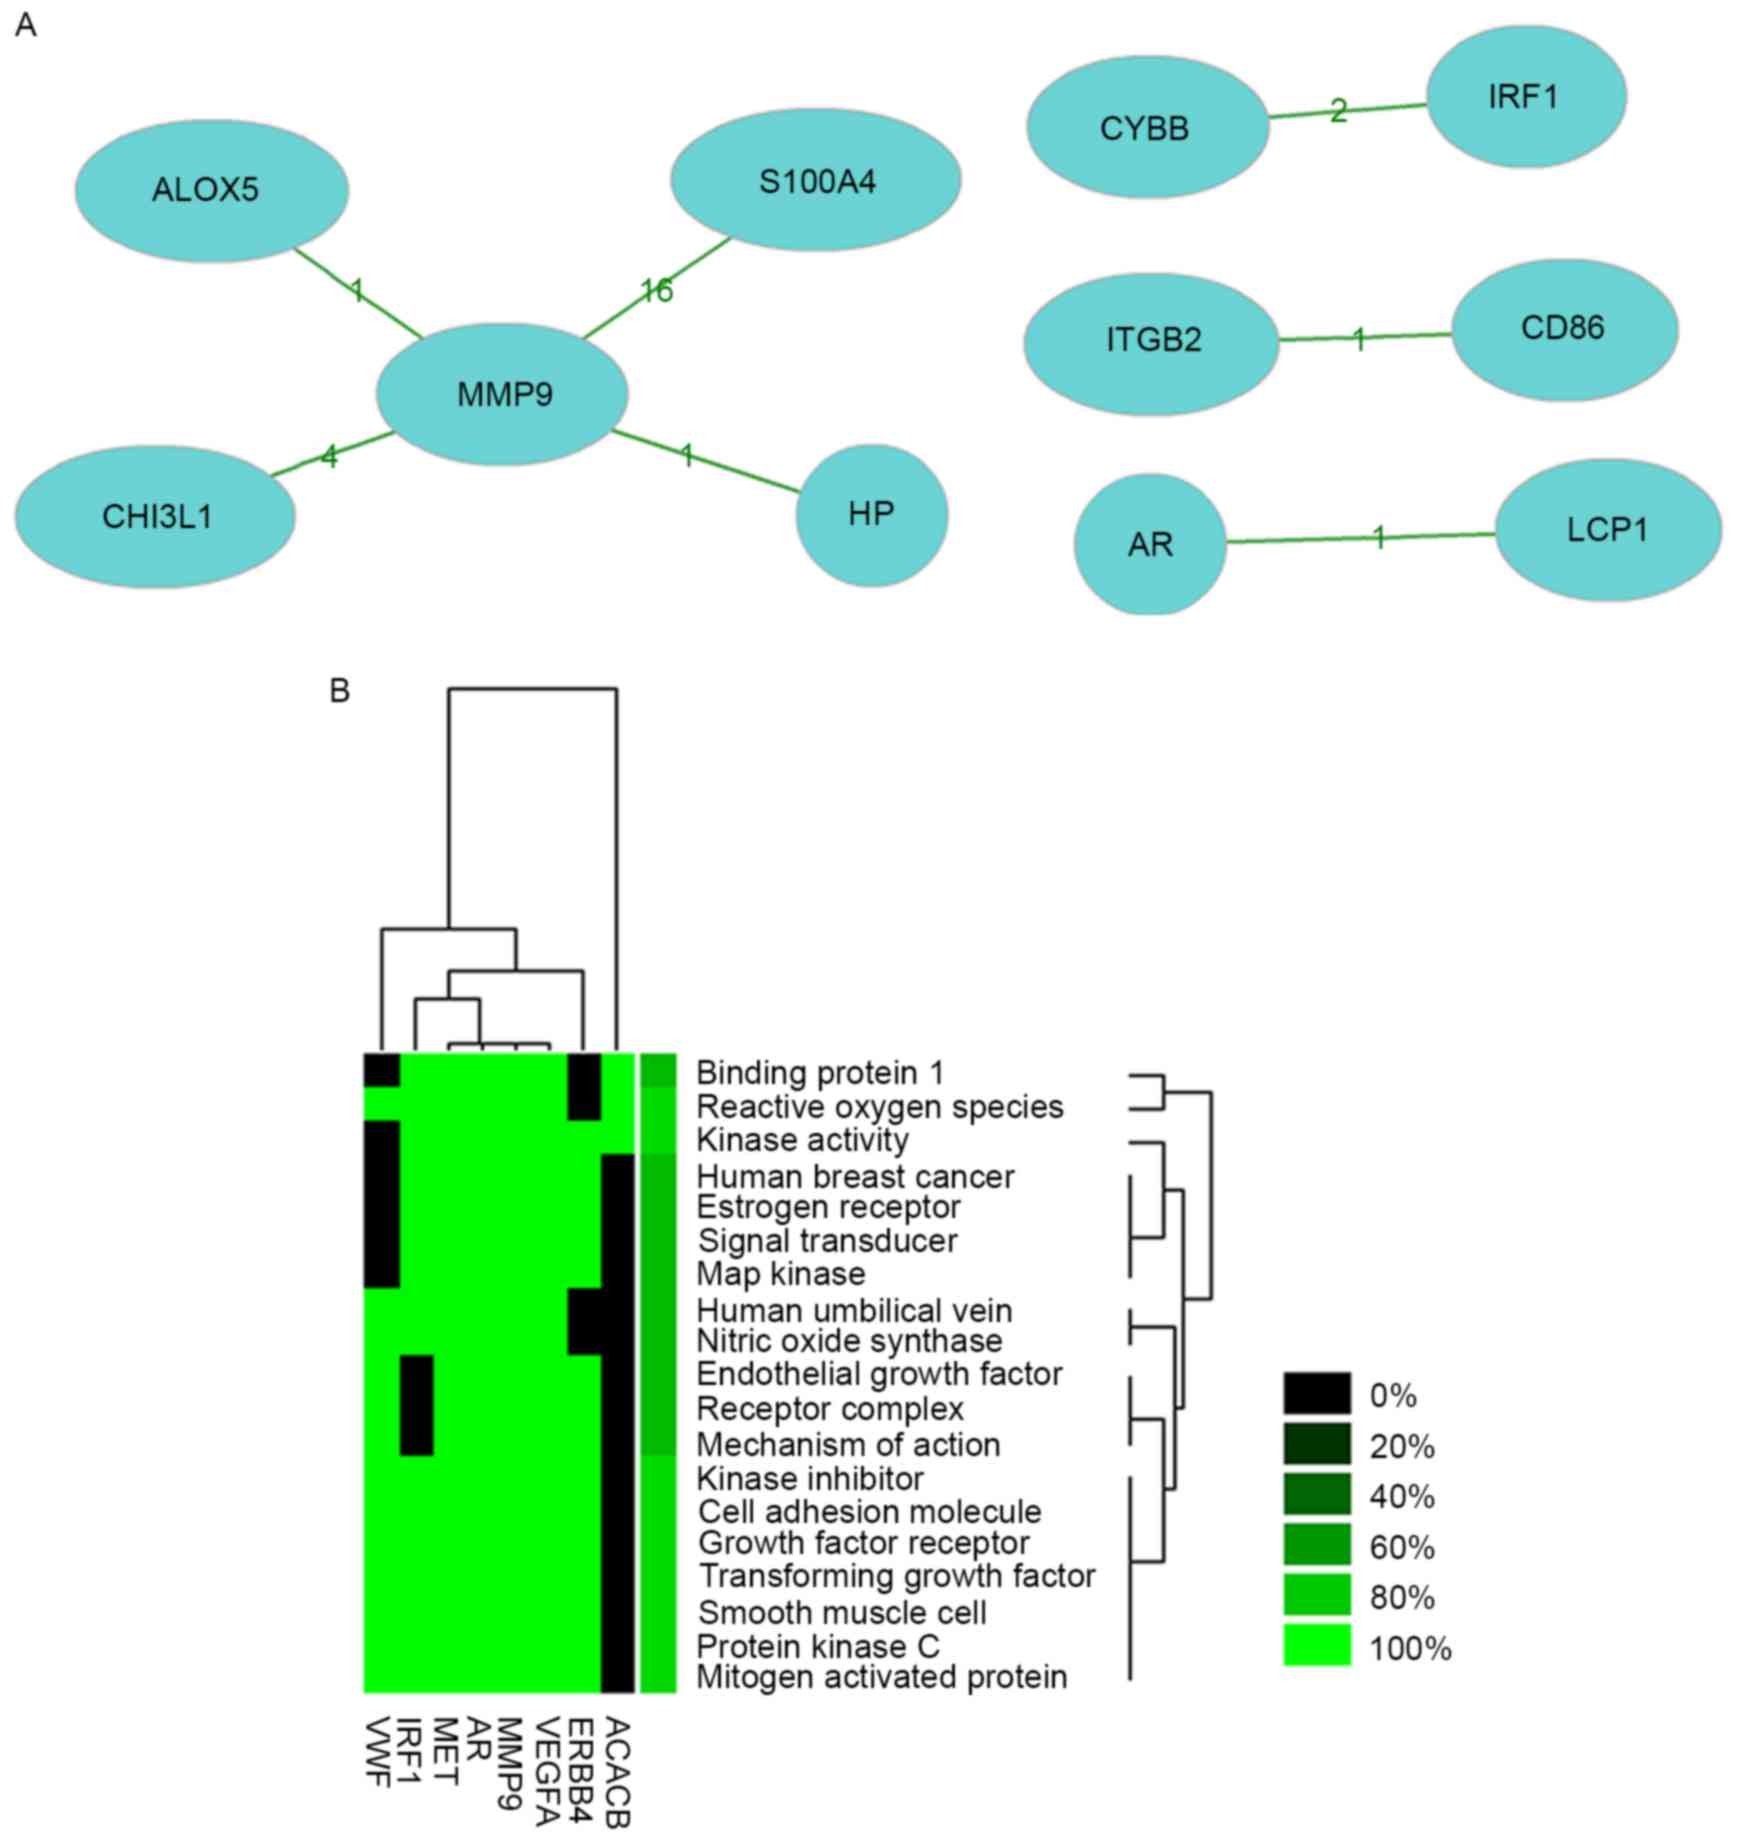
Literature mining was performed for 8 genes with high degree of
interaction in the networks. The co-citation network of these 8
genes in the reported literature is shown in Fig. 3A and the results reported by previous
studies regarding these genes are shown in Table III. Significant results of
enrichment analysis of these 8 genes reported the literature are
shown in Fig. 3B, and enrichment was
identified in terms such as binding protein 1, reactive oxygen
species and kinase activity.
| Table III.Hub genes identified by the present
study in the literature. |
Table III.
Hub genes identified by the present
study in the literature.
| Gene | Co-genes (n) | Co-citations
(n) | Total (n) |
|---|
| MMP9 | 4 | 22 | 18,527 |
| ITGB2 | 1 | 1 | 6,736 |
| ALOX5 | 1 | 1 | 325 |
| CD86 | 1 | 1 | 7,281 |
| S100A4 | 1 | 16 | 977 |
| AR | 1 | 1 | 13,054 |
| HP | 1 | 1 | 6,963 |
| LCP1 | 1 | 1 | 289 |
| CHI3L1 | 1 | 4 | 729 |
| CYBB | 1 | 2 | 2,048 |
| IRF1 | 1 | 2 | 1,885 |
Analysis of marker genes and
transcription factors associated with obesity
A total of 11 previously reported marker genes of
obesity listed in the CTD, including ACACB, MMP9, glutamate-ammonia
ligase and ferritin light polypeptide, were identified among the
DEGs of the present study. The expression levels of these 11 genes
in the samples from obese and lean children are shown in Fig. 4A.
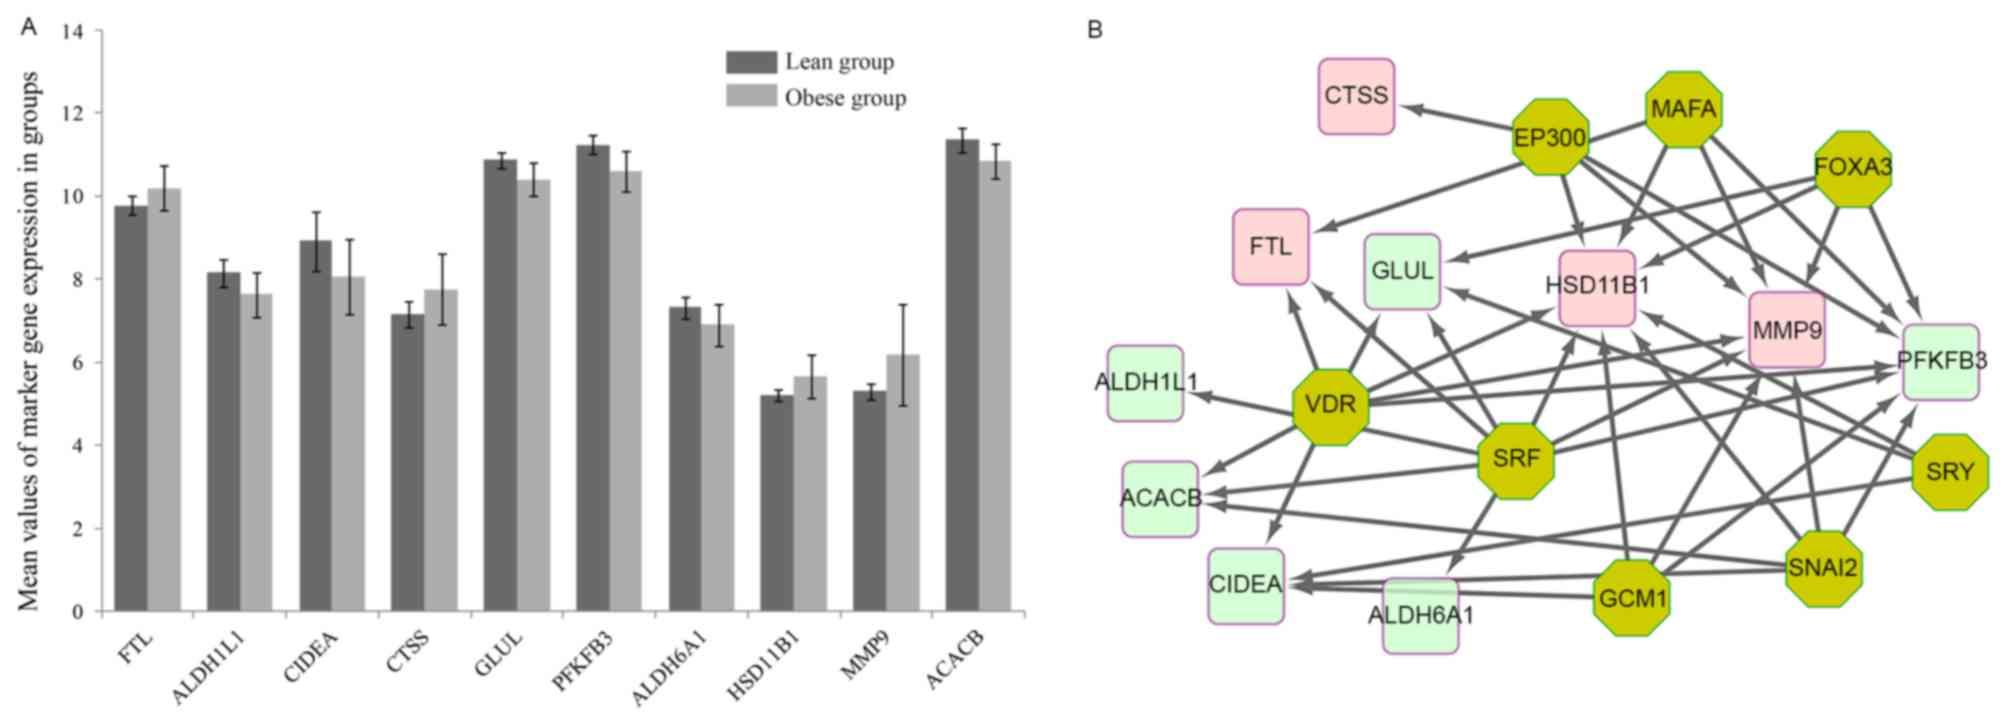 | Figure 4.(A) Expression levels of 11 marker
genes in samples from obese and lean children which had been listed
as obesity-associated marker genes in the comparative
toxicogenomics database. (B) Regulatory transcription factor
network of the marker genes. MMP, matrix metalloproteinase; ACACB,
acetyl-CoA carboxylase β. Red nodes represent upregulated genes,
green nodes represent downregulated genes and yellow nodes
represent regulating factors. EP300, E1A binding protein P300;
FOXA3, forkhead box A3; SRY, sex-determining region; HSD11B1,
hydroxysteroid 11-β dehydrogenase 1; ALDH6A1, aldehyde
dehydrogenase 6 family member A1; PFKFB3,
6-phosphofructo-2-kinase/fructose-2,6-biphosphatase3; GLUL,
glutamate-ammonia ligase; CTSS, cathepsin S; CIDEA, cell
death-inducing DFFA-like effector A; FTL, ferritin light chain;
VDR, vitamin D receptor; SRF, serum response factor; GCM1, glial
cells missing homolog 1; SNAI2, Snail family transcriptional
repressor 2. |
The transcription regulatory network of these marker
genes is shown in Fig. 4B. The
transcription factors with an NES score >5 were EP300 (E1A
Binding Protein P300, NES=6.63), FOXA3 (Forkhead Box A3,
NES=6.286), SRY (Sex Determining Region Y, NES=6.11), SNAI2
(NES=5.925), SRF (Serum Response Factor, NES=5.64), MAFA (MAF BZIP
Transcription Factor A, NES=5.464), GCM1 (Glial Cells Missing
Homolog 1, NES=5.157) and VDR (Vitamin D (1,25-Dihydroxyvitamin D3)
Receptor, NES=5.115).
Discussion
In the present study, a total of 199 DEGs (79 up and
120 downregulated genes) were identified in samples from obese
children compared with those from lean children within the array
dataset GSE29718. The results suggested that MMP9 and ACACB had a
high degree of interaction in the PPI network and were marker genes
in obese children. Moreover, upregulated DEGs were significantly
enriched in Reactome pathways of the immune system, and in various
associated terms of the GO-BP category with higher P-values.
Furthermore, MMP9, an upregulated DEG, was enriched in the term
immune system processes of the GO-BP category.
MMPs, a family of zinc-dependent endopeptidases,
decrease components of basement membranes and extracellular matrix.
A previous study showed that the MMP9 is upregulated in obese
children (32). Florys et al
(33) reported increased levels of
MMP9 in obese children with type 1 diabetes mellitus. Furthermore,
MMP9 has a significant role in the expansion of fat cells and
adipose tissue (34). It has been
suggested that extracellular matrix remodeled by MMP9 regulated
adipocyte differentiation, which then resulted in the progression
of obesity (35). Moreover, The
C−1562T polymorphism of the MMP9 gene promoter may lead
to the development of obesity (35).
In the present study, MMP9, which had the highest degree of
interaction in the PPI network, was identified as a marker gene in
obese children. Thus, the results of the present study are in
accordance with those of previous ones and suggest that MMP9 may be
a key gene associated with child obesity.
Furthermore, ACACB, which also had a high degree of
interaction in the PPI network, was identified as a marker gene
associated with child obesity in the present study. ACACB, one
isoform of ACAC, is involved in fatty acid oxidation (36,37). The
variants of the ACACB allele are associated with obesity (38). A previous study showed that body fat
may act as a mechanism of metabolic adaptation and a signal that
downregulated ACACB expression in adipose tissue (39). In addition, rs2268388 polymorphisms
of ACACB are associated with severe obesity and ACACB has a
significant part in disorders associated with energy metabolism
such as obesity (38). Furthermore,
ACACB is involved in triglyceride synthesis and triglyceride
contents of soleus muscle were greater in obese than in lean
individuals (40,41). Therefore, ACACB may be a key gene
associated with obesity.
In addition, upregulated DEGs identified by the
present study were found to be significantly enriched in Reactome
pathways associated with the immune system. Obesity, malnutrition
by excess, is associated with immune dysfunction (42). It has been suggested that the
pathogenesis of obesity includes an impaired immune system and
cell-mediated immune responses, and altered immune function
(43). Besides, adipose tissues of
obese individuals showed signs of immune response pathway
activation compared with those in lean people in a study on
weight-discordant twins (44). A
previous study has demonstrated that the cell-mediated immune
response is impaired in obese children (42). Tam et al (18) found an over-representation of the
immune and inflammatory response in performing gene ontology
analyses in adipose tissues of children. In addition, activation of
JNK1 and inhibitor of κB kinase pathways regulate inflammatory and
stress mechanisms in obesity, and numerous components of the immune
system, such as macrophages, have roles in the pathologies of
obesity-associated inflammation (45). The accumulation of macrophages and
development of crown-like structures are involved in adipose tissue
inflammation in obesity (45).
Furthermore, obesity is associated with increased immune cells in
the central nervous system (46).
Therefore, pathways of the immune system may be significantly
associated with child obesity. Besides, MMP9, an upregulated DEG,
was enriched in the term immune system processes in the GO-BP
category in the present study. It is thus speculated that MMP9 may
be involved in child obesity via immune system pathways.
The results of the present study showed that MMP9,
ACACB and immune system pathways may have important roles in child
obesity. Manco et al (47)
suggested that massive weight loss had effects on the innate immune
system in morbidly obese women. Laimer et al (48) indicated that weight loss in obese
women was associated with decreased MMP9. Thus, MMP9 and immune
system pathways may also have significant roles in adult obesity.
However, to the best of our knowledge, no previous study found that
ACACB was directly associated with the development of adult
obesity, and thus, this gene may not have any direct relevance in
adult obesity. ACACB may be differentially expressed in child
obesity compared with adult obesity, which remains to be clarified
in future studies. Genes and pathways associated with child and
adult obesity as well as their differences are still required to be
fully elucidated.
In conclusion, MMP9, ACACB and immune system
pathways may have significant roles in child obesity. However,
further studies on key genes and pathways associated with child
obesity are required. In addition, the molecular mechanisms of
adult obesity are required to be elucidated and to be compared with
those of child obesity to identify differences between them.
Acknowledgements
This study was supported by the Special Foundation
for Taishan Scholars (grant no. ts20110814) and a project of the
Shandong Province Science and Technology Program (grant no.
2014GSF118179).
References
|
1
|
Haslam DW and James WP: Obesity. Lancet.
366:1197–1209. 2005. View Article : Google Scholar : PubMed/NCBI
|
|
2
|
Hedley AA, Ogden CL, Johnson CL, Carroll
MD, Curtin LR and Flegal KM: Prevalence of overweight and obesity
among US children, adolescents, and adults, 1999–2002. Jama.
291:2847–2850. 2004. View Article : Google Scholar : PubMed/NCBI
|
|
3
|
Martorell R, Khan L Kettel, Hughes ML and
Grummer-Strawn LM: Overweight and obesity in preschool children
from developing countries. Int J Obes Relat Metab Disord.
24:959–967. 2000. View Article : Google Scholar : PubMed/NCBI
|
|
4
|
National Institutes of Health, . The
practical guide: identification, evaluation and treatment of
overweight and obesity in adults. National Heart, Lung and Blood
Institute; 2002
|
|
5
|
Freedman DS, Khan LK, Dietz WH, Srinivasan
SR and Berenson GS: Relationship of childhood obesity to coronary
heart disease risk factors in adulthood: The Bogalusa heart study.
Pediatrics. 108:712–718. 2001. View Article : Google Scholar : PubMed/NCBI
|
|
6
|
Wajchenberg BL: Subcutaneous and visceral
adipose tissue: Their relation to the metabolic syndrome. Endocr
Rev. 21:697–738. 2000. View Article : Google Scholar : PubMed/NCBI
|
|
7
|
Drincic AT, Armas LA, Diest EE and Heaney
RP: Volumetric dilution, rather than sequestration best explains
the low vitamin D status of obesity. Obesity (Silver Spring).
20:1444–1448. 2012. View Article : Google Scholar : PubMed/NCBI
|
|
8
|
Kim KA, Gu W, Lee IA, Joh EH and Kim DH:
High fat diet-induced gut microbiota exacerbates inflammation and
obesity in mice via the TLR4 signaling pathway. PLoS One.
7:e477132012. View Article : Google Scholar : PubMed/NCBI
|
|
9
|
Farooqi IS and O'Rahilly S: Mutations in
ligands and receptors of the leptin-melanocortin pathway that lead
to obesity. Nat Clin Pract Endocrinol Metab. 4:569–577. 2008.
View Article : Google Scholar : PubMed/NCBI
|
|
10
|
Vernia S, Cavanagh-Kyros J, Barrett T,
Jung DY, Kim JK and Davis RJ: Diet-induced obesity mediated by the
JNK/DIO2 signal transduction pathway. Genes Dev. 27:2345–2355.
2013. View Article : Google Scholar : PubMed/NCBI
|
|
11
|
Hwang JT, Kim SH, Lee MS, Kim SH, Yang HJ,
Kim MJ, Kim HS, Ha J, Kim MS and Kwon DY: Anti-obesity effects of
ginsenoside Rh2 are associated with the activation of AMPK
signaling pathway in 3T3-L1 adipocyte. Biochem Biophys Res Commun.
364:1002–1008. 2007. View Article : Google Scholar : PubMed/NCBI
|
|
12
|
Vohl MC, Sladek R, Robitaille J, Gurd S,
Marceau P, Richard D, Hudson TJ and Tchernof A: A survey of genes
differentially expressed in subcutaneous and visceral adipose
tissue in men. Obes Res. 12:1217–1222. 2004. View Article : Google Scholar : PubMed/NCBI
|
|
13
|
Linder K, Arner P, Flores-Morales A,
Tollet-Egnell P and Norstedt G: Differentially expressed genes in
visceral or subcutaneous adipose tissue of obese men and women. J
Lipid Res. 45:148–154. 2004. View Article : Google Scholar : PubMed/NCBI
|
|
14
|
Frayling TM, Timpson NJ, Weedon MN,
Zeggini E, Freathy RM, Lindgren CM, Perry JR, Elliott KS, Lango H,
Rayner NW, et al: A common variant in the FTO gene is associated
with body mass index and predisposes to childhood and adult
obesity. Science. 316:889–894. 2007. View Article : Google Scholar : PubMed/NCBI
|
|
15
|
Dina C, Meyre D, Gallina S, Durand E,
Körner A, Jacobson P, Carlsson LM, Kiess W, Vatin V, Lecoeur C, et
al: Variation in FTO contributes to childhood obesity and severe
adult obesity. Nat Genet. 39:724–726. 2007. View Article : Google Scholar : PubMed/NCBI
|
|
16
|
Zhang S, Wang B, Shi J and Li J:
Network-based association study of obesity and type 2 diabetes with
gene expression profiles. Biomed Res Int.
2015:6197302015.PubMed/NCBI
|
|
17
|
Chen Y, Li L and Xu R: Disease comorbidity
network guides the detection of molecular evidence for the link
between colorectal cancer and obesity. AMIA Jt Summits Transl Sci
Proc. 2015:pp. 201–206. 2015; PubMed/NCBI
|
|
18
|
Tam CS, Heilbronn LK, Henegar C, Wong M,
Cowell CT, Cowley MJ, Kaplan W, Clément K and Baur LA: An early
inflammatory gene profile in visceral adipose tissue in children.
Int J Pediatr Obes. 6:e360–e363. 2011. View Article : Google Scholar : PubMed/NCBI
|
|
19
|
Gautier L, Cope L, Bolstad BM and Irizarry
RA: affy-analysis of Affymetrix GeneChip data at the probe level.
Bioinformatics. 20:307–315. 2004. View Article : Google Scholar : PubMed/NCBI
|
|
20
|
Carvalho BS and Irizarry RA: A framework
for oligonucleotide microarray preprocessing. Bioinformatics.
26:2363–2367. 2010. View Article : Google Scholar : PubMed/NCBI
|
|
21
|
Ritchie ME, Phipson B, Wu D, Hu Y, Law CW,
Shi W and Smyth GK: limma powers differential expression analyses
for RNA-sequencing and microarray studies. Nucleic Acids Res.
43:e472015. View Article : Google Scholar : PubMed/NCBI
|
|
22
|
Smyth GK: Linear models and empirical
Bayes methods for assessing differential expression in microarray
experiments. Stat Appl Genet Mol Biol. 3:Article3. 2004. View Article : Google Scholar : PubMed/NCBI
|
|
23
|
Ashburner M, Ball CA, Blake JA, Botstein
D, Butler H, Cherry JM, Davis AP, Dolinski K, Dwight SS, Eppig JT,
et al: Gene Ontology: Tool for the unification of biology. Nat
Genet. 25:25–29. 2000. View
Article : Google Scholar : PubMed/NCBI
|
|
24
|
Kanehisa M and Goto S: KEGG: Kyoto
encyclopedia of genes and genomes. Nucleic Acids Res. 28:27–30.
2000. View Article : Google Scholar : PubMed/NCBI
|
|
25
|
Beloqui A, Guazzaroni ME, Pazos F, Vieites
JM, Godoy M, Golyshina OV, Chernikova TN, Waliczek A, Silva-Rocha
R, Al-Ramahi Y, et al: Reactome array: Forging a link between
metabolome and genome. Science. 326:252–257. 2009. View Article : Google Scholar : PubMed/NCBI
|
|
26
|
Szklarczyk D, Franceschini A, Wyder S,
Forslund K, Heller D, Huerta-Cepas J, Simonovic M, Roth A, Santos
A, Tsafou KP, et al: STRING v10: Protein-protein interaction
networks, integrated over the tree of life. Nucleic Acids Res.
43(Database Issue): D447–D452. 2015. View Article : Google Scholar : PubMed/NCBI
|
|
27
|
Shannon P, Markiel A, Ozier O, Baliga NS,
Wang JT, Ramage D, Amin N, Schwikowski B and Ideker T: Cytoscape: A
software environment for integrated models of biomolecular
interaction networks. Genome Res. 13:2498–2504. 2003. View Article : Google Scholar : PubMed/NCBI
|
|
28
|
Wang JH, Zhao LF, Lin P, Su XR, Chen SJ,
Huang LQ, Wang HF, Zhang H, Hu ZF, Yao KT and Huang ZX: GenCLiP
2.0: A web server for functional clustering of genes and
construction of molecular networks based on free terms.
Bioinformatics. 30:2534–2536. 2014. View Article : Google Scholar : PubMed/NCBI
|
|
29
|
Jensen LJ, Saric J and Bork P: Literature
mining for the biologist: From information retrieval to biological
discovery. Nat Rev Genet. 7:119–129. 2006. View Article : Google Scholar : PubMed/NCBI
|
|
30
|
Davis AP, Grondin CJ, Lennon-Hopkins K,
Saraceni-Richards C, Sciaky D, King BL, Wiegers TC and Mattingly
CJ: The Comparative Toxicogenomics Database's 10th year
anniversary: Update 2015. Nucleic Acids Res. 43(Database Issue):
D914–D920. 2015. View Article : Google Scholar : PubMed/NCBI
|
|
31
|
Janky R, Verfaillie A, Imrichová H, Van de
Sande B, Standaert L, Christiaens V, Hulselmans G, Herten K,
Sanchez M Naval, Potier D, et al: iRegulon: From a gene list to a
gene regulatory network using large motif and track collections.
PLoS Comput Biol. 10:e10037312014. View Article : Google Scholar : PubMed/NCBI
|
|
32
|
Głowińska-Olszewska B and Urban M:
Elevated matrix metalloproteinase 9 and tissue inhibitor of
metalloproteinase 1 in obese children and adolescents. Metabolism.
56:799–805. 2007. View Article : Google Scholar : PubMed/NCBI
|
|
33
|
Florys B, Głowińska B, Urban M and
Peczyńska J: Metalloproteinases MMP-2 and MMP-9 and their
inhibitors TIMP-1 and TIMP-2 levels in children and adolescents
with type 1 diabetes. Endokrynol Diabetol Chor Przemiany Materii
Wieku Rozw. 12:184–189. 2006.(In Polish). PubMed/NCBI
|
|
34
|
Andrade VL, Petruceli E, Belo VA,
Andrade-Fernandes CM, Russi CV Caetano, Bosco AA, Tanus-Santos JE
and Sandrim VC: Evaluation of plasmatic MMP-8, MMP-9, TIMP-1 and
MPO levels in obese and lean women. Clin Biochem. 45:412–415. 2012.
View Article : Google Scholar : PubMed/NCBI
|
|
35
|
Andrade VL, Fernandes KS, Bosco AA,
Tanus-Santos JE and Sandrim VC: Functional polymorphism located in
MMP-9 gene promoter is strongly associated with obesity. DNA Cell
Biol. 31:1054–1057. 2012. View Article : Google Scholar : PubMed/NCBI
|
|
36
|
Abu-Elheiga L, Matzuk MM, Abo-Hashema KA
and Wakil SJ: Continuous fatty acid oxidation and reduced fat
storage in mice lacking acetyl-CoA carboxylase 2. Science.
291:2613–2616. 2001. View Article : Google Scholar : PubMed/NCBI
|
|
37
|
Abu-Elheiga L, Brinkley WR, Zhong L,
Chirala SS, Woldegiorgis G and Wakil SJ: The subcellular
localization of acetyl-CoA carboxylase 2. Proc Natl Acad Sci USA.
97:pp. 1444–1449. 2000; View Article : Google Scholar : PubMed/NCBI
|
|
38
|
Riancho JA, Vázquez L, García-Pérez M,
Sainz J, Olmos JM, Hernández JL, Pérez-López J, Amado JA,
Zarrabeitia MT, Cano A and Rodríguez-Rey JC: Association of ACACB
polymorphisms with obesity and diabetes. Mol Genet Metab.
104:670–676. 2011. View Article : Google Scholar : PubMed/NCBI
|
|
39
|
Ma L, Mondal AK, Murea M, Sharma NK,
Tönjes A, Langberg KA, Das SK, Franks PW, Kovacs P, Antinozzi PA,
et al: The effect of ACACB cis-variants on gene expression and
metabolic traits. PLoS One. 6:e238602011. View Article : Google Scholar : PubMed/NCBI
|
|
40
|
Wang JC, Gray NE, Kuo T and Harris CA:
Regulation of triglyceride metabolism by glucocorticoid receptor.
Cell Biosci. 2:192012. View Article : Google Scholar : PubMed/NCBI
|
|
41
|
Sinha R, Dufour S, Petersen KF, LeBon V,
Enoksson S, Ma YZ, Savoye M, Rothman DL, Shulman GI and Caprio S:
Assessment of skeletal muscle triglyceride content by (1)H nuclear
magnetic resonance spectroscopy in lean and obese adolescents:
Relationships to insulin sensitivity, total body fat, and central
adiposity. Diabetes. 51:1022–1027. 2002. View Article : Google Scholar : PubMed/NCBI
|
|
42
|
Marti A, Marcos A and Martinez JA: Obesity
and immune function relationships. Obes Rev. 2:131–140. 2001.
View Article : Google Scholar : PubMed/NCBI
|
|
43
|
de Heredia FP, Gómez-Martínez S and Marcos
A: Obesity, inflammation and the immune system. Proc Nutr Soc.
71:pp. 332–338. 2012; View Article : Google Scholar : PubMed/NCBI
|
|
44
|
Pietiläinen KH, Róg T, Seppänen-Laakso T,
Virtue S, Gopalacharyulu P, Tang J, Rodriguez-Cuenca S, Maciejewski
A, Naukkarinen J, Ruskeepää AL, et al: Association of lipidome
remodeling in the adipocyte membrane with acquired obesity in
humans. PLoS Biol. 9:e10006232011. View Article : Google Scholar : PubMed/NCBI
|
|
45
|
Patel PS, Buras ED and Balasubramanyam A:
The role of the immune system in obesity and insulin resistance. J
Obes. 2013:6161932013. View Article : Google Scholar : PubMed/NCBI
|
|
46
|
Buckman LB, Hasty AH, Flaherty DK, Buckman
CT, Thompson MM, Matlock BK, Weller K and Ellacott KL: Obesity
induced by a high-fat diet is associated with increased immune cell
entry into the central nervous system. Brain Behav Immun. 35:33–42.
2014. View Article : Google Scholar : PubMed/NCBI
|
|
47
|
Manco M, Fernandez-Real JM, Equitani F,
Vendrell J, Mora ME Valera, Nanni G, Tondolo V, Calvani M, Ricart
W, Castagneto M and Mingrone G: Effect of massive weight loss on
inflammatory adipocytokines and the innate immune system in
morbidly obese women. J Clin Endocrinol Metab. 92:483–490. 2007.
View Article : Google Scholar : PubMed/NCBI
|
|
48
|
Laimer M, Kaser S, Kranebitter M,
Sandhofer A, Mühlmann G, Schwelberger H, Weiss H, Patsch JR and
Ebenbichler CF: Effect of pronounced weight loss on the
nontraditional cardiovascular risk marker matrix
metalloproteinase-9 in middle-aged morbidly obese women. Int J Obes
(Lond). 29:498–501. 2005.PubMed/NCBI
|