Introduction
Lung cancer (LC) is one of the most common
malignancies, which causes great harm to human health and is
currently the leading cause of cancer-associated death worldwide
(1). According to the histological
type classification, LC can be divided into two subtypes: Small
cell LC (SCLC) and non-SCLC (NSCLC). SCLC is a special type of LC,
featuring the highest degree of malignancy and the lowest degree of
differentiation among all the subtypes of LC (2,3), and
accounting for ~20% of the total reported LC cases (4–6).
Patients suffering from SCLC may be discovered to have lymphatic
metastasis, Similar to the viruses, cancer cells enter the
circulation and are transferred to distant organs of the body.
Among all types of lung tumors, SCLC has the worst prognosis. Due
to its high sensitivity to radiotherapy and chemotherapy, SCLC is
frequently treated with systemic chemotherapy, combined with
radiotherapy and surgery (7). Such
treatment can reduce the rate of local recurrence for patients with
SCLC, and ~25% of patients are able to achieve long-term survival
and an improved prognosis (8–10).
Despite the sensitivity of SCLC to chemotherapy, the
2-year survival rate for most patients only reaches 5%, due to the
characteristic distant metastases that arise in the early stages.
Overall, 90% of patients die within five years of the diagnosis
(11,12). The treatment options for SCLC have
not substantially improved over the last four decades, and no
targeted therapy has been approved, as compared with the treatments
available for NSCLC (13).
Therefore, ongoing progresses in elucidating the pathogenesis of
SCLC may be a basis for the development of treatments for SCLC
(14).
With the rapid development of molecular biology and
molecular genetics, the molecular mechanisms of SCLC were
determined to be partially the result of genetic abnormalities
(14,15). Many carcinogenic factors can be
induced by the activation of oncogenes and the inactivation of
tumor suppressor genes, leading to cell transformation and
carcinogenesis (16). Therefore,
exploring the pathogenesis of related genes of key signaling
pathways and the corresponding mediated signaling pathways is
necessary to analyze the occurrence of SCLC; this may be of benefit
for the discovery of targeted therapy molecular markers to assist
early diagnosis, and may also provide a molecular basis for
treatment.
In the cell cycle, a number of events occur in order
to replicate all cellular components (CCs) and produce two daughter
cells. The cell cycle is strictly controlled by a series of
sophisticated signaling pathways guiding the growth, DNA
replication and division of a normal cell (17). Moreover, it was widely considered
that the G0/G1-S phase and the G2-M phase were the key periods of
regulation in the cell cycle (18).
Studies have shown that dysregulation of the cell cycle is one of
the key characteristics of tumors. Tumor cells must break through
the cell cycle arrest that controls cell division. High expression
of cell cycle regulation-related genes is often observed in a
variety of human tumors, indicating the important roles of the cell
cycle during the occurrence and development of tumors.
In nonfunctional pituitary adenomas (NFPA), the
overexpression of CDK1 and CDC25A may have an
important role in promoting pituitary tumors in the G2/M transition
phase (19). It has been reported
that cell proliferation in hepatocellular carcinoma, nasopharyngeal
carcinoma, breast cancer and colorectal cancer can be inhibited by
regulating the expression of genes that induce cell cycle arrest at
the G1/S phase (20–22). Similarly, in LC, aberrant expression
of the cell cycle regulation-related genes Cyclin D1, Cyclin E,
Cyclin A, CDC25A and CDK4 could facilitate the
transcription and expression of genes that are associated with cell
cycle progression (23). However,
the functions of the cell cycle and its regulatory proteins in
SCLCs have not been fully clarified.
In this study, we analyzed microarray data from SCLC
using a series of bioinformatics tools in an integrated manner.
Aiming to elucidate the molecular mechanism of SCLC, crucial genes
associated with the cell cycle were identified, which may be
helpful for SCLC diagnosis and targeted therapy.
Materials and methods
Data source of gene expression
The gene expression profiles of GSE43346 were
obtained from the Gene Expression Omnibus (GEO) database of the
National Center of Biotechnology Information (NCBI; http://www.ncbi.nlm.nih.gov/geo). The platform of
the GPL570 [(HGU133_Plus_2) Affymetrix Human Genome U133 Plus 2.0
Array] was applied in the expression array (24). There were 24 samples contained in the
datasets used for the analysis, including 23 sample groups of SCLC
and 1 control group. The data (CEL form) and annotation files were
downloaded for further an alysis.
Data pre-processing
The original expression datasets under all
conditions were normalized by the Robust Multiarray Average (RMA)
method (25) in the clusterProfiler
package of R software (26) to
obtain the gene expression matrix. The t-test method in the Limma
package in R software was used to identify DEGs between SCLC and
normal lung samples. Values of |log fold-change (FC)| >2.0 and
P-value <0.05 were selected as the cut-off criteria.
Functional enrichment analysis
In order to better understand the functions of the
DEGs, R software was used to perform enrichment analysis on the
Gene Ontology (GO) (27) and Kyoto
Encyclopedia of Genes and Genomes (KEGG) pathways (28). In this study, the KEGG database was
applied to perform enrichment analysis of the DEGs, in order to
identify signaling pathways that may be involved in the occurrence
and development of SCLC. We relied on the web-based search engine
DAVID (https://david.ncifcrf.gov) to count GO
terms and KEGG pathways (29) with a
P-value of <0.01 and a gene number of >2. Based on the
standard clustering analysis method and novel gene clustering
scheme, GoMiner (https://discover.nci.nih.gov) (30) was adopted to study the microarray
data of SCLC for the purposes of further evaluating the biological
relevance, functional characteristics and false discovery rate
(FDR) <0.05 and P-value <0.05.
Protein-protein interaction (PPI)
network construction
The tool used to retrieve interactions between the
genes and proteins, STRING (31), is
a database that can provide comprehensive information regarding the
interactions between proteins, including the prediction of
interactions and experimental studies data. Cytoscape is a
conventional bioinformatics software program used for visual
biological networks and data integration. In this study, the STRING
online tool was applied to analyze the PPIs with interactions of
combined score >0.4 among the DEGs. Then, the network was
constructed with Cytoscape (32).
Analysis of mRNA expression in human
SCLC
Protein expression in SCLC and normal tissues was
determined using the Human Protein Atlas (www.proteinatlas.org). SCLC gene expression was
identified by analyzing the Roessler and TCGA databases available
in Oncomine (Compendia Biosciences; www.oncomine.org). High and low values were defined as
above and below the mean value, respectively.
Results
Identification of DEGs
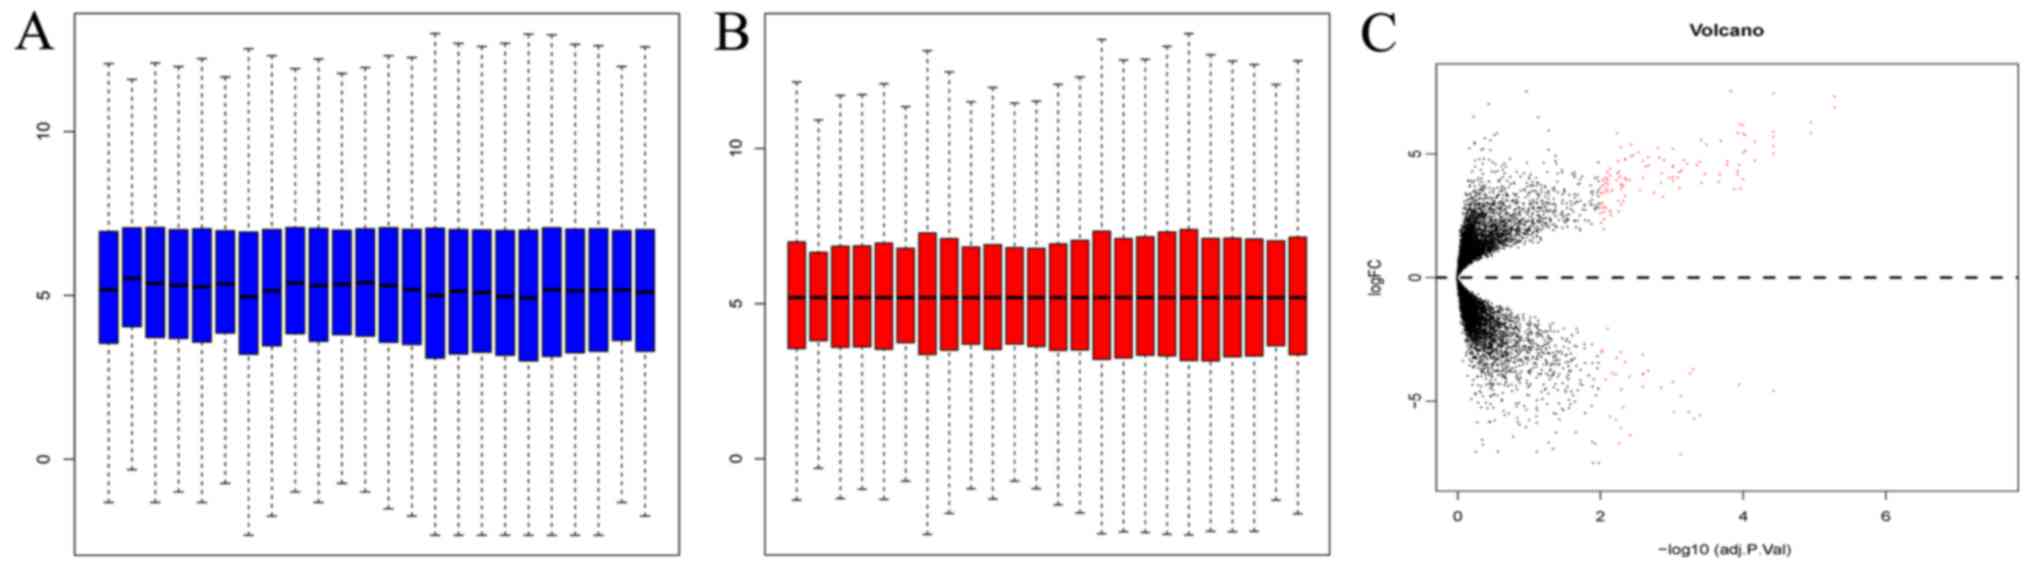
In our study, gene expression profiles from GSE43346
were utilized in order to compare the expression of specific genes
between SCLC and normal lung samples. Genes with corrected P-values
of <0.05 and an absolute FC of >2 were considered to be DEGs.
As shown in Fig. 1, blue represents
the data prior to correction and the middle line represents the
median (Fig. 1A). The Limma data
package was used to correct the original data (Fig. 1B). The results showed that 153 genes
between the SCLC and the normal group (119 upregulated and 34
downregulated genes) differed greatly in expression. Additionally,
the number of upregulated genes was markedly increased compared
with the downregulated genes. Red dots above and below the
imaginary line in the volcano plot represent the upregulated and
downregulated genes, respectively (Fig.
1C).
KEGG and GO enrichment
To improve our understanding of the function of
these DEGs, we carried out GO enrichment and KEGG pathway analysis
on the aforementioned 153 DEGs using the DAVID database, with
P<0.05. KEGG pathway enrichment showed that four pathways were
enriched: Cell cycle, p53 signaling pathway, oocyte meiosis, and
progesterone-mediated oocyte maturation (Fig. 2A). DEGs, including cyclin B1
(CCNB1), cyclin-dependent kinase 1 (CDK1), mitotic
spindle assembly checkpoint protein (MAD2L1) and checkpoint
kinase 1 (CHEK1) were identified in the cell cycle and p53
signaling pathways in this study, and are listed in Table I.
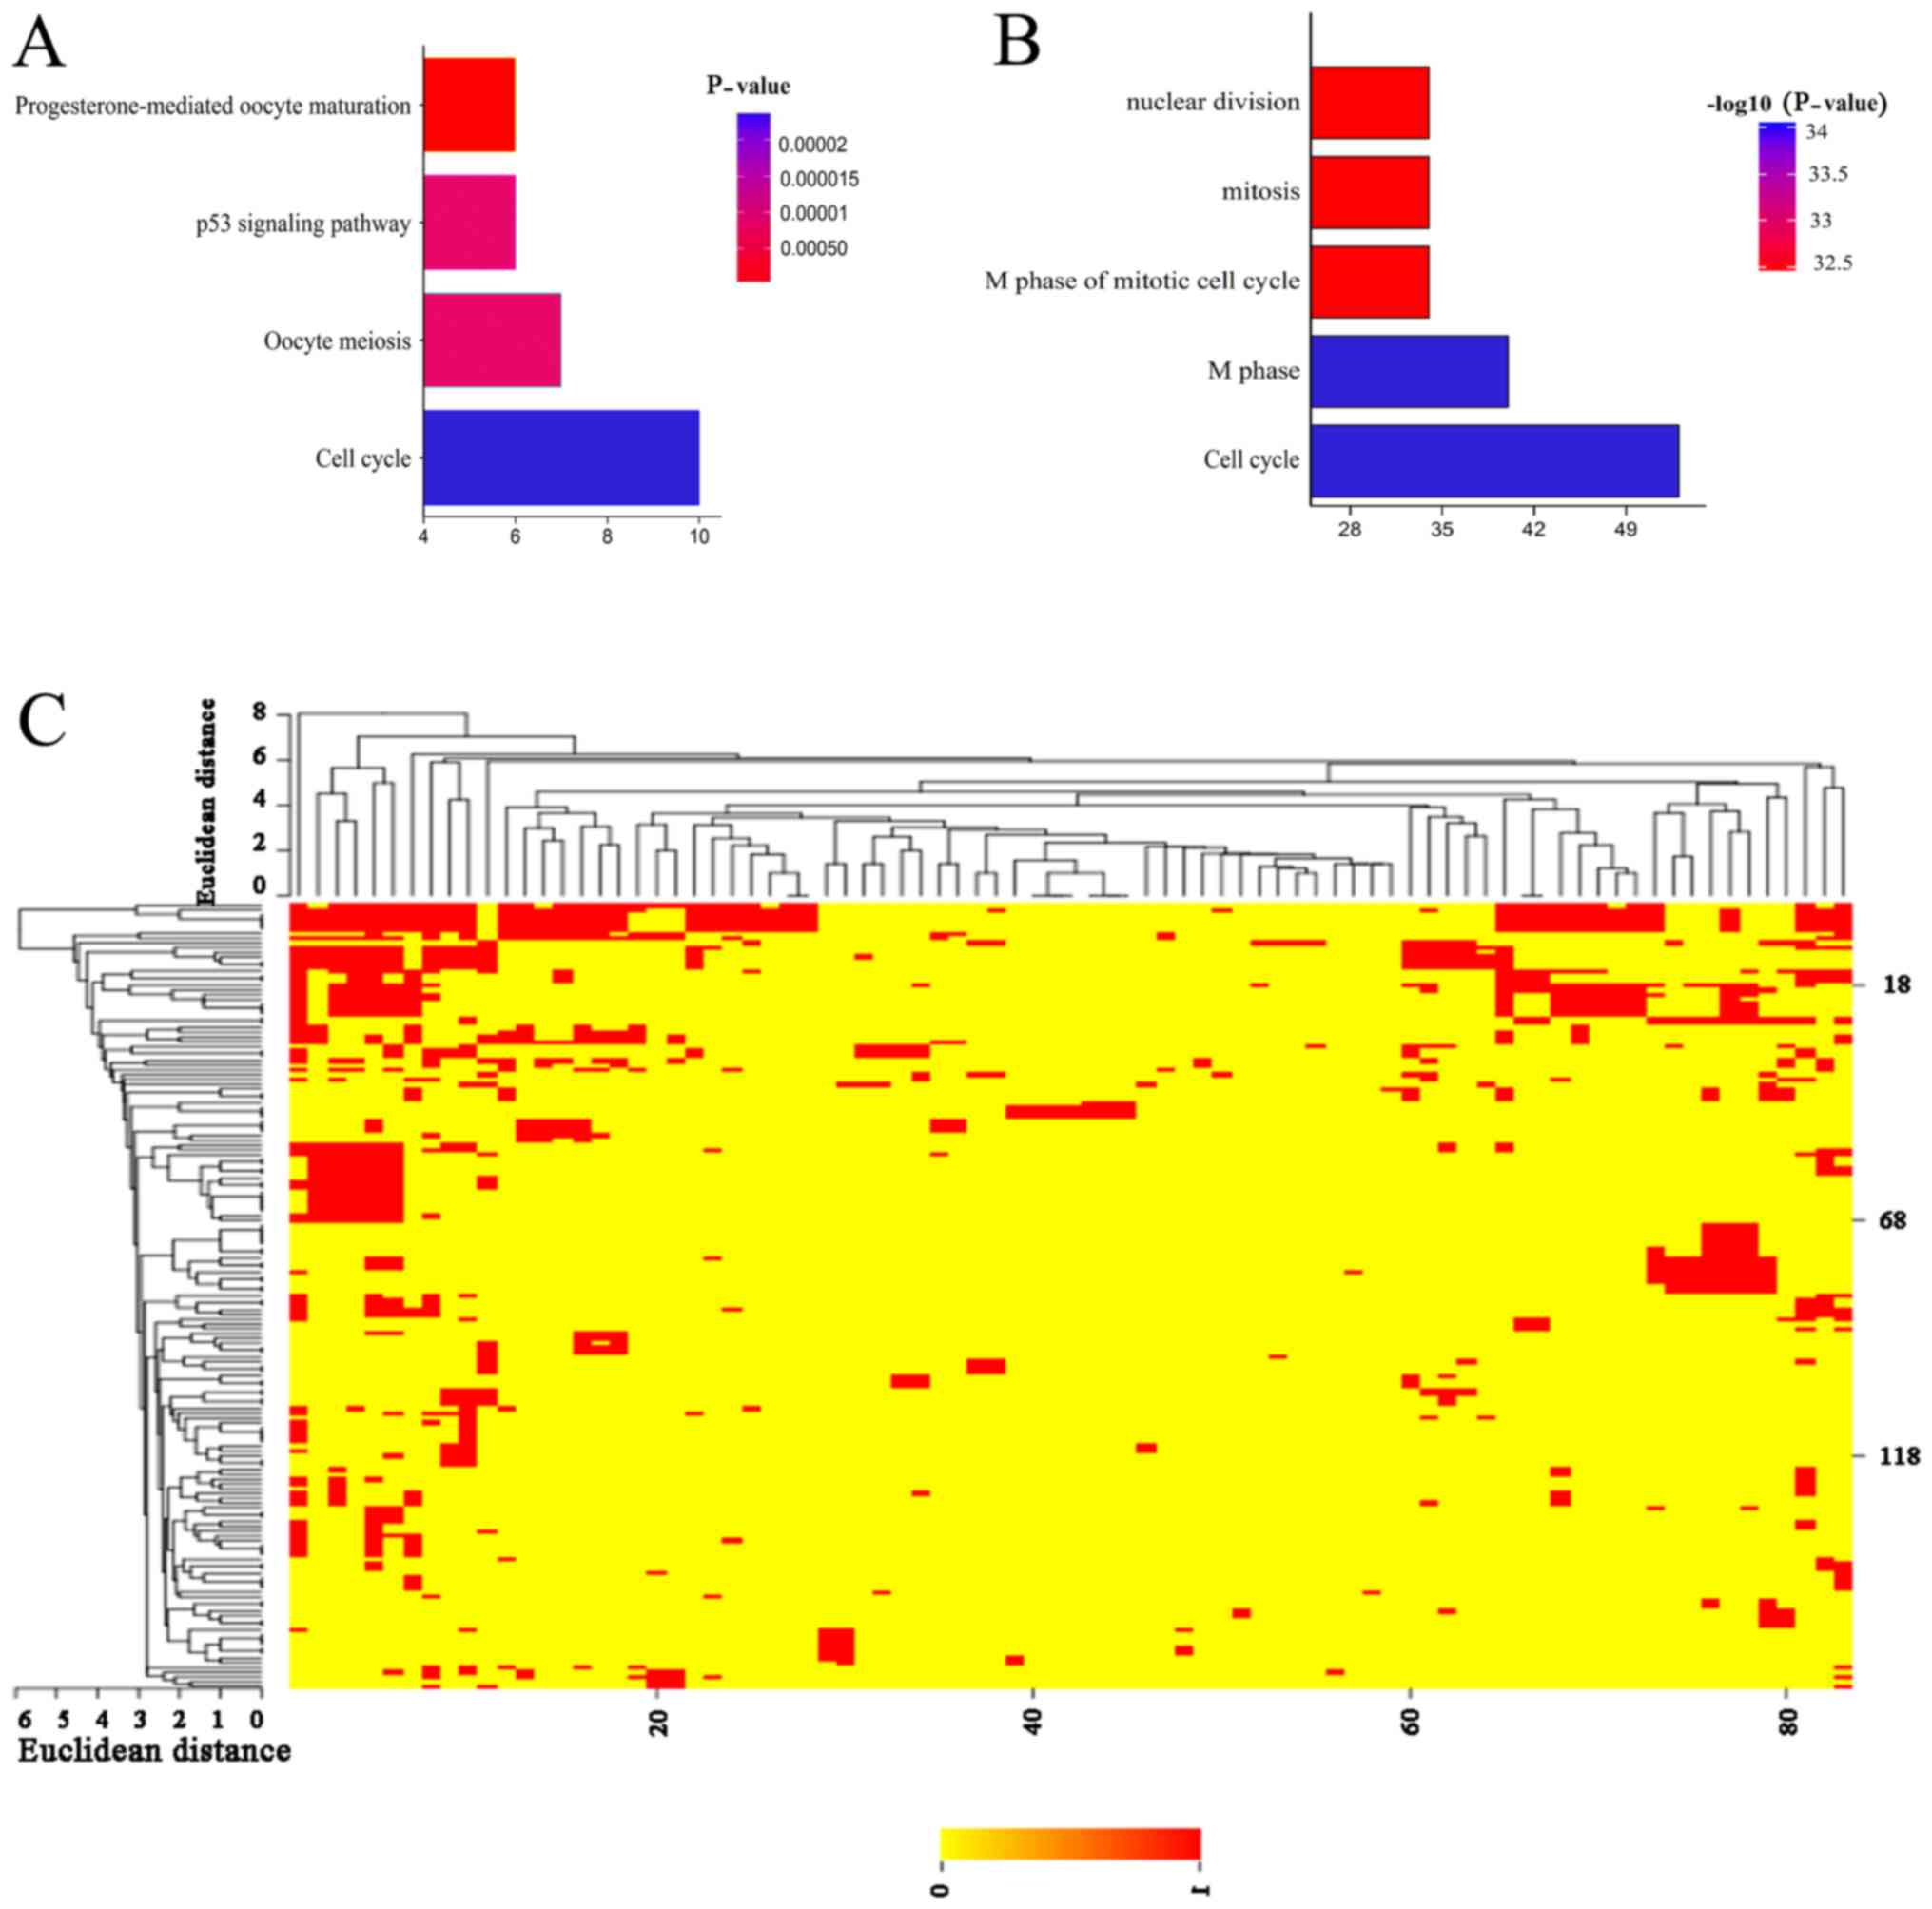 | Figure 2.KEGG pathway and enriched GO terms of
functional enrichment analysis. (A) four pathways enriched KEGG
pathway. gene count of the cell cycle, oocyte meiosis, p53
signaling pathway, progesterone-mediated oocyt. (B) Top five
enriched GO for differentially expressed genes. Gene count of M
phase, cell cycle, nuclear division, mitosis, M phase of mitotic
cell cycle. (C) CIM cluster with functional categories related to
cell cycle, FDR <0.05. The cluster is enriched for cell division
and cell cycle regulation. Red, genes are mapped to GO categories;
yellow, no association; KEGG, Kyoto Encyclopedia of Genes and
Genomes; GO, Gene Ontology; FDR, false discovery rate |
 | Table I.The four enriched KEGG pathways for
differentially expressed genes. |
Table I.
The four enriched KEGG pathways for
differentially expressed genes.
| KEGG pathway | Gene counts | P-value | Genes |
|---|
| hsa04110:Cell
cycle | 10 | 7.67E-08 | CCNB1, CDK1,
MAD2L1, CCNB2, BUB1, TTK, CHEK1, PTTG1, GADD45B, CCNA2 |
| hsa04114:Oocyte
meiosis | 7 | 7.34E-05 | CCNB1, CDK1,
MAD2L1, CCNB2, BUB1, AURKA, PTTG1 |
| hsa04115:p53
signaling pathway | 6 | 7.59E-05 | CCNB1, CDK1,
CCNB2, RRM2, CHEK1, GADD45B |
|
hsa04914:Progesterone-mediated oocyte
maturation | 6 | 2.33E-04 | CCNB1, CDK1,
MAD2L1, CCNB2, BUB1, CCNA2 |
GO enrichment results showed that a total of 50
terms containing upregulated and downregulated DEGs were obtained
(Fig. 2B). With GoMiner, clustering
was carried out in public databases to discover some information
associated with cell development and function. Relying on GoMiner,
we identified that the enrichment results were associated with cell
division and cell cycle regulation. From the Fig. 2C, it can be concluded that 80 genes
were enriched in 167 GO function terms, and were closely correlated
with cell cycle development. Among the clustering results obtained,
the top ten genes were CCNB1, TTK, BUB1, MAD2L1, CENPE, NDC80,
BIRC5, CCNA2, CDK1 and BRCA1. Meanwhile, cell division,
M phase, mitosis, organelle fission and mitotic cell cycle in the M
phase ranked as the top five, respectively, among the enriched GO
terms.
The upregulated genes were mainly enriched in GO
biological process (BP) terms. The GO CC terms comprised the
spindle, condensed chromosome and microtubule cytoskeleton. The GO
terms gathering the largest number of downregulated genes included
conditions of response to chromosome organization, regulation of
response to external stimuli, and positive regulation of cellular
protein metabolic processes. Furthermore, downregulated genes were
primarily correlated with the compound terms of spindle
microtubule, nucleoplasm and microtubule in CC of the GO results,
and associated with terms of polysaccharide binding, pattern
binding and ribonucleotide binding in molecular function (MF) of
the GO results. The top three terms were M phase (KIF23, KIFC1,
PRC1 and TTK) (P=1.66E-34), cell cycle (KIF23, KIFC1,
CLSPN and PRC1) (P=3.02E-34) and nuclear division
(KIF23, KIFC1, ANLN, AURKA and PTTG1) (P=1.74E-32),
respectively, as shown in Table
II.
| Table II.Top ten enriched GO for
differentially expressed genes. |
Table II.
Top ten enriched GO for
differentially expressed genes.
| GO ID | Term | Count | P-value | Genes |
|---|
| GO:0000279 | M phase | 40 | 1.66E-34 | KIF23, KIFC1,
PRC1, TTK, CHEK1, ANLN, AURKA, PTTG1, SPC24, SPC25, NCAPH, SAC3D1,
NCAPG, BUB1, CDCA2, CCNA2, CDCA5, ASPM, HELLS, CDCA3, CDK1, KIF11,
SGOL2, DLGAP5, KIF15, NUF2, CENPF, NUSAP1, MND1, BIRC5, CENPE,
NDC80, PBK, RAD54L, CCNB1, NEDD1, MAD2L1, CCNB2, ZWINT,
HAUS8 |
| GO:0007049 | Cell cycle | 53 | 3.02E-34 | KIF23, KIFC1,
CLSPN, PRC1, DTYMK, E2F8, TTK, AURKA, PTTG1, CDCA2, CDCA5, CCNA2,
ASPM, CDCA3, CDK1, KIF11, SGOL2, KIF15, MND1, NUSAP1, PBK, UHRF1,
MAD2L1, ZWINT, G0S2, HAUS8, SPAST, FOXM1, CHEK1, ANLN, SPC24,
SPC25, NCAPH, SAC3D1, NCAPG, HJURP, BUB1, HELLS, CKAP2, DLGAP5,
GMNN, NUF2, CENPF, BIRC5, NDC80, CENPE, RACGAP1, RAD54L, BRCA1,
CCNB1, NEDD1, CCNB2, CHAF1B |
| GO:0000280 | Nuclear
division | 34 | 1.74E-32 | KIF23, KIFC1,
ANLN, AURKA, PTTG1, SPC24, SPC25, NCAPH, SAC3D1, NCAPG, BUB1,
CDCA2, CCNA2, CDCA5, ASPM, HELLS, CDCA3, CDK1, KIF11, DLGAP5,
KIF15, NUF2, CENPF, NUSAP1, BIRC5, CENPE, NDC80, PBK, CCNB1, NEDD1,
MAD2L1, CCNB2, ZWINT, HAUS8 |
| GO:0007067 | Mitosis | 34 | 1.74E-32 | KIF23, KIFC1,
ANLN, AURKA, PTTG1, SPC24, SPC25, NCAPH, SAC3D1, NCAPG, BUB1,
CDCA2, CCNA2, CDCA5, ASPM, HELLS, CDCA3, CDK1, KIF11, DLGAP5,
KIF15, NUF2, CENPF, NUSAP1, BIRC5, CENPE, NDC80, PBK, CCNB1, NEDD1,
MAD2L1, CCNB2, ZWINT, HAUS8 |
| GO:0000087 | M phase of mitotic
cell cycle | 34 | 3.23E-32 | KIF23, KIFC1,
ANLN, AURKA, PTTG1, SPC24, SPC25, NCAPH, SAC3D1, NCAPG, BUB1,
CDCA2, CCNA2, CDCA5, ASPM, HELLS, CDCA3, CDK1, KIF11, DLGAP5,
KIF15, NUF2, CENPF, NUSAP1, BIRC5, CENPE, NDC80, PBK, CCNB1, NEDD1,
MAD2L1, CCNB2, ZWINT, HAUS8 |
| GO:0048285 | Organelle
fission | 34 | 6.86E-32 | KIF23, KIFC1,
ANLN, AURKA, PTTG1, SPC24, SPC25, NCAPH, SAC3D1, NCAPG, BUB1,
CDCA2, CCNA2, CDCA5, ASPM, HELLS, CDCA3, CDK1, KIF11, DLGAP5,
KIF15, NUF2, CENPF, NUSAP1, BIRC5, CENPE, NDC80, PBK, CCNB1, NEDD1,
MAD2L1, CCNB2, ZWINT, HAUS8 |
| GO:0022403 | Cell cycle
phase | 40 | 1.30E-30 | KIF23, KIFC1,
PRC1, TTK, CHEK1, ANLN, AURKA, PTTG1, SPC24, SPC25, NCAPH, SAC3D1,
NCAPG, BUB1, CDCA2, CCNA2, CDCA5, ASPM, HELLS, CDCA3, CDK1, KIF11,
SGOL2, DLGAP5, KIF15, NUF2, CENPF, NUSAP1, MND1, BIRC5, CENPE,
NDC80, PBK, RAD54L, CCNB1, NEDD1, MAD2L1, CCNB2, ZWINT,
HAUS8 |
| GO:0000278 | Mitotic cell
cycle | 37 | 1.17E-28 | KIF23, KIFC1,
PRC1, TTK, CHEK1, ANLN, AURKA, PTTG1, SPC24, SPC25, NCAPH, SAC3D1,
NCAPG, BUB1, CDCA2, CCNA2, CDCA5, ASPM, HELLS, CDCA3, CDK1, KIF11,
DLGAP5, KIF15, NUF2, CENPF, NUSAP1, BIRC5, CENPE, NDC80, PBK,
CCNB1, NEDD1, MAD2L1, CCNB2, ZWINT, HAUS8 |
| GO:0051301 | Cell division | 34 | 3.41E-28 | KIF23, KIFC1,
PRC1, ANLN, PTTG1, SPC24, SPC25, NCAPH, SAC3D1, NCAPG, CDCA2, BUB1,
CCNA2, CDCA5, ASPM, HELLS, CDCA3, CDK1, KIF11, SGOL2, NUF2, CENPF,
NUSAP1, BIRC5, CENPE, NDC80, RACGAP1, CCNB1, NEDD1, MAD2L1, CCNB2,
ZWINT, HAUS8, SPAST |
PPI network construction and
analysis
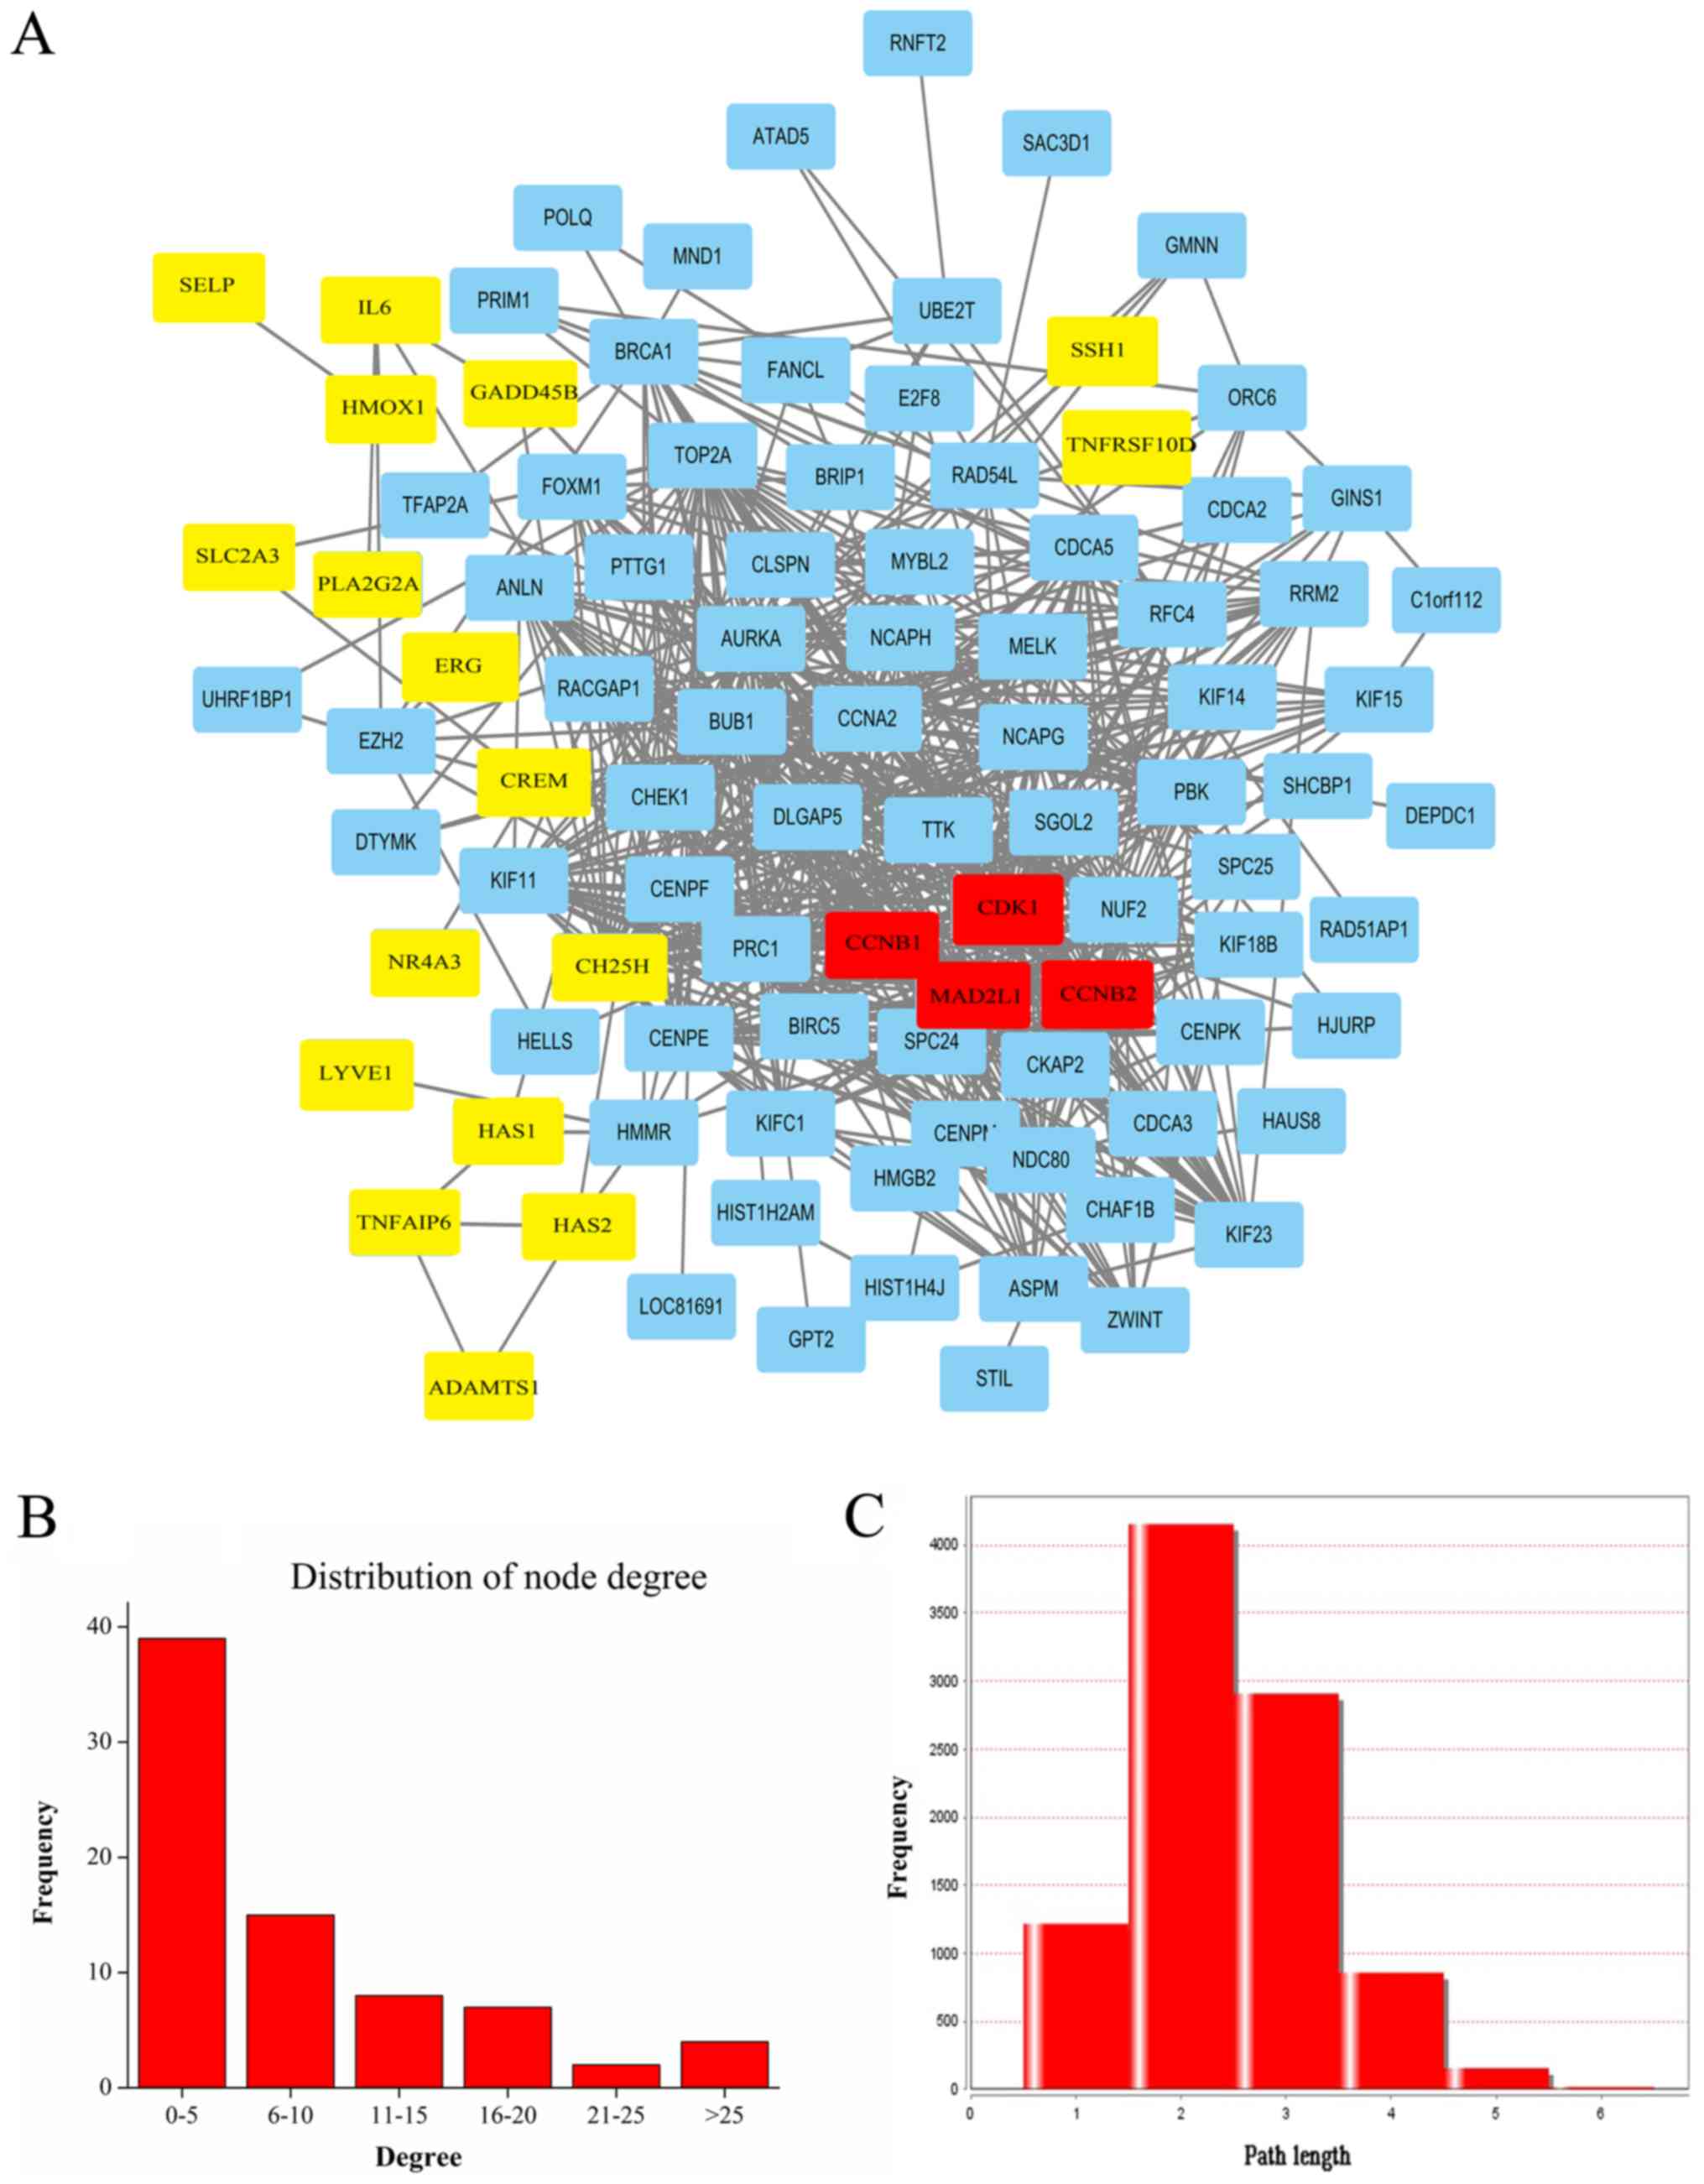
The PPI networks of upregulated and downregulated
genes are shown in Fig. 3A. The PPI
relationships between the 90 DEGs were determined using the STRING
tool. Then, a PPI network was constructed using Cytoscape; we built
the network with 97 nodes and 609 edges. The top 15 degree hub
nodes in the PPI network were as follows: TOP2A, PRC1, CDK1,
NUSAP1, BUB1, SPC24, CENPF, CCNB2, MAD2L1, KIFC1, BRCA1, BIRC5,
CHEK1, KIFC1 and TTK. These genes (proteins) could have
an important role in the progression of SCLC.
The original PPI data was statistically analyzed.
The abscissa represents the number of nodes, each of which has five
gradients. The ordinate represents the number of genes. As shown in
the figure, nodes for genes 0–5 achieved the largest number of
genes and nodes for genes 21–25 reached the minimum number of genes
(Fig. 3B). Meanwhile, the Cytoscape
Networker Analyzer was adopted to analyze the network and identify
the shortest path between two nodes, the results of which are
presented as a histogram (Fig. 3C).
The shortest path length distribution may indicate the inherent
property of the analyzed network. The predictive ability of the
biological network can be enhanced by decreasing the complexity of
the data.
Key genes cross analysis and
validation
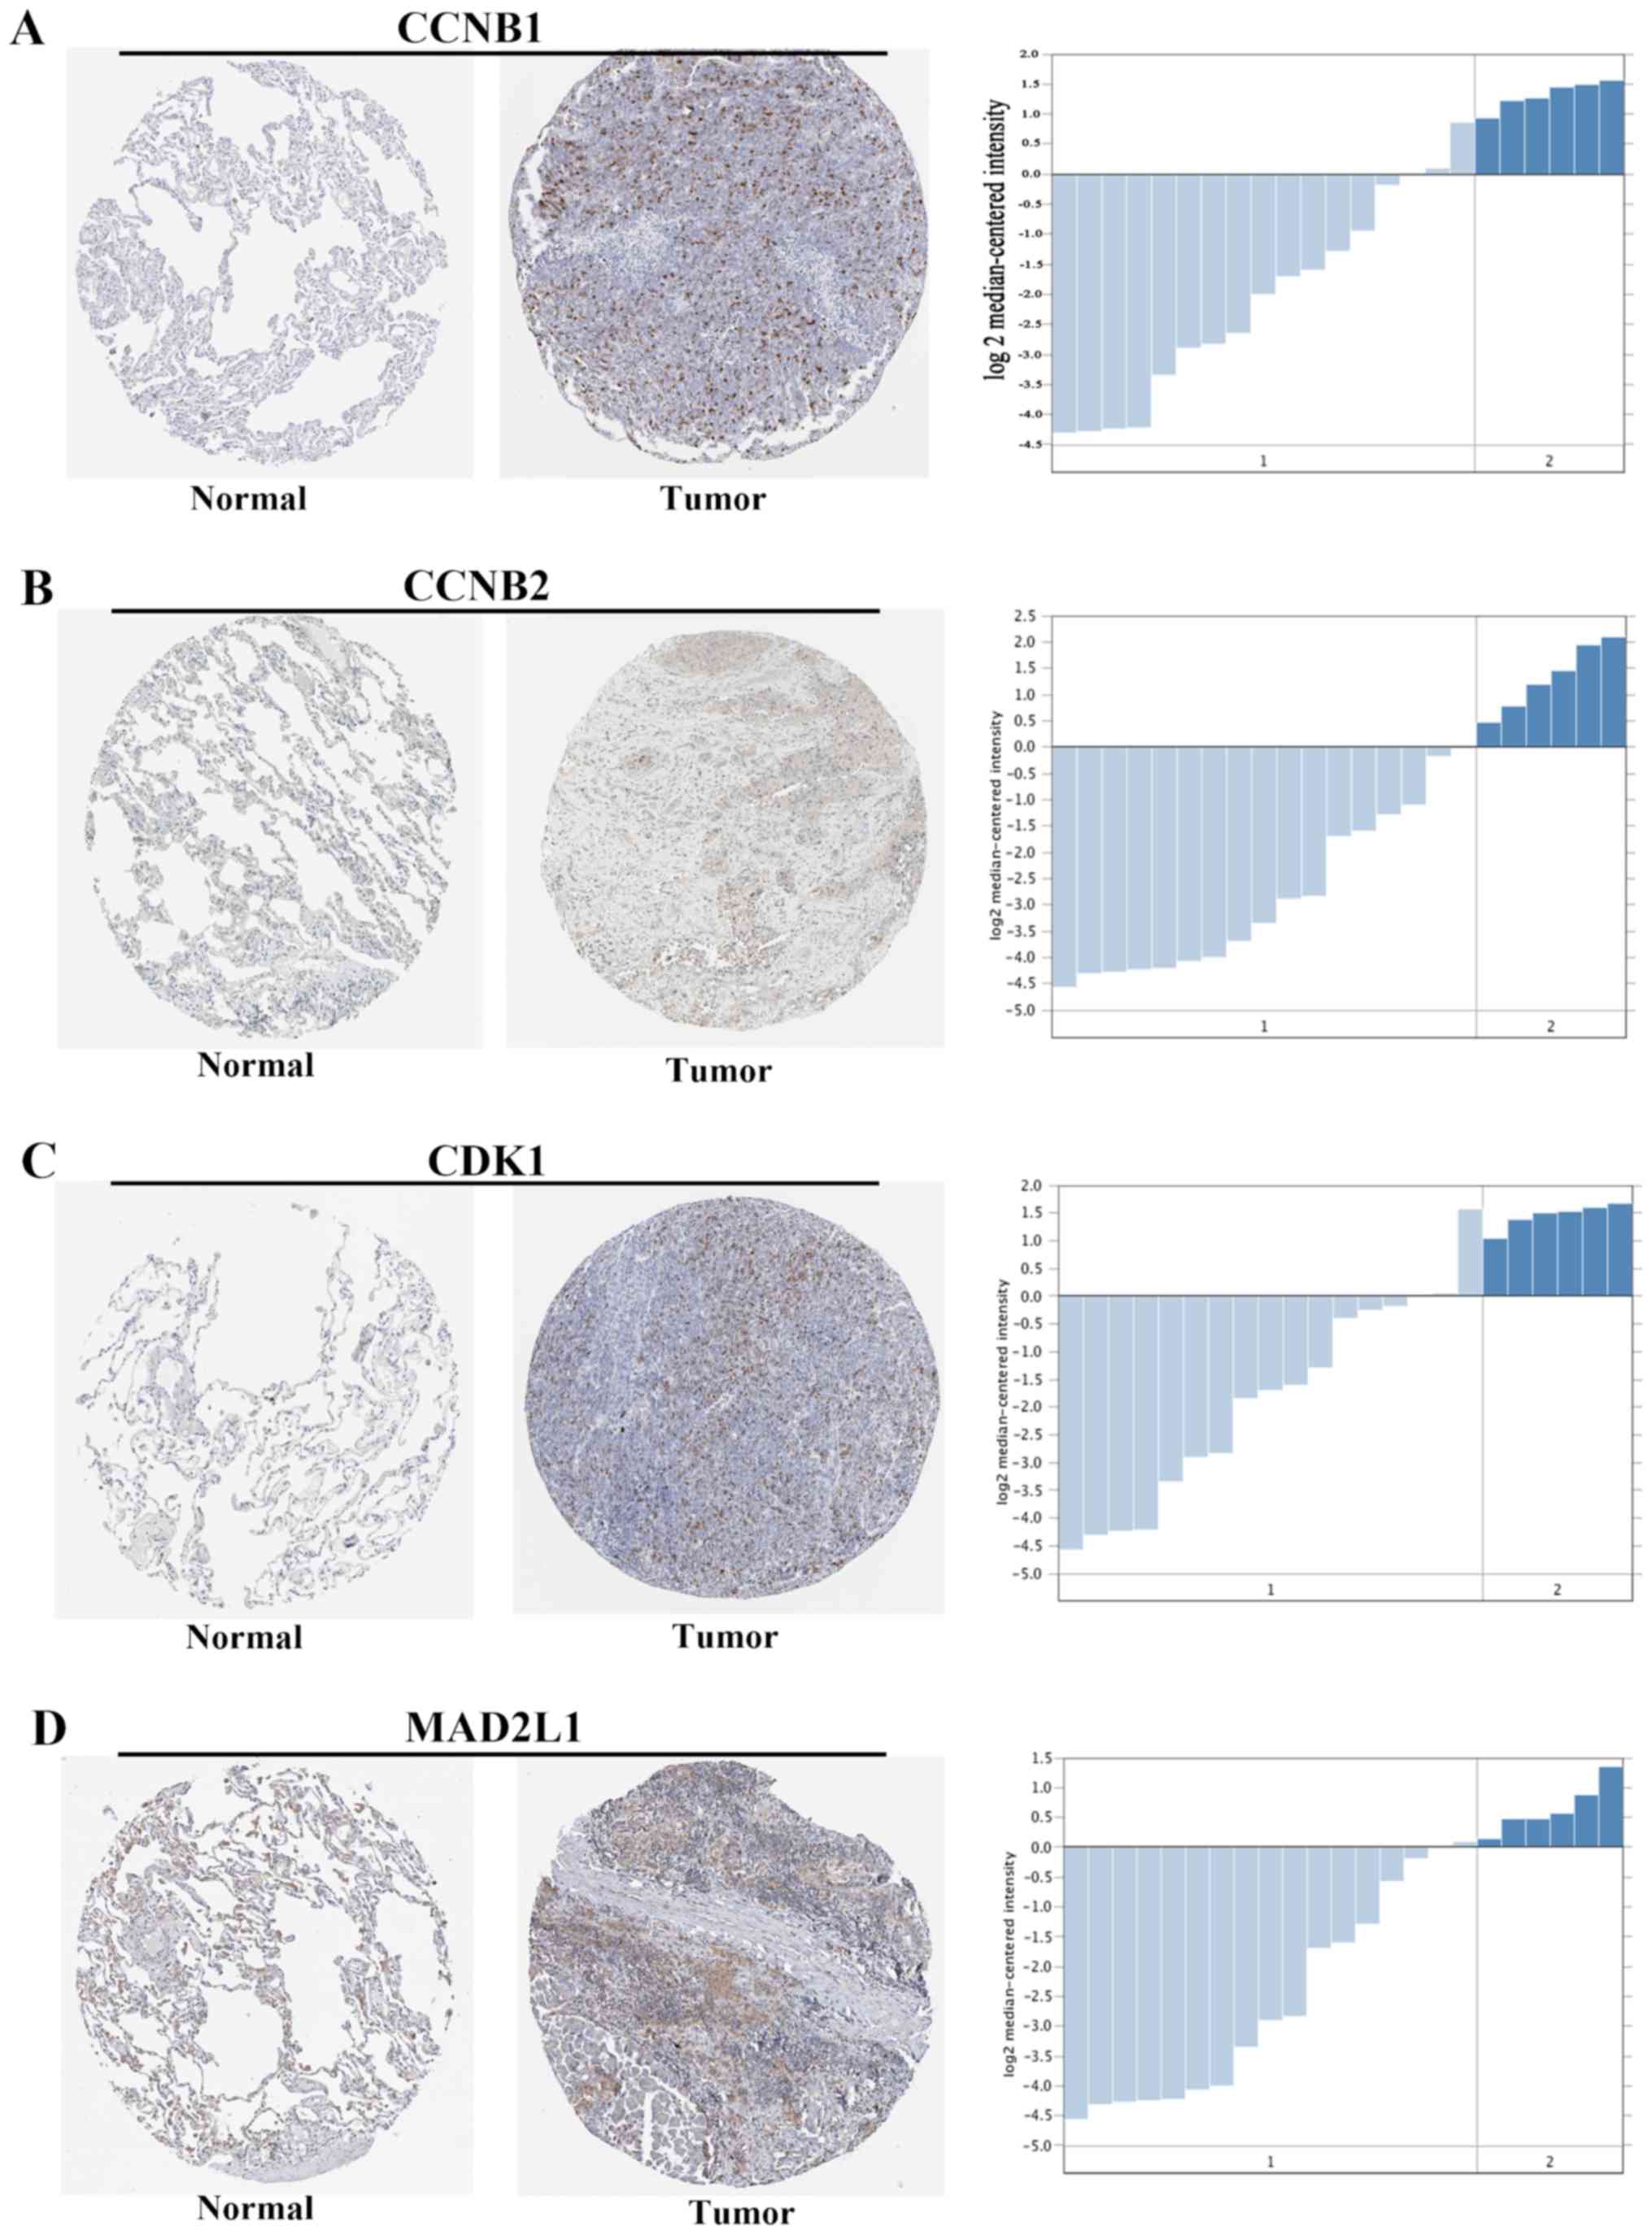
We analyzed the enrichment analysis data of DEGs of
the KEGG pathway and the PPI network. The four significantly
enriched KEGG pathways in the module included cell cycle, oocyte
meiosis, p53 signaling pathway and progesterone-mediated oocyte
maturation. It is worth noting that CCNB1, CDK1, MAD2L1 and
CCNB2 were significantly enriched in these four pathways.
Specifically, it was found that the four genes in the SCLC
specimens exhibited strong expression in compared with those in
normal lung sample (Fig. 4). The
immunohistochemical schematic diagrams for the CCNB1, CDK1,
MAD2L1 and CCNB2 genes from SCLCs and normal lung
tissues were obtained through the Human Protein Atlas.
Additionally, the mRNA expression levels of these genes in SCLC
tissues were analyzed by Oncomine, the results of which were
consistent with our analysis.
Discussion
In this study, we analyzed GSE43346 to obtain 153
differentially-expressed genes, including 118 upregulated and 34
downregulated genes. We found that these genes were significantly
enriched in four pathways, including cell cycle, oocyte meiosis,
p53 signaling pathway, and progesterone-mediated oocyte maturation.
Certain genes, including CCNB1, CCNB2, CDK1 and
MAD2L1, were identified to be significantly upregulated in
these pathways. In our further study, we will collaborate with
clinical research teams to verify the roles of candidate targets in
tumorigenesis, cancer progression and evolvement of resistance to
therapy.
Tumor suppressor p53 is encoded by the homologous
TP53 genes, which can slow down or monitor cell division
(33). In total, >50% of all
malignant tumors have been found to exhibit mutations in this gene
(34). Mutant p53, as a result of a
TP53 gene mutation, is a tumor-promoting factor, which can
lead to tumor formation or cell transformation and eliminate the
functions of normal TP53 genes (35,36). The
TP53 gene is ranked first among all the genes discovered in
terms of its correlation with human cancer cases (37,38).
Mutations in this gene are likely to be an important factor
underlying tumorigenesis in humans. In the cell cycle, the G2/M
phase DNA damage checkpoint is the last chance for cells to repair
DNA damage prior to mitosis. The regulatory function of p53 in
monitoring the cell cycle is observed at the G1 and G2/M stage
(39,40); CCNB1 and CDK1 also act
on these two monitoring points.
CCNB1 is a cell cycle protein that serves an
essential role in the G2/M phase. Studies on NSCLC have shown that
high expression of CCNB1 is associated with poor prognosis
(41). The expression level of CCNB1
can also be used as a marker to determine the prognosis of patients
with breast cancer (42). The
expression level of CCNB1 is associated with the tumor grade; a
higher level of CCNB1 indicates a larger tumor size and a higher
probability of metastasis. Therefore, the expression of CCNB1 can
act as a prognostic predictor (43,44).
CDK1 is the cell cycle regulatory protein with the greatest
pleiotropy (45). CDK1 interacts
with nine different cyclins throughout the cell cycle. These
interactions with cyclins are important for activating its kinase
activity, and also for the recruitment and selection of downstream
proteins (46). For example,
CDK1-CCNB1 complexes can induce abnormal regulation of downstream
protein phosphorylation, leading to uncontrolled cell proliferation
(47). Therefore, selective
inhibition of CCNB1 or CDKs can limit the progress of the cell
cycle and/or induce cellular apoptosis. To date, there have been
many studies showing that inhibiting the expression of CCNB1 or
CDK1 could suppress the occurrence and development of tumors, via
the p53/Bax apoptosis pathway in tumor cells. Therefore, CCNB1,
CDK1 and their downstream effector CDC25C could be therapeutic
targets for antineoplastic treatment (48).
In mitosis, the segregation of chromosomes is
controlled by the cyclin checkpoint. If the chromosomes are not
properly attached to the mitotic spindle, the cell cycle may be
arrested (49). The spindle
monitoring point is the key time at which to correct the separation
of the sister chromatid. The spindle checkpoint regulator MAD2L1
may protect cells from abnormal chromosome segregation (50). However, defects in the spindle
monitoring point may lead to aneuploidy. The mitotic arrest
defective protein MAD2L1 is an important component of the
anaphase-promoting complex (APC/C). By directly binding to CDC20
and suppressing the activity of APC/CCDC20, cell arrest may be
inhibited during anaphase (51).
High expression of MAD2L1 is a common phenomenon in a variety of
tumors, and is associated with poor prognosis in breast, gastric
and colorectal cancer, as well as in other tumor types (52–55).
Abnormal regulation of the cell cycle will lead to
abnormal chromosomes, uncontrolled cell proliferation and
apoptosis, and eventually the formation of malignant tumors. Based
on the results of this study, it can be speculated that the DNA in
SCLC cells suffers damage. As shown in Fig. 5, in normal cells, if the DNA is
damaged, p53 inhibits the binding of CDK1 and CCNB1, and thus CDK1
is disable to induce dissociation of the E2F-Rb complex, leading to
further cell cycle arrest at the G2-M phase, where apoptosis may be
induced. By comparison, the dysfunctional p53 fails to suppress
formation of the CDK1-CCNB1 complex, and this newly formed
CCK1-CCNB1 complex promotes the dissociation of the E2F-Rb complex
via phosphorylation of Rb in the G1 phase. Subsequently, the E2F
obtained may accelerate cell cycle progression from the G2 to the M
phase (56,57).
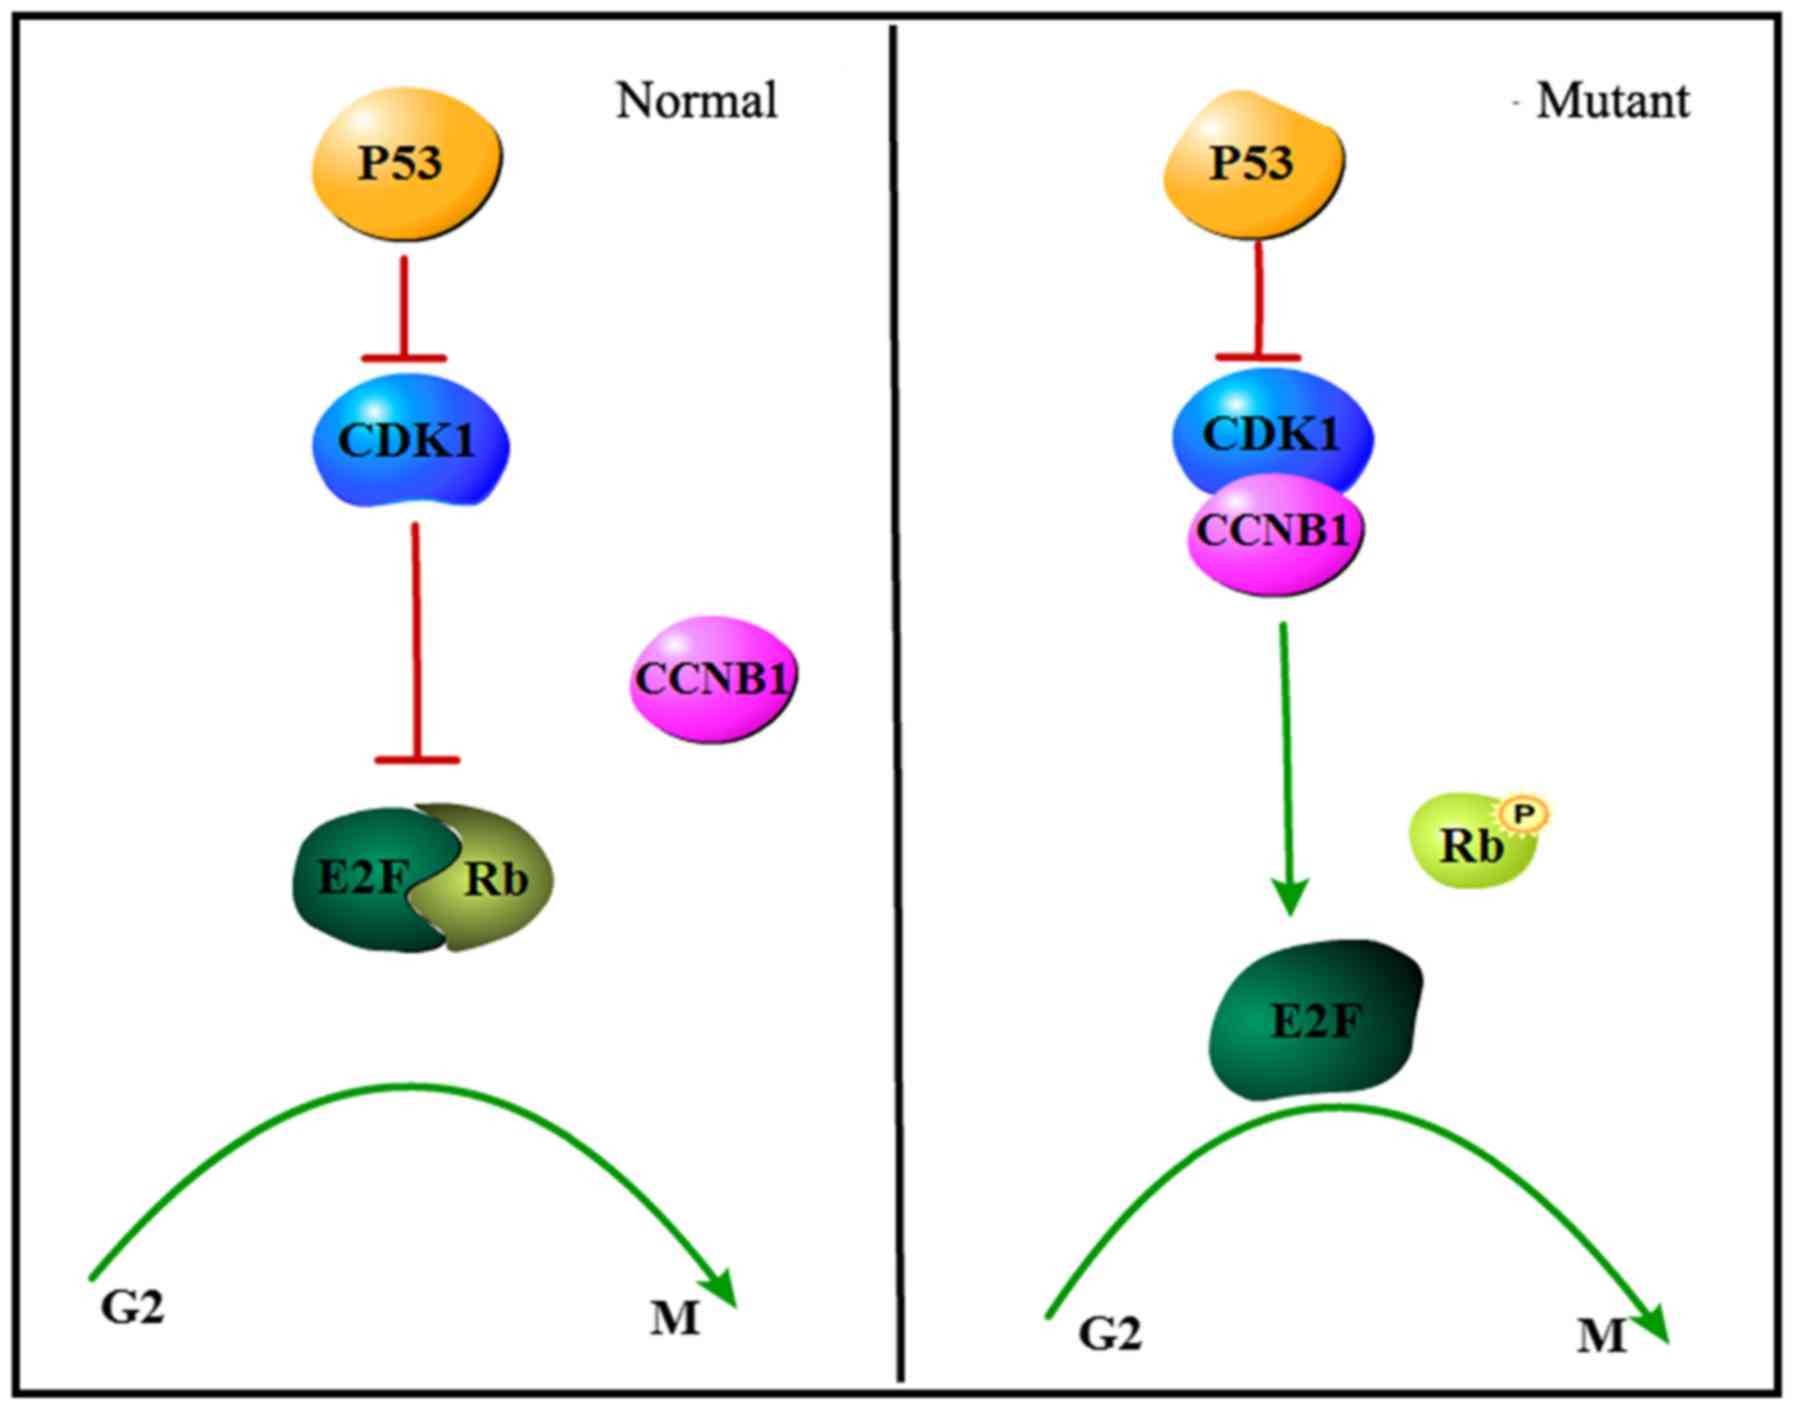 | Figure 5.A schematic representation of
CDK1/CCNB1 in regulation of small cell lung cancer cell cycle. In
normal cells, p53 protein activates and inhibiting the binding of
CDK1 and CCNB1, resulting in Rb non-phosphorylation possibly, then,
cell cycle arrest (left). In the mutant, p53 expression is
abnormal, cdk inhibitory activity is not activated, After binding
to CCNB1, the CDK1 protein acted on the E2F-Rb complex, which could
lead to the phosphorylation of Rb and promote the transition of the
cell cycle from the G2 phase to the M phase (right). CDK1
cyclin-dependent kinase 1; CCNB1, cyclin B1. |
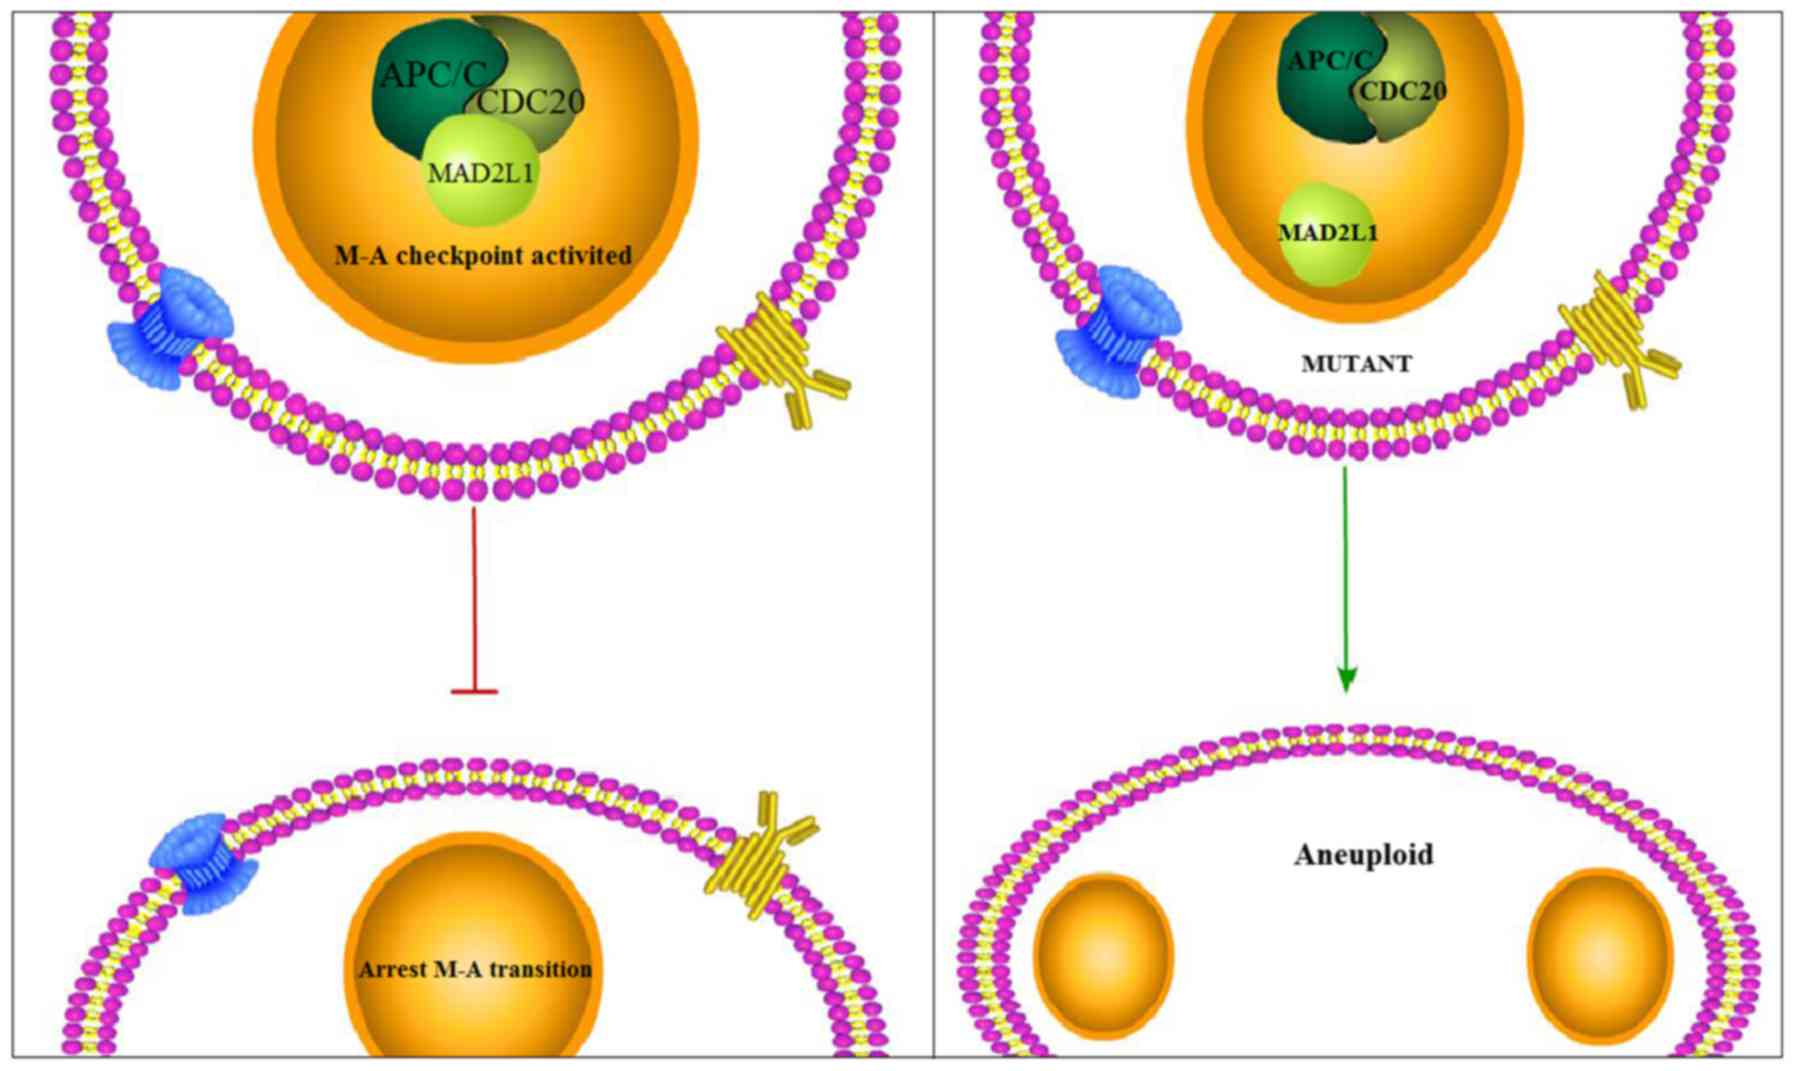
It was widely accepted that MAD2L1 binds with the
APC/C and CDC20 to form a ternary complex that can activate the M-A
checkpoint to arrest the M-A transition of a normal cell, if there
exists abnormal segregation of chromatin. However, for atypical
cells, the overproduction of E2F1, which is the transcription
factor of MAD2L1, might influence the formation of the
MAD2L1-APC/C-CDC20 ternary complex and, thus, fail to activate the
M-A checkpoint of the cell, ultimately resulting in the production
of atypical cells with aneuploidy (Fig.
6) (58).
In conclusion, the aforementioned speculations
require further experimental validation. The p53 signaling pathway
warrants further investigation, with the aim of finding novel and
targeted therapies for SCLC, as well as tumor markers, and
ultimately to promote a breakthrough in the treatment of LC.
Acknowledgements
This study was supported by the Jiangsu Postdoctoral
Science Foundation (no. 1301140c), and the Jiangsu University for
Advanced Professionals (no. 1281330021).
Glossary
Abbreviations
Abbreviations:
|
SCLC
|
small cell lung cancer
|
|
GEO
|
Gene Expression Omnibus
|
|
GO
|
Gene Ontology
|
|
PPI
|
protein-protein interaction
|
|
NCBI
|
National Center of Biotechnology
Information
|
|
RMA
|
Robust Multiarray Average
|
|
FDR
|
false discovery rate
|
|
BP
|
biological process
|
|
CC
|
cellular component
|
|
MF
|
molecular function
|
References
|
1
|
Sutherland KD, Proost N, Brouns I,
Adriaensen D, Song JY and Berns A: Cell of origin of small cell
lung cancer: Inactivation of Trp53 and Rb1 in distinct cell types
of adult mouse lung. Cancer Cell. 19:754–764. 2011. View Article : Google Scholar : PubMed/NCBI
|
|
2
|
Byers LA and Rudin CM: Small cell lung
cancer: Where do we go from here? Cancer. 121:664–672. 2015.
View Article : Google Scholar : PubMed/NCBI
|
|
3
|
Devesa SS, Bray F, Vizcaino AP and Parkin
DM: International lung cancer trends by histologic type:
Male:female differences diminishing and adenocarcinoma rates
rising. Int J Cancer. 117:294–299. 2005. View Article : Google Scholar : PubMed/NCBI
|
|
4
|
Herbst RS, Heymach JV and Lippman SM: Lung
cancer. N Engl J Med. 359:1367–1380. 2008. View Article : Google Scholar : PubMed/NCBI
|
|
5
|
Arcaro A: Targeted therapies for small
cell lung cancer: Where do we stand? Crit Rev Oncol Hematol.
95:154–164. 2015. View Article : Google Scholar : PubMed/NCBI
|
|
6
|
Simon M, Argiris A and Murren JR: Progress
in the therapy of small cell lung cancer. Crit Rev Oncol Hematol.
49:119–133. 2004. View Article : Google Scholar : PubMed/NCBI
|
|
7
|
Früh M, De Ruysscher D, Popat S, Crinò L,
Peters S and Felip E; ESMO Guidelines Working Group, : Small-cell
lung cancer (SCLC): ESMO clinical practice guidelines for
diagnosis, treatment and follow-up. Ann Oncol. 24:99–105. 2013.
View Article : Google Scholar
|
|
8
|
Agra Y, Pelayo M, Sacristan M, Sacristán
A, Serra C and Bonfill X: Chemotherapy versus best supportive care
for extensive small cell lung cancer. Cochrane Database Syst Rev:
CD001990. 2003. View Article : Google Scholar
|
|
9
|
Argiris A and Murren JR: Staging and
clinical prognostic factors for small-cell lung cancer. Cancer J.
7:437–447. 2001.PubMed/NCBI
|
|
10
|
Peifer M, Fernández-Cuesta L, Sos ML,
George J, Seidel D, Kasper LH, Plenker D, Leenders F, Sun R, Zander
T, et al: Integrative genome analyses identify key somatic driver
mutations of small-cell lung cancer. Nat Genet. 44:1104–1110. 2012.
View Article : Google Scholar : PubMed/NCBI
|
|
11
|
Gustafsson BI, Kidd M, Chan A,
Malfertheiner MV and Modlin IM: Bronchopulmonary neuroendocrine
tumors. Cancer. 113:5–21. 2008. View Article : Google Scholar : PubMed/NCBI
|
|
12
|
Lassen U, Osterlind K, Hansen M,
Dombernowsky P, Bergman B and Hansen HH: Long-term survival in
small-cell lung cancer: Posttreatment characteristics in patients
surviving 5 to 18+ years-an analysis of 1,714 consecutive patients.
J Clin Oncol. 13:1215–1220. 1995. View Article : Google Scholar : PubMed/NCBI
|
|
13
|
Rudin CM, Durinck S, Stawiski EW, Poirier
JT, Modrusan Z, Shames DS, Bergbower EA, Guan Y, Shin J, Guillory
J, et al: Comprehensive genomic analysis identifies SOX2 as a
frequently amplified gene in small-cell lung cancer. Nat Genet.
44:1111–1116. 2012. View
Article : Google Scholar : PubMed/NCBI
|
|
14
|
Chute JP, Chen T, Feigal E, Simon R and
Johnson BE: Twenty years of phase III trials for patients with
extensive-stage small-cell lung cancer: Perceptible progress. J
Clin Oncol. 17:1794–1801. 1999. View Article : Google Scholar : PubMed/NCBI
|
|
15
|
Jahchan NS, Lim JS, Bola B, Morris K,
Seitz G, Tran KQ, Xu L, Trapani F, Morrow CJ, Cristea S, et al:
Identification and targeting of long-term tumor-propagating cells
in small cell lung cancer. Cell Rep. 16:644–656. 2016. View Article : Google Scholar : PubMed/NCBI
|
|
16
|
Zhang Y, Wang H, Wang J, Bao L, Wang L,
Huo J and Wang X: Global analysis of chromosome 1 genes among
patients with lung adenocarcinoma, squamous carcinoma, large-cell
carcinoma, small-cell carcinoma, or non-cancer. Cancer Metastasis
Rev. 34:249–264. 2015. View Article : Google Scholar : PubMed/NCBI
|
|
17
|
Vermeulen K, Van Bockstaele DR and
Berneman ZN: The cell cycle: A review of regulation, deregulation
and therapeutic targets in cancer. Cell Prolif. 36:131–149. 2003.
View Article : Google Scholar : PubMed/NCBI
|
|
18
|
Stillman DJ: Dancing the cell cycle
two-step: Regulation of yeast G1-cell-cycle genes by chromatin
structure. Trends Biochem Sci. 38:467–475. 2013. View Article : Google Scholar : PubMed/NCBI
|
|
19
|
Butz H, Németh K, Czenke D, Likó I,
Czirják S, Zivkovic V, Baghy K, Korbonits M, Kovalszky I, Igaz P,
et al: Systematic investigation of expression of G2/M transition
genes reveals CDC25 alteration in nonfunctioning pituitary
adenomas. Pathol Oncol Res. 23:633–641. 2017. View Article : Google Scholar : PubMed/NCBI
|
|
20
|
Zhou J, Tian Y, Li J, Lu B, Sun M, Zou Y,
Kong R, Luo Y, Shi Y, Wang K and Ji G: miR-206 is down-regulated in
breast cancer and inhibits cell proliferation through the
up-regulation of cyclinD2. Biochem Biophys Res Commun. 433:207–212.
2013. View Article : Google Scholar : PubMed/NCBI
|
|
21
|
Li X, Liu F, Lin B, Luo H, Liu M, Wu J, Li
C, Li R, Zhang X, Zhou K and Ren D: miR-150 inhibits proliferation
and tumorigenicity via retarding G1/S phase transition in
nasopharyngeal carcinoma. Int J Oncol. 50:1097–1108. 2017.
View Article : Google Scholar
|
|
22
|
Gorlova OY, Demidenko EI, Amos CI and
Gorlov IP: Downstream targets of GWAS-detected genes for breast,
lung and prostate and colon cancer converge to G1/S transition
pathway. Hum Mol Genet. 26:1465–1471. 2017. View Article : Google Scholar : PubMed/NCBI
|
|
23
|
Rao PC, Begum S, Sahai M and Sriram DS:
Coptisine-induced cell cycle arrest at G2/M phase and reactive
oxygen species-dependent mitochondria-mediated apoptosis in
non-small-cell lung cancer A549 cells. Tumour Biol. 39:2017.
View Article : Google Scholar
|
|
24
|
Lu TP, Tsai MH, Lee JM, Hsu CP, Chen PC,
Lin CW, Shih JY, Yang PC, Hsiao CK, Lai LC and Chuang EY:
Identification of a novel biomarker, SEMA5A, for non-small cell
lung carcinoma in nonsmoking women. Cancer Epidemiol Biomarkers
Prev. 19:2590–2597. 2010. View Article : Google Scholar : PubMed/NCBI
|
|
25
|
Irizarry RA, Hobbs B, Collin F,
Beazer-Barclay YD, Antonellis KJ, Scherf U and Speed TP:
Exploration, normalization, and summaries of high density
oligonucleotide array probe level data. Biostatistics. 4:249–264.
2003. View Article : Google Scholar : PubMed/NCBI
|
|
26
|
Team RRDC: A language and environment for
statistical computing. Computing. 1:12–21. 2013.
|
|
27
|
Ashburner M, Ball CA, Blake JA, Botstein
D, Butler H, Cherry JM, Davis AP, Dolinski K, Dwight SS, Eppig JT,
et al: Gene ontology: Tool for the unification of biology. Nat
Genet. 25:25–29. 2000. View
Article : Google Scholar : PubMed/NCBI
|
|
28
|
Altermann E and Klaenhammer TR:
PathwayVoyager: Pathway mapping using the kyoto encyclopedia of
genes and genomes (KEGG) database. BMC Genomics. 6:602005.
View Article : Google Scholar : PubMed/NCBI
|
|
29
|
Huang DW, Sherman BT, Tan Q, Kir J, Liu D,
Bryant D, Guo Y, Stephens R, Baseler MW, Lane HC and Lempicki RA:
DAVID bioinformatics resources: Expanded annotation database and
novel algorithms to better extract biology from large gene lists.
Nucleic Acids Res. 35(Web Server issue): W169–W175. 2007.
View Article : Google Scholar : PubMed/NCBI
|
|
30
|
Peng WX, Wan YY, Gong AH, Ge L, Jin J, Xu
M and Wu CY: Egr-1 regulates irradiation-induced autophagy through
Atg4B to promote radioresistance in hepatocellular carcinoma cells.
Oncogenesis. 6:e2922017. View Article : Google Scholar : PubMed/NCBI
|
|
31
|
Szklarczyk D, Franceschini A, Kuhn M,
Simonovic M, Roth A, Minguez P, Doerks T, Stark M, Muller J, Bork
P, et al: The STRING database in 2011: Functional interaction
networks of proteins, globally integrated and scored. Nucleic Acids
Res. 39(Database Issue): D561–D568. 2011. View Article : Google Scholar : PubMed/NCBI
|
|
32
|
Shannon P, Markiel A, Ozier O, Baliga NS,
Wang JT, Ramage D, Amin N, Schwikowski B and Ideker T: Cytoscape: A
software environment for integrated models of biomolecular
interaction networks. Genome Res. 13:2498–2504. 2003. View Article : Google Scholar : PubMed/NCBI
|
|
33
|
Hollstein M, Rice K, Greenblatt MS, Soussi
T, Fuchs R, Sørlie T, Hovig E, Smith-Sørensen B, Montesano R and
Harris CC: Database of p53 gene somatic mutations in human tumors
and cell lines. Nucleic Acids Res. 22:3551–3555. 1994.PubMed/NCBI
|
|
34
|
Vaughan C, Pearsall I, Yeudall A, Deb SP
and Deb S: p53: Its mutations and their impact on transcription.
Subcell Biochem. 85:71–90. 2014. View Article : Google Scholar : PubMed/NCBI
|
|
35
|
Speidel D: The role of DNA damage
responses in p53 biology. Arch Toxicol. 89:501–517. 2015.
View Article : Google Scholar : PubMed/NCBI
|
|
36
|
Acedo P and Zawacka-Pankau J: p53 family
members-important messengers in cell death signaling in
photodynamic therapy of cancer? Photochem Photobiol Sci.
14:1390–1396. 2015. View Article : Google Scholar : PubMed/NCBI
|
|
37
|
Pflaum J, Schlosser S and Müller M: p53
family and cellular stress responses in cancer. Front Oncol.
4:2852014. View Article : Google Scholar : PubMed/NCBI
|
|
38
|
Hussain SP and Harris CC: p53 biological
network: At the crossroads of the cellular-stress response pathway
and molecular carcinogenesis. J Nippon Med Sch. 73:54–64. 2006.
View Article : Google Scholar : PubMed/NCBI
|
|
39
|
Das S, Raj L, Zhao B, Bernstein A,
Aaronson SA and Lee SW: Hzf, a key modulator of p53 mediated
transcription, functions as a critical determinant of cell survival
and death upon genotoxic stress. Cell. 130:624–637. 2007.
View Article : Google Scholar : PubMed/NCBI
|
|
40
|
Han JA, Kim JI, Ongusaha PP, Hwang DH,
Ballou LR, Mahale A, Aaronson SA and Lee SW: p53-mediated induction
of Cox-2 counteracts p53- or genotoxic stress-induced apoptosis.
EMBO J. 21:5635–5644. 2002. View Article : Google Scholar : PubMed/NCBI
|
|
41
|
Egloff AM, Weissfeld J, Land SR and Finn
OJ: Evaluation of anticyclin B1 serum antibody as a diagnostic and
prognostic biomarker for lung cancer. Ann N Y Acad Sci. 1062:29–40.
2005. View Article : Google Scholar : PubMed/NCBI
|
|
42
|
Dutta A, Chandra R, Leiter LM and Lester
S: Cyclins as markers of tumor proliferation: Immunocytochemical
studies in breast cancer. Proc Natl Acad Sci USA. 92:pp. 5386–5390.
1995; View Article : Google Scholar : PubMed/NCBI
|
|
43
|
Kawamoto H, Koizumi H and Uchikoshi T:
Expression of the G2-M checkpoint regulators cyclin B1 and cdc2 in
nonmalignant and malignant human breast lesions: Immunocytochemical
and quantitative image analyses. Am J Pathol. 150:15–23.
1997.PubMed/NCBI
|
|
44
|
Winters ZE, Hunt NC, Bradburn MJ, Royds
JA, Turley H, Harris AL and Norbury CJ: Subcellular localisation of
cyclin B, Cdc2 and p21(WAF1/CIP1) in breast cancer. Association
with prognosis. Eur J Cancer. 37:2405–2412. 2001. View Article : Google Scholar : PubMed/NCBI
|
|
45
|
Crosby ME: Cell cycle: Principles of
control. Yale J Biol Med. 80:141–143. 2007.
|
|
46
|
Brown NR, Noble ME, Endicott JA and
Johnson LN: The structural basis for specificity of substrate and
recruitment peptides for cyclin-dependent kinases. Nat Cell Biol.
1:438–443. 1999. View
Article : Google Scholar : PubMed/NCBI
|
|
47
|
Müllers E, Silva Cascales H, Burdova K,
Macurek L and Lindqvist A: Residual Cdk1/2 activity after DNA
damage promotes senescence. Aging Cell. 16:575–584. 2017.
View Article : Google Scholar : PubMed/NCBI
|
|
48
|
Singh SK, Banerjee S, Acosta EP, Lillard
JW and Singh R: Resveratrol induces cell cycle arrest and apoptosis
with docetaxel in prostate cancer cells via a p53/p21WAF1/CIP1 and
p27KIP1 pathway. Oncotarget. 8:17216–17228. 2017. View Article : Google Scholar : PubMed/NCBI
|
|
49
|
Meraldi P, Lukas J, Fry AM, Bartek J and
Nigg EA: Centrosome duplication in mammalian somatic cells requires
E2F and Cdk2-cyclin A. Nat Cell Biol. 1:88–93. 1999. View Article : Google Scholar : PubMed/NCBI
|
|
50
|
Fang G, Yu H and Kirschner MW: The
checkpoint protein MAD2 and the mitotic regulator CDC20 form a
ternary complex with the anaphase-promoting complex to control
anaphase initiation. Genes Dev. 12:1871–1883. 1998. View Article : Google Scholar : PubMed/NCBI
|
|
51
|
Sudakin V, Chan GKT and Yen TJ: Checkpoint
inhibition of the APC/C in HeLa cells is mediated by a complex of
BUBR1, BUB3, CDC20, and MAD2. J Cell Biol. 154:925–936. 2001.
View Article : Google Scholar : PubMed/NCBI
|
|
52
|
Rajagopalan H and Lengauer C: Aneuploidy
and cancer. Nature. 432:338–341. 2004. View Article : Google Scholar : PubMed/NCBI
|
|
53
|
Kim HS, Park KH, Kim SA, Wen J, Park SW,
Park B, Gham CW, Hyung WJ, Noh SH, Kim HK and Song SY: Frequent
mutations of human Mad2, but not Bub1, in gastric cancers cause
defective mitotic spindle checkpoint. Mutat Res. 578:187–201. 2005.
View Article : Google Scholar : PubMed/NCBI
|
|
54
|
Yuan B, Xu Y, Woo JH, Wang Y, Bae YK, Yoon
DS, Wersto RP, Tully E, Wilsbach K and Gabrielson E: Increased
expression of mitotic checkpoint genes in breast cancer cells with
chromosomal instability. Clin Cancer Res. 12:405–410. 2006.
View Article : Google Scholar : PubMed/NCBI
|
|
55
|
Gao F, Ponte JF, Papageorgis P, Levy M,
Ozturk S, Lambert AW, Pan H, Chinnappan D, Cheng KH, Thiagalingam
A, et al: hBub1 deficiency triggers a novel p53 mediated early
apoptotic checkpoint pathway in mitotic spindle damaged cells.
Cancer Biol Ther. 8:627–635. 2009. View Article : Google Scholar : PubMed/NCBI
|
|
56
|
Nekova TS, Kneitz S, Einsele H, Bargou R
and Stuhler G: Silencing of CDK2, but not CDK1, separates mitogenic
from anti-apoptotic signaling, sensitizing p53 defective cells for
synthetic lethality. Cell Cycle. 15:3203–3209. 2016. View Article : Google Scholar : PubMed/NCBI
|
|
57
|
Tudzarova S, Mulholland P, Dey A, Stoeber
K, Okorokov AL and Williams GH: p53 controls CDC7 levels to
reinforce G1 cell cycle arrest upon genotoxic stress. Cell Cycle.
15:2958–2972. 2016. View Article : Google Scholar : PubMed/NCBI
|
|
58
|
May KM, Paldi F and Hardwick KG: Fission
yeast Apc15 Stabilizes MCC-Cdc20-APC/C complexes, ensuring
efficient Cdc20 ubiquitination and checkpoint arrest. Curr Biol.
27:1221–1228. 2017. View Article : Google Scholar : PubMed/NCBI
|