Introduction
Primary open-angle glaucoma (POAG) is a chronic
optic neuropathy that is progressive and generally bilateral, but
frequently asymmetric. It is estimated that ~80 million individuals
aged 40-80 years will have developed POAG by 2040 (1). Although the precise pathogenesis
remains to be elucidated, intraocular pressure (IOP) is considered
to be the most significant risk factor contributing to the
development and progression of the disease (2,3). As an
assumption of symmetrical variation of IOP between the right eye
and the left eye in healthy individuals was previously made
(4), a significant interocular
difference in IOP, also known as IOP asymmetry, has been recognized
as an additional risk factor for glaucoma (5,6). A
1-mmHg increase in IOP asymmetry between a pair of eyes is
correlated with a 17% increase in the risk for the development of
POAG (7).
Previous studies have explored the concordance of
IOP curves in glaucoma patients, only to obtain inconsistent
results (8–10). However, in these studies, the
enrolment criteria for the study populations of glaucoma patients
were not strict, as there was no limitation regarding the degree of
retinal nerve fiber layer (RNFL) defect or visual field defect.
Therefore, whether asymmetric glaucomatous damage is attributed to
asymmetric IOP curves remains elusive. A clinical evaluation of
symmetry in unilateral glaucoma may be able to demonstrate this
hypothesis. In addition, the IOP in an individual is not stable as
expected, and fluctuation in IOP is a well-known phenomenon. It
changes over short and long periods ranging from days to months
(11,12). Therefore, repeated IOP measurements,
particularly 24-h IOP readings, are an important factor to evaluate
the clinical course.
In the present study, glaucoma patients who had RNFL
defects and visual field defects in only one eye and a normal
fellow eye on examination were selected, which allowed for better
investigation of the association between the onset of glaucomatous
changes and potential disturbances in IOP. The fellow eyes were
compared to the corresponding glaucomatous eyes and the eyes of
healthy control subjects to test for any evidence of asymmetry in
24-h IOP curves. To the best of our knowledge, the present study
was the first to assess the concordance of 24-h IOP curves in
patients with untreated unilateral glaucoma.
Materials and methods
Study population
In the present observational study, all of the
participants who visited the Ophthalmology Clinic at Ruijin
Hospital between May 2016 and May 2017 were considered.
POAG patients enrolled in the present study had to
meet the following inclusion criteria: A typical glaucomatous optic
disc abnormality (diffuse or localized thinning of the
neuro-retinal rim, rim notching or inter-eye asymmetry of vertical
cup-to-disc ratio >0.2), corresponding glaucomatous visual field
loss and an open angle on gonioscopic examination (13). Unilateral POAG was defined as POAG
patients with a characteristic RNFL defect (Fig. 1A and B) and corresponding visual
field defect (Fig. 1C) in only one
eye and the other eye appearing normal on ophthalmic examination.
The eye with visual field defect was designated as the affected eye
and the other eye was designated as the fellow eye. All
participants were newly diagnosed POAG patients who had not
received any previous anti-glaucoma treatments. The population of
normal subjects, recruited from healthy individuals seeking
physical examination in the outpatient department, was comprised of
subjects without any evidence of RNFL defect and with normal visual
field test results. IOP measurements were >21 mmHg on different
days. Subjects with concomitant ocular diseases, severe systemic
disease, previous ocular surgery or any medical treatment for
glaucoma were excluded. Those whose central corneal thickness (CCT)
measured >650 or <450 µm were also excluded from the
study.
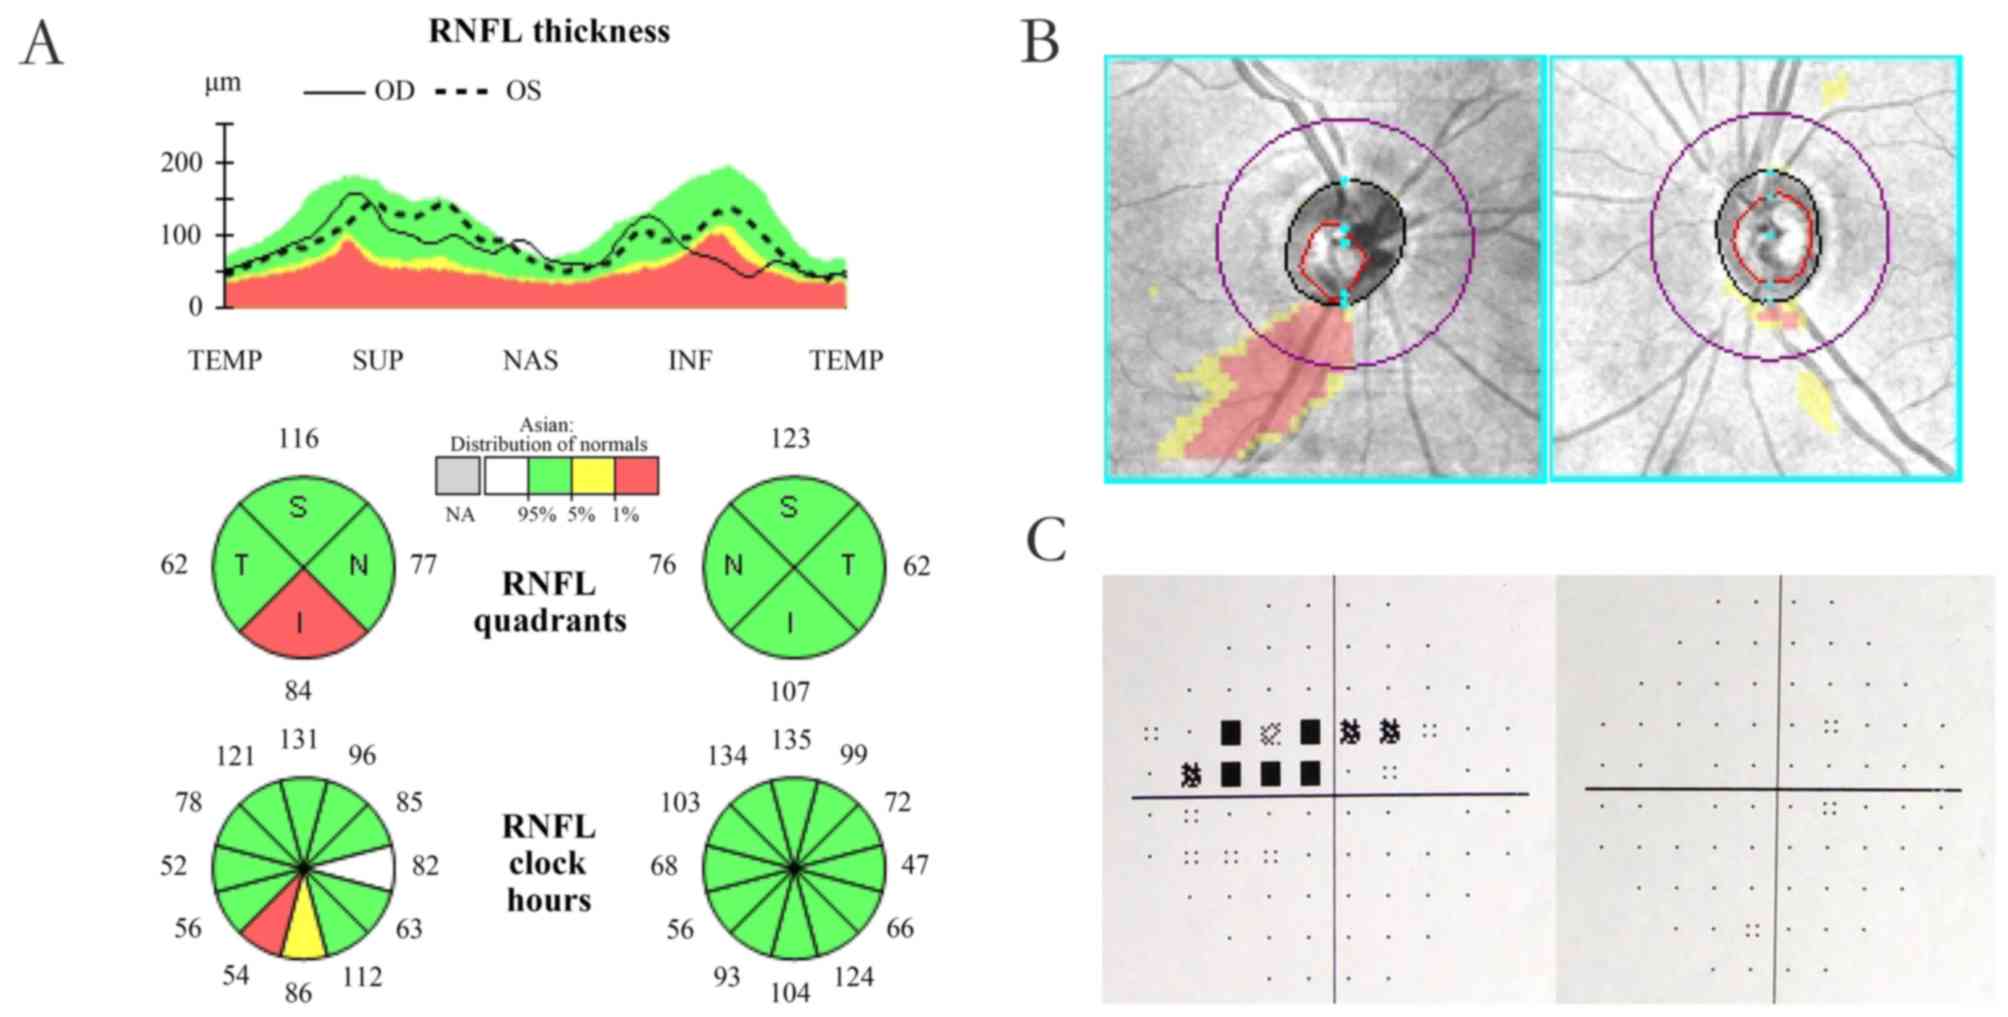 | Figure 1.(A) Example of unilateral primary
open-angle glaucoma exhibiting unilateral RNFL defect in quadrants
and clock hour map displaying unilateral RNFL defect. (B) Deviation
map indicating a unilateral RNFL defect. The right eye, also termed
as the affected eye, is on the left-hand side. The left eye, also
termed as the fellow eye, is on the right-hand side. (C) Test of a
Humphrey Field Analyzer presenting unilateral visual field defect.
The right eye, also termed as the affected eye, is on the left-hand
side. The left eye, also termed as the fellow eye, is on the
right-hand side. RNFL, retinal nerve fiber layer. The green areas
represent normal thickness of RNFL, the yellow areas represent
borderline thickness of RNFL and the red areas represent abnormal
thinning of RNFL. OD, right eye; OS, left eye; TEMP, temporal; SUP,
superior; NAS, nasal; INF, inferior. |
Ophthalmologic examination
All participants underwent a comprehensive
ophthalmologic examination, including best-corrected visual acuity,
slit-lamp examination, gonioscopy and fundus examination. CCT was
measured three times using an ocular biometer (IOL Master; Carl
Zeiss Meditec, Dublin, CA, USA), and the mean value of three
consecutive readings within a range of 5 µm was calculated for each
eye. A Humphrey Field Analyzer II (Carl Zeiss Meditec) was used for
visual field examinations, with the Swedish Interactive Threshold
Algorithm Fast strategy and the 30-2 test pattern (14). All participants had been subjected to
at least two prior visual field tests. Visual fields were defined
as normal if the Glaucoma Hemifield Test was within normal limits,
and the pattern deviation plots indicated no sign of one or more
clusters of three or more neighboring test points with a
sensitivity loss of >5 dB, or two adjacent test points with a
sensitivity loss of >10 dB. Two qualifying visual field tests
were performed to confirm the glaucomatous visual field loss.
Furthermore, all of the participants were tested by the same
operator with extensive experience in optical coherence tomography
(OCT) imaging (Cirrus HD-OCT; Carl Zeiss Meditec). The optic disc
cube 200×200 scan protocol was used to assess RNFL thickness.
24-h IOP measurements
All of the subjects were hospitalized to perform
24-h IOP measurements. The procedure began at 0:00 a.m. on the next
day after a quick adaption to the hospital environment. The IOP
measurements were performed every 2 h for the next 24 h by resident
ophthalmologists using an auto non-contact tonometer (NCT) (TX-F;
Canon, Tokyo, Japan). The IOP measurement was taken in the sitting
position and first obtained from the right eye at all time-points.
Repeated measurements of IOP were performed three times and the
mean values were calculated for further analysis. If one of the IOP
values was 3 mmHg higher than the other two, it was discarded and
repeated measurements were performed. Specifically, the IOP was
measured following resting of the patients in a horizontal position
during their sleeping hours. In order to obtain the routine IOP
curves, the patients were encouraged to remain active within the
hospital unit. In addition, their bedtime was not specified and
they were permitted to have naps as desired. Systemic
anti-hypertensive medications were not prohibited. Food and drink
were not restricted, including alcohol and caffeine.
Statistical analysis
SPSS 20.0 (IBM Corp., Armonk, NY, USA) was used for
statistical analysis. The Chi-squared test and the
independent-samples t-test were used for comparisons between the
two groups. The paired-samples t-test was used for comparison of
basic ophthalmologic parameters and all IOP values in the two study
groups. The Pearson's correlation coefficient (r) was used to
evaluate the strength of association in the paired IOP data.
Intra-class correlation coefficients (ICC) were calculated and
Bland-Altman plots were generated to determine the agreement of IOP
values between paired eyes. The interpretation of ICC values has
been described as follows: A value of <0.4 represents poor
agreement beyond chance, a value of 0.4-0.75 represents a moderate
agreement and a value of >0.75 represents excellent agreement
(15). A repeated-measures analysis
of variance (ANOVA) was performed to examine the bilateral symmetry
of the IOP over time. In addition, the frequency of the time
difference for peak IOP time-points between the two paired eyes was
analyzed using Fisher's Exact Test in the two study groups. The
frequency distribution of IOP differences between bilateral eyes
was calculated for all IOP values. The percentage of asymmetries of
≥2 and ≥3 mmHg was also calculated. When the minimum value was less
than 5, the Yate's continuity corrected Chi-square test was used.
In other circumstances, the Chi-square test was used. P<0.05 was
considered to indicate a statistically significant difference for
all comparisons.
Results
Patient characteristics
A total of 64 subjects comprising 32 newly diagnosed
POAG patients (15 males and 17 females) and 32 age-matched normal
subjects (13 males and 19 females) were enrolled in the final
analysis. All of the included subjects were native Han Chinese. The
average age was 47.69±15.22 (range, 26-74 years) for the glaucoma
patients and 47.41±15.47 (range, 23-77 years) for the normal
controls, respectively (t=0.073, P=0.942). There was also no
significant intergroup difference in the gender distribution
(χ2=1.890, P=0.169). In the glaucoma group, 14 right
eyes and 18 left eyes had visual field defects and abnormal RNFL
thickness. According to the peak IOP value throughout the 24-h
period, 22 cases were hypertension glaucoma and 10 were normal
tension glaucoma.
Opthalmologic data
The basic ophthalmologic data of the study groups
are summarized in Table I. No
inter-eye difference in CCT was present in either glaucoma subjects
(P=0.472) or normal subjects (P=0.162). As expected, the affected
eyes in the POAG group had worse visual field indices than the
fellow eyes [P<0.001 for mean deviation (MD) and pattern
standard deviation (PSD)], whereas no significant differences were
observed between the paired eyes in the normal group (P=0.299 for
MD, P=0.098 for PSD). Comparison of RNFL thickness in paired eyes
revealed similar results in the two groups.
 | Table I.Basic ophthalmologic data of the study
groups. |
Table I.
Basic ophthalmologic data of the study
groups.
|
| POAG | Normal |
|---|
|
|
|
|
|---|
| Variable | Affected eye | Fellow eye | P-value | Right eye | Left eye | P-value |
|---|
| CCT (µm) | 542.91±33.37 | 541.22±34.67 | 0.472 | 551.84±38.30 | 549.91±35.38 | 0.162 |
| MD (dB) | −5.41±4.67 | −1.05±1.11 | <0.001 | −0.79±0.90 | −0.96±1.00 | 0.299 |
| PSD (dB) | 5.95±3.93 | 1.82±0.40 | <0.001 | 1.59±0.29 | 1.68±0.30 | 0.098 |
| RNFL (µm) | 73.59±6.49 | 90.81±7.36 | <0.001 | 94.72±7.35 | 93.66±7.09 | 0.059 |
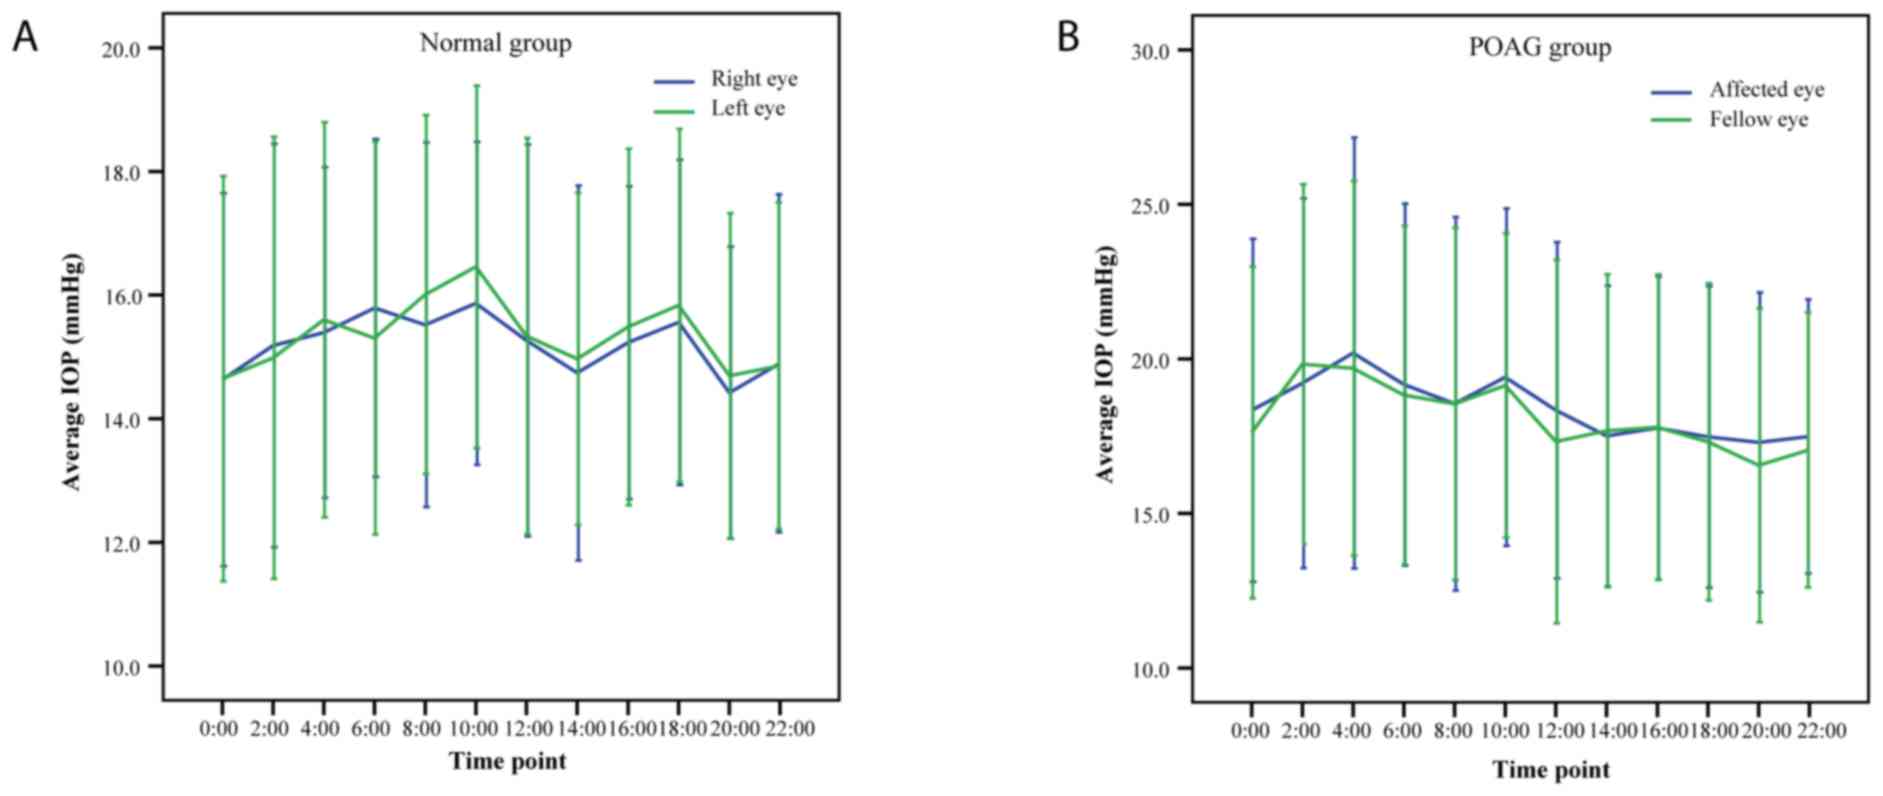
IOP profiles
Fig. 2 indicates the
24-h IOP rhythms in POAG patients and normal subjects. In the POAG
group, the minimum IOP was at 20:00 pm, exhibited a marked increase
at night and peaked at 4:00 a.m. In normal subjects, the lowest
mean IOP was observed at 8:00 p.m. and the highest mean IOP at
10:00 a.m. The detailed IOP profiles of paired eyes at each
time-point in each of the two study groups are listed in Tables II and III. There was no statistically
significant difference between paired eyes at any of the
time-points examined in the two groups (all P>0.05). The
correlation coefficients for paired IOP readings indicated that the
strength of association was moderate in the glaucoma group (r,
0.752-0.867) and the normal controls (r, 0.625-0.873). IOP readings
at each time-point exhibited high agreements in the glaucoma group
(ICC, 0.857-0.929) and the normal controls (ICC, 0.768-0.932).
| Table II.Comparison of intraocular pressure
between paired eyes in glaucoma patients. |
Table II.
Comparison of intraocular pressure
between paired eyes in glaucoma patients.
| Time-point (h) | Affected eye | Fellow eye | Inter-eye difference
(affected vs. unaffected) | P-value | r | ICC | 95% CI of ICC |
|---|
| 0:00 | 18.34±5.55 | 17.62±5.36 | 0.72±3.49 | 0.252 | 0.796 | 0.886 | (0.767,0.944) |
| 2:00 | 19.22±5.98 | 19.83±5.82 | −0.62±3.04 | 0.261 | 0.867 | 0.929 | (0.854,0.965) |
| 4:00 | 20.19±6.97 | 19.69±6.06 | 0.50±3.68 | 0.448 | 0.849 | 0.914 | (0.823,0.958) |
| 6:00 | 19.17±5.86 | 18.83±5.47 | 0.34±3.36 | 0.567 | 0.827 | 0.904 | (0.803,0.953) |
| 8:00 | 18.55±6.04 | 18.55±5.70 | 0.00±3.53 | 0.996 | 0.821 | 0.901 | (0.797,0.952) |
| 10:00 | 19.41±5.46 | 19.14±4.92 | 0.27±3.33 | 0.651 | 0.799 | 0.886 | (0.766,0.944) |
| 12:00 | 18.34±5.44 | 17.33±5.88 | 1.01±4.01 | 0.163 | 0.752 | 0.857 | (0.707,0.930) |
| 14:00 | 17.51±4.86 | 17.68±5.06 | −0.17±3.05 | 0.761 | 0.812 | 0.896 | (0.787,0.949) |
| 16:00 | 17.77±4.90 | 17.79±4.94 | −0.03±3.05 | 0.963 | 0.807 | 0.893 | (0.782,0.948) |
| 18:00 | 17.48±4.87 | 17.32±5.13 | 0.17±2.78 | 0.738 | 0.847 | 0.916 | (0.829,0.959) |
| 20:00 | 17.30±4.85 | 16.56±5.07 | 0.74±3.08 | 0.184 | 0.808 | 0.893 | (0.782,0.948) |
| 22:00 | 17.49±4.43 | 17.06±4.45 | 0.43±2.87 | 0.402 | 0.791 | 0.883 | (0.761,0.943) |
| Table III.Comparison of intraocular pressure
between paired eyes in normal subjects. |
Table III.
Comparison of intraocular pressure
between paired eyes in normal subjects.
| Time-point (h) | Right eye | Left eye | Inter-eye
difference (right vs. left) | P-value | r | ICC | 95% CI of ICC |
|---|
| 0:00 | 14.63±3.02 | 14.65±3.28 | −0.02±2.07 | 0.966 | 0.786 | 0.879 | (0.752,0.941) |
| 2:00 | 15.18±3.26 | 14.98±3.57 | 0.20±2.39 | 0.640 | 0.758 | 0.861 | (0.714,0.932) |
| 4:00 | 15.39±2.68 | 15.60±3.19 | −0.21±2.51 | 0.645 | 0.648 | 0.779 | (0.547,0.892) |
| 6:00 | 15.79±2.73 | 15.30±3.18 | 0.49±2.35 | 0.251 | 0.692 | 0.813 | (0.616,0.909) |
| 8:00 | 15.52±2.95 | 16.01±2.90 | −0.49±1.48 | 0.070 | 0.873 | 0.932 | (0.860,0.967) |
| 10:00 | 15.87±2.61 | 16.46±2.93 | −0.59±1.89 | 0.087 | 0.774 | 0.869 | (0.732,0.936) |
| 12:00 | 15.27±3.17 | 15.33±3.21 | −0.07±1.97 | 0.845 | 0.808 | 0.894 | (0.783,0.948) |
| 14:00 | 14.74±3.03 | 14.97±2.69 | −0.23±1.85 | 0.490 | 0.798 | 0.884 | (0.762,0.943) |
| 16:00 | 15.23±2.53 | 15.48±2.88 | −0.25±1.81 | 0.434 | 0.784 | 0.875 | (0.744,0.939) |
| 18:00 | 15.56±2.63 | 15.83±2.85 | −0.28±2.38 | 0.518 | 0.625 | 0.768 | (0.525,0.887) |
| 20:00 | 14.42±2.36 | 14.70±2.63 | −0.28±1.84 | 0.404 | 0.733 | 0.843 | (0.678,0.923) |
| 22:00 | 14.90±2.73 | 14.86±2.64 | 0.04±1.98 | 0.908 | 0.729 | 0.843 | (0.678,0.923) |
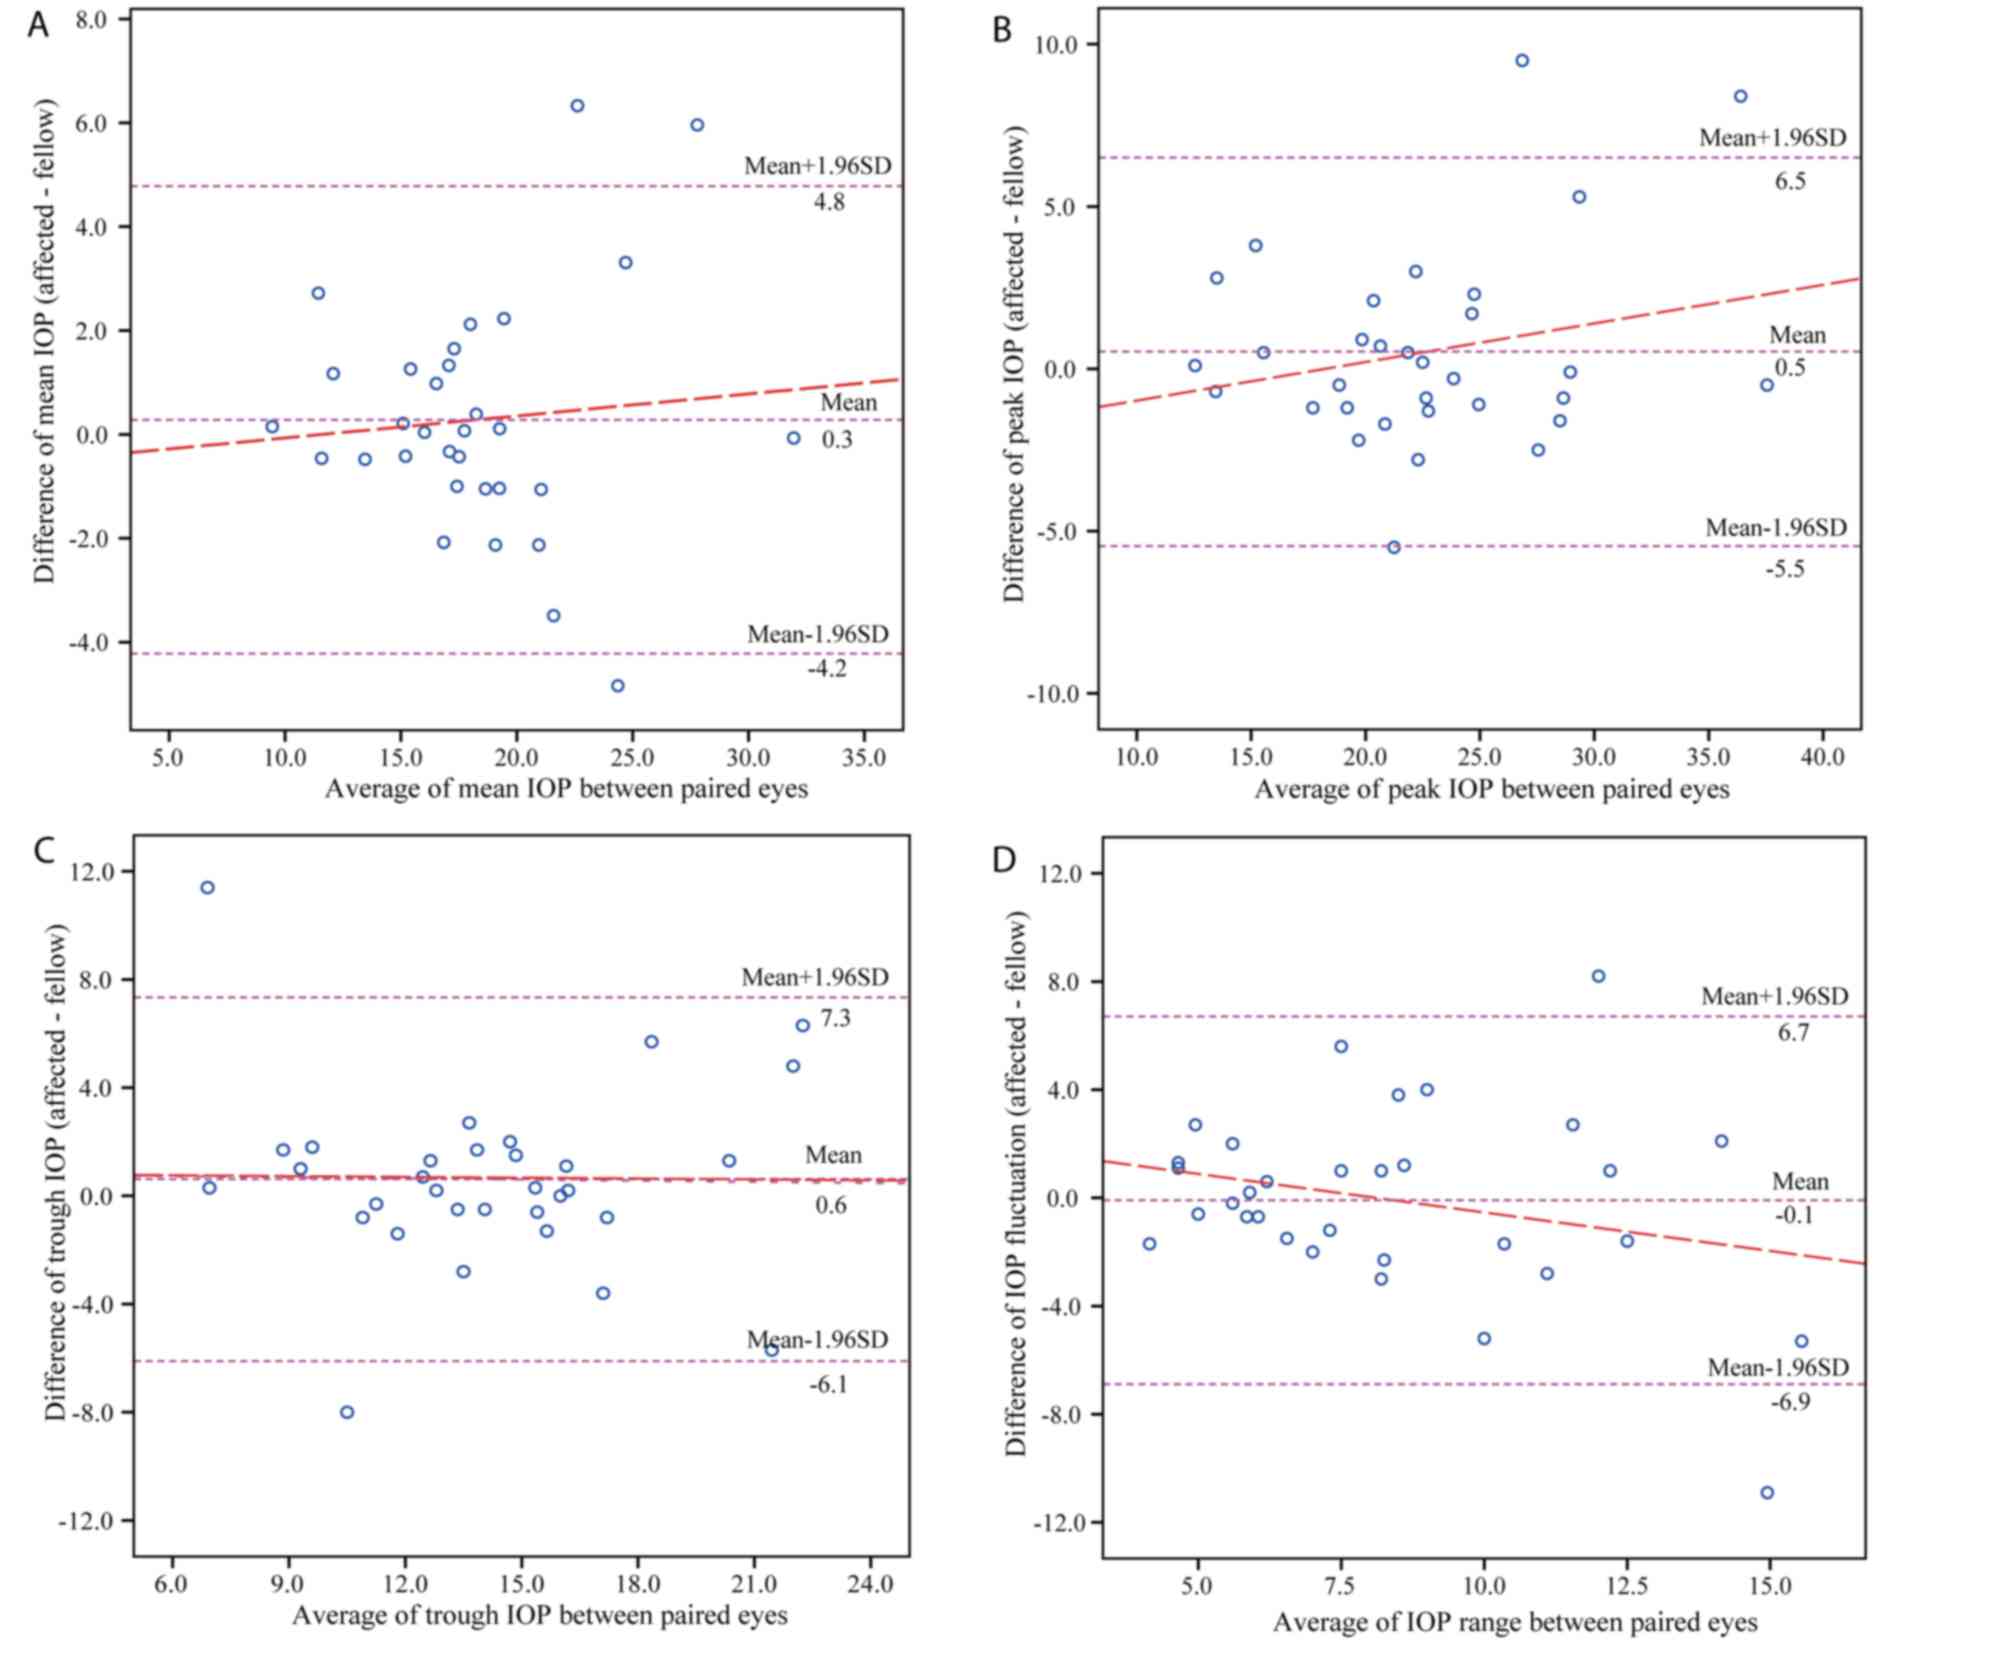
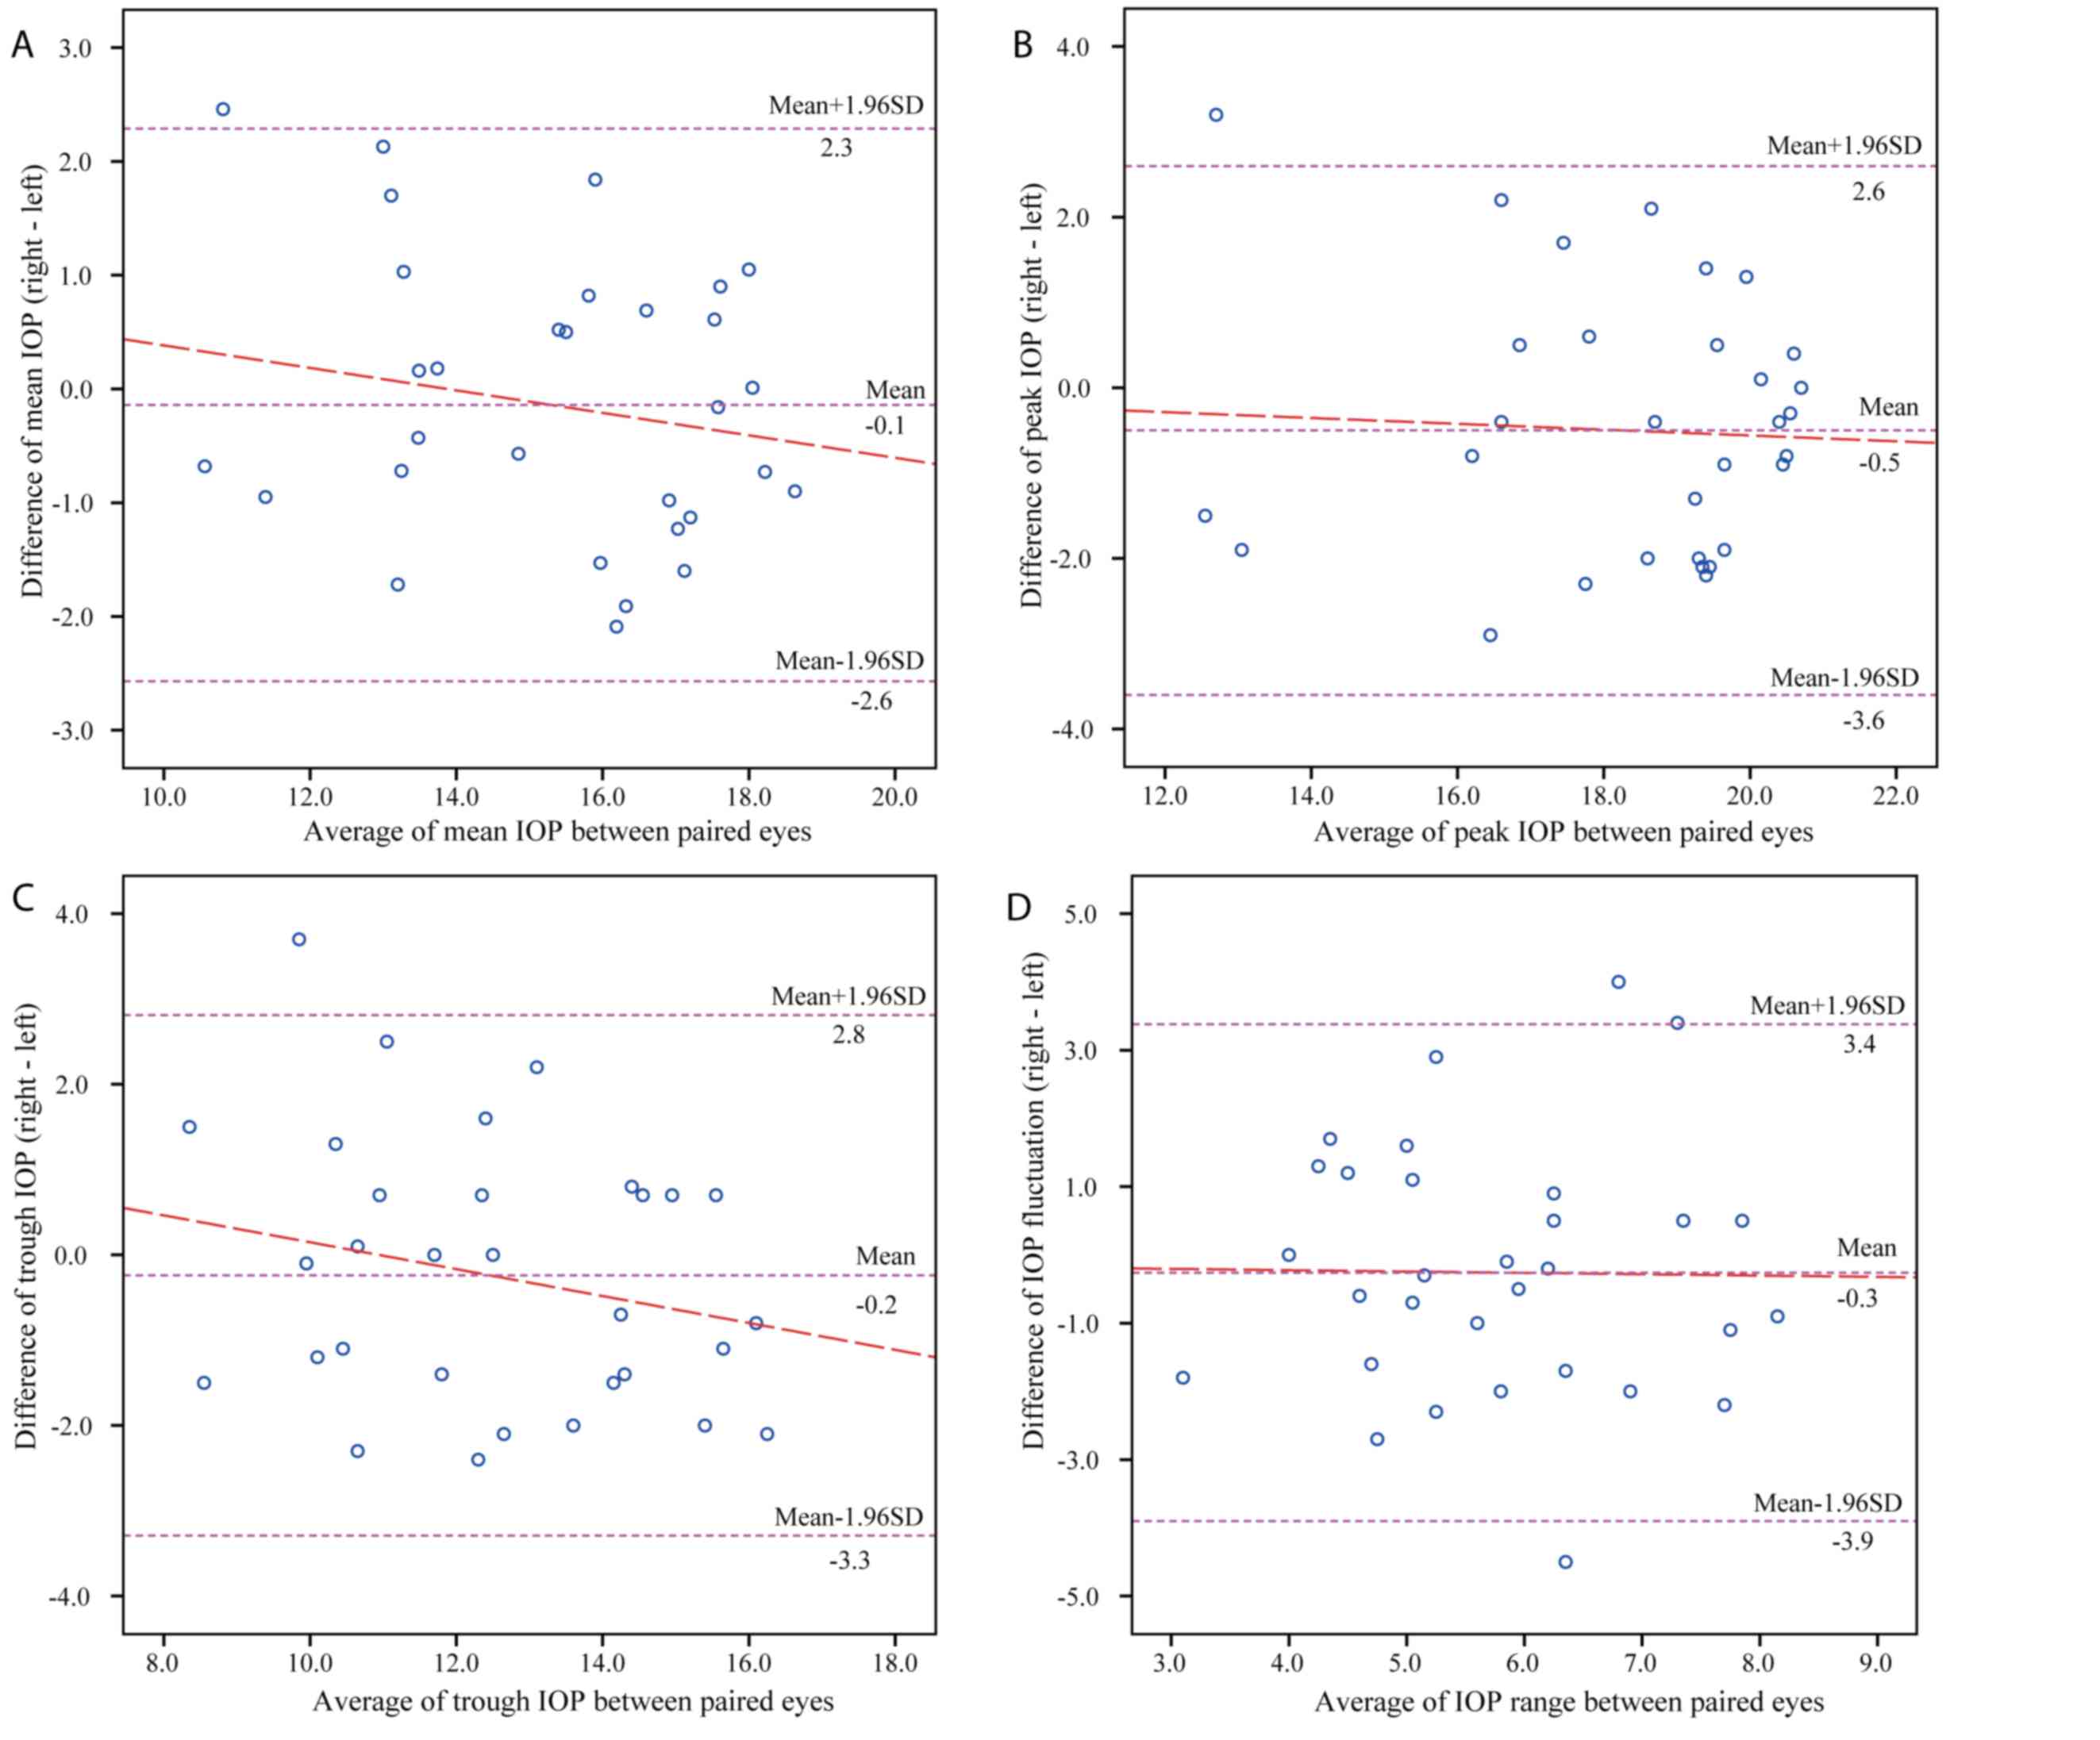
Differences in IOP between paired
eyes
The mean IOP, peak IOP, trough IOP and IOP
fluctuation were not significantly different between the paired
eyes in unilateral glaucoma patients (P=0.492, P=0.338, P=0.318,
P=0.883, respectively; Table IV).
Furthermore, the mean IOP, peak IOP and trough IOP were in high
agreement between paired eyes in glaucoma patients (ICC,
0.816-0.940). Similar results were observed in the normal controls.
Figs. 3 and 4 display the Bland-Altman plots comparing
the parameters of 24-h IOP profiles between the paired eyes in the
POAG and normal group, respectively. In patients with unilateral
glaucoma, the mean difference between paired eyes was 0.28 mmHg for
the mean IOP, 0.53 mmHg for the peak IOP, 0.62 mmHg for the trough
IOP and −0.09 mmHg for IOP fluctuations, while that in normal
controls was −0.14 mmHg for the mean IOP, −0.50 mmHg for the peak
IOP, −0.24 mmHg for the trough IOP and −0.26 mmHg for IOP
fluctuations.
| Table IV.Comparison of the 24-h IOP curves
between paired eyes in the study groups. |
Table IV.
Comparison of the 24-h IOP curves
between paired eyes in the study groups.
| Parameter | Affected eye or
right eye | Fellow eye or left
eye | Inter-eye
differencea | P-value | r | ICC | 95% CI of ICC |
|---|
| Average IOP |
|
|
|
|
|
|
|
| POAG | 18.40±4.91 | 18.12±4.72 | 0.28±2.30 | 0.492 | 0.887 | 0.940 | (0.877,0.971) |
| Normal | 15.21±2.26 | 15.36±2.47 | −0.14±1.24 | 0.518 | 0.865 | 0.926 | (0.848,0.964) |
| Peak IOP |
|
|
|
|
|
|
|
| POAG | 22.92±6.43 | 22.39±5.75 | 0.53±3.05 | 0.338 | 0.880 | 0.933 | (0.863,0.967) |
| Normal | 18.02±2.37 | 18.52±2.45 | −0.50±1.58 | 0.083 | 0.785 | 0.880 | (0.753,0.941) |
| Trough IOP |
|
|
|
|
|
|
|
| POAG | 14.54±4.32 | 13.92±4.37 | 0.62±3.43 | 0.318 | 0.689 | 0.816 | (0.622,0.910) |
| Normal | 12.35±2.22 | 12.59±2.55 | −0.24±1.56 | 0.389 | 0.795 | 0.881 | (0.757,0.942) |
| IOP
fluctuation |
|
|
|
|
|
|
|
| POAG | 8.38±3.19 | 8.47±3.99 | −0.09±3.47 | 0.883 | 0.553 | 0.701 | (0.388,0.854) |
| Normal | 5.68±1.55 | 5.93±1.57 | −0.26±1.86 | 0.435 | 0.293 | 0.454 | (−0.119,0.733) |
24-h IOP patterns in the two
groups
To further characterize the concordance between the
two paired eyes, repeated-measures ANOVA was performed. The results
indicated that IOPs changed significantly over time in the two
study groups (both P<0.001), and there was no significant
eye-time interaction in either POAG patients (P=0.837) or normal
subjects (P=0.897). This suggested that the 24-h IOP pattern of the
paired eyes had parallel profiles in the two study groups.
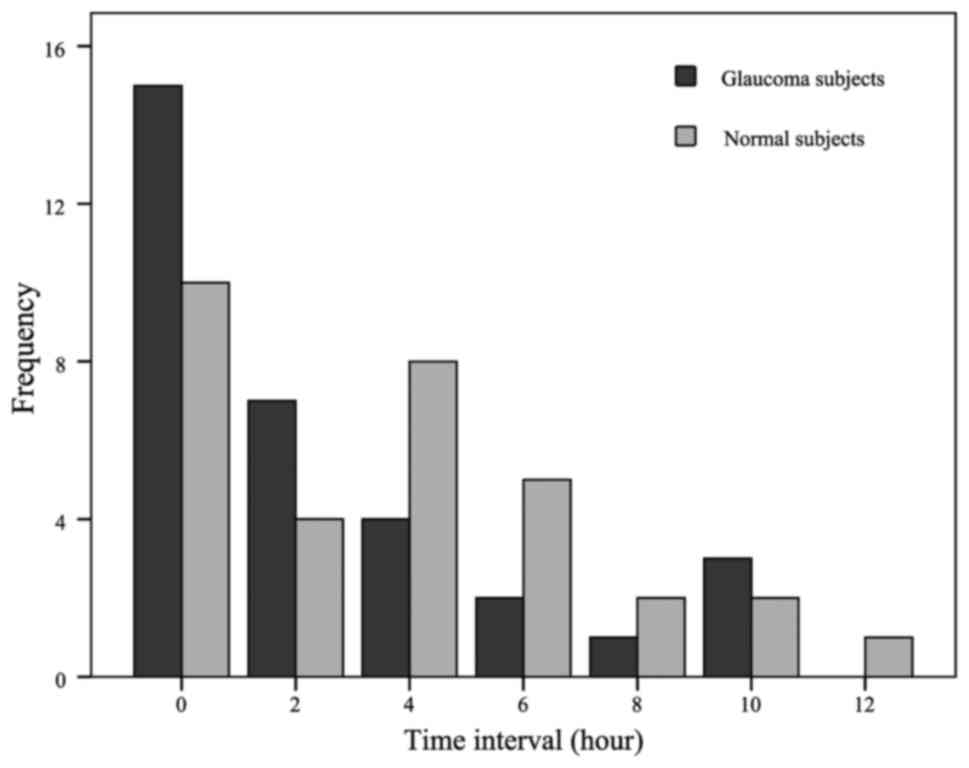
IOP peak-interval timing and
distribution of differences between pairs of eyes
Fig. 5 presents the
distribution of eyes at different time intervals for peak IOP
time-points between the paired eyes in the two groups. There was no
significant difference in peak-interval timing between the two
groups (Fisher's exact test, P=0.434), indicating that the
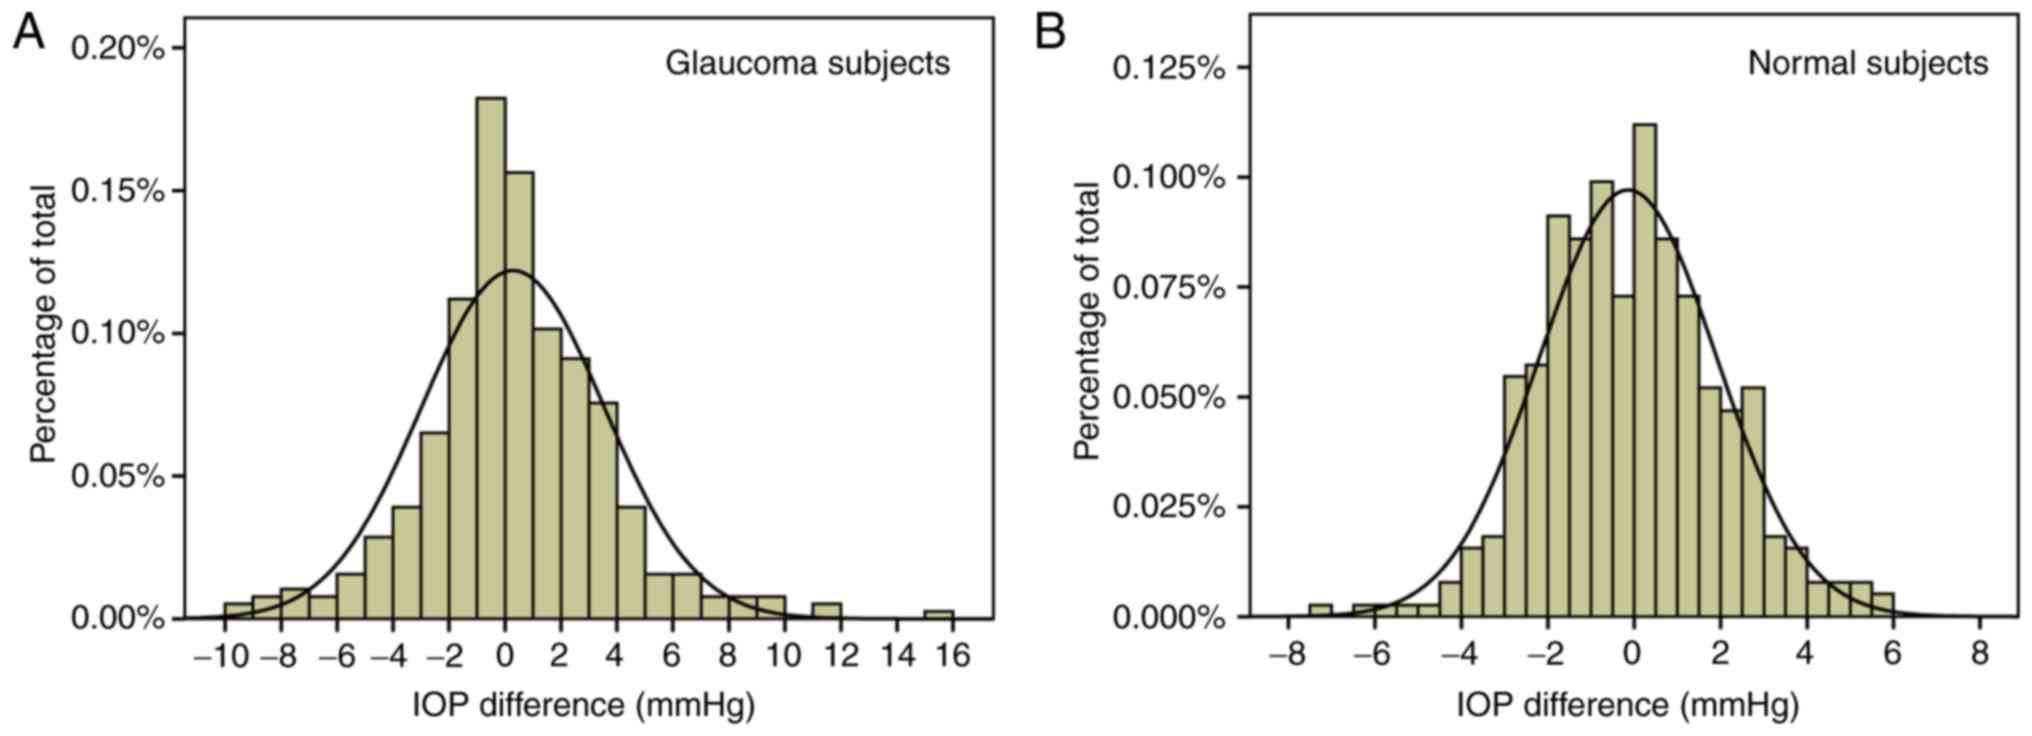
intervals of peak IOP time-points were similar. Fig. 6 illustrates the frequency
distributions of IOP differences for all IOPs in patients with
unilateral POAG and normal subjects. The distribution in the
unilateral POAG group was wider than that in the normal controls,
suggesting greater asymmetry of a single pair of IOP measurements
in unilateral glaucoma patients.
POAG patients have an increased
frequency of absolute IOP differences of ≥2 and ≥3 mmHg between
paired eyes
The proportions of cases with absolute differences
of ≥2 and ≥3 mmHg between paired eyes in the different study groups
are presented in Table V. It should
be noted that the proportion of mean IOPs with absolute differences
of ≥2 mmHg between paired eyes in the unilateral POAG group was
significantly higher than that in the healthy individuals
(χ2=4.480, P=0.034). In addition, there were
significantly higher proportions of all IOPs with absolute
differences of ≥2 and ≥3 mmHg in the unilateral POAG group compared
with those in the normal control group (χ2=21.960,
P<0.001; χ2=56.403, P<0.001, respectively). With
regard to peak IOPs, trough IOPs and IOP fluctuations, the POAG
group had higher proportions of cases with absolute IOP differences
of ≥2 and ≥3 mmHg, but the differences were not statistically
significant (all P>0.05).
| Table V.Proportions of subjects with absolute
IOP differences of ≥2 and ≥3 mmHg between paired eyes in the POAG
and normal groups (%). |
Table V.
Proportions of subjects with absolute
IOP differences of ≥2 and ≥3 mmHg between paired eyes in the POAG
and normal groups (%).
|
| Unilateral
POAG | Normal
subjects |
|---|
|
|
|
|
|---|
| Parameter | ≥2 mmHg | ≥3 mmHg | ≥2 mmHg | ≥3 mmHg |
|---|
| All IOPs | 46.09a | 29.69a | 35.68 | 12.50 |
| Mean IOP | 34.38b | 15.63 |
9.38 |
0.00 |
| Peak IOP | 37.50 | 18.75 | 34.38 |
0.03 |
| Trough IOP | 31.25 | 21.88 | 28.13 |
0.03 |
| IOP
fluctuation | 46.88 | 25.00 | 28.13 |
0.09 |
Discussion
It is generally thought that IOPs between right and
left eyes in healthy individuals are symmetric, and this hypothesis
is commonly based on clinical experience and research studies.
Asymmetric IOP results between the paired eyes have been considered
as a hallmark of glaucoma (16).
However, most of the early studies that analyzed the symmetry of
the IOP focused on diurnal IOP curves of bilateral glaucoma
patients. The correlation between asymmetric IOP and asymmetric
visual field defects remains to be elucidated. To further
characterize the symmetry and concordance of IOP variations between
paired eyes in glaucoma, the 24-h IOP curves of untreated
unilateral glaucoma patients were recorded in the present
study.
The present results indicated no statistically
significant differences between all IOPs, as well as the mean,
peak, trough IOPs or IOP fluctuations of the paired eyes within a
24-h period in the two groups. The strength of association of all
IOPs was moderate and IOP readings at each time-point were in high
agreement in each study group. The repeated-measures ANOVA
indicated that the 24-h IOP curves of the paired eyes had parallel
profiles in the two groups. Based on the above results, a
preliminary conclusion may be drawn that the 24-h IOP curves were
similar and concordant between paired eyes in unilateral open-angle
glaucoma. However, certain subtle differences between the 24-h IOP
curves of glaucoma patients and normal subjects were noted. The
frequency distribution of differences in all IOPs in unilateral
POAG patients was wider than that in normal subjects, and
unilateral glaucoma patients had a significantly higher proportion
of all IOPs with absolute differences of ≥2 and ≥3 mmHg.
Previous studies have also examined the concordance
of 24-h IOP curves between paired eyes of glaucoma patients.
Chiseliţă et al (17)
reported that the nictemeral variation of IOP between paired eyes
in glaucoma patients were largely concordant and the 24-h IOP
curves of bilateral eyes exhibited parallel changes. The study also
concluded that IOP differences of ≥3 mmHg were present in 20.53%
glaucoma patients with therapeutically uncontrolled IOP, which was
in accordance with the present results. Dinn et al (8) reported that the diurnal IOP variations
were largely concordant in untreated POAG patients as well as in
POAG patients treated with the same IOP-lowering medications on
each of their eyes, which was compatible with the present results.
Sit et al (9) also indicated
that the strength of association between right and left IOPs for
untreated glaucoma patients was moderate. However, Liu and Weinreb
(10) indicated that the strength of
association in untreated POAG patients was significantly weaker
than that in healthy individuals. One possible reason for this
inconsistent result may be that the glaucoma patients in their
study were part of an older population.
The results of the present study supported a
presumed symmetry in the 24-h IOP curves between the paired eyes in
newly diagnosed untreated POAG patients with monocular visual field
defects, suggesting that an asymmetric IOP curve may not be a
prerequisite for asymmetric visual field loss in the development of
the disease. However, throughout the entire 24 h, the IOP in
general was slightly higher in the affected eyes than in the fellow
eyes, which means that an increased IOP may be a major risk factor
in the development and progression of POAG. However, there is no
means of determining the IOPs at the time-point at which the damage
occurred. Furthermore, other factors may contribute to the
asymmetric visual field loss, including vascular disorders. For
instance, Plange et al (18)
reported that POAG patients with asymmetric glaucomatous visual
field defects exhibited asymmetric flow velocities of the central
retinal artery and the ophthalmic artery.
In the present study, patients with unilateral
glaucoma exhibited a wide variation in the frequency distribution
of IOP differences and had significantly higher proportions of all
IOPs with absolute differences of ≥2 and ≥3 mmHg, suggesting that
the prevalence of IOP asymmetry in a single pair of right and left
IOP measurements was increased in patients with unilateral glaucoma
compared with that in normal control subjects. The increase is most
probably a result of the impairment of the aqueous outflow facility
in glaucoma patients (19,20). This also emphasizes the viewpoint
that IOP asymmetry is more damaging than an equal increase in IOP
in both eyes. Variations in IOP occur continuously and the IOPs of
bilateral eyes may exhibit differential fluctuations. Therefore,
caution is required when interpreting this limitation of the 24-h
IOP concordance of fellow eyes in clinical practice. Further study
may identify whether variations in IOP symmetry between each eye
correlate with the prevalence of glaucoma.
Of note, the present study had several limitations.
First, all IOP measurements were obtained using an auto non-contact
tonometer. However, recent studies reported that IOPs measured by
NCT were not significantly different from those measured by
Goldmann applanation tonometry (21,22).
Furthermore, it is well-known that IOP interpretation is affected
by the CCT. However, IOP fluctuation within a 24-h cycle was
assumed to be independent from CCT values in POAG patients
(23). In addition, evidence
indicated that the CCT changed slightly over the day and a close
symmetry between the fellow eyes was observed (24,25).
Second, one important variable that may affect the 24-h IOP curves
is the body position. Recent studies indicated that the eye on the
lower side in the lateral decubitus position had a higher IOP in
glaucoma patients and healthy individuals (26–29),
which may be attributed to the IOP difference during the nocturnal
period. Since all participants were hospitalized instead of being
monitored in the sleep laboratory, the sleeping posture was not
controlled. Third, the IOP values were measured every 2 h over a
24-h period rather than continuous 24-h IOP monitoring, which may
have missed certain maximal and minimal IOP values. The newly
developed contact lens sensor (CLS), recording the data every 5
min, may provide more detailed information (30). Previous studies have demonstrated
good tolerability and high reproducibility for 24-h recording with
the CLS (31,32), but the clinical applications of the
CLS require to be further investigated.
The 24-h IOP curves of the paired eyes had parallel
profiles in unilateral glaucoma patients and normal subjects.
However, the group of unilateral glaucoma patients had a
significantly larger proportion of IOP differences of ≥2 and ≥3
mmHg.
Acknowledgements
None.
Funding
No funding received.
Availability of data and materials
The data sets analysed or generated during the study
are available from the corresponding author on reasonable
request.
Authors' contributions
ZL, ZC and YZ were involved in the study design. ZL
and SH performed ophthalmologic examinations. PH, SH and CL
performed measurement and data analysis. ZL drafted the manuscript.
ZC and YZ reviewed the manuscript.
Ethical approval and consent to
participate
The design of the study was in compliance with the
principles of the Declaration of Helsinki and the study was
approved by the Ethics Committee of Ruijin Hospital, affiliated to
Shanghai Jiao Tong University School of Medicine (Shanghai, China).
Consent forms were signed by all of the participants prior to the
examination.
Patient consent for publication
Not applicable.
Competing interests
The authors declare that they have no competing
interests.
References
|
1
|
Tham YC, Li X, Wong TY, Quigley HA, Aung T
and Cheng CY: Global prevalence of glaucoma and projections of
glaucoma burden through 2040: A systematic review and
meta-analysis. Ophthalmology. 121:2081–2090. 2014. View Article : Google Scholar : PubMed/NCBI
|
|
2
|
Weinreb RN and Khaw PT: Primary open-angle
glaucoma. Lancet. 363:1711–1720. 2004. View Article : Google Scholar : PubMed/NCBI
|
|
3
|
Heijl A, Leske MC, Bengtsson B, Hyman L,
Bengtsson B and Hussein M: Early Manifest Glaucoma Trial Group,
Reduction of intraocular pressure and glaucoma progression: Results
from the early manifest glaucoma trial. Arch Ophthalmol.
120:1268–1279. 2002. View Article : Google Scholar : PubMed/NCBI
|
|
4
|
Liu JH, Sit AJ and Weinreb RN: Variation
of 24-h intraocular pressure in healthy individuals: Right eye
versus left eye. Ophthalmology. 112:1670–1675. 2005. View Article : Google Scholar : PubMed/NCBI
|
|
5
|
Lee AJ, Rochtchina E and Mitchell P:
Intraocular pressure asymmetry and undiagnosed open-angle glaucoma
in an older population. Am J Ophthalmol. 137:380–382. 2004.
View Article : Google Scholar : PubMed/NCBI
|
|
6
|
Realini T, Barber L and Burton D:
Frequency of asymmetric intraocular pressure fluctuations among
patients with and without glaucoma. Ophthalmology. 109:1367–1371.
2002. View Article : Google Scholar : PubMed/NCBI
|
|
7
|
Levine RA, Demirel S, Fan J, Keltner JL,
Johnson CA and Kass MA: Ocular Hypertension Treatment Study Group,
Asymmetries and visual field summaries as predictors of glaucoma in
the ocular hypertension treatment study. Invest Ophthalmol Vis Sci.
47:3896–3903. 2006. View Article : Google Scholar : PubMed/NCBI
|
|
8
|
Dinn RB, Zimmerman MB, Shuba LM, Doan AP,
Maley MK, Greenlee EC, Alward WL and Kwon YH: Concordance of
diurnal intraocular pressure between fellow eyes in primary
open-angle glaucoma. Ophthalmology. 114:915–920. 2007. View Article : Google Scholar : PubMed/NCBI
|
|
9
|
Sit AJ, Liu JH and Weinreb RN: Asymmetry
of right versus left intraocular pressures over 24 hs in glaucoma
patients. Ophthalmology. 113:425–430. 2006. View Article : Google Scholar : PubMed/NCBI
|
|
10
|
Liu JH and Weinreb RN: Asymmetry of
habitual 24-h intraocular pressure rhythm in glaucoma patients.
Invest Ophthalmol Vis Sci. 55:7398–7402. 2014. View Article : Google Scholar : PubMed/NCBI
|
|
11
|
Realini T, Weinreb RN and Wisniewski S:
Short-term repeatability of diurnal intraocular pressure patterns
in glaucomatous individuals. Ophthalmology. 118:47–51. 2011.
View Article : Google Scholar : PubMed/NCBI
|
|
12
|
Aptel F, Lesoin A, Chiquet C,
Aryal-Charles N, Noel C and Romanet JP: Long-term reproducibility
of diurnal intraocular pressure patterns in patients with glaucoma.
Ophthalmology. 121:1998–2003. 2014. View Article : Google Scholar : PubMed/NCBI
|
|
13
|
Prum BE Jr, Rosenberg LF, Gedde SJ,
Mansberger SL, Stein JD, Moroi SE, Herndon LW Jr, Lim MC and
Williams RD: Primary open-angle glaucoma preferred practice
pattern(®) guidelines. Ophthalmology. 123:P112–P151.
2016. View Article : Google Scholar : PubMed/NCBI
|
|
14
|
Bamdad S, Beigi V and Sedaghat MR:
Sensitivity and specificity of Swedish interactive threshold
algorithm and standard full threshold perimetry in primary
open-angle glaucoma. Med Hypothesis Discov Innov Ophthalmol.
6:125–129. 2017.PubMed/NCBI
|
|
15
|
Landis JR and Koch GG: The measurement of
observer agreement for categorical data. Biometrics. 33:159–174.
1977. View
Article : Google Scholar : PubMed/NCBI
|
|
16
|
Williams AL, Gatla S, Leiby BE, Fahmy I,
Biswas A, de Barros DM, Ramakrishnan R, Bhardwaj S, Wright C, Dubey
S, et al: The value of intraocular pressure asymmetry in diagnosing
glaucoma. J Glaucoma. 22:215–218. 2013. View Article : Google Scholar : PubMed/NCBI
|
|
17
|
Chiseliţă D, Moţoc I and Danielescu C:
Concordance of nictemeral IOP variations between fellow eyes in
glaucoma and non glaucoma patients. Oftalmologia. 52:102–109.
2008.PubMed/NCBI
|
|
18
|
Plange N, Kaup M, Arend O and Remky A:
Asymmetric visual field loss and retrobulbar haemodynamics in
primary open-angle glaucoma. Graefes Arch Clin Exp Ophthalmol.
244:978–983. 2006. View Article : Google Scholar : PubMed/NCBI
|
|
19
|
Brubaker RF: Targeting outflow facility in
glaucoma management. Surv Ophthalmol. 48 Suppl 1:S17–S20. 2003.
View Article : Google Scholar : PubMed/NCBI
|
|
20
|
Stamer WD and Acott TS: Current
understanding of conventional outflow dysfunction in glaucoma. Curr
Opin Ophthalmol. 23:135–143. 2012. View Article : Google Scholar : PubMed/NCBI
|
|
21
|
Cook JA, Botello AP, Elders A, Fathi Ali
A, Azuara-Blanco A, Fraser C, McCormack K and Margaret Burr J:
Surveillance of Ocular Hypertension Study Group, Systematic review
of the agreement of tonometers with Goldmann applanation tonometry.
Ophthalmology. 119:1552–1557. 2012. View Article : Google Scholar : PubMed/NCBI
|
|
22
|
Yilmaz I, Altan C, Aygit ED, Alagoz C, Baz
O, Ahmet S, Urvasizoglu S, Yasa D and Demirok A: Comparison of
three methods of tonometry in normal subjects: Goldmann applanation
tonometer, non-contact airpuff tonometer and Tono-Pen XL. Clin
Ophthalmol. 8:1069–1074. 2014. View Article : Google Scholar : PubMed/NCBI
|
|
23
|
Fogagnolo P, Capizzi F, Orzalesi N, Figus
M, Ferreras A and Rossetti L: Can mean central corneal thickness
and its 24-h fluctuation influence fluctuation of intraocular
pressure? J Glaucoma. 19:418–423. 2009. View Article : Google Scholar
|
|
24
|
Myrowitz EH, Kouzis AC and O'Brien TP:
High interocular corneal symmetry in average simulated keratometry,
central corneal thickness and posterior elevation. Optom Vis Sci.
82:428–431. 2005. View Article : Google Scholar : PubMed/NCBI
|
|
25
|
Bagga H, Liu JH and Weinreb RN:
Intraocular pressure measurements throughout the 24 h. Curr Opin
Ophthalmol. 20:79–83. 2009. View Article : Google Scholar : PubMed/NCBI
|
|
26
|
Lee JY, Yoo C, Jung JH, Hwang YH and Kim
YY: The effect of lateral decubitus position on intraocular
pressure in healthy young subjects. Acta Ophthalmol. 90:e68–e72.
2012. View Article : Google Scholar : PubMed/NCBI
|
|
27
|
Lee JY, Yoo C and Kim YY: The effect of
lateral decubitus position on intraocular pressure in patients with
untreated open-angle glaucoma. Am J Ophthalmol. 155:329–335.e2.
2013. View Article : Google Scholar : PubMed/NCBI
|
|
28
|
Lee TE, Yoo C and Kim YY: Effects of
different sleeping postures on intraocular pressure and ocular
perfusion pressure in healthy young subjects. Ophthalmology.
120:1565–1570. 2013. View Article : Google Scholar : PubMed/NCBI
|
|
29
|
Malihi M and Sit AJ: Effect of head and
body position on intraocular pressure. Ophthalmology. 119:987–991.
2012. View Article : Google Scholar : PubMed/NCBI
|
|
30
|
Mansouri K: The road ahead to continuous
24-h intraocular pressure monitoring in glaucoma. J Ophthalmic Vis
Res. 9:260–268. 2014.PubMed/NCBI
|
|
31
|
Mansouri K, Medeiros FA, Tafreshi A and
Weinreb RN: Continuous 24-h monitoring of intraocular pressure
patterns with a contact lens sensor: Safety, tolerability and
reproducibility in patients with glaucoma. Arch Ophthalmol.
130:1534–1539. 2012. View Article : Google Scholar
|
|
32
|
Mottet B, Aptel F, Romanet JP, Hubanova R,
Pépin JL and Chiquet C: 24-h intraocular pressure rhythm in young
healthy subjects evaluated with continuous monitoring using a
contact lens sensor. JAMA Ophthalmol. 131:1507–1516. 2013.
View Article : Google Scholar : PubMed/NCBI
|