Introduction
Intervertebral disc (IVD) degeneration (IDD) is
considered a primary contributor to disc degeneration disease and
is associated with lower back pain (1), which has become a serious public health
issue and causes an enormous economic burden (2–5). Despite
its significant clinical importance and prevalence, and its
extensive impact on general health, current clinical management
techniques, which include standard or endoscopic lumbar discectomy
and intradiscal thermal annuloplasty, are associated with a
substantial amount of recurrence (6–9). In
addition, lumbar fusion increases the risk of adjacent segment
degeneration (10).
Comprehensive knowledge of the mechanisms underlying
IDD is critical for the development of successful therapeutic
strategies. Over decades of research, increasing attention has been
paid to the molecular mechanisms underlying IDD. Notable
improvements in the knowledge of the pathological processes have
been achieved (11), with
multifactorial bioprocesses proven to contribute to IDD (12).
However, an enormous number of different molecules
that interact with each other are associated with IDD, indicating
that the pathological process is highly complex. In the
abovementioned previous studies, only a small number of molecular
factors have been investigated via classic experimental approaches,
and thus, the current understanding of the molecular mechanisms
involved in the initiation and progression of IDD remains limited.
Therefore, clinical strategies remain limited, and the development
of novel therapeutics depends on acquiring further insight into the
molecular basis and pathophysiology underlying IDD.
The IVD is a complex structure, comprising
fibrocartilaginous annulus fibrosis (AF) on the outside and highly
gelatinous nucleus pulposus (NP) on the inside. The biochemical
characteristics of IDD include extracellular matrix (ECM)
degradation (13,14). The ECM of IVDs consists primarily of
collagen type III in the inner AF, type I in the outer AF and type
II in the NP (15–17). The biological structure differs
between AF and NP, and this difference was hypothesized to lead to
different pathological processes in tissues from these two regions
of the IVD during degeneration. The present study assessed possible
differences in gene expression between the AF and NP in IDD by
performing a bioinformatics analysis of gene expression profiles of
AF and NP from degenerated IVDs.
Materials and methods
Acquisition of expression data
The primary dataset GSE70362 was downloaded from the
Gene Expression Omnibus (GEO) database (http://www.ncbi.nlm.nih.gov/geo). The GSE70362
dataset, which is based on the Affymetrix GPL17810 platform
(HG-U133_Plus_2; Affymetrix; Thermo Fisher Scientific Inc.,
Waltham, MA, USA), was uploaded by Kazezian et al (18) in 2015. It contains the gene
expression data for 48 IVD tissues, including 24 AF and 24 NP
paired samples. The original signal intensity data in CEL format
files (annotation edition information), matrix files and
classifications based on the Thompson grading system (19) were downloaded. A total of 8 samples
(GSM1725800, −1725801, −1725810, −1725811, −1725814, −1725815,
−1725822 and −1725823) were discarded, as all of them were
classified as Thompson grade I and were considered healthy. The
remaining 40 samples were classified as Thompson grade I–II to V
and consisted of 20 AF samples and 20 NP samples. To annotate the
data, the original probe IDs were transformed into Gene symbol and
Entrez IDs. Any probes that were not mapped to any GeneID or that
were not identified were discarded.
Identification of differentially
expressed genes (DEGs)
A significance analysis of the microarray data was
performed by using GeneSpring GX 11.5 software (Agilent
Technologies, Inc., Santa Clara, CA, USA) to identify DEGs. After
pre-processing the initial data via the Robust Multi-array Average
procedure, the probe sets with intensity values between 20 and 100%
were retained. For statistical analysis, an unpaired t-test was
performed with a threshold P-value of 0.05 and absolute fold change
(FC) of 2, and a Benjamini-Hochberg procedure for multiple testing
was applied. Multiexperiment Viewer software (version 4.9.0;
http://mev.tm4.org/) was used to construct a heat map
of the DEGs identified.
Enrichment analysis
DEGs were analyzed using online tools in Metascape
(http://metascape.org/). Functional enrichment was
performed in 3 categories of GO terms: Biological process (BP),
molecular function (MF) and cellular component (CC). Kyoto
Encyclopedia of Genes and Genomes (KEGG) pathway enrichment was
also performed. All genes in the genome were used as the enrichment
background. Terms with a P-value of <0.01, a minimum count of 3
and an enrichment factor of >1.5 (the enrichment factor is the
ratio of the observed count to the count expected by chance) were
collected and grouped into clusters based on their membership
similarities. More specifically, P-values were calculated based on
the cumulative hypergeometric distribution. Q-values were
calculated using the Benjamini-Hochberg procedure to account for
multiple testing. Kappa scores were used as the similarity metric
when performing hierarchical clustering of the enriched terms;
sub-trees with a similarity of >0.3 were considered a cluster.
The most significant term within a cluster was selected as the one
representing the cluster.
Protein-protein interaction (PPI)
network
To evaluate potential PPIs, DEGs were mapped using
the Search Tool for the Retrieval of Interacting Genes (STRING;
http://string-db.org) under the default settings;
nodes lacking a connection in the network were excluded.
Subsequently, a PPI network with a combined interaction score of
>0.4 was constructed by using Cytoscape software (version 3.6.3;
http://www.cytoscape.org/). DEGs with a degree
centrality of >5.0 were identified as hub genes by using the
plug-in CentiScaPe. The MCODE plug-in was applied to identify
significant modules with the following criteria: ‘Degree cutoff=2’,
‘node score cutoff=0.2’, ‘k-core=2’ and ‘max depth=100’.
Results
DEGs
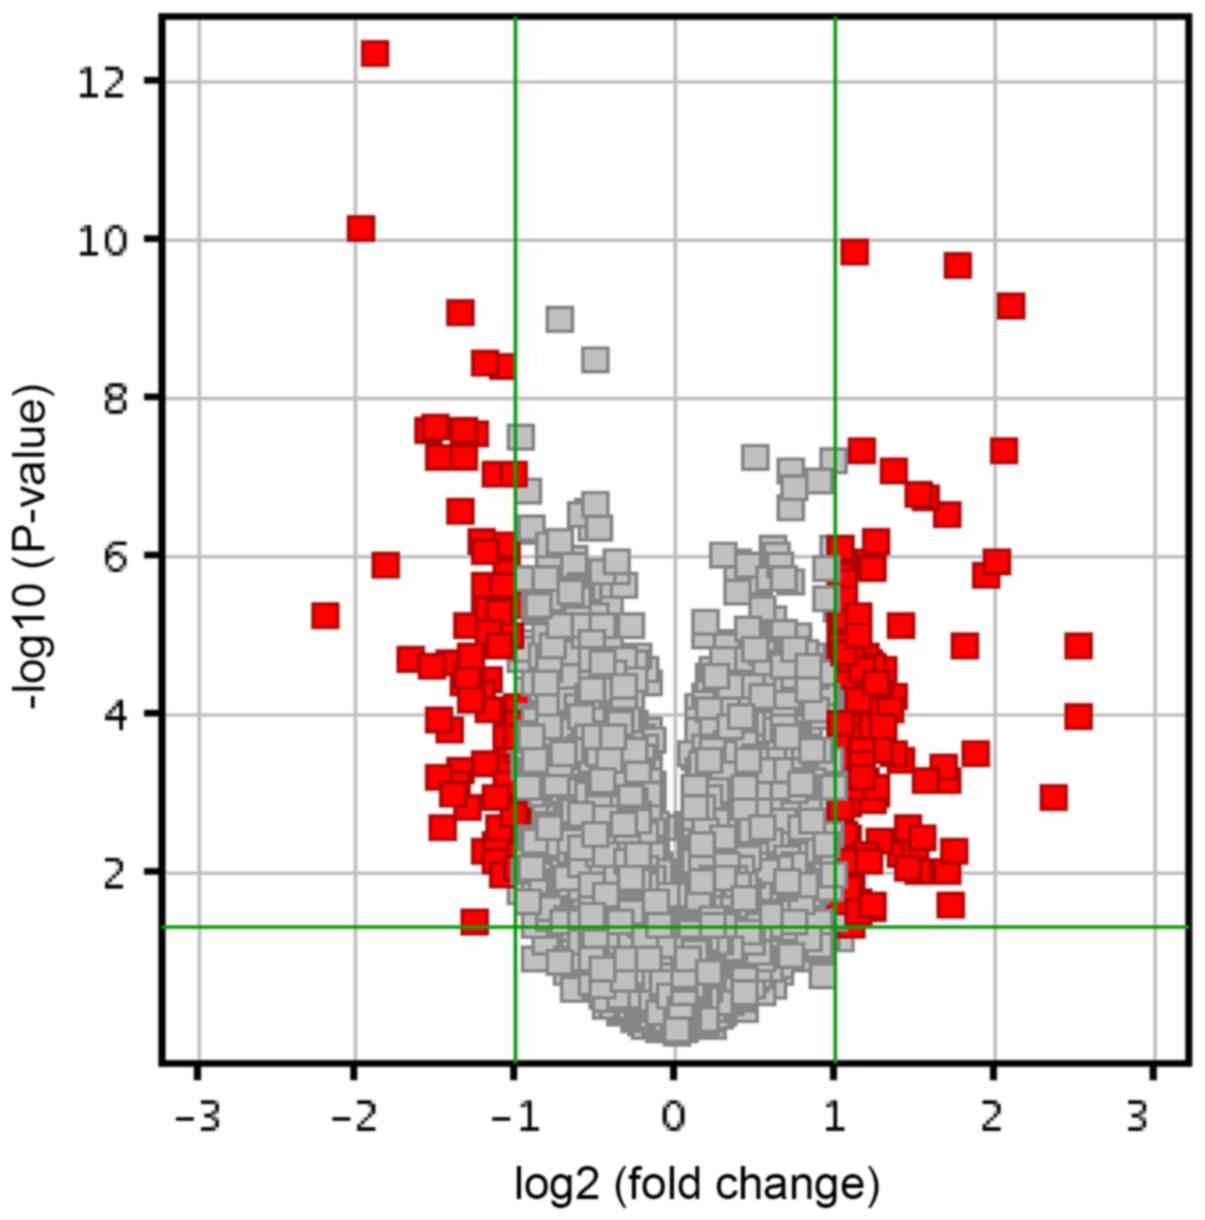
A total of 1,514 genes were identified to be
significantly differently expressed between AF and NP samples
(P<0.05). Of these, 863 genes were downregulated and 651 genes
were upregulated. Further analysis identified 87 genes as DEGs with
an absolute FC of >2. The DEGs accounted for 0.16% of the total
transcriptome (Fig. 1). Among these
87 DEGs, 49 were upregulated and 38 were downregulated. The DEGs
were ranked according to their FC, and the top 10 DEGs are listed
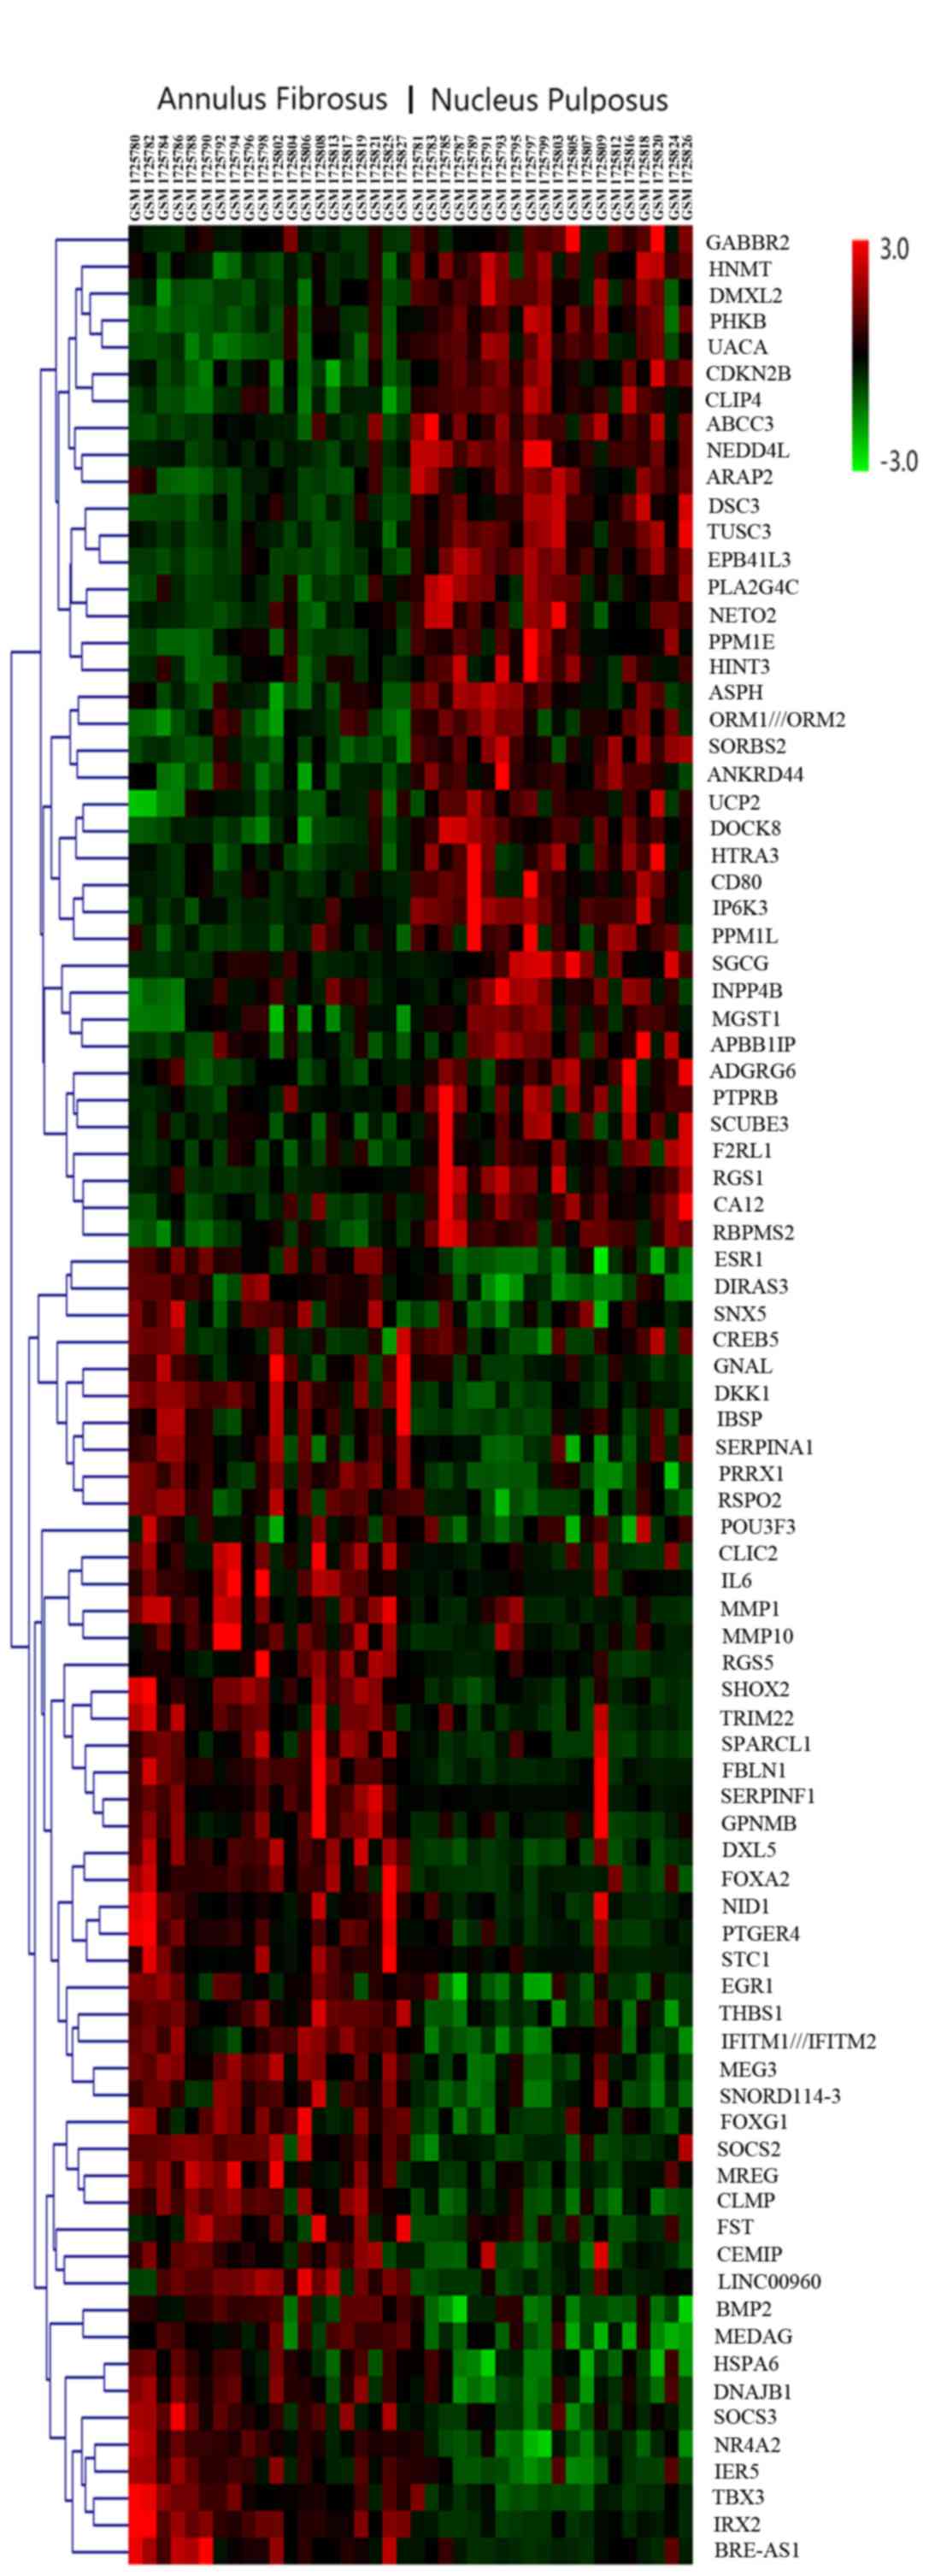
in Table I. Fig. 2 presents the hierarchical clustering
of the DEGs, with the original data normalized using the z-score to
indexes between-3 and 3.
 | Table I.Top 10 most highly dysregulated
genes. |
Table I.
Top 10 most highly dysregulated
genes.
| Gene | Absolute FC | Regulation | P-value |
Q-valuea |
|---|
| SPARCL1 | 5.77 | Up |
1.03×10⁻⁴ |
1.26×10⁻² |
| MMP1 | 5.75 | Up |
1.32×10⁻⁵ |
4.34×10⁻³ |
| IBSP | 5.16 | Up |
1.04×10⁻³ |
4.35×10⁻² |
| RGS1 | 4.64 | Down |
5.30×10⁻⁶ |
2.44×10⁻³ |
| THBS1 | 4.25 | Up |
6.66×10⁻¹⁰ |
7.12×10⁻⁶ |
| FBLN1 | 4.18 | Up |
4.32×10⁻⁸ |
1.39×10⁻⁴ |
| EPB41L3 | 3.97 | Down |
6.48×10⁻¹¹ |
1.77×10⁻⁶ |
| MEG3 | 3.82 | Up |
1.61×10⁻⁶ |
1.26×10⁻³ |
| HSPA6 | 3.65 | Up |
3.16×10⁻⁴ |
2.25×10⁻² |
| IRX2 | 3.40 | Up |
2.02×10⁻¹⁰ |
2.76×10⁻⁶ |
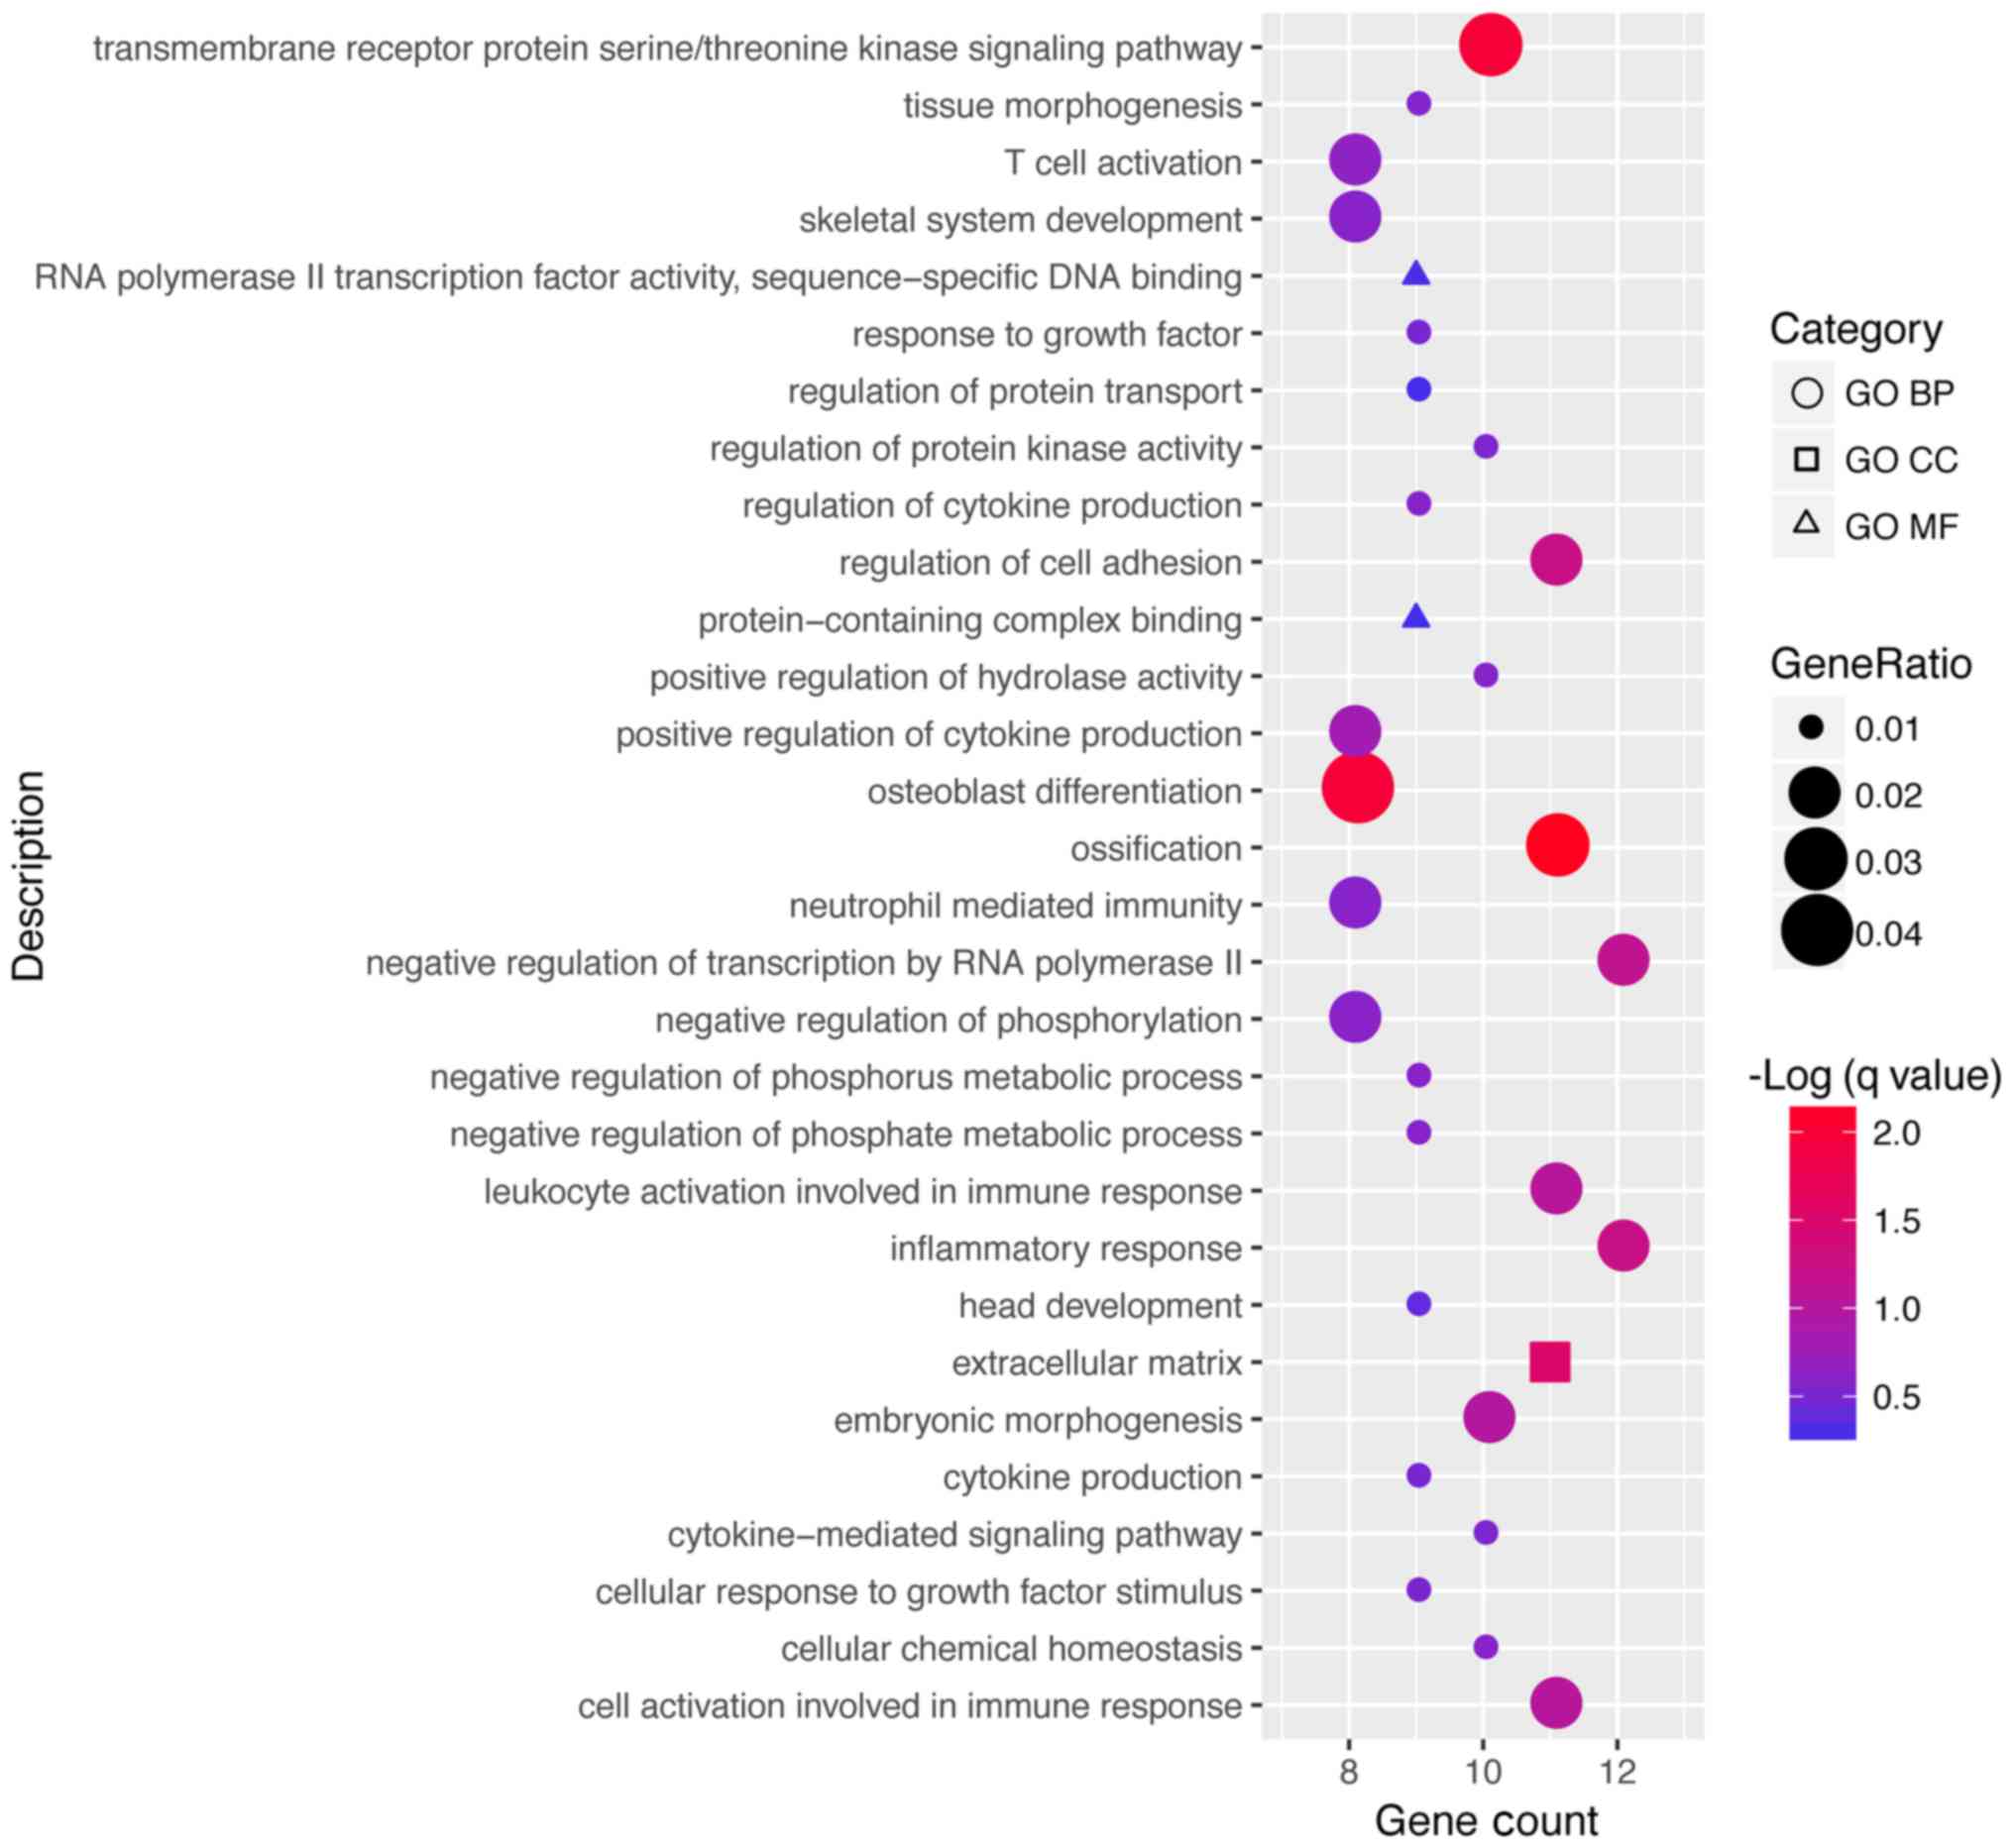
Based on the GO enrichment, the DEGs were enriched
in 221 terms in the category BP, 7 in the category CC and 13 in the
category MF. The top 30 GO terms in which the DEGs were enriched
according to the gene count are presented in Fig. 3 and Table
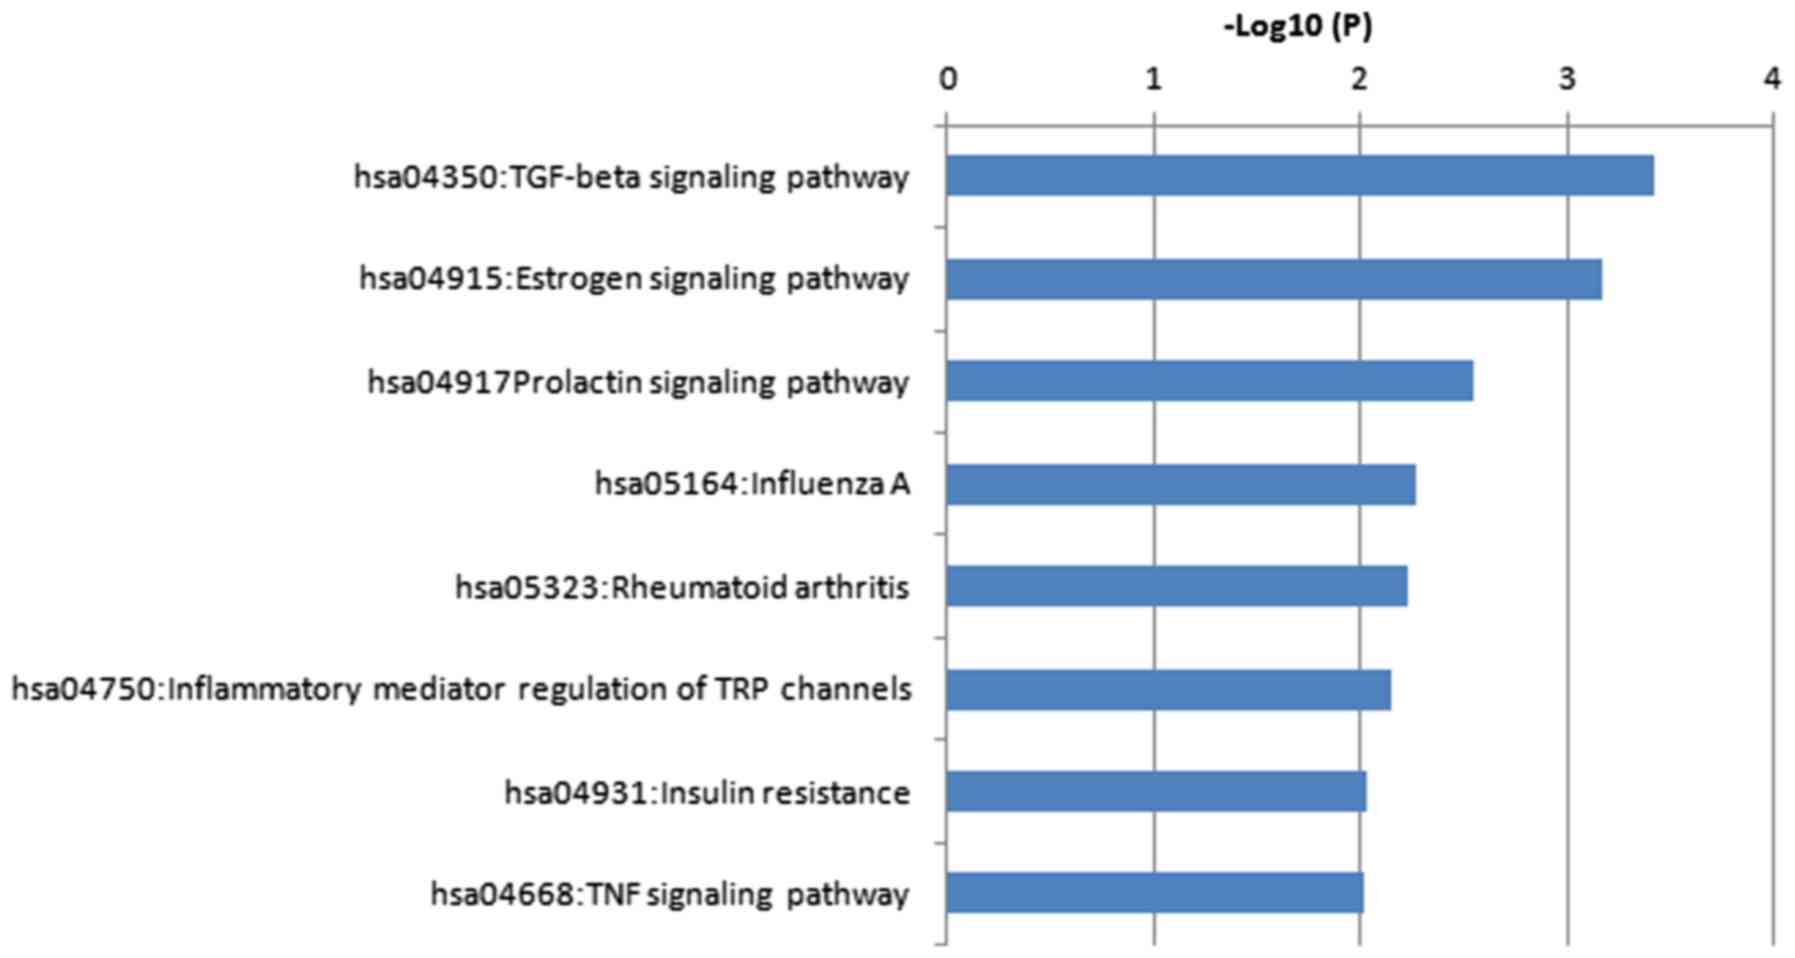
II. The DEGs were significantly enriched in a total of 8 KEGG
pathways as presented in Fig. 4 and
Table III.
| Table II.Top 30 enriched GO terms. |
Table II.
Top 30 enriched GO terms.
| Category | Term | Description | Log10(P) | Log10(Q) | Gene count | Genes |
|---|
| GO BP | GO:0006954 | Inflammatory
response | −4.29 | −1.23 | 12 | BMP2, ESR1, F2RL1,
IL6, ORM1, ORM2, SERPINF1, SERPINA1, PTGER4, THBS1, PLA2G4C,
SOCS3 |
| GO BP | GO:0000122 | Negative regulation
of transcription by RNA polymerase II | −4.11 | −1.13 | 12 | BMP2, EGR1, ESR1,
DNAJB1, NR4A2, PRRX1, SHOX2, TBX3, FST, DKK1, NEDD4L, IRX2 |
| GO BP | GO:0001503 | Ossification | −6.53 | −2.19 | 11 | BMP2, DLX5, IBSP,
IL6, PTGER4, SHOX2, STC1, IFITM1, GPNMB, DKK1, RSPO2 |
| GO CC | GO:0031012 | Extracellular
matrix | −4.79 | −1.52 | 11 | FBLN1, IBSP, MMP1,
MMP10, NID1, ORM1, ORM2, SERPINF1, SERPINA1, THBS1, SPARCL1 |
| GO BP | GO:0030155 | Regulation of cell
adhesion | −4.28 | −1.23 | 11 | BMP2, CD80, FBLN1,
FOXA2, IBSP, IL6, NID1, THBS1, GPNMB, APBB1IP, DOCK8 |
| GO BP | GO:0002366 | Leukocyte
activation involved in immune response | −4.00 | −1.04 | 11 | CD80, F2RL1, HSPA6,
IL6, MGST1, ORM1, ORM2, SERPINA1, PTGER4, PTPRB, APBB1IP |
| GO BP | GO:0002263 | Cell activation
involved in immune response | −3.97 | −1.03 | 11 | CD80, F2RL1, HSPA6,
IL6, MGST1, ORM1, ORM2, SERPINA1, PTGER4, PTPRB, APBB1IP |
| GO BP | GO:0007178 | Transmembrane
receptor protein serine/threonine kinase signaling pathway | −6.02 | −1.99 | 10 | BMP2, CDKN2B, DLX5,
EGR1, THBS1, FST, DKK1, HTRA3, PPM1L, RBPMS2 |
| GO BP | GO:0048598 | Embryonic
morphogenesis | −3.91 | −1.00 | 10 | DLX5, FOXA2, PRRX1,
SHOX2, TBX3, SOCS3, DKK1, IRX2, RSPO2, RBPMS2 |
| GO BP | GO:0051345 | Positive regulation
of hydrolase activity | −3.07 |
−5.89×10⁻¹ | 10 | ASPH, BMP2, ESR1,
F2RL1, FBLN1, DNAJB1, RGS1, RGS5, DOCK8, ARAP2 |
| GO BP | GO:0055082 | Cellular chemical
homeostasis | −3.06 |
−5.89×10⁻¹ | 10 | CLIC2, ESR1, F2RL1,
FOXA2, SERPINF1, STC1, UCP2, DMXL2, NEDD4L, CEMIP |
| GO BP | GO:0019221 | Cytokine-mediated
signaling pathway | −2.87 |
−5.39×10⁻¹ | 10 | CD80, EGR1, F2RL1,
IL6, MMP1, IFITM1, SOCS2, SOCS3, TRIM22, IFITM2 |
| GO BP | GO:0045859 | Regulation of
protein kinase activity | −2.86 |
−5.38×10⁻¹ | 10 | BMP2, CDKN2B, EGR1,
THBS1, SOCS2, SOCS3, DIRAS3, PPM1E, DKK1, CEMIP |
| GO BP | GO:0001817 | Regulation of
cytokine production | −3.05 |
−5.89×10⁻¹ | 9 | CD80, EGR1, F2RL1,
IL6, ORM1, ORM2, PTGER4, THBS1, GPNMB |
| GO BP | GO:0045936 | Negative regulation
of phosphate metabolic process | −3.11 |
−5.89×10⁻¹ | 9 | CDKN2B, F2RL1,
FBLN1, FOXA2, SOCS2, SOCS3, GABBR2, PPM1E, DKK1 |
| GO BP | GO:0010563 | Negative regulation
of phosphorus metabolic process | −3.10 |
−5.89×10⁻¹ | 9 | CDKN2B, F2RL1,
FBLN1, FOXA2, SOCS2, SOCS3, GABBR2, PPM1E, DKK1 |
| GO BP | GO:0048729 | Tissue
morphogenesis | −2.96 |
−5.74×10⁻¹ | 9 | BMP2, ESR1, SHOX2,
STC1, TBX3, SOCS3, DKK1, IRX2, RSPO2 |
| GO BP | GO:0071363 | Cellular response
to growth factor stimulus | −2.83 |
−5.20×10⁻¹ | 9 | BMP2, CDKN2B, DLX5,
EGR1, IBSP, THBS1, DKK1, HTRA3, RBPMS2 |
| GO BP | GO:0001816 | Cytokine
production | −2.75 |
−4.86×10⁻¹ | 9 | CD80, EGR1, F2RL1,
IL6, ORM1, ORM2, PTGER4, THBS1, GPNMB |
| GO BP | GO:0070848 | Response to growth
factor | −2.71 |
−4.76×10⁻¹ | 9 | BMP2, CDKN2B, DLX5,
EGR1, IBSP, THBS1, DKK1, HTRA3, RBPMS2 |
| GO BP | GO:0060322 | Head
development | −2.56 |
−3.84×10⁻¹ | 9 | ASPH, BMP2, DLX5,
FOXG1, HNMT, NR4A2, POU3F3, TBX3, DKK1 |
| GO MF | GO:0000981 | RNA polymerase II
transcription factor activity, sequence-specific DNA binding | −2.44 |
−3.05×10⁻¹ | 9 | DLX5, EGR1, ESR1,
FOXG1, FOXA2, NR4A2, PRRX1, TBX3, IRX2 |
| GO MF | GO:0044877 | Protein-containing
complex binding | −2.36 |
−2.71×10⁻¹ | 9 | FBLN1, GNAL, IBSP,
NID1, THBS1, SPARCL1, GPNMB, FST, ADGRG6 |
| GO BP | GO:0051223 | Regulation of
protein transport | −2.36 |
−2.70×10⁻¹ | 9 | F2RL1, FOXA2, HNMT,
IL6, ORM1, ORM2, PTGER4, UCP2, CEMIP |
| GO BP | GO:0001649 | Osteoblast
differentiation | −5.72 | −1.99 | 8 | BMP2, DLX5, IBSP,
IL6, SHOX2, IFITM1, GPNMB, RSPO2 |
| GO BP | GO:0001819 | Positive regulation
of cytokine production | −3.61 |
−8.12×10⁻¹ | 8 | CD80, EGR1, F2RL1,
IL6, ORM1, ORM2, PTGER4, THBS1 |
| GO BP | GO:0042110 | T cell
activation | −3.27 |
−6.41×10⁻¹ | 8 | CD80, EGR1, F2RL1,
IL6, PTGER4, GPNMB, APBB1IP, DOCK8 |
| GO BP | GO:0042326 | Negative regulation
of phosphorylation | −3.19 |
−6.01×10⁻¹ | 8 | CDKN2B, F2RL1,
FBLN1, FOXA2, SOCS2, SOCS3, PPM1E, DKK1 |
| GO BP | GO:0001501 | Skeletal system
development | −3.08 |
−5.89×10⁻¹ | 8 | BMP2, DLX5, PRRX1,
PTGER4, SHOX2, STC1, TBX3, RSPO2 |
| GO BP | GO:0002446 | Neutrophil mediated
immunity | −3.02 |
−5.89×10⁻¹ | 8 | F2RL1, HSPA6, IL6,
MGST1, ORM1, ORM2, SERPINA1, PTPRB |
| Table III.KEGG pathway enrichment analysis. |
Table III.
KEGG pathway enrichment analysis.
| Term | Description | Log10(P) | Log10(Q) | Genes |
|---|
| hsa04350 | TGF-β signaling
pathway | −3.426090165 | −0.780 | BMP2, CDKN2B,
THBS1, FST |
| hsa04915 | Estrogen signaling
pathway | −3.172403712 | −0.780 | ESR1, HSPA6,
GABBR2, CREB5 |
| hsa04917 | Prolactin signaling
pathway | −2.542647382 | −0.326 | ESR1, SOCS2,
SOCS3 |
| hsa05164 | Influenza A | −2.272816914 | −0.241 | HSPA6, DNAJB1, IL6,
SOCS3 |
| hsa04931 | Insulin
resistance | −2.029682792 | −0.228 | IL6, SOCS3,
CREB5 |
| hsa04668 | TNF signaling
pathway | −2.018699722 | −0.228 | IL6, SOCS3,
CREB5 |
| hsa05323 | Rheumatoid
arthritis Inflammatory mediator | −2.236138588 | −0.241 | CD80, IL6,
MMP1 |
| hsa04750 | Regulation of TRP
channels | −2.146268906 | −0.231 | F2RL1, PTGER4,
PLA2G4C |
Gene ontology enrichment revealed that these DEGs
were mainly involved in the inflammatory response, the
extracellular matrix and RNA polymerase II transcription factor
activity. Pathway enrichment revealed that the DEGs were mainly
involved in the transforming growth factor (TGF-β) and estrogen
signaling pathways. Matrix metalloproteinase (MMP)1 and interleukin
(IL)6 were included in the genes enriched in rheumatoid arthritis,
whereas bone morphogenetic protein (BMP)2 and thrombospondin 1
(THBS1) were among the genes enriched in the TGF-β signaling
pathway.
PPI network and module
As presented in Fig.
5, the PPI network comprised 40 connected nodes and 50 edges,
and IL6, THBS1, forkhead box (FOX)A2, BMP2, estrogen receptor
(ESR)1, heat shock protein A4, suppressor of cytokine signaling
(SOCS)3 and early growth response 1 were identified as hub genes.
One significant module containing 10 nodes and 15 edges was
screened out (Fig. 6).
Discussion
DNA chips allow for the simultaneous detection of
the expression of tens of thousands of genes at one time in a
single DNA microarray, which facilitates the further identification
of DEGs in pathological processes and investigations applying this
technology may substantially enhance the knowledge of the molecular
mechanisms of IDD. As the DNA microarray has become popular in
recent years, there has been an increased use of transcriptomic
approaches in the investigation of the pathophysiology of IDD at
the molecular level.
Analysis of the expression spectrum of AF tissues in
a previous study revealed that, compared to AF in less degenerated
IVDs (Thompson grades I–III), bradykinin receptor B1, calcitonin
gene-related peptide and catechol-O-methyltransferase (genes
associated with pain), as well as nerve growth factor, were
significantly upregulated in more degenerated IVDs (grades IV and
V); in addition, numerous genes encoding chemokines and
pro-inflammatory cytokines were markedly affected (20). Another microarray analysis indicated
differential expression of proteins that bind aspirin in degenerate
disc specimens, with higher levels detected in the more degenerated
IVDs (grade IV) than in the less degenerated ones (grades I, II and
III) (21). Tsai et al
(22) reported on 14 DEGs, including
periostin, insulin-like growth factor binding protein (IGFB)P6 and
MMP-2, in the NP of degenerated IVDs. Via a genome-wide analysis,
Gruber et al (23) identified
424 DEGs in the NP from degenerate IVDs compared with that in
normal NP cells and proposed critical genes associated with disc
degeneration; these were mainly involved in the ECM, ECM
proteolysis, cell proliferation and apoptosis, and also comprised
growth factors and inflammatory mediators. He et al
(24) compared gene expression data
of degenerated IVDs with those of non-degenerated samples and
identified 961 DEGs, including 846 DEGs in disc tissues of
grade-III IVDs and 1,137 in disc tissues of grade-IV IVDs. They
hypothesized that tumor protein 53 has an important role in IDD by
impacting neovascularization and infiltration in AF, while
ubiquitin C participated by blocking of cell proliferation in the
AF. Kazezian et al (18)
obtained microarray data from AF tissues from degenerated and
non-degenerated IVDs and identified 238 DEGs in the AF of
degenerated IVDs. The dysregulated genes were mainly enriched in
the areas of cell proliferation and cellular growth, and were
adversely disrupted by IGFBP3 and interferon induced protein with
tetratricopeptide repeats 3. Tang et al (25) identified 53 DEGs in degenerated IVDs
compared with non-degenerated ones, of which 16 genes were
downregulated and 37 were upregulated; bioinformatics analysis
revealed that the DEGs were associated with TGF-β and the ECM, and
MMP2 was indicated to have the highest degree of interaction in the
PPI network. Guo et al (26)
identified 35 genes that were differentially expressed in AF and NP
of degenerated IVDs compared with non-degenerated tissues by
analyzing microarray data. Their results suggested that collagen
type VI α 2 chain, integrin-binding sialoprotein, RAP1A and FOXF2
serve important roles in the focal adhesion signaling pathway
associated with IDD and that interferon induced protein with
tetratricopeptide repeats 1, −2 and −3 may accelerate degenerative
processes by affecting ECM organization.
The original study that provided the microarray
dataset GSE70362 focusing on AF identified 238 dysregulated genes
indegenerated AF in comparison with non-degenerated AF (24). These dysregulated genes were enriched
in the areas of cellular growth, cell proliferation and
inflammatory response, thus confirming that the interferon
signaling pathway was significantly dysregulated and activated
(24). However, all previous studies
employing DNA microarrays to investigate the molecular mechanisms
of IDD compared degenerated AF, NP or ‘discs’ with non-degenerated
tissues. Among these studies, only one noted a similarity of genes
involved in AF and NP degeneration by enrichment analysis and a PPI
network, and to the best of our knowledge, no previous study has
examined whether the degeneration of AF and NP proceeds via
different pathophysiological processes at the cellular and the
molecular level. Of note, Schubert et al (27) assessed AF and NP tissues from
low-level degenerated disks and reported that 267 DEGs were
upregulated in AF compared with NP tissues and that 52 DEGs were
more highly expressed in NP compared with AF tissues. The authors
further identified ankyrin repeat domain 29, adhesion G
protein-coupled receptor L4, endomucin, LIM domain binding 2 and
olfactomedin like 2A as AF markers, and ArfGAP with RhoGAP domain,
ankyrin repeat and PH domain 2 (ARAP2), cyclin dependent kinase
inhibitor 2B (CDKN2B), defensin β1, desmocollin 3 (DSC3) and
erythroferrone as NP markers. Those identified as AF markers were
upregulated in AF and those identified as NP markers were
upregulated in NP. These results are consistent with those of the
present study, which identified the upregulation of the NP markers
ARAP2, CDKN2B and DSC3 in AF compared with those in NP tissues.
The present study uncovered several different
pathophysiological aspects of AF and NP degeneration at the
molecular level. These results enhance the current knowledge of the
molecular mechanisms of IDD. The present analysis of 20 AF and 20
NP samples from the GSE70362 dataset retrieved from the GEO
identified a total of 87 DEGs with P<0.05 and FC>2 in AF
compared to NP samples including 48 upregulated and 39
downregulated DEGs. Enrichment analysis indicated that these DEGs
were mainly involved in the GO terms of inflammatory response, ECM
and RNA polymerase II transcription factor activity, as well as in
the KEGG pathways of TGF-β and estrogen signaling. KEGG pathway
analysis revealed that MMP1 and IL6 were included in the genes
enriched in rheumatoid arthritis, whereas BMP2 and THBS1 were among
the genes enriched in the TGF-β signaling pathway. In the PPI
network, IL6 was identified as the central hub gene.
The expression of MMP1, which has been identified in
91% of IVDs, increases in degenerated IVDs (28). The significantly higher levels of
MMP1 in degenerated IVDs compared with those in normal discs
indicate a positive correlation between MMP1 and IDD (29). The expression of MMP1 was reported to
be markedly associated with clefts and tears of AF and NP (30,31).
However, most of the abovementioned previous studies assessed ‘disc
tissues’ or ‘disc specimens’ without differentiating between AF and
NP. MMP1 is a type of collagenase with the characteristic function
of cleaving interstitial collagens I, II and III (32,33).
MMP1 has the greatest degradation activity toward collagen III
(34). Collagen III is the most
common type of collagen in the inner AF, whereas the outer AF
mainly consists of collagen I, and the NP mainly consists of
collagen II (15–17,35).
This pattern of collagen distribution and the different effects of
MMP1 on the degradation of these collagens may explain for the
upregulation of MMP1 in AF compared to NP observed in the present
study.
BMP2 downregulates MMP13 and upregulates aggrecan,
sex-determining region Y box 6 and type II collagen, and thus, it
has an anti-catabolic effect on ECM enzymes in AF and NP (36). In NP and the inner AF, BMP2 increases
aggrecan, as well as type I and II collagen, while simultaneously
increasing proteoglycan synthesis and stimulating mitogenesis in
the outer AF (37,38). The biological effect of estrogen
mainly occurs through ESR1 and −2 (39), with ESR2 as the predominant ESR
(40). Basic research has confirmed
that ESR1 is negatively correlated with the aggravation of NP
degeneration (41). The present
study revealed that the expression of ESR1 is upregulated in
degenerated AF vs. NP; however, the detailed role of ESR1 in this
context requires further investigation. The anti-angiogenic
characteristics of THBS1 have long been known (42). A previous study reported strong
immunoreactivity for THBS1 in the outer AF, suggesting that THBS1
may contribute to the avascular status of the IVD (43).
An inflammatory response is thought to initiate IDD,
and pro-inflammatory molecules, including IL6, secreted by IVD
cells are considered to mediate IDD (44). In addition, IL6 was identified as a
hub gene in the PPI network that was constructed as part of the
present study. Accordingly, it may be speculated that IL6 has a key
role in IDD. This speculation is consistent with another study
suggesting that IL6 is critical in IDD (45). Herniated IVDs have been reported to
spontaneously produce IL6 (46). IL6
downregulates characteristic ECM proteins, including aggrecan and
collagen II, in NP (47). This
regulatory effect was specifically located to the site of
herniation (48,49). Shamji et al (50) detected higher IL6 expression in
herniated IVD tissues than in non-degenerated autopsy samples,
whereas Lee et al (51)
identified no significant differences in IL6 expression levels
between degenerated IVDs and herniated NP. Most of these studies
were based on herniated IVDs rather than on degenerated IVDs and
did not distinguish between AF and NP specimens. None of these
studies mentioned the difference in IL6 expression levels between
AF and NP. In the present study, IL6 expression was upregulated
with an FC of 2.27 in AF vs. NP tissues; the molecular biological
implications of this observation require further investigation.
With regard to the genes enriched in terms/pathways associated with
the inflammatory response, except for the participation of IL6,
BMP2, ESR1 and THBS1 in IDD, limited data are available to suggest
the biological actions of F2R like trypsin receptor 1, orosomucoid
1 and −2, serpin family F member 1, serpin family A member 1,
SERPINA1, prostaglandin E receptor 4, phospholipase A2 group IVC
and SOCS3 in IDD.
In conclusion, the present bioinformatics study
revealed DEGs and their enriched functions/pathways in the AF and
NP during IDD. A novel integrated understanding of certain
molecular mechanisms of IDD was obtained. The different
distribution patterns of collagen types and different degradation
efficiencies of MMP1 on these collagen types may contribute to the
upregulation of MMP1 in AF compared with that in NP. IL6 may be a
key factor accounting for the different processes of degeneration
in AF and NP. BMP2, ESR1 and THBS1 may also be involved in the
different pathological changes observed in AF and NP. The present
study is based on information available from a public database
rather than from experimentation, and the biological implications
of these different gene expression patterns require further
investigation.
Acknowledgements
The authors gratefully acknowledge the writing
assistance of Dr Zhirui Zhou (Department of Radiation Oncology,
Fudan University Shanghai Cancer Center, Shanghai, China).
Funding
The present study was funded by the Key research and
development projects of the Science & Technology Department of
Sichuan Province, China (grant no: 2018SZ0075).
Availability of data and materials
All data are already included in the article.
Authors' contributions
WY designed the study and, together with JL,
performed data analysis and wrote the manuscript. DGG obtained
funding and together with LSW advised on the study design and
writing. MXY contributed to writing and English proofreading. DGG,
LSW and MXY made substantial contributions to conception and
design. All authors have given final approval of the version to be
published.
Ethics approval and consent to
participate
Not applicable.
Patient consent for publication
Not applicable.
Competing interests
The authors declare that they have no competing
interests regarding this study.
Glossary
Abbreviations
Abbreviations:
|
IVD
|
intervertebral disc
|
|
IDD
|
IVD degeneration
|
|
PPI
|
protein-protein interaction
|
|
AF
|
annulus fibrosus
|
|
NP
|
nucleus pulposus
|
|
DEG
|
differentially expressed gene
|
|
ECM
|
extracellular matrix
|
|
BP
|
biological process
|
|
MF
|
molecular function
|
|
CC
|
cellular component
|
|
KEGG
|
Kyoto Encyclopedia of Genes and
Genomes
|
References
|
1
|
Luoma K, Riihimäki H, Luukkonen R,
Raininko R, Viikari-Juntura E and Lamminen A: Low back pain in
relation to lumbar disc degeneration. Spine (Phila Pa 1976).
25:487–492. 2000. View Article : Google Scholar : PubMed/NCBI
|
|
2
|
Andersson GB: Epidemiological features of
chronic low-back pain. Lancet. 354:581–585. 1999. View Article : Google Scholar : PubMed/NCBI
|
|
3
|
Maniadakis N and Gray A: The economic
burden of back pain in the UK. Pain. 84:95–103. 2000. View Article : Google Scholar : PubMed/NCBI
|
|
4
|
Katz JN: Lumbar disc disorders and
low-back pain: Socioeconomic factors and consequences. J Bone Joint
Surg Am. 88 Suppl 2:S21–S24. 2006. View Article : Google Scholar
|
|
5
|
Martin BI, Deyo RA, Mirza SK, Turner JA,
Comstock BA, Hollingworth W and Sullivan SD: Expenditures and
health status among adults with back and neck problems. JAMA.
299:656–664. 2008. View Article : Google Scholar : PubMed/NCBI
|
|
6
|
Yorimitsu E, Chiba K, Toyama Y and
Hirabayashi K: Long-term outcomes of standard discectomy for lumbar
disc herniation: A follow-up study of more than 10 years. Spine
(Phila Pa 1976). 26:652–657. 2001. View Article : Google Scholar : PubMed/NCBI
|
|
7
|
Li X, Han Y, Di Z, Cui J, Pan J, Yang M,
Sun G, Tan J and Li L: Percutaneous endoscopic lumbar discectomy
for lumbar disc herniation. J Clin Neurosci. 33:19–27. 2016.
View Article : Google Scholar : PubMed/NCBI
|
|
8
|
Karasek M and Bogduk N: Twelve-month
follow-up of a controlled trial of intradiscal thermal anuloplasty
for back pain due to internal disc disruption. Spine (Phila Pa
1976). 25:2601–2607. 2000. View Article : Google Scholar : PubMed/NCBI
|
|
9
|
Uschold TD, Fusco D, Germain R, Tumialan
LM and Chang SW: Cervical and lumbar spinal arthroplasty: Clinical
review. AJNR Am J Neuroradiol. 33:1631–1641. 2012. View Article : Google Scholar : PubMed/NCBI
|
|
10
|
Hilibrand AS and Robbins M: Adjacent
segment degeneration and adjacent segment disease: The consequences
of spinal fusion? Spine J. 4 (6 Suppl):190S–194S. 2004. View Article : Google Scholar : PubMed/NCBI
|
|
11
|
Kepler CK, Ponnappan RK, Tannoury CA,
Risbud MV and Anderson DG: The molecular basis of intervertebral
disc degeneration. Spine J. 13:318–330. 2013. View Article : Google Scholar : PubMed/NCBI
|
|
12
|
Martin MD, Boxell CM and Malone DG:
Pathophysiology of lumbar disc degeneration: A review of the
literature. Neurosurg Focus. 13:E12002. View Article : Google Scholar
|
|
13
|
Lyons G, Eisenstein SM and Sweet MB:
Biochemical changes in intervertebral disc degeneration. Biochim
Biophys Acta. 673:443–453. 1981. View Article : Google Scholar : PubMed/NCBI
|
|
14
|
Antoniou J, Steffen T, Nelson F,
Winterbottom N, Hollander AP, Poole RA, Aebi M and Alini M: The
human lumbar intervertebral disc: Evidence for changes in the
biosynthesis and denaturation of the extracellular matrix with
growth, maturation, ageing, and degeneration. J Clin Invest.
98:996–1003. 1996. View Article : Google Scholar : PubMed/NCBI
|
|
15
|
Eyre DR and Muir H: Types I and II
collagens in intervertebral disc. Interchanging radial
distributions in annulus fibrosus. Biochem J. 157:267–270. 1976.
View Article : Google Scholar : PubMed/NCBI
|
|
16
|
Roberts S, Menage J, Duance V and Wotton
SF: Type III collagen in the intervertebral disc. Histochem J.
23:503–508. 1991. View Article : Google Scholar : PubMed/NCBI
|
|
17
|
Schollmeier G, Lahr-Eigen R and
Lewandrowski KU: Observations on fiber-forming collagens in the
anulus fibrosus. Spine (Phila Pa 1976). 25:2736–2741. 2000.
View Article : Google Scholar : PubMed/NCBI
|
|
18
|
Kazezian Z, Gawri R, Haglund L, Ouellet J,
Mwale F, Tarrant F, O'Gaora P, Pandit A, Alini M and Grad S: Gene
expression profiling identifies interferon signalling molecules and
IGFBP3 in human degenerative annulus fibrosus. Sci Rep.
5:156622015. View Article : Google Scholar : PubMed/NCBI
|
|
19
|
Thompson JP, Pearce RH, Schechter MT,
Adams ME, Tsang IK and Bishop PB: Preliminary evaluation of a
scheme for grading the gross morphology of the human intervertebral
disc. Spine (Phila Pa 1976). 15:411–415. 1990. View Article : Google Scholar : PubMed/NCBI
|
|
20
|
Gruber HE, Hoelscher GL, Ingram JA and
Hanley EN Jr: Genome-wide analysis of pain-, nerve- and
neurotrophin-related gene expression in the degenerating human
annulus. Mol Pain. 8:632012. View Article : Google Scholar : PubMed/NCBI
|
|
21
|
Gruber HE, Ingram JA, Hoelscher GL,
Zinchenko N, Hanley EN Jr and Sun Y: Asporin, a susceptibility gene
in osteoarthritis, is expressed at higher levels in the more
degenerate human intervertebral disc. Arthritis Res Ther.
11:R472009. View
Article : Google Scholar : PubMed/NCBI
|
|
22
|
Tsai TT, Lai PL, Liao JC, Fu TS, Niu CC,
Chen LH, Lee MS, Chen WJ and Fang HC: Increased periostin gene
expression in degenerative intervertebral disc cells. Spine J.
13:289–298. 2013. View Article : Google Scholar : PubMed/NCBI
|
|
23
|
Gruber HE, Hoelscher GL and Hanley EN Jr:
Annulus cells from more degenerated human discs show modified gene
expression in 3D culture compared with expression in cells from
healthier discs. Spine J. 10:721–727. 2010. View Article : Google Scholar : PubMed/NCBI
|
|
24
|
He J, Xue R, Li S, Lv J, Zhang Y, Fan L,
Teng Y and Wei H: Identification of the potential molecular targets
for human intervertebral disc degeneration based on bioinformatic
methods. Int J Mol Med. 36:1593–1600. 2015. View Article : Google Scholar : PubMed/NCBI
|
|
25
|
Tang Y, Wang S, Liu Y and Wang X:
Microarray analysis of genes and gene functions in disc
degeneration. Exp Ther Med. 7:343–348. 2014. View Article : Google Scholar : PubMed/NCBI
|
|
26
|
Guo W, Zhang B, Li Y, Duan HQ, Sun C, Xu
YQ and Feng SQ: Gene expression profile identifies potential
biomarkers for human intervertebral disc degeneration. Mol Med.
16:8665–8672. 2017.
|
|
27
|
Schubert AK, Smink JJ, Arp M, Ringe J,
Hegewald AA and Sittinger M: Quality assessment of surgical disc
samples discriminates human annulus fibrosus and nucleus pulposus
on tissue and molecular level. Int J Mol Sci. 19(pii): E17612018.
View Article : Google Scholar : PubMed/NCBI
|
|
28
|
Roberts S, Caterson B, Menage J, Evans EH,
Jaffray DC and Eisenstein SM: Matrix metalloproteinases and
aggrecanase: Their role in disorders of the human intervertebral
disc. Spine (Phila Pa 1976). 25:3005–3013. 2000. View Article : Google Scholar : PubMed/NCBI
|
|
29
|
Deng B, Ren JZ, Meng XQ, Pang CG, Duan GQ,
Zhang JX, Zou H, Yang HZ and Ji JJ: Expression profiles of MMP-1
and TIMP-1 in lumbar intervertebral disc degeneration. Genet Mol
Res. 14:19080–19086. 2015. View Article : Google Scholar : PubMed/NCBI
|
|
30
|
Weiler C, Nerlich AG, Zipperer J,
Bachmeier BE and Boos N: 2002 SSE Award Competition in Basic
Science: Expression of major matrix metalloproteinases is
associated with intervertebral disc degradation and resorption. Eur
Spine J. 11:308–320. 2002. View Article : Google Scholar : PubMed/NCBI
|
|
31
|
Le Maitre CL, Freemont AJ and Hoyland JA:
Localization of degradative enzymes and their inhibitors in the
degenerate human intervertebral disc. J Pathol. 204:47–54. 2004.
View Article : Google Scholar : PubMed/NCBI
|
|
32
|
Matsui Y, Maeda M, Nakagami W and Iwata H:
The involvement of matrix metalloproteinases and inflammation in
lumbar disc herniation. Spine (Phila Pa 1976). 23:863–869. 1998.
View Article : Google Scholar : PubMed/NCBI
|
|
33
|
Visse R and Nagase H: Matrix
metalloproteinases and tissue inhibitors of metalloproteinases:
Structure, function, and biochemistry. Circ Res. 92:827–839. 2003.
View Article : Google Scholar : PubMed/NCBI
|
|
34
|
Welgus HG, Jeffrey JJ and Eisen AZ: The
collagen substrate specificity of human skin fibroblast
collagenase. J Biol Chem. 256:9511–9515. 1981.PubMed/NCBI
|
|
35
|
Roberts S, Menage J, Duance V, Wotton S
and Ayad S: 1991 Volvo Award in basic sciences. Collagen types
around the cells of the intervertebral disc and cartilage end
plate: An immunolocalization study. Spine (Phila Pa 1976).
16:1030–1038. 1991. View Article : Google Scholar : PubMed/NCBI
|
|
36
|
Ye S, Ju B, Wang H and Lee KB: Bone
morphogenetic protein-2 provokes interleukin-18-induced human
intervertebral disc degeneration. Bone Joint Res. 5:412–418. 2016.
View Article : Google Scholar : PubMed/NCBI
|
|
37
|
Kim DJ, Moon SH, Kim H, Kwon UH, Park MS,
Han KJ, Hahn SB and Lee HM: Bone morphogenetic protein-2
facilitates expression of chondrogenic, not osteogenic, phenotype
of human intervertebral disc cells. Spine (Phila Pa 1976).
28:2679–2684. 2003. View Article : Google Scholar : PubMed/NCBI
|
|
38
|
Kim H, Lee JU, Moon SH, Kim HC, Kwon UH,
Seol NH, Kim HJ, Park JO, Chun HJ, Kwon IK and Lee HM: Zonal
responsiveness of the human intervertebral disc to bone
morphogenetic protein-2. Spine (Phila Pa 1976). 34:1834–1838. 2009.
View Article : Google Scholar : PubMed/NCBI
|
|
39
|
Hammes SR and Levin ER: Extranuclear
steroid receptors: Nature and actions. Endocr Rev. 28:726–741.
2007. View Article : Google Scholar : PubMed/NCBI
|
|
40
|
Bay-Jensen AC, Slagboom E, Chen-An P,
Alexandersen P, Qvist P, Christiansen C, Meulenbelt I and Karsdal
MA: Role of hormones in cartilage and joint metabolism:
Understanding an unhealthy metabolic phenotype in osteoarthritis.
Menopause. 20:578–586. 2013.PubMed/NCBI
|
|
41
|
Song XX, Yu YJ, Li XF, Liu ZD, Yu BW and
Guo Z: Estrogen receptor expression in lumbar intervertebral disc
of the elderly: Gender- and degeneration degree-related variations.
Joint Bone Spine. 81:250–253. 2014. View Article : Google Scholar : PubMed/NCBI
|
|
42
|
Chen H, Herndon ME and Lawler J: The cell
biology of thrombospondin-1. Matrix Biol. 19:597–614. 2000.
View Article : Google Scholar : PubMed/NCBI
|
|
43
|
Gruber HE, Ingram JA and Hanley EN Jr:
Immunolocalization of thrombospondin in the human and sand rat
intervertebral disc. Spine (Phila Pa 1976). 31:2556–2561. 2006.
View Article : Google Scholar : PubMed/NCBI
|
|
44
|
Risbud MV and Shapiro IM: Role of
cytokines in intervertebral disc degeneration: Pain and disc
content. Nat Rev Rheumatol. 10:44–56. 2014. View Article : Google Scholar : PubMed/NCBI
|
|
45
|
Dagistan Y, Cukur S, Dagistan E and Gezici
AR: Importance of IL-6, MMP-1, IGF-1, and BAX levels in lumbar
herniated disks and posterior longitudinal ligament in patients
with sciatic pain. World Neurosurg. 84:1739–1746. 2015. View Article : Google Scholar : PubMed/NCBI
|
|
46
|
Kang JD, Georgescu HI, McIntyre-Larkin L,
Stefanovic-Racic M, Donaldson WF III and Evans CH: Herniated lumbar
intervertebral discs spontaneously produce matrix
metalloproteinases, nitric oxide, interleukin-6, and prostaglandin
E2. Spine (Phila Pa 1976). 21:271–277. 1996. View Article : Google Scholar : PubMed/NCBI
|
|
47
|
Studer RK, Vo N, Sowa G, Ondeck C and Kang
J: Human nucleus pulposus cells react to IL-6: Independent actions
and amplification of response to IL-1 and TNF-α. Spine (Phila Pa
1976). 36:593–599. 2011. View Article : Google Scholar : PubMed/NCBI
|
|
48
|
Takahashi H, Suguro T, Okazima Y, Motegi
M, Okada Y and Kakiuchi T: Inflammatory cytokines in the herniated
disc of the lumbar spine. Spine (Phila Pa 1976). 21:218–224. 1996.
View Article : Google Scholar : PubMed/NCBI
|
|
49
|
Specchia N, Pagnotta A, Toesca A and Greco
F: Cytokines and growth factors in the protruded intervertebral
disc of the lumbar spine. Eur Spine J. 11:145–151. 2002. View Article : Google Scholar : PubMed/NCBI
|
|
50
|
Shamji MF, Setton LA, Jarvis W, So S, Chen
J, Jing L, Bullock R, Isaacs RE, Brown C and Richardson WJ:
Proinflammatory cytokine expression profile in degenerated and
herniated human intervertebral disc tissues. Arthritis Rheum.
62:1974–1982. 2010.PubMed/NCBI
|
|
51
|
Lee S, Moon CS, Sul D, Lee J, Bae M, Hong
Y, Lee M, Choi S, Derby R, Kim BJ, et al: Comparison of growth
factor and cytokine expression in patients with degenerated disc
disease and herniated nucleus pulposus. Clin Biochem. 42:1504–1511.
2009. View Article : Google Scholar : PubMed/NCBI
|