Introduction
Osteoporosis, which primarily affects older women,
is defined as a systemic skeletal disease characterized by low bone
mass, and deterioration of bone tissue (1,2). The
occurrence of osteoporosis is mainly caused by micro-architectural
deterioration of bone tissues, which leads to decreased skeletal
strength and increased susceptibility to fractures. Human
mesenchymal stem cells (hMSCs) have the capacity to differentiate
into fabricate cartilage, muscle, marrow stroma, tendon/ligament,
fat, and other connective tissues, providing a potential source for
tissue regeneration (3,4). It has shown that hMSCs could enhance
bone regeneration and repair in animal models for bone regeneration
as well as in clinical practice.
Normally, osteoclast cells resorb bone in bone
marrow and deposit new bone by osteoblast. Recently, it was
reported that the key TFs play significant roles in osteogenesis
through binding with cis-regulatory elements to control expression
levels of downstream genes (5). The
proliferation and differentiation of osteoblasts are regulated by
many TFs including the HLH protein family members, leucine zipper
protein, zinc finger protein and ischemic zone protein (6). Furthermore, Harada et al
(7) have found that Cbfa1 and OSF2
were essential TFs for osteoblast differentiation and bone
formation. In addition, Hanai et al (8) demonstrated that Cbfa1 and other
molecules form complexes that interact closely during osteoblast
differentiation. Moreover, these observations indicated Cbfa1 is
not a sufficient TF for osteoblast differentiation. The studies
suggested that osteogenesis was achieved under the combined
regulation of multiple TFs and many limitations existed to studying
a single TF. Therefore, it may be more conducive to understanding
the mechanism of osteogenesis that multiple TFs were integrated to
observe their combined effects on osteogenesis.
Thus, we proposed a TF prognosis system (TFpro),
which combined the regulatory network of gene expression data to
predict key and essential TFs that induced cell transformation. In
the present study, LIMMA was used for identifying the different
expression gene taken from Array Express dataset. Next, the Fish
enrichment analysis was used for identifying the TFs which targeted
differential expression genes. Then, we calculated a TF gene-based
and net-based sphere of influence and ranked the TFs on the basis
of the above results. Finally, we obtained the key TFs of
osteogenesis.
Materials and methods
Data source and data
preprocessing
The profile E-GEOD-18043 (http://www.genelibs.com/gen/command/search/experiment/detail/58610)
was downloaded from Array Express serving as a public genetic chip
database. In the original research, 12 samples were selected for
analysis, including 3 control samples (Table I) and 9 experimental samples
(Table II), and the latter included
gene expression profiles generated by hMSCs after the 1st, 3rd and
7th day of dexamethasone stimulation (3 samples, respectively).
Operationally, we converted the expression profile from probe level
to gene symbol level and removed duplicate symbols. Finally, the
expression data of 20,514 genes were captured.
 | Table I.The information of 3 control
samples. |
Table I.
The information of 3 control
samples.
|
|
|
| Characteristics |
|
|
|---|
|
|
|
|
|
|
|
|---|
| Sample number | Title | Sample type | Cell type | Sex | Age | Treatment | Extraction
protocol | Label |
|---|
| GSM250019 | BM-MSC culture rep
1 | RNA | Bone marrow-derived
mesenchymal stem cells | Male | 67 years | None | RNA was collected
using the RNeasy mini kit (Qiagen) | Biotin |
| GSM250020 | BM-MSC culture rep
2 | RNA | Bone marrow-derived
mesenchymal stem cells | Male | 72 years | None | RNA was collected
using the RNeasy mini kit (Qiagen) | Biotin |
| GSM250021 | BM-MSC culture rep
3 | RNA | Bone marrow-derived
mesenchymal stem cells | Female | 74 years | None | RNA was collected
using the RNeasy mini kit (Qiagen) | Biotin |
| Table II.The information of 9 experiment
samples. |
Table II.
The information of 9 experiment
samples.
|
|
|
|
Characteristics |
|
|
|---|
|
|
|
|
|
|
|
|---|
| Sample number | Title | Sample type | Cell type | Sex | Age | Treatment | Extraction
protocol | Label |
|---|
| GSM451153 | BM-MSC culture
osteogenic induction for 1 day rep 1 | RNA | Bone marrow-
derived mesenchymal stem cells | Male | 67 years | Dexamethasone | 1 day | RNA was collected
using the RNeasy mini kit (Qiagen). | Biotin |
| GSM451154 | BM-MSC culture
osteogenic induction for 1 day rep 2 | RNA | Bone marrow-
derived mesenchymal stem cells | Male | 72 years | Dexamethasone | 1 day | RNA was collected
using the RNeasy mini kit (Qiagen). | Biotin |
| GSM451155 | BM-MSC culture
osteogenic induction for 1 day rep 3 | RNA | Bone marrow-
derived mesenchymal stem cells | Female | 74 years | Dexamethasone | 1 day | RNA was collected
using the RNeasy mini kit (Qiagen). | Biotin |
| GSM451156 | BM-MSC culture
osteogenic induction for 3 day rep 1 | RNA | Bone marrow-
derived mesenchymal stem cells | Male | 67 years | Dexamethasone | 3 day | RNA was collected
using the RNeasy mini kit (Qiagen). | Biotin |
| GSM451157 | BM-MSC culture
osteogenic induction for 3 day rep 2 | RNA | Bone marrow-
derived mesenchymal stem cells | Male | 72 years | Dexamethasone | 3 day | RNA was collected
using the RNeasy mini kit (Qiagen). | Biotin |
| GSM451158 | BM-MSC culture
osteogenic induction for 3 day rep 3 | RNA | Bone marrow-
derived mesenchymal stem cells | Female | 74 years | Dexamethasone | 3 day | RNA was collected
using the RNeasy mini kit (Qiagen). | Biotin |
| GSM451159 | BM-MSC culture
osteogenic induction for 7 day rep 1 | RNA | Bone marrow-
derived mesenchymal stem cells | Male | 67 years | Dexamethasone | 7 day | RNA was collected
using the RNeasy mini kit (Qiagen). | Biotin |
| GSM451160 | BM-MSC culture
osteogenic induction for 7 day rep 2 | RNA | Bone marrow-
derived mesenchymal stem cells | Male | 72 years | Dexamethasone | 7 day | RNA was collected
using the RNeasy mini kit (Qiagen). | Biotin |
| GSM451161 | BM-MSC culture
osteogenic induction for 7 day rep 3 | RNA | Bone marrow-
derived mesenchymal stem cells | Female | 74 years | Dexamethasone | 7 day | RNA was collected
using the RNeasy mini kit (Qiagen). | Biotin |
Screening for DEGs
LIMMA package (5) was
used to calculate the differential expression of genes from the 9
experimental samples and 3 control samples to screen for DEGs. If
the number of DEGs was <300, the difference between the
screening expression value of the first 300 would be DEGs. LIMMA
performed t-test and F-test on the gene expression matrix, the
lmFit function was used for linear fitting, eBayes statistics, and
FDR-corrected P-values (≤0.05).
Gene set enrichment analysis
Each TF has corresponding regulatory genes. If these
regulatory genes are coincidentally included in these DEGs, then,
their TFs may have a regulatory effect on osteogenesis. Therefore,
it is necessary to carry out enrichment analyses of these
differentially expressed genes to see if there are still some
potential TFs which have a regulatory effect on osteogenesis. In
view of this, Fisher's test (9) was
used to identify enriched TFs in our study. In detail, Fisher's
test was used to determine if the two overall ratios are equal.
That is, the random ratio is equal to the experimental ratio. The
null hypothesis assumed that the two population ratios were equal
(H0: p1 = p2); alternative hypotheses might be left-tailed (p1
<p2), right tail (p1 >p2), or two-tailed (p1 ≠ p2).
The impact factor of TFs
Direct influence value of TFs
TFs with a high level of influence were determined
through a formula, in which the fold changes expressed in
logarithmic transformation and the FDR adjusted P-value was
converted to individual gene scores. The analytical formula is as
follows:
Gxs=|Lxs|(−log10Pxs)
In this formula, L is the difference log FC value of
the relevant genes, and the P-value is the difference P-value
calculated by LIMMA. This formula showed the changes of the target
gene for each TF. If a TF regulated many genes these genes had
large changes, the gene's G score would be higher. Thus, using this
method allowed finding the more common TFs. Furthermore, when
comparing the G score, the average G score, and the number of
genes, we could obtain a rank score, the lower scores indicating
that the impact of this gene was greater in the comprehensive
consideration.
Indirect network influence value of
TFs
TFs could not only affect the expression of changes,
but also co-expression with their target genes. Thus, in order to
assess the importance of each TF co-expressed in the network, we
used STRING database and TF library (TF library from the above
three databases) to calculate the impact of TFs on the local area.
TF library, which represents a low-level, targeted regulatory
interaction network, provides protein-DNA interactions for TFs with
known binding sites in the promoter region of the genes. On the
other hand, STRING, which provides a view that directly and
indirectly affects the interaction of gene expression, is an
interactive metadata library that contains various interactions of
protein-protein, protein-DNA and protein-RNA interactions and
biological pathways (5). The final
STRING correlation value was obtained by multiplying the Pearson's
correlation coefficient between the STRING database score and the
actual data. We performed a weighted sum of the genetic effects on
the local network neighborhoods of TFs. Moreover, the correlation
coefficient between the TF and the target gene is obtained by
STRING database scores or TF database scores as the following
formulas:
TFCors,r=StringDatabaseCor(s,r)
or TFCors,r=TFDatabaseCor(s,r)
TF database score was calculated as the formula:
TFDatabaseCor(s,r)=0.7+N*0.1
(N is the number of records of the interaction
between the s and r genes of the database, the value of 0–1). The
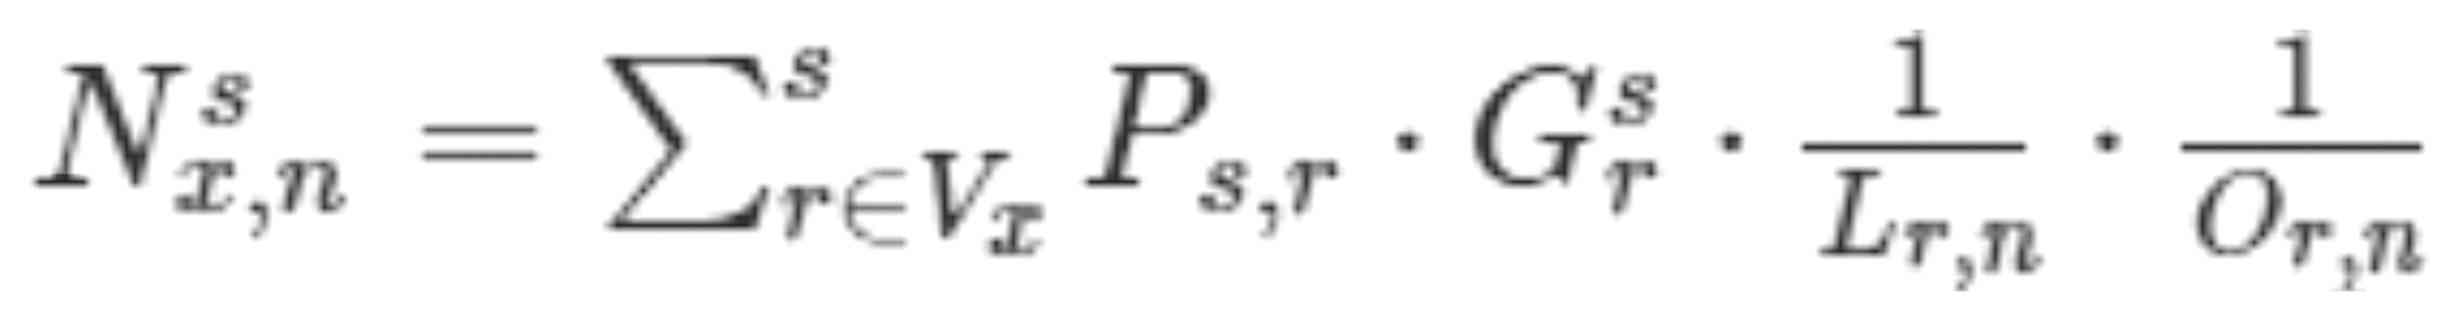
formulas for performing this weighted sum were as follows:
Nx,ns = ∑r∈VxsPs,r · Grs · 1Lr,n ·1Or,n
In this formula, Ns x,n was weighted sum of TFs,
Ps,r was the correlation coefficient between the TF and
the affected genes, Lr,n represented the distance
between the gene and the TF, Or,n represented the
connectivity of the parent node. It should be noted that
Ps,r was calculated by the following formula:
Ps,r=TFCor(s,r)*Pearson(s,r)
Construction of protein-protein interaction (PPI)
networks. In the network of interactions between proteins, gene
functions also show some form of correlation (10). At this stage, PPI networks were used
to observe the gene pairs between the two differently expressed
groups. Firstly, we calculated the co-expression of two genes in
the control groups as well as the co-expression of two genes in the
experimental groups. Next, the differences between the
co-expression values of the two genes in the two groups were
calculated and the differences were taken as an absolute value.
Finally, we multiplied this value with the background value and
corrected it.
Results
The acquisition of DEGs
We extracted the genes that met the following
conditions in the tested linear model: | logFC | ≥2 and P<0.05,
a total of 300 differentially expressed genes were obtained.
Furthermore, the 1st, 3rd and 7th day of the first 10 differences
in gene logFC charts are shown in Fig.
1A. The relative venn diagrams are shown in Fig. 1B. In this step, the DEG had no TFs,
we continued to obtain the influential TFs through following the
calculation.
Acquisition of TF genes from
enrichment results
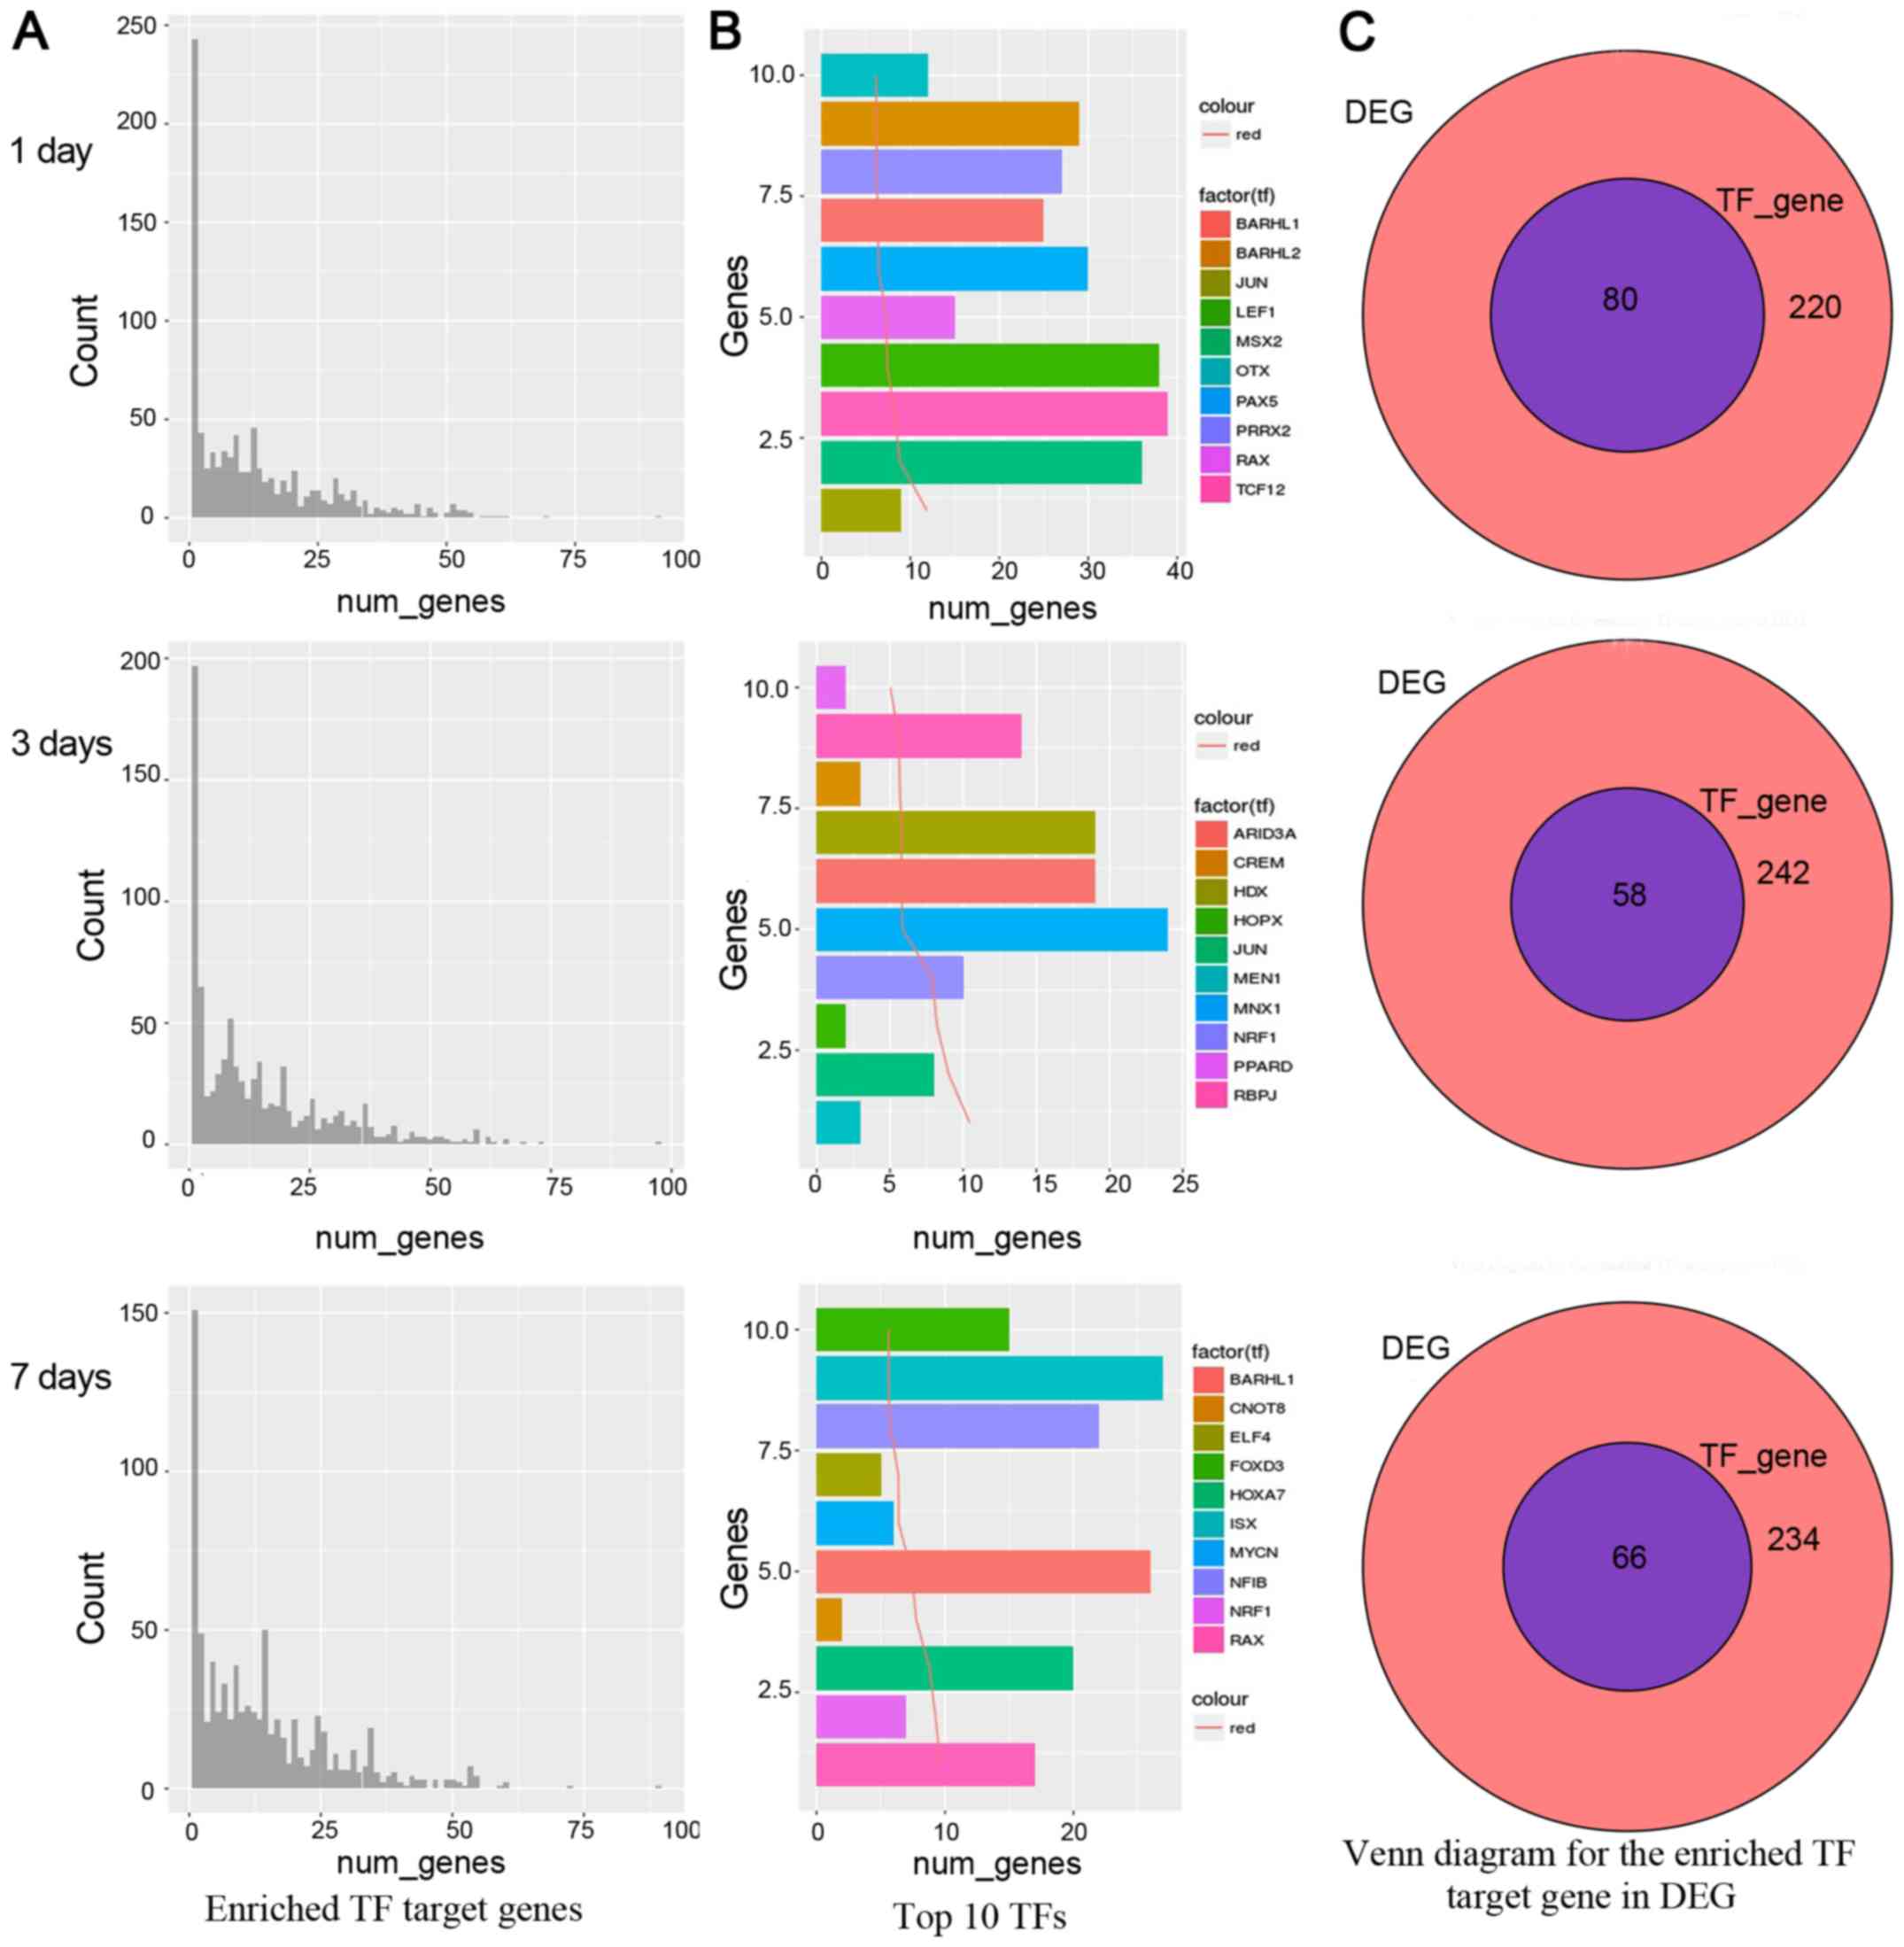
In the gene number distribution charts as shown in
Fig. 2A, on the 1st, 3rd and 7th
day, a small number of TFs enriched most target genes, while the
majority TFs were not abundant. It indicated our attention should
focus on the TFs which enriched most target gene TFs. We also
analyzed the first 10 TFs, as shown in Fig. 2B, TCF12 had 39 genes on the 1st day.
MNX1 had 24 genes on the 3rd day and ISX factor had 27 genes on the
7th day. The target genes for these genes are abundant in
differential genes. However, the presence of a large number of
target genes may also be more commonly caused by genes regulated by
these TFs, such as TFs associated with cell cycle regulation.
Therefore, an in-depth analysis of these TFs to find the most
affecting TF is more critical in the disease state. Moreover, if
these top 10 TFs affect most of the differential genes, it is
likely that these TFs are keys to regulation. Finally, we merged
the TFs from the DEGs and enrichment analysis. On the 1st day, TFs
were JUN, MSX2, TCF12, LEF1, RAX, PAX5, BARHL1, PRRX2, BARHL2, OTX.
On the 3rd day, TFs were MEN1, JUN, HOPX, NRF1, MNX1, ARID3A, HDX,
CREM, RBPJ, PPARD. On the 7th day, TFs were RAX, NRF1, HOXA7,
CNOT8, BARHL1, MYCN, ELF4, NFIB, ISX, FOXD3. The relative venn
diagrams are shown in Fig. 2C, in
total 80, 58, 66 transcription factor genes were obtained by
enrichment analysis on the 1st, 3rd and 7th day, respectively.
These results suggest that the transcription factors rich in genes
may be the focus of further research attention.
Determination of the direct influence
value of TFs
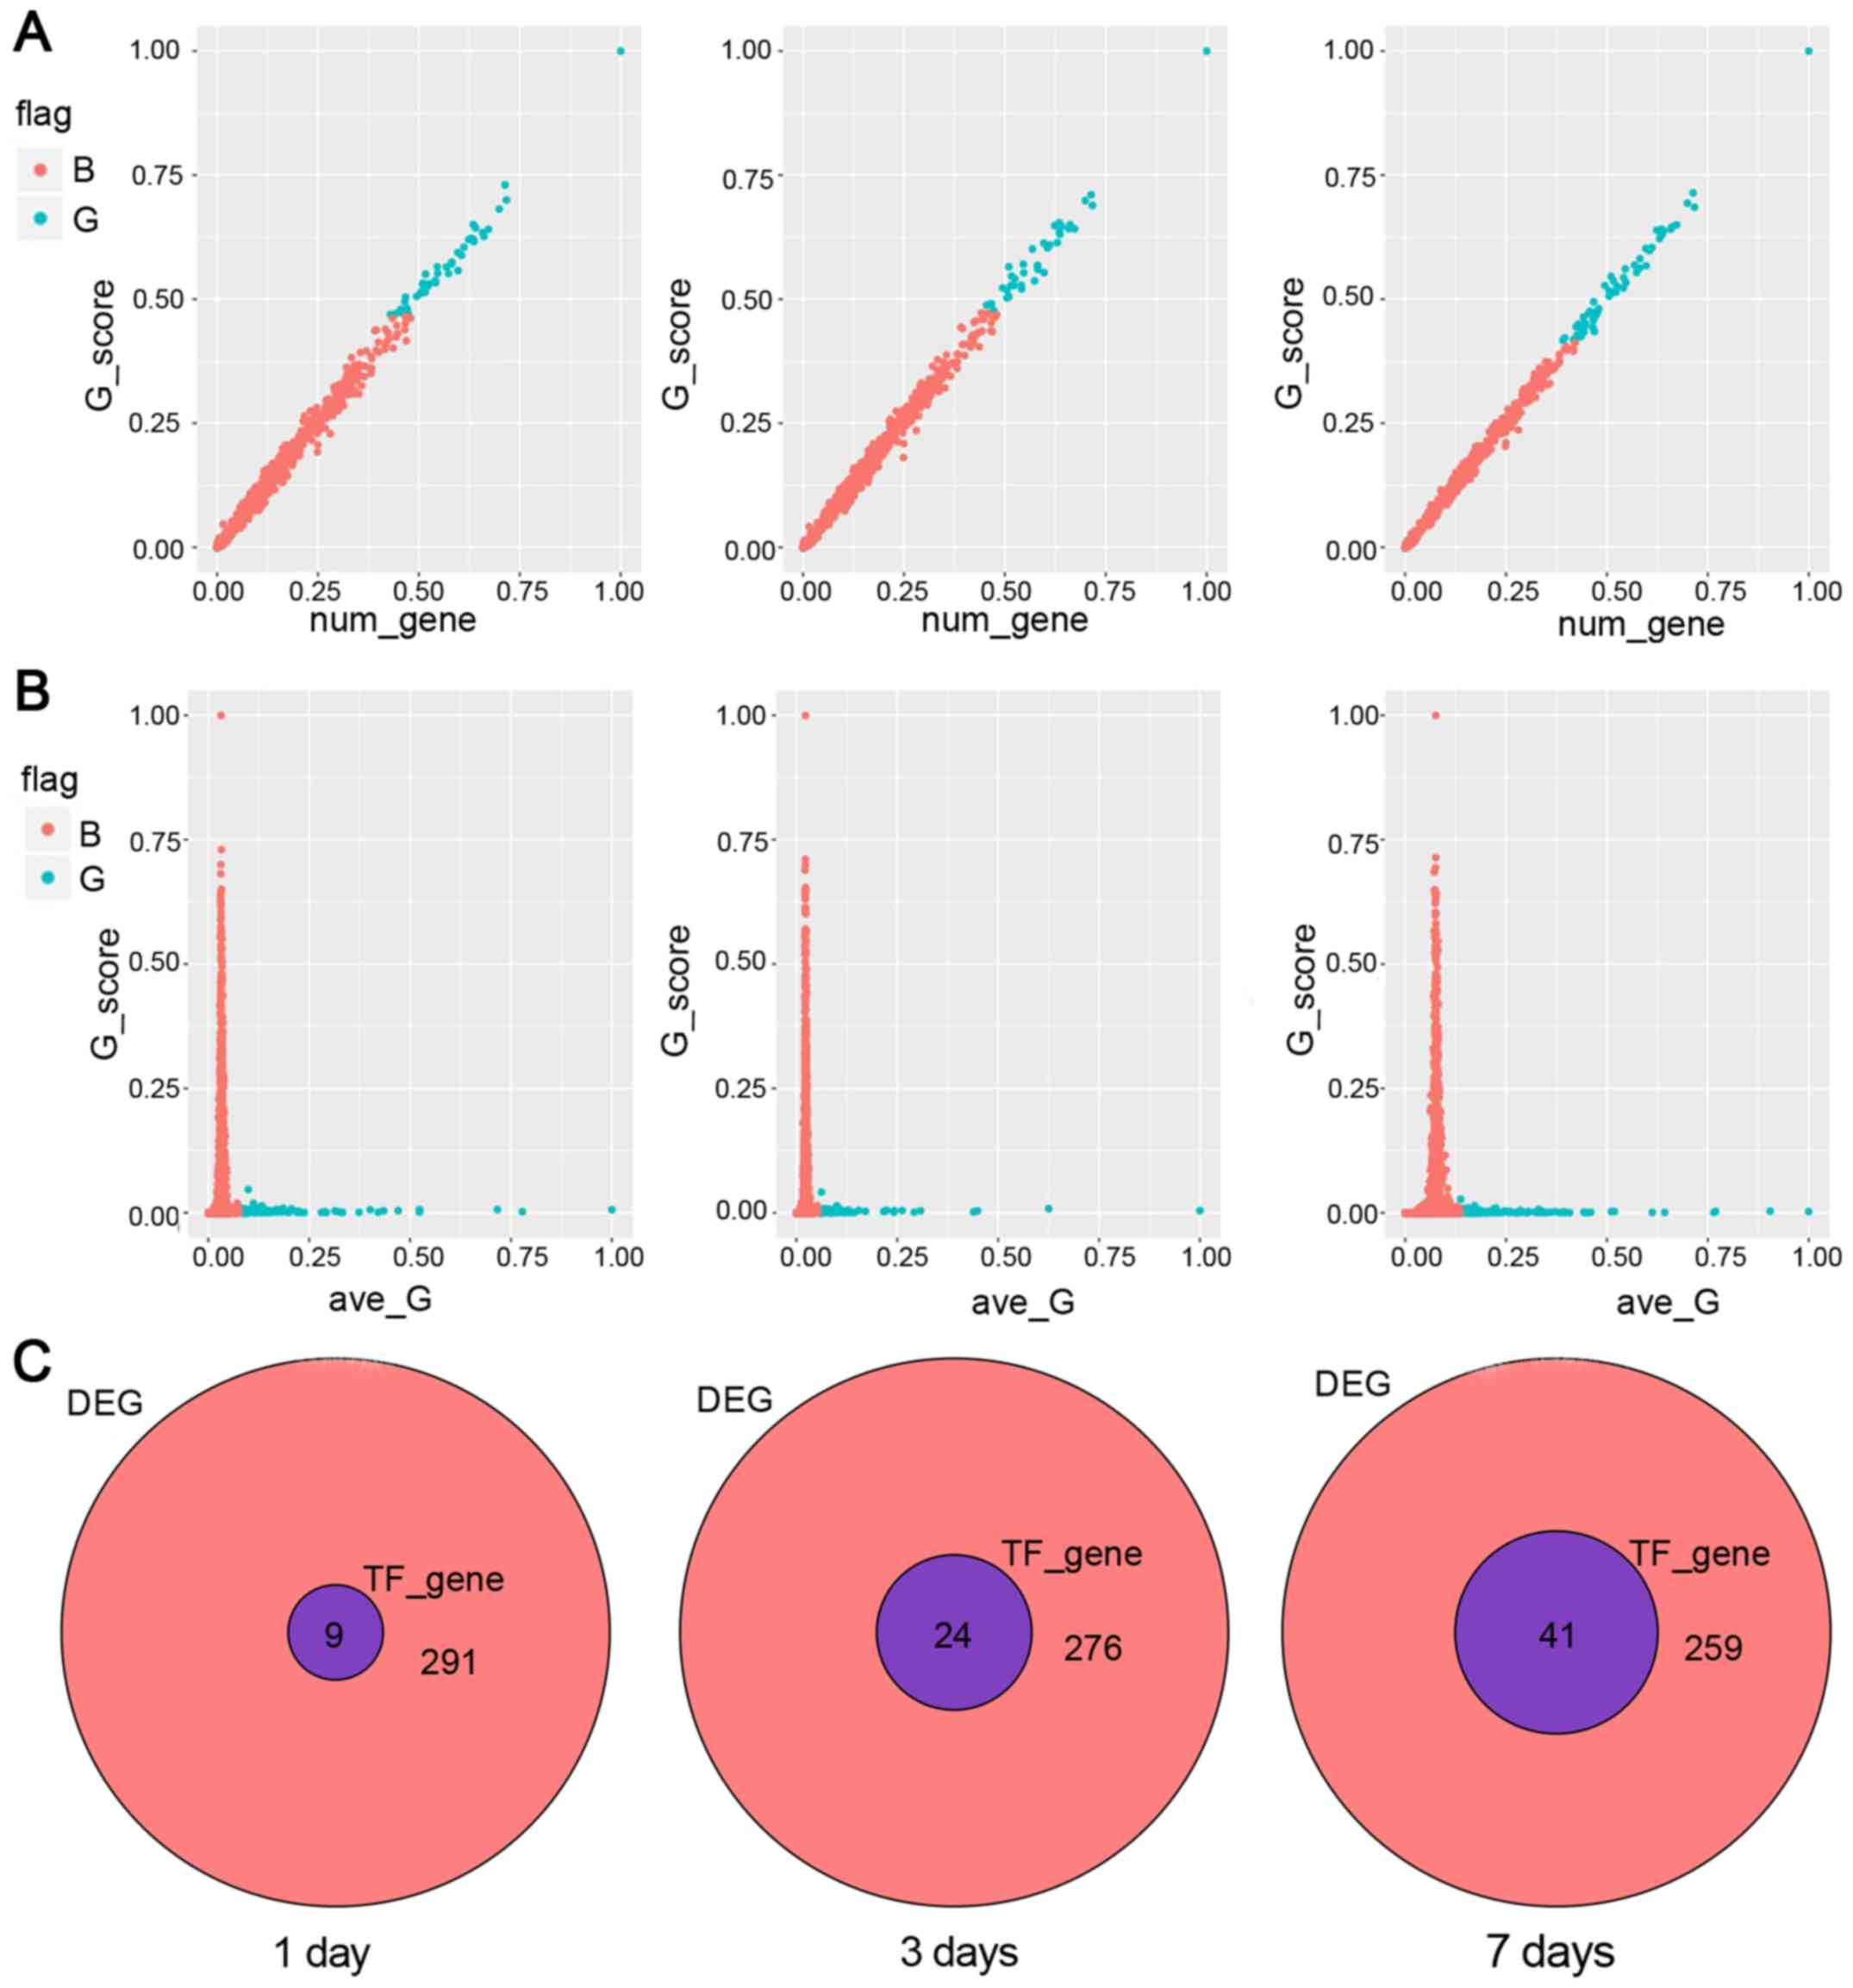
First, we analyzed the relationship between the
value of G and the effects of genes. In general, the influence of
TFs would go up with the increase of the number of regulated genes.
Furthermore, attention was paid to the TFs which the influence were
deviated from the trajectory. As shown in Fig. 3A, blue points represent points
<0.5. Second, we observed the relationship between the influence
ability and the average G score. Generally, TFs with more influence
had smaller average value, while the average value of large TFs was
usually gathered in the smaller G value. As shown in Fig. 3B, blue dots indicated the average of
TFs above the overall mean ± SD%. Simultaneously, we judged the
influence ability of TFs and observed the top 10 TFs. We found that
they could affect most of the DEGs. On the 1st day, the top 10 TFs
were SP1, HMGN1, SLA2, HOPX, NCOA6, MTA3, HF1H3B, CITED2, EGR,
FLI1. On the 3rd day, the top 10 TFs were SP1, NPAS1, HOPX, HF1H3B,
FLI1, EGR, HMGN1, ZNF529, PAX4, SP3. On the 7th day, the top 10 TFs
were SP1, HMGN1, HOPX, PLEK2, TOB1, ANKRD22, SLA2, NCOA6, CTBP1,
HF1H3B. The relative venn diagrams are shown in Fig. 3C. In total 9, 24, 41 TF genes were
obtained by using direct influence value method.
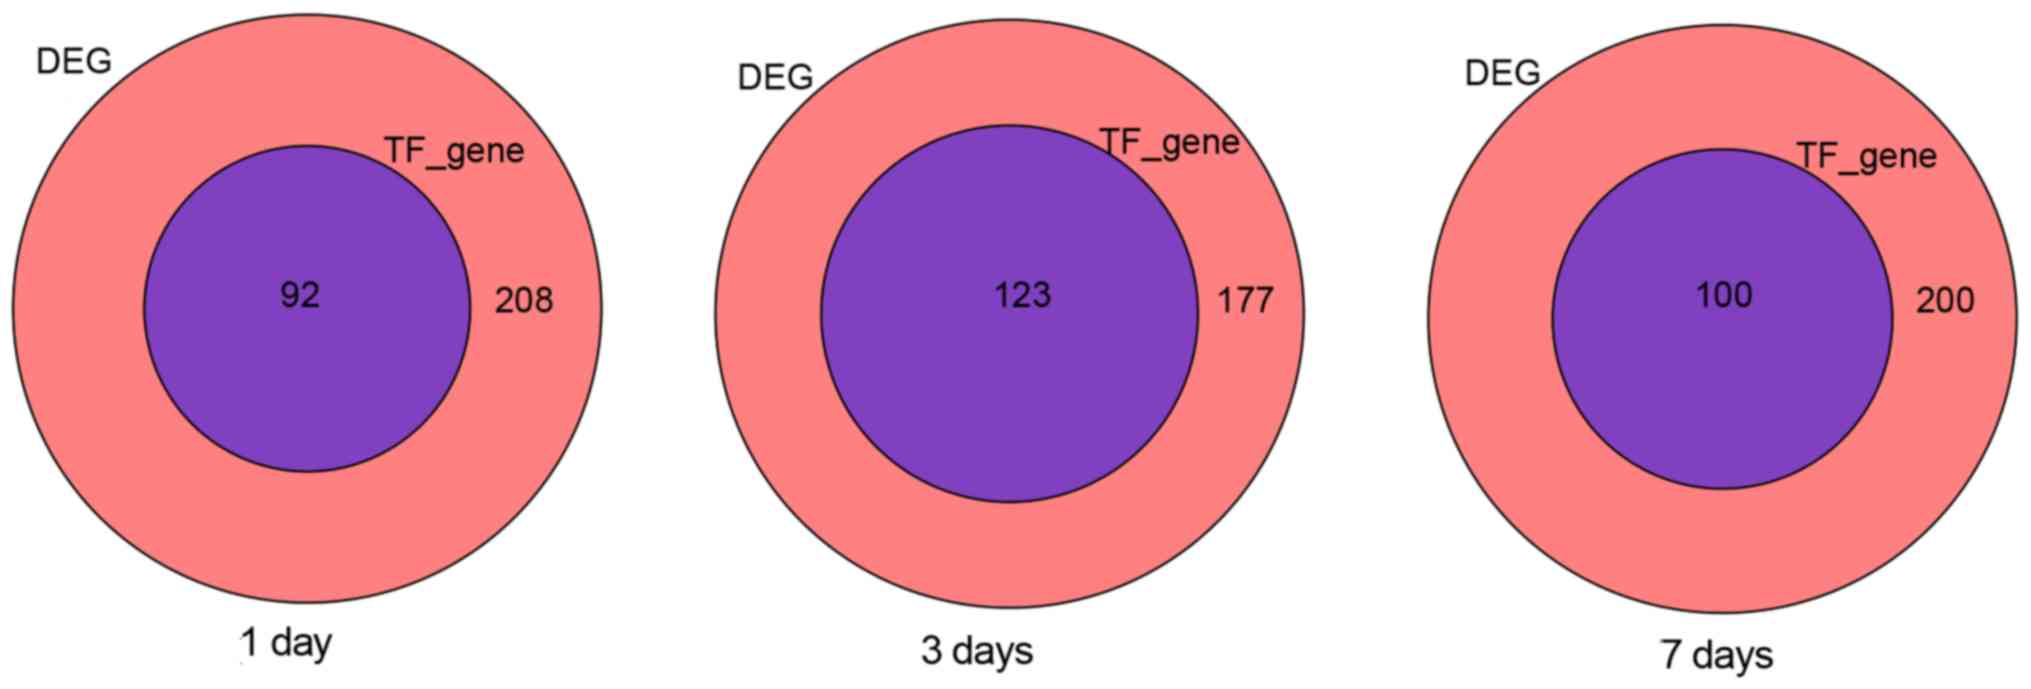
Determination of the network indirect
influence value of TFs
This local network was limited to a maximum of three
edges. The effect node at each edge was further reduced from the
seed TFs, which were located and depended on the extent of its
parental prominence. Through the above formula analysis, as shown
in Fig. 4, on the 1st, 3rd and 7th
day, we obtained 92, 123, 100 target genes by using the indirect
impact value method.
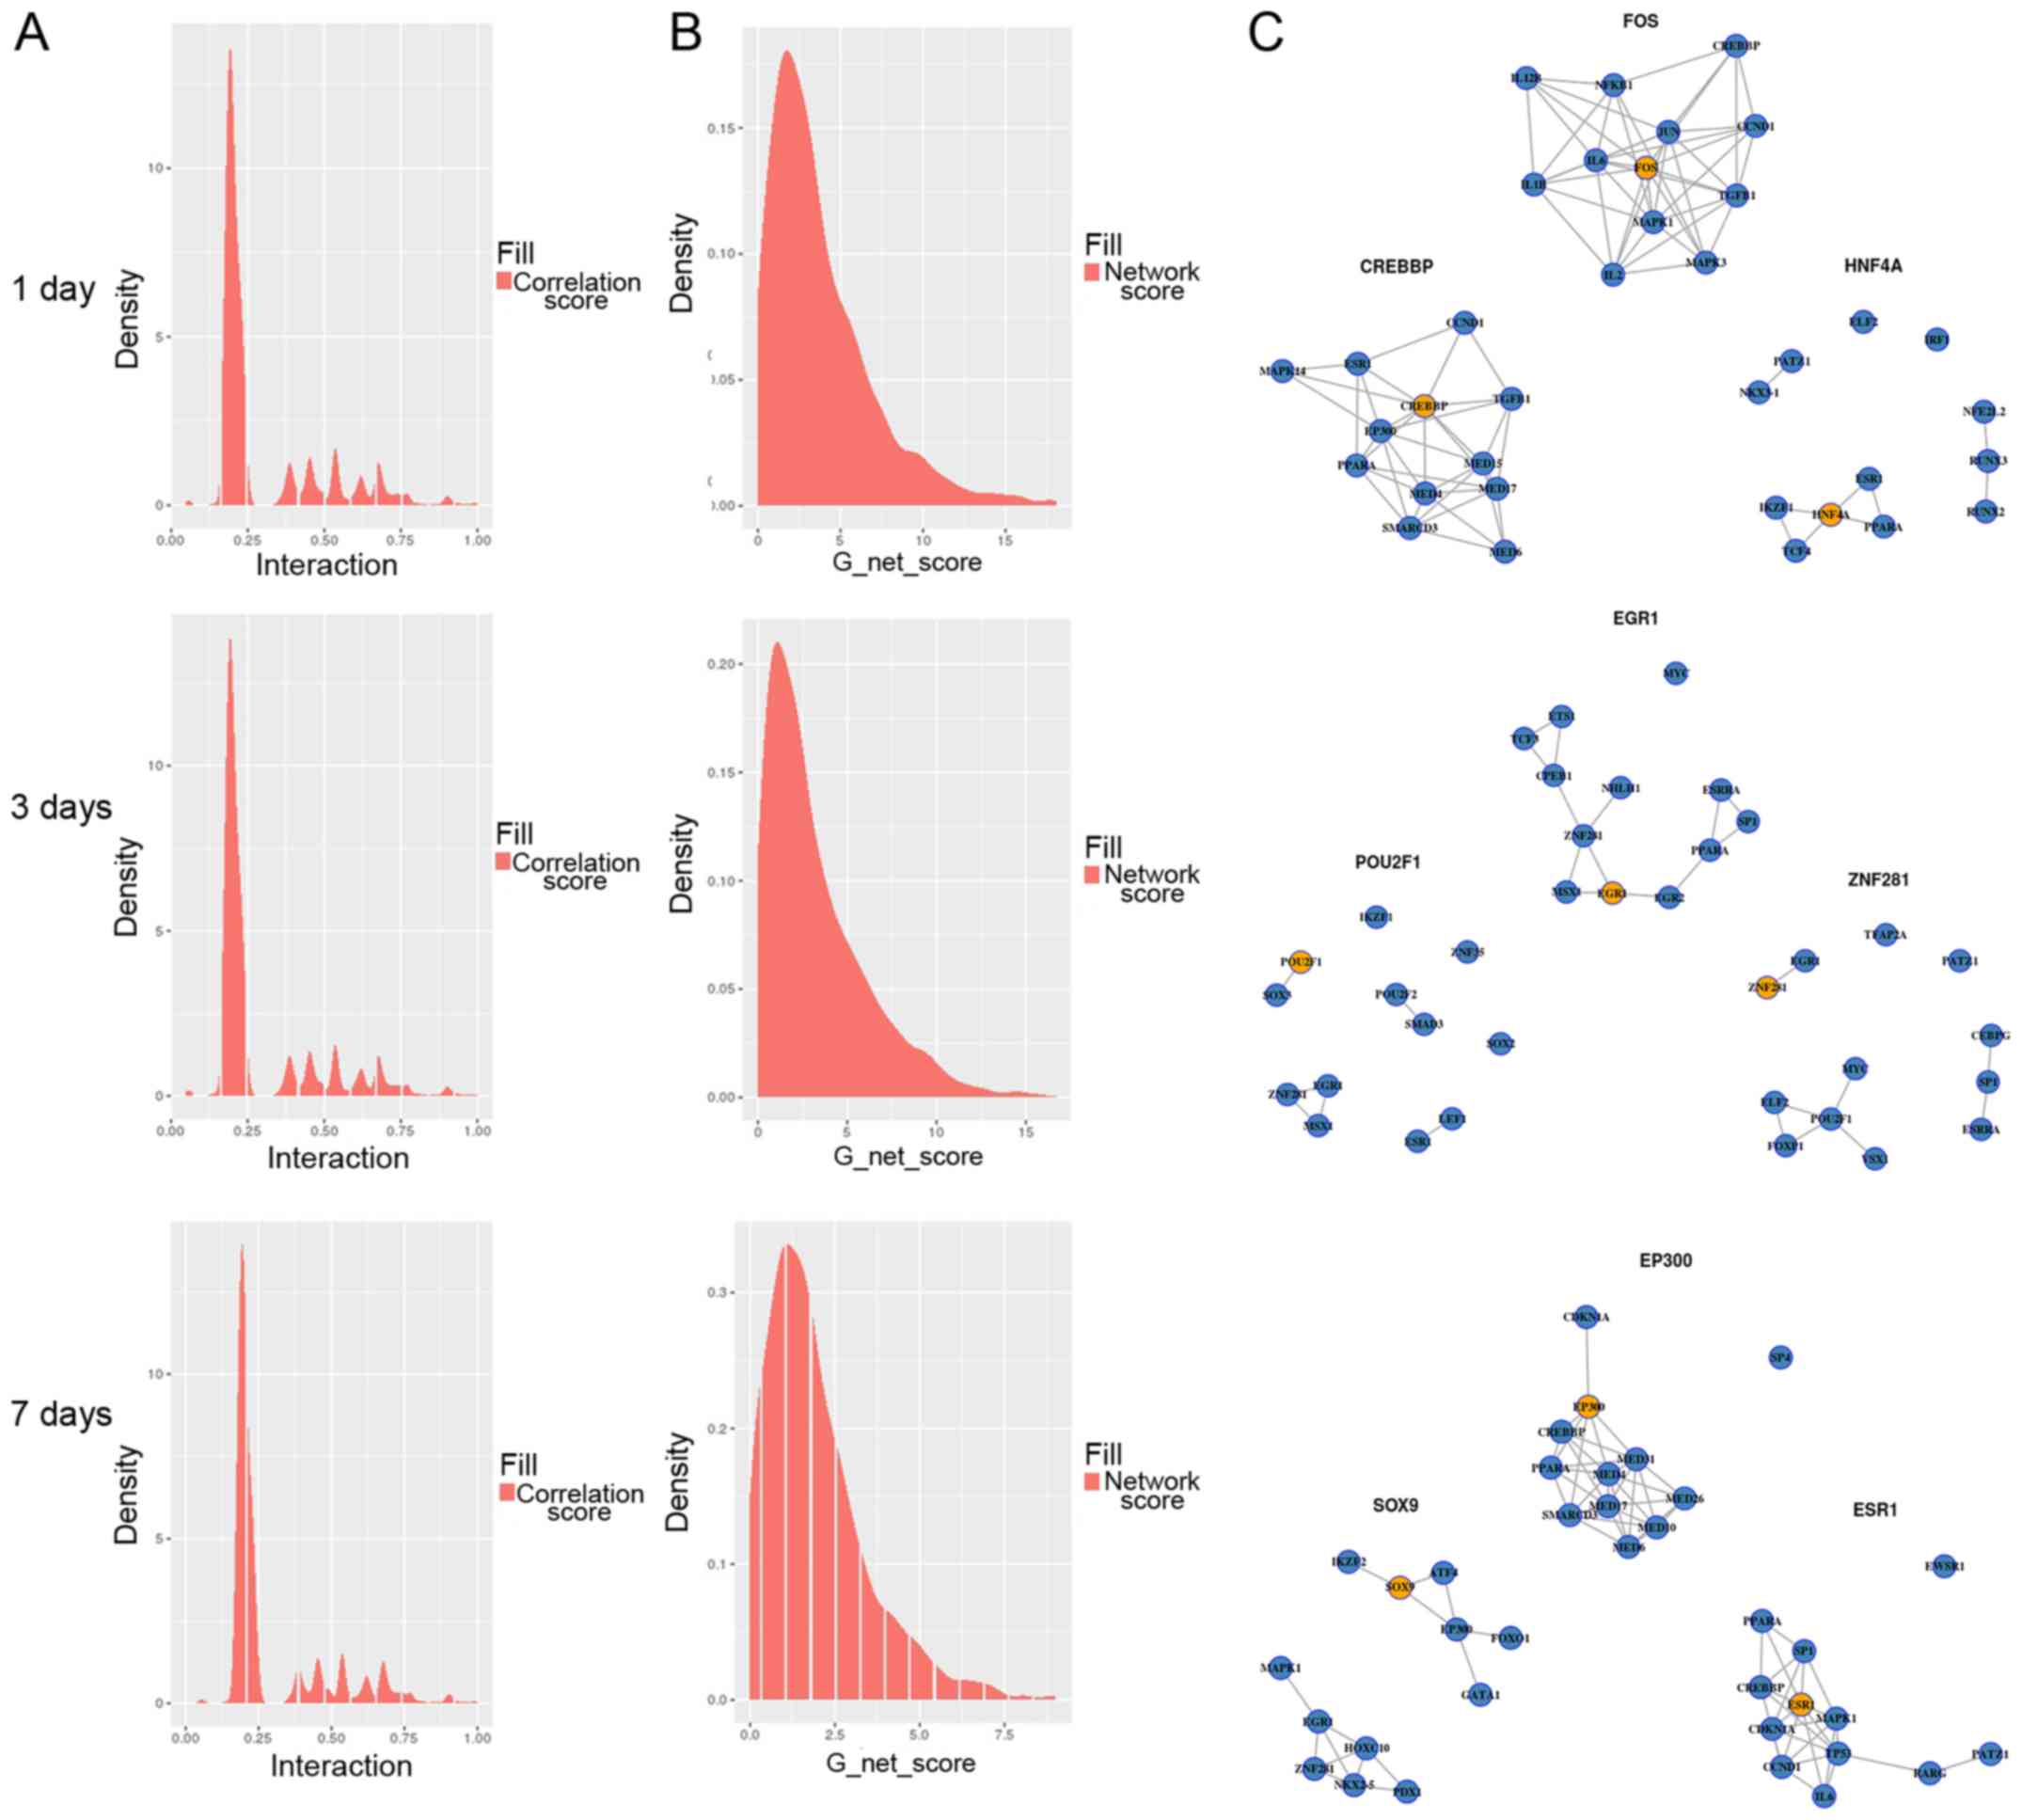
Determination of PPI final network
edge value
The PPI gave us information on the distribution of
the network edge value. As shown in Fig.
5A, the density of border values was mostly converged in the
middle area, and the set of co-expressive, right-hand sides of the
graphs were important for us. In the G network score distribution
(Fig. 5B), G values were not evenly
distributed, and most of the TFs had low G network scores. In
general, those well-behaved TFs need to be screened. In Fig. 5C, the network graph of the three TFs
for the highest network pathway G value from the 1st, 3rd and 7th
day are shown. The orange dot indicates the TFs, and the blue dots
are the regulatory genes. On the 1st day, the top 10 TFs were FOS,
CREBBP, HNF4A, IRF1, ESR1, SOX9, EP300, IRF9, FOXO4, MEIS1. On the
3rd day, the top 10 TFs were EGR1, POU2F1, ZNF281, ESR1, PPARA,
MYC, SP1, FOS, SOX9, EP300. On the 7th day, the top 10 TFs were
EP300, SOX9, ESR1, EGR1, CREBBP, FOXJ3, IKZF2, FOS, NR3C1,
ZNF281.
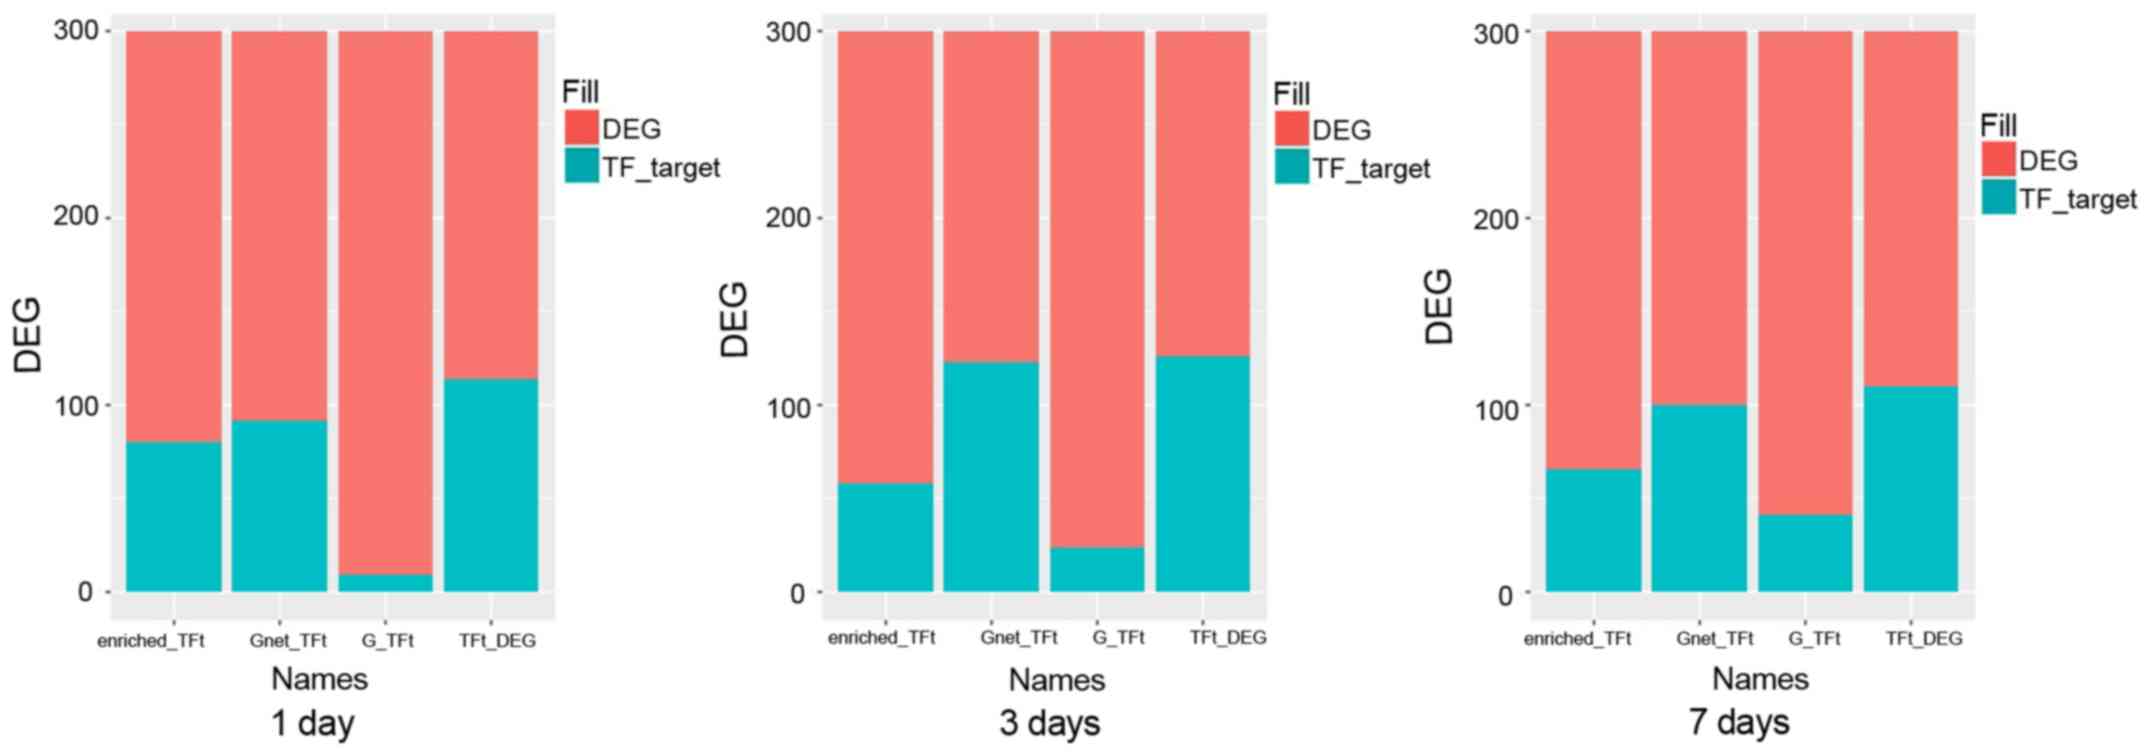
The coverage of TFs
In general, TFs should cover most DEGs. As shown in
Fig. 6, we analyzed the various
results to obtain the TF genes and finally obtained the best
combination. The enriched-TFt represents TF-related differential
genes that are screened by enrichment. The Gnet-TFt represents
TF-related differential genes that are screened by indirect impact
value. The G-TFt represents TF-related differential genes that are
screened by direct impact value. The TFt-DEG represents TF-related
differential genes that are screened by the above three methods.
The first 10 combinations of the best genotypes obtained for each
method were the ‘TFall’ group, which are shown in Tables III–V in detail (days 1, 3, 7,
respectively).
| Table III.The best genotypes ‘TFall’ group on
day 1. |
Table III.
The best genotypes ‘TFall’ group on
day 1.
| Rank | Gene | Rank | Gene | Rank | Gene |
|---|
| 1 | JUN | 11 | SP1 | 21 | FOS |
| 2 | MSX2 | 12 | HMGN1 | 22 | CREBBP |
| 3 | TCF12 | 13 | SLA2 | 23 | HNF4A |
| 4 | LEF1 | 14 | HOPX | 24 | IRF1 |
| 5 | RAX | 15 | NCOA6 | 25 | ESR1 |
| 6 | PAX5 | 16 | MTA3 | 26 | SOX9 |
| 7 | BARHL1 | 17 | HF1H3B | 27 | EP300 |
| 8 | PRRX2 | 18 | CITED2 | 28 | TRF9 |
| 9 | BARHL2 | 19 | EGR | 29 | FOXO4 |
| 10 | OTX | 20 | FLI1 | 30 | MEIS1 |
| Table V.The best genotypes ‘TFall’ group on
day 7. |
Table V.
The best genotypes ‘TFall’ group on
day 7.
| Rank | Gene | Rank | Gene | Rank | Gene |
|---|
| 1 | RAX | 11 | SP1 | 21 | EP300 |
| 2 | NRF1 | 12 | HMGN1 | 22 | SOX9 |
| 3 | HOXA7 | 13 | HOPX | 23 | ESR1 |
| 4 | CNOT8 | 14 | PLEK2 | 24 | EGR1 |
| 5 | BARHL1 | 15 | TOB1 | 25 | CREBBP |
| 6 | MYCN | 16 | ANKRD22 | 26 | FOXJ3 |
| 7 | ELF4 | 17 | SLA2 | 27 | IKZF2 |
| 8 | NFIB | 18 | NCOA6 | 28 | FOS |
| 9 | ISX | 19 | CTBP1 | 29 | NR3C1 |
| 10 | FOXD3 | 20 | HF1H3B | 30 | ZNF281 |
Discussion
The osteogenesis ability is influenced by a
multitude of factors including genetic, metabolic, and physical
inputs to coordinate an appropriate adaptive response (11). In this study, we focused on the
ability of hMSCs toward osteoblastic lineage in order to add
information on the function of osteogenesis ability. On the whole,
we obtained the TFs in four different ways, and got the top 10
transcriptional factor combinations with the highest coverage
through the Venn diagram. We found that TFs FOS, SOX9, EP300 were
commonly expressed in 3 different days in the osteogenic lineages
and presented in the PPI network at relatively high degrees.
Moreover, TFs CREBBP, ESR1, EGR1 also presented high effects on the
1st and 3rd or 7th day. The above indicated these TFs might have
indispensable effects in the mechanisms of osteogenesis
process.
Previous findings have suggested that FOS is
cellular proto-oncogene product belonging to the immediate early
gene family of TFs (12).
Furthermore, clear evidence have indicated that the expression of
FOS increased during osteogenic differentiation of undifferentiated
hMSCs (5), and its mechanism had a
relationship with the upregulated transcription of a diverse range
of genes involved in cell proliferation, and differentiation
(13,14). SOX9, another pivotal TF in
osteogenesis, has been shown to have a positive role of delaying
osteogenic differentiation in rat adipose stem cells (15). Loebel et al (16) indicated that SOX9 downregulation was
required for direct osteogenesis of hMSCs. In their research, the
SOX9 protein signal was apparently reduced in DEX-stimulated cells
compared with hMSCs in the control medium. In our study, compared
with the normal group, the experimental group of SOX9 showed
significant differences on days 1, 3 and 7, which also confirmed
our prediction was accurate. In addition, EP300 ranked highly among
the predicted genes and has been reported to function as an
important regulator of cell differentiation. Hu et al
(17) reported the inhibition of
EP300 expression resulted in a downregulation of total Runx2 and
acetylated Runx2 protein levels in prOB cells as compared to the
control group. It is known that Runx2 plays an important role in
the synthesis of type I collagen in bone matrix (18). This phenomenon showed that inhibition
of osteoblast differentiation could be achieved by reducing EP300
expression, indicating that Ep300 expression played a positive
effect in osteogenic capacity.
In our final prognosis system, we obtained a
combination of the optimal combinatorial TFs, in other words, all
the important TFs associated with osteogenesis were covered in our
system. In our study, although some of the TFs did not appear in
the optimal combination, they were all shown to be involved on days
1, 3 and 7 and remained important in osteogenesis. For instance,
RUN family including RUNX1, RUNX2 and RUNX3, regulated a variety of
genes and played an important role in osteogenesis. Among them,
RUNX1 has an essential effect on definitive hematopoiesis (19,20);
RUNX2 plays an important role in osteoblast differentiation and
bone formation (21,22); RUNX3 has specific effects on certain
neurons (23,24), and all of them make a significant
contribution to osteoblast capacity.
Through four different ways, we compared the
osteoblast data to the control group on days 1, 3 and 7, to finally
find the combination of the optimal and important TFs. These
identified key TFs give a deeper understanding of the molecular
mechanism of osteogenic differentiation of hMSCs. TFs FOS, SOX9 and
EP300 might exert significant parts in the development
osteogenesis, which may provide a reference method for the
prediction, diagnosis and prognosis of clinical osteoporosis.
Acknowledgements
Not applicable.
Funding
No funding was received.
Availability of data and materials
The datasets used and/or analyzed during the current
study are available from the corresponding author on reasonable
request.
Authors' contributions
XK conceived the study and drafted the manuscript.
YS acquired the data. YS and ZZ analyzed the data and revised the
manuscript. All authors read and approved the final manuscript.
Ethics approval and consent to
participate
Not applicable.
Patient consent for publication
Not applicable.
Competing interests
The authors declare that they have no competing
interests.
References
|
1
|
Fontenot HB and Harris AL: Pharmacologic
management of osteoporosis. J Obstet Gynecol Neonatal Nurs.
43:236–245; quiz E20-E21. 2014. View Article : Google Scholar : PubMed/NCBI
|
|
2
|
Cosman F, de Beur SJ, LeBoff MS, Lewiecki
EM, Tanner B, Randall S and Lindsay R: Erratum to: Clinician's
guide to prevention and treatment of osteoporosis. Osteoporos Int.
26:2045–2047. 2015. View Article : Google Scholar : PubMed/NCBI
|
|
3
|
Caplan AI: Review: mesenchymal stem cells:
cell-based reconstructive therapy in orthopedics. Tissue Eng.
11:1198–1211. 2005. View Article : Google Scholar : PubMed/NCBI
|
|
4
|
Augello A and De Bari C: The regulation of
differentiation in mesenchymal stem cells. Hum Gene Ther.
21:1226–1238. 2010. View Article : Google Scholar : PubMed/NCBI
|
|
5
|
Kanis JA, Burlet N, Cooper C, Delmas PD,
Reginster JY, Borgstrom F and Rizzoli R: European Society for
Clinical Economic Aspects of Osteoporosis Osteoarthritis (ESCEO)
European guidance for the diagnosis and management of osteoporosis
in postmenopausal women. Osteoporos Int. 19:399–428. 2008.
View Article : Google Scholar : PubMed/NCBI
|
|
6
|
Watanabe K and Ikeda K: Osteocytes in
normal physiology and osteoporosis. Clin Rev Bone Miner Metab.
8:224–232. 2010. View Article : Google Scholar
|
|
7
|
Harada H, Tagashira S, Fujiwara M, Ogawa
S, Katsumata T, Yamaguchi A, Komori T and Nakatsuka M: Cbfa1
isoforms exert functional differences in osteoblast
differentiation. J Biol Chem. 274:6972–6978. 1999. View Article : Google Scholar : PubMed/NCBI
|
|
8
|
Hanai J, Chen LF, Kanno T, Ohtani-Fujita
N, Kim WY, Guo WH, Imamura T, Ishidou Y, Fukuchi M, Shi MJ, et al:
Interaction and functional cooperation of PEBP2/CBF with Smads.
Synergistic induction of the immunoglobulin germline Calpha
promoter. J Biol Chem. 274:31577–31582. 1999. View Article : Google Scholar : PubMed/NCBI
|
|
9
|
López-Giménez MR and García Gómez JJ: The
Fisher's test. Med Clin (Barc). 101:156–157. 1993.(In Spanish).
PubMed/NCBI
|
|
10
|
Stojanova D, Ceci M, Malerba D and
Dzeroski S: Using PPI network autocorrelation in hierarchical
multi-label classification trees for gene function prediction. BMC
Bioinformatics. 14:2852013. View Article : Google Scholar : PubMed/NCBI
|
|
11
|
Luu YK, Capilla E, Rosen CJ, Gilsanz V,
Pessin JE, Judex S and Rubin CT: Mechanical stimulation of
mesenchymal stem cell proliferation and differentiation promotes
osteogenesis while preventing dietary-induced obesity. J Bone Miner
Res. 24:50–61. 2009. View Article : Google Scholar : PubMed/NCBI
|
|
12
|
Sun D, Junger WG, Yuan C, Zhang W, Bao Y,
Qin D, Wang C, Tan L, Qi B, Zhu D, et al: Shockwaves induce
osteogenic differentiation of human mesenchymal stem cells through
ATP release and activation of P2X7 receptors. Stem Cells.
31:1170–1180. 2013. View Article : Google Scholar : PubMed/NCBI
|
|
13
|
Hess J, Angel P and Schorpp-Kistner M:
AP-1 subunits: Quarrel and harmony among siblings. J Cell Sci.
117:5965–5973. 2004. View Article : Google Scholar : PubMed/NCBI
|
|
14
|
Pham DN, Luo H and Wu J: Reduced Ran
expression in Ran(+/−) fibroblasts increases cytokine-stimulated
nuclear abundance of the AP-1 subunits c-Fos and c-Jun. FEBS Lett.
584:4623–4626. 2010. View Article : Google Scholar : PubMed/NCBI
|
|
15
|
Stöckl S, Göttl C, Grifka J and Grässel S:
Sox9 modulates proliferation and expression of osteogenic markers
of adipose-derived stem cells (ASC). Cell Physiol Biochem.
31:703–717. 2013. View Article : Google Scholar : PubMed/NCBI
|
|
16
|
Loebel C, Czekanska EM, Bruderer M,
Salzmann G, Alini M and Stoddart MJ: In vitro osteogenic potential
of human mesenchymal stem cells is predicted by Runx2/Sox9 ratio.
Tissue Eng Part A. 21:115–123. 2015. View Article : Google Scholar : PubMed/NCBI
|
|
17
|
Hu Z, Wang Y, Sun Z, Wang H, Zhou H, Zhang
L, Zhang S and Cao X: miRNA-132-3p inhibits osteoblast
differentiation by targeting Ep300 in simulated microgravity. Sci
Rep. 5:186552015. View Article : Google Scholar : PubMed/NCBI
|
|
18
|
Wei J, Shimazu J, Makinistoglu MP, Maurizi
A, Kajimura D, Zong H, Takarada T, Lezaki T, Pessin JE, Hinoi E, et
al: Glucose uptake and Runx2 synergize to orchestrate osteoblast
differentiation and bone formation. Cell. 161:1576–1591. 2015.
View Article : Google Scholar : PubMed/NCBI
|
|
19
|
Okuda T, van Deursen J, Hiebert SW,
Grosveld G and Downing JR: AML1, the target of multiple chromosomal
translocations in human leukemia, is essential for normal fetal
liver hematopoiesis. Cell. 84:321–330. 1996. View Article : Google Scholar : PubMed/NCBI
|
|
20
|
Soung do Y, Kalinowski J, Baniwal SK,
Jacome-Galarza CE, Frenkel B, Lorenzo J and Drissi H:
Runx1-mediated regulation of osteoclast differentiation and
function. Mol Endocrinol. 28:546–553. 2014. View Article : Google Scholar : PubMed/NCBI
|
|
21
|
Saito T, Ohba S, Yano F, Seto I, Yonehara
Y, Takato T and Ogasawara T: Runx1 and Runx3 are downstream
effectors of Nanog in promoting osteogenic differentiation of the
mouse mesenchymal cell line C3H10T1/2. Cell Reprogram. 17:227–234.
2015. View Article : Google Scholar : PubMed/NCBI
|
|
22
|
Pan H, Li X, Wang J, Zhang K, Yang H, Li
Z, Zheng Z and Liu H: LIM mineralization protein-1 enhances bone
morphogenetic protein-2-mediated osteogenesis through activation of
ERK1/2 MAPK pathway upregulation of Runx2 transactivity. J Bone
Miner Res. 30:1523–1535. 2015. View Article : Google Scholar : PubMed/NCBI
|
|
23
|
Bauer O, Sharir A, Kimura A, Hantisteanu
S, Takeda S and Groner Y: Loss of osteoblast Runx3 produces severe
congenital osteopenia. Mol Cell Biol. 35:1097–1109. 2015.
View Article : Google Scholar : PubMed/NCBI
|
|
24
|
Wigner NA, Soung Y, Einhorn TA, Drissi H
and Gerstenfeld LC: Functional role of Runx3 in the regulation of
aggrecan expression during cartilage development. J Cell Physiol.
228:2232–2242. 2013. View Article : Google Scholar : PubMed/NCBI
|