Introduction
Hepatic fibrosis is a common pathological process of
various chronic liver diseases and is considered a necessary
pathological stage for the transformation of liver cirrhosis
(1). Cholestasis and bile canaliculi
hyperplasia are common pathological changes in various types of
chronic liver diseases, and chronic inflammation and fibrin
deposition are important factors that promote the development of
chronic liver disease (1). It was
previously suggested that the pathogenesis of cholestatic liver
fibrosis was associated with elevated circulating endotoxin levels,
liver energy metabolism disorder, liver injury induced by oxygen
free radical, liver hemodynamic disorder, ischemia of liver cells,
calcium homeostasis disorder and liver cell necrosis and apoptosis
induced by liver inflammation (1).
However, the exact mechanism involved remains to be fully
elucidated (1). In recent years, a
number of scholars have investigated the vigorous proliferation of
bile duct epithelial cells in the pathogenesis of cholestatic liver
fibrosis (2,3). Previous understanding of the role of
hyperplastic small bile ducts in the pathogenesis of cholestatic
liver fibrosis includes the following: i) They express cytokines,
including interleukin (IL)-1, IL-6, IL-8 and interferon (IFN)-8 and
IFN-αl cells in polymorphonuclear cells, T cells and circulating
lymphocytes to the portal area, which induces inflammation of
portal area; ii) they release platelet-derived growth factor
(PDGF), transforming growth factor β, vascular endothelial growth
factor, insulin-like growth factor and nerve growth factor to
activate hepatic stellate cells, thereby inducing extracellular
matrix deposition (4,5). However, at present, it has been
reported that bile duct epithelial cells can differentiate into
α-smooth muscle actin (α-SMA)-positive fibroblasts under certain
conditions (6). Therefore, in the
present study, a secondary cholestatic hepatic fibrosis rat model
was prepared by ligation of the common bile duct. Bile duct
epithelial cell proliferation, the expression of bile duct marker
cytokeratin 7 (CK 7) and fibroblast marker α-SMA-positive cells
were dynamically observed to investigate the role of bile duct
epithelial cell proliferation and its transdifferentiation into
myofibroblasts in the pathogenesis of secondary cholestatic hepatic
fibrosis.
Materials and methods
Animals
Male Sprague Dawley (SD) rats (n=60; weight, 180–220
g; aged 6–8 weeks old) were purchased from the Experimental Animal
Center of the Chinese Academy of Sciences (Shanghai, China; license
no. SCXK, 2005–0006). Animal maintenance, modeling and observation
were performed at the Experimental Animal Center of Shanghai
University of Traditional Chinese Medicine (Shanghai, China). The
rats had ad libitum access to food and water, were exposed
to a 12-h light dark cycle and maintained in a
temperature-controlled room (20–25°C; humidity: 40–70%). The animal
protocol of the present study was approved by the Ethics Committee
of Zhoushan Hospital (Zhoushan, China).
Reagents and instruments
Hydroxyproline (Hyp), which is used to construct
standard curves, was purchased from Nacalai Testque Corp. (Tokyo,
Japan). The protein quantitative reagent kit (Protein Quantitation
Kit, cat. no. 500-0001) was purchased from Bio-Rad Laboratories,
Inc. (Hercules, CA, USA). The monoclonal anti-CK7 antibody (cat.
no. sc25721) and monoclonal anti-desmin antibody (cat. no. ab 8470)
were purchased from Abcam (Cambridge, MA, USA). Monoclonal
anti-α-SMA antibody (cat. no. cbl171), anti-GADPH antibody (cat.
no. KC-5G4; isotype immunoglobulin (Ig)G2α) was from Sigma-Aldrich
(Merck KGaA, Darmstadt, Germany). Monoclonal anti-GADPH antibody
(cat. no. KC-5G4) was purchased from Kangcheng Biotechnology
(Guangzhou, China). Horseradish peroxidase (HRP)-labeled goat anti
mouse antibody (cat. no. P6782) was purchased from Jingmei Biotech
Corp. The western blot analysis marker was purchased from New
England Biolabs, Inc. (Ipswich, MA, USA). The enhanced
chemiluminescence (ECL) kit was from Pierce (Thermo Fischer
Scientific, Inc., Waltham, MA, USA). Cy3 (cat. no. 7576) or
fluorescein isothiocyanate (FITC) fluorescent-labeled secondary
antibodies (cat. no. 76233) were purchased from Jackson
Immunoresearch Laboratories, Inc. (West Grove, PA, USA). Alexa
Fluor® 633 goat anti-mouse IgG2a fluorescent secondary
antibody was from Molecular Probes Inc. (7627; Thermo Fischer
Scientific, Inc.). The TCS SP2 laser scanning confocal microscope
was from Leica Microsystems (Wetzlar, Germany).
Grouping and model preparation
Rats (n=60) were labeled and randomly divided into
two groups: Sham-operated control group (n=10, sham group) and bile
duct ligation (BDL) group (n=50). After intraperitoneal injection
of pentobarbital sodium (Shanghai Haling Biotechnology Co.,
Ltd., Shanghai, China) (50 mg/kg), the abdominal skin of the
rats was routinely disinfected, incised along the ventral midline
and the choledochus was exposed. In the sham group, the choledochus
was only segregated and the abdomen was closed. In the BDL group,
the operation was performed according to a previously reported
method (7). In brief, after double
ligation at the distal and proximal end, the choledochus was
sheared off in the middle and the abdomen was closed.
Sample collection and processing
Five rats in the sham group were randomly selected
and sacrificed for sampling at the end of post-operative week one.
Five rats in the BDL group were randomly selected and sacrificed
for sampling at the end of post-operative weeks 1, 2, 3 and 4. All
of the remaining rats were sacrificed for sampling at the end of
post-operative week 5. Under anesthesia performed as mentioned
above, the abdominal cavities of all rats were opened, the gross
morphology of the liver was observed, the liver was removed for the
preparation of liver specimens. The abdominal aorta was then cut
and death was confirmed by observation of complete dilation of
pupils and absence of heart beat.
Observation of animals
The observation of animals included the color of
skin and mucous membrane, death and gross morphology of the liver
of rats on biopsy.
Hyp content determination in liver
tissues
The method of Jamall et al (8) was used to determine Hyp in liver
tissues.
Histological observation of
livers
Liver tissues were fixed in 10% neutral formalin,
paraffin-embedded and cut into sections. Following dewaxing and
rehydration, the sections were routinely stained with hematoxylin
and eosin (H&E), and with Sirius red. The pathological changes
of the liver tissues were observed under a light microscope. Sirius
red staining results were analyzed using IPP software (version 6.0;
Shanghai Liangruan Biotechnology Co., Ltd., Shanghai,
China): Five visual fields (magnification, ×200) were observed in
each tissue slice, and using the software, the stained areas in the
images were selected as areas of interest. The mean optical density
(integrated optical density), divided by the total area of the same
visual field, was determined.
CK7, α-SMA and desmin protein
expression in liver tissues
Western blot analysis was used for detection of CK7,
α-SMA and desmin levels. Total protein was extracted and denatured
at 95–100°C for 5 min. Hepatic tissue (100 g) was placed into 1 ml
radioimmunoprecipitation assay lysis buffer (0.88 g NaCl, 1 ml
NP-40, 1 ml 10% SDS, 1 ml of 1 M Tris (pH 7.2), 1 ml of 0.5 M EDTA,
1 ml of 0.1 M PMSF and deionized water was added to make up to 100
ml). Homogenate was placed in the ice bath 3 times at 13,333 × g
for 10 sec each at 4°C. The homogenate of hepatic tissue was
transferred to a PMSF centrifuge tube, and was centrifuge for 15
min at 4°C and 19,200 × g. The supernatant was collected, and
Protein Quantification Kit-Rapid (Nanjing Jiancheng Co. Ltd.,
Nanjing, China) was used to determine the total protein
concentration. Subsequently, protein (50 µg/lane) was separated by
10% SDS-PAGE and transferred onto a nitrocellulose membrane.
Following blocking for 1 h at room temperature with Tris buffered
saline (TBS) solution [2.42 g of Tris; 29.2 g of sodium chloride,
900 ml of Distilled water; TWEEN-20 and TBS (TTBS): 500 ml of TBS,
0.5 ml of TWEEN-20; 10 ml of sealing solution TTBS, 0.5 k of dried
skimmed milk; 3.03 g of glycine; 14.4 g of SDS; 1 g of SDS or 10 ml
of 10% SDS; added with distilled water until 1 l], antibody working
fluid was added (CK7, α-SMA and desmin antibodies were all diluted
at a ratio of 1:1,500), followed by incubation at 4°C overnight.
After washing, the film was incubated with HRP-conjugated secondary
antibody (1:1,000) at room temperature for one hour. Following
washing, the blots were developed with ECL reagent, exposed to
X-ray film (Kangchen Company, Shanghai, China; cat. no. KC-5G4) and
the blots were stripped and re-probed with GAPDH antibody
(dilution, 1:5,000), which was added as the internal reference. The
target bands in the negative film were analyzed using the Furi
FR-980 biological electrophoresis imaging analysis system (Shanghai
Furi Science & Technology, Ltd., Shanghai, China) and the
integral value of each band was read and recorded by the computer
automatically. The ratio of the sample's integral value vs. the
internal reference integral value was statistically analyzed.
Immunofluorescence analysis of
CK7/α-SMA and α-SMA/desmin co-localization in liver tissues
Frozen sections of liver tissues (4 µm) were fixed
with 4% paraformaldehyde after thawing at room temperature for 30
min. The sections were washed with PBS three times for five min
each. The sections were incubated with 3%
H2O2 for 3 min to eliminate endogenous
peroxidase, blocked with 5% calf serum (Boster Biological
Technology Co., Ltd., Wuhan, China) for 30 min and then incubated
with the first antibody at 37°C for 120 min. Subsequent to washing
with PBS three times for five min each, samples were incubated with
the first fluorescent secondary antibody at 37°C for 60 min and
then washed with PBS as above. The sections were then incubated
with the second primary antibody at 37°C for 120 min, washed with
PBS as above, incubated with the second fluorescent secondary
antibody at 37°C for 60 min and washed again with PBS as above. The
sections were sealed with 50% glycerin and then observed under a
laser confocal microscope where images were captured. In the
experiment, the dilution of the first antibodies to CK7, α-SMA and
desmin was 1:100, and the dilution of the fluorescent secondary
antibodies conjugated with fluorescein isothiocyanate and Cy3, and
Alexa Fluor® 633 goat anti-mouse IgG2a was 1:200. The
positive staining areas of CK7, α-SMA, CK7/α-SMA and α-SMA/desmin
were analyzed by IPP software as described above.
Statistical analysis
SPSS 13.0 software (SPSS, Inc., Chicago, IL, USA)
was used for all statistical analyses. Measurement data were
expressed as the mean ± standard deviation. One-way analysis of
variance was used followed by the least-significant difference test
and data at each time point were compared with data at the previous
time point and in the normal group. Linear regression equations
were determined to perform a correlation analysis on the
association between two variables. P<0.05 was considered to
indicate a statistically significant difference.
Results
General condition of animals
Each animal was fed in a single cage. Nos. 1-10 were
divided into the sham operation group and no animal succumbed to
fatality; Nos. 11-60 were divided into the model group, no animals
succumbed to fatality in week 1. However, 1 rat (No. 17) succumbed
to fatality in week 2, 3 rats (Nos. 22, 27 and 51) succumbed to
fatality in week 3, 4 rats succumbed to fatality (Nos. 11, 17, 31
and 53) in week 4 and 7 rats (Nos. 12, 15, 18, 19, 25, 43 and 59)
succumbed to fatality in week 5. Any animals that presented with
extreme pain, refused to drink water and eat for more than 24 h
were injected with 150 mg/kg of sodium pentobarbital to minimize
animal suffering. None of the rats died in the sham group, while 15
rats died in the BDL group (death rate, 30%). There was neither a
significant difference in the skin and mucous membrane color, nor
in the morphology and texture of the livers of the rats in the sham
group at week one and five. In rats in the BDL group, the abdominal
bulge gradually increased after model establishment, and the yellow
staining of the mucous membrane and the icteric sclera were
gradually deepened, which reached a peak at week two after BDL. The
liver surface became rough and the texture became hard.
Hyp content variations in liver
tissues
Compared with the sham group, the Hyp content
gradually increased in liver tissues of rats in the BDL group
(Sham<model group at 1 week (M1w)<M2w<M3w<M4w<M5w;
P<0.01; Table I).
 | Table I.Hyp content in liver tissue of rats
and semi-quantitative results of sirius red staining as well as
immunohistochemical staining for CK7, α-SMA, CK7/α-SMA and
α-SMA/desmin. |
Table I.
Hyp content in liver tissue of rats
and semi-quantitative results of sirius red staining as well as
immunohistochemical staining for CK7, α-SMA, CK7/α-SMA and
α-SMA/desmin.
| Group | Hyp (µg/g) | Sirius red staining
(IOD) | CK7 (IOD) | α-SMA (IOD) | Demsin (IOD) | CK7 + α-SMA
co-localization (IOD) | α-SMA + desmin
co-localization (IOD) |
|---|
| Sham | 200.7±53.36 | 0.0066±0.0004 | 0.0018±0.0006 | 0.0213±0.0027 | 0.0000±0.000 | 0.0012±0.0007 | 0.0000±0.0000 |
| M1w |
292.9±93.70a |
0.0265±0.0017a |
0.012±0.004a |
0.0621±0.0043a |
0.0014±0.0005a |
0.0103±0.005a |
0.0012±0.0005a |
| M2w |
427.0±14.50a,b |
0.0528±0.0055a,b |
0.0247±0.0029a,b |
0.1145±0.0045a,b |
0.0017±0.0007a |
0.0213±0.0061a,b |
0.0015±0.0007a |
| M3w |
804.7±35.50a,b |
0.1807±0.0091a,b |
0.0796±0.0111a,b |
0.1383±0.01232a,b |
0.0018±0.0005a |
0.0613±0.0097a,b |
0.0017±0.0006a |
| M4w |
953.6±35.10a,b |
0.2618±0.007a,b |
0.1204±0.01a,b |
0.1953±0.01543a,b |
0.0118±0.0012a,b |
0.1103±0.012a,b |
0.0114±0.0011a,b |
| M5w |
1,069.0±69.30a,b |
0.3295±0.01a,b |
0.1611±0.0104a,b |
0.2713±0.1613a,b |
0.0245±0.0023a,b |
0.1543±0.017a,b |
0.0216±0.0018a,b |
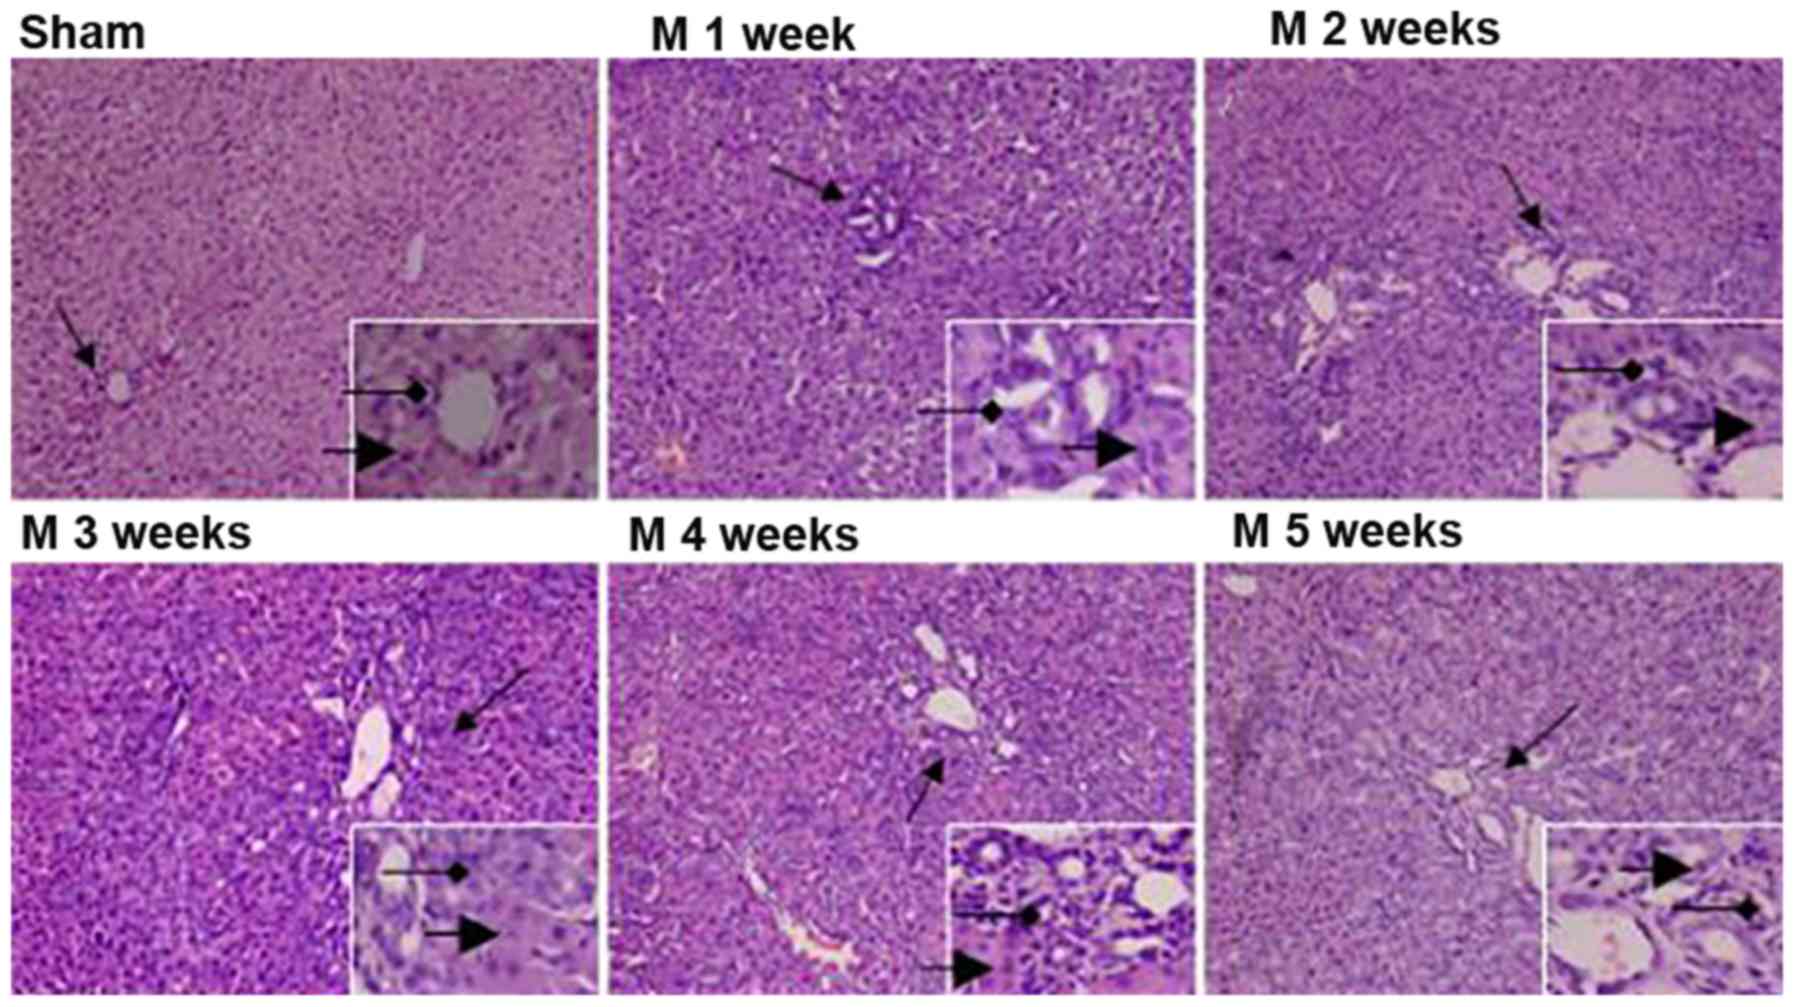
Liver histopathology
H&E staining of liver tissues revealed the
following: In the sham group, the structure of hepatic lobules was
intact, the hepatic cords were arranged in neat rows and no
inflammatory cell infiltration was detected at weeks one and five.
In rats in the BDL group, with time progressing, hepatic
parenchymal cells were significantly reduced, which gradually
formed island-shaped structures of different sizes; furthermore,
the degree of BEC hyperplasia gradually increased, a large number
of small bile ducts with irregular arrangement were observed and a
small amount of inflammatory cell infiltration was identified
around the area (Fig. 1).
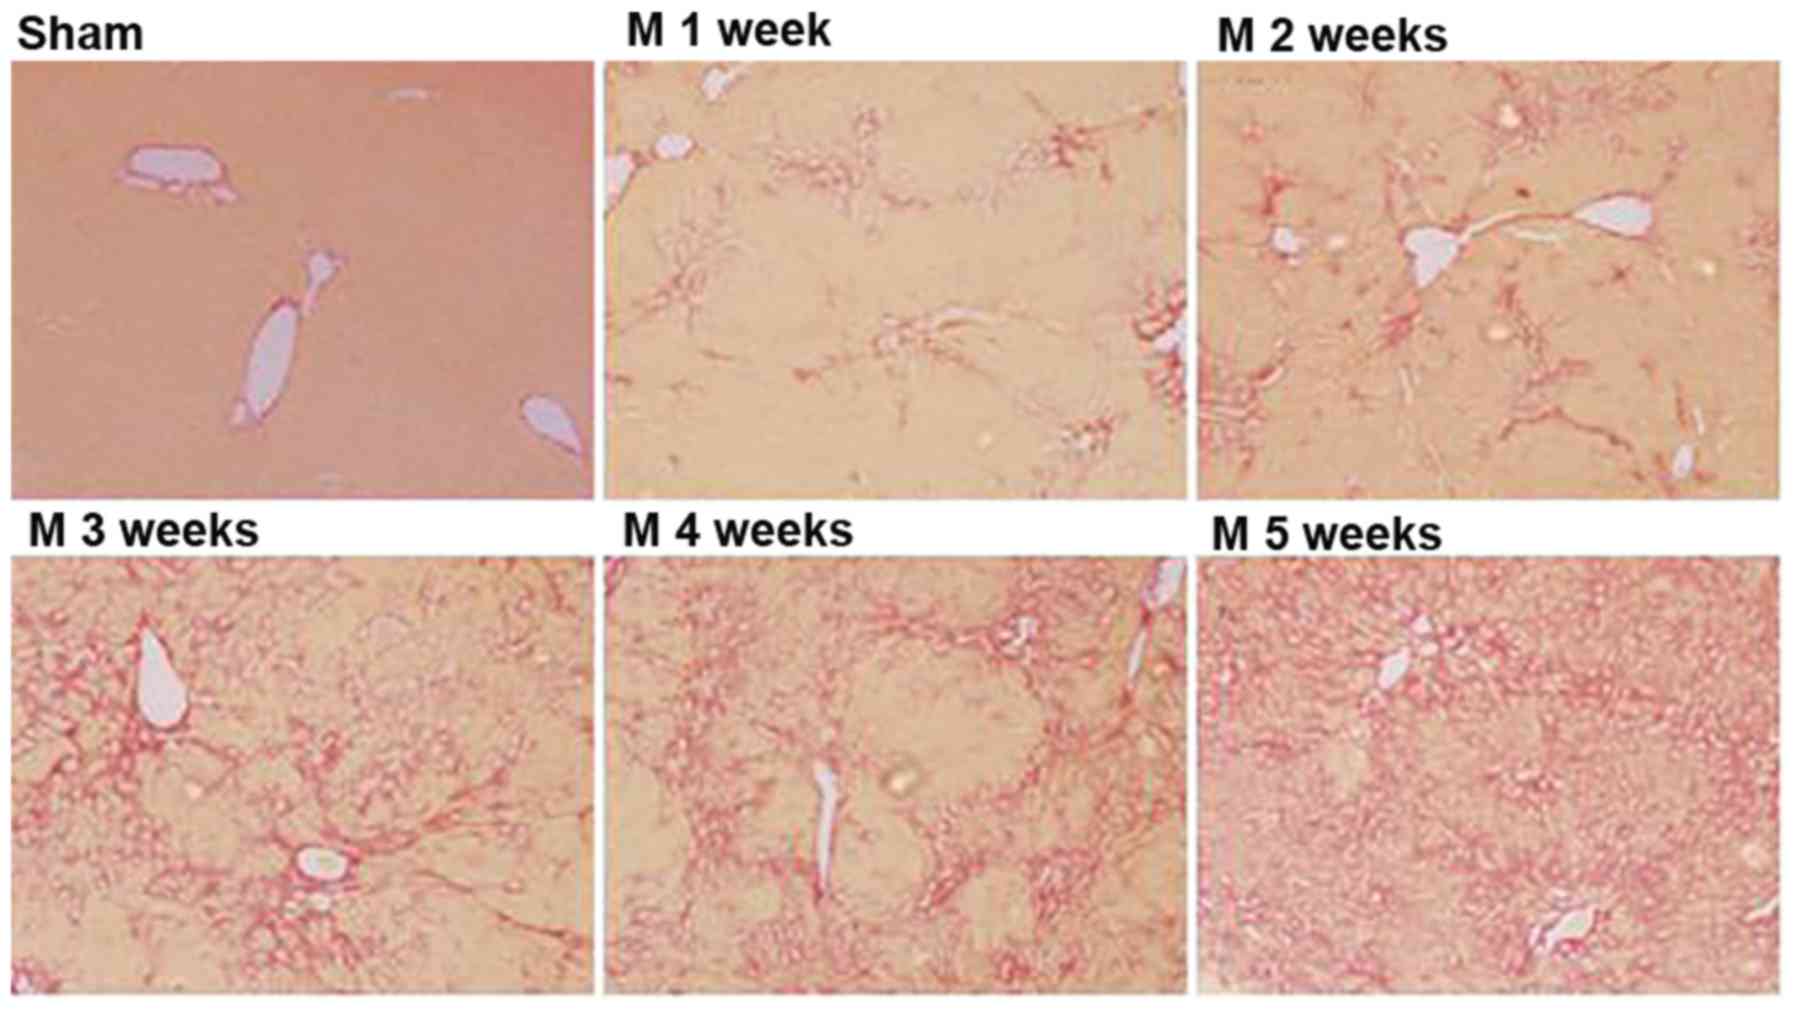
Sirius red staining revealed the following: No
fibrous hyperplasia of the liver tissues was observed in the sham
group at weeks one and five. In rats in the BDL group, fibrous
hyperplasia of the liver tissues gradually increased after BDL
(Sham<M1w<M2w<M3w<M4w<M5w; Table I and Fig.
2).
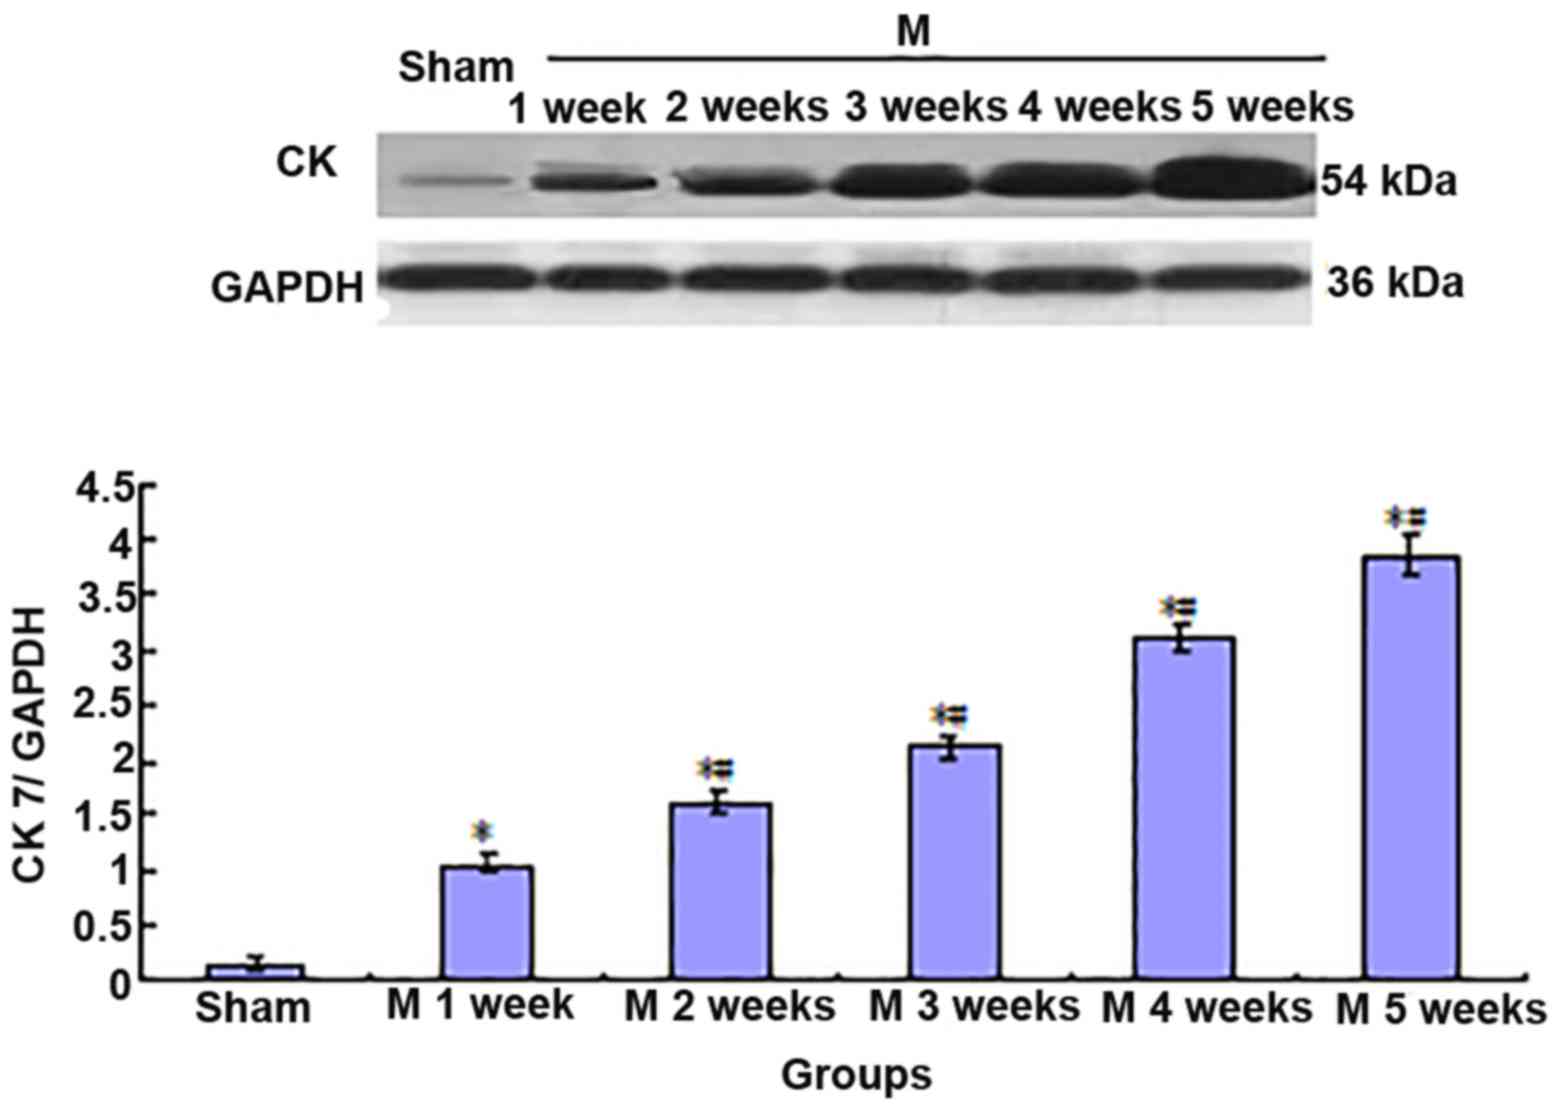
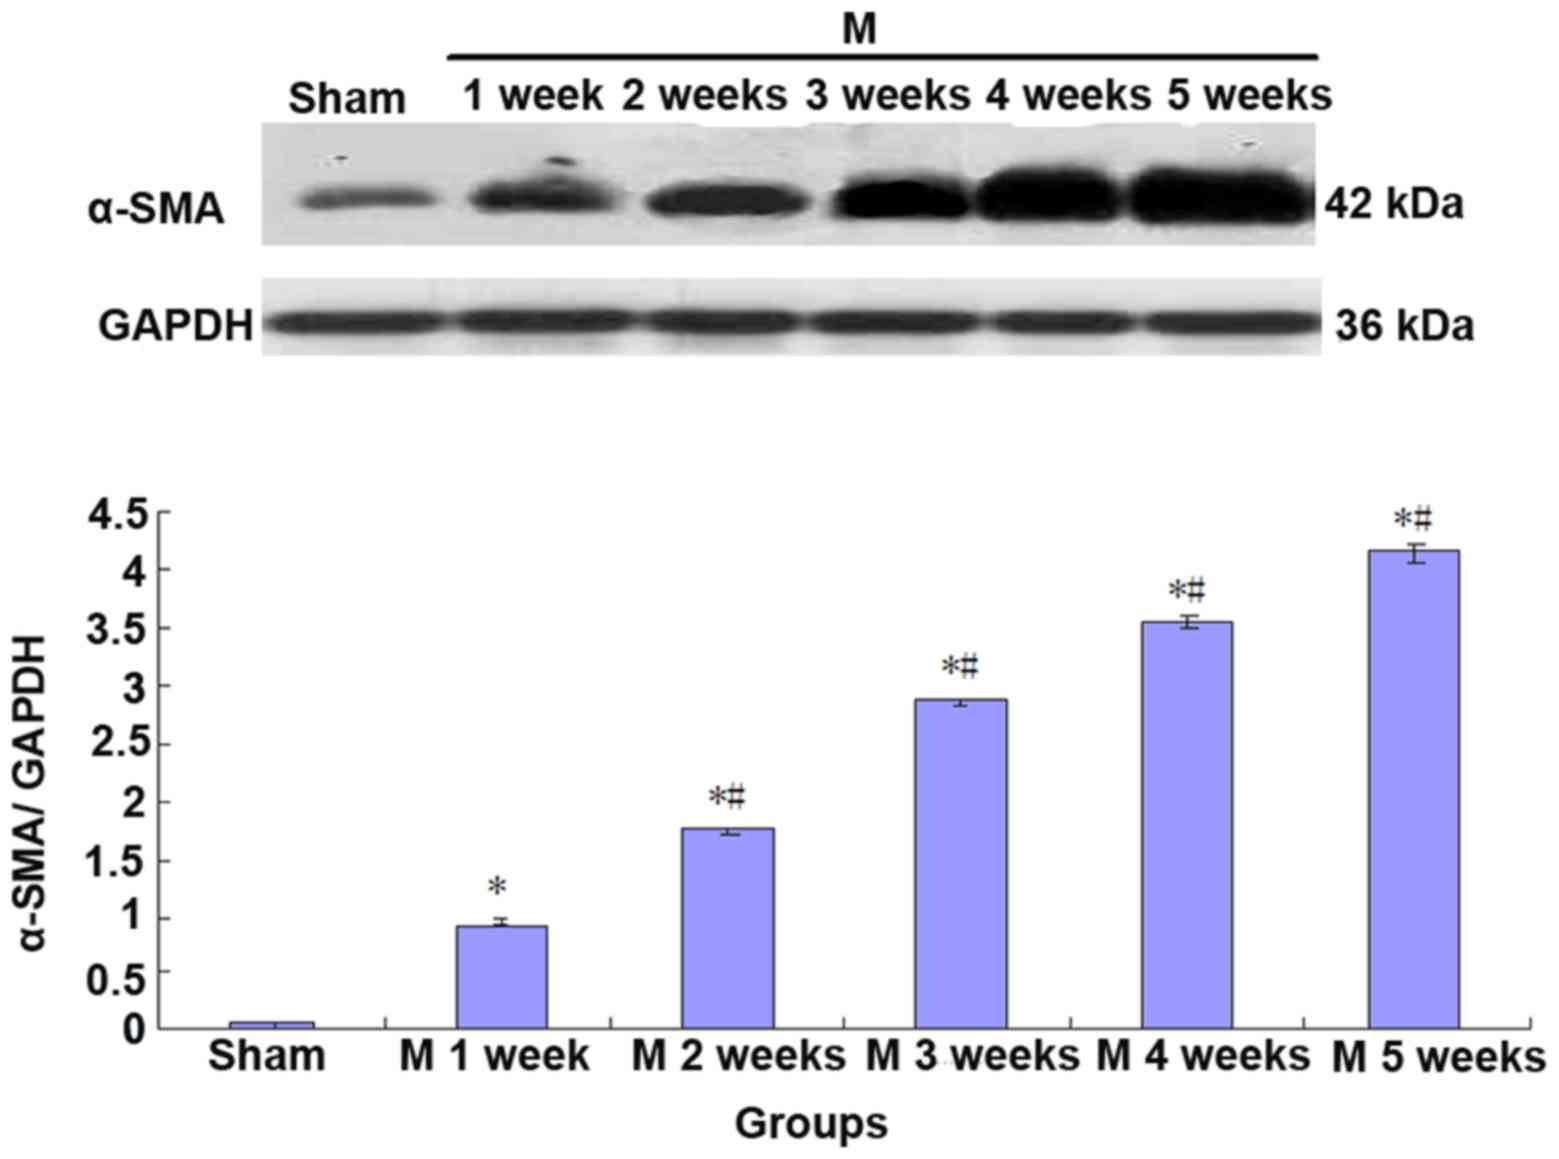
Expression of CK7 and α-SMA is
increased in liver tissues of BDL rats
Compared with the sham group, the expression of CK7
and α-SMA gradually increased in rat liver tissues in the BDL group
(Sham<M1w<M2w<M3w<M4w<M5w; Figs. 3 and 4).
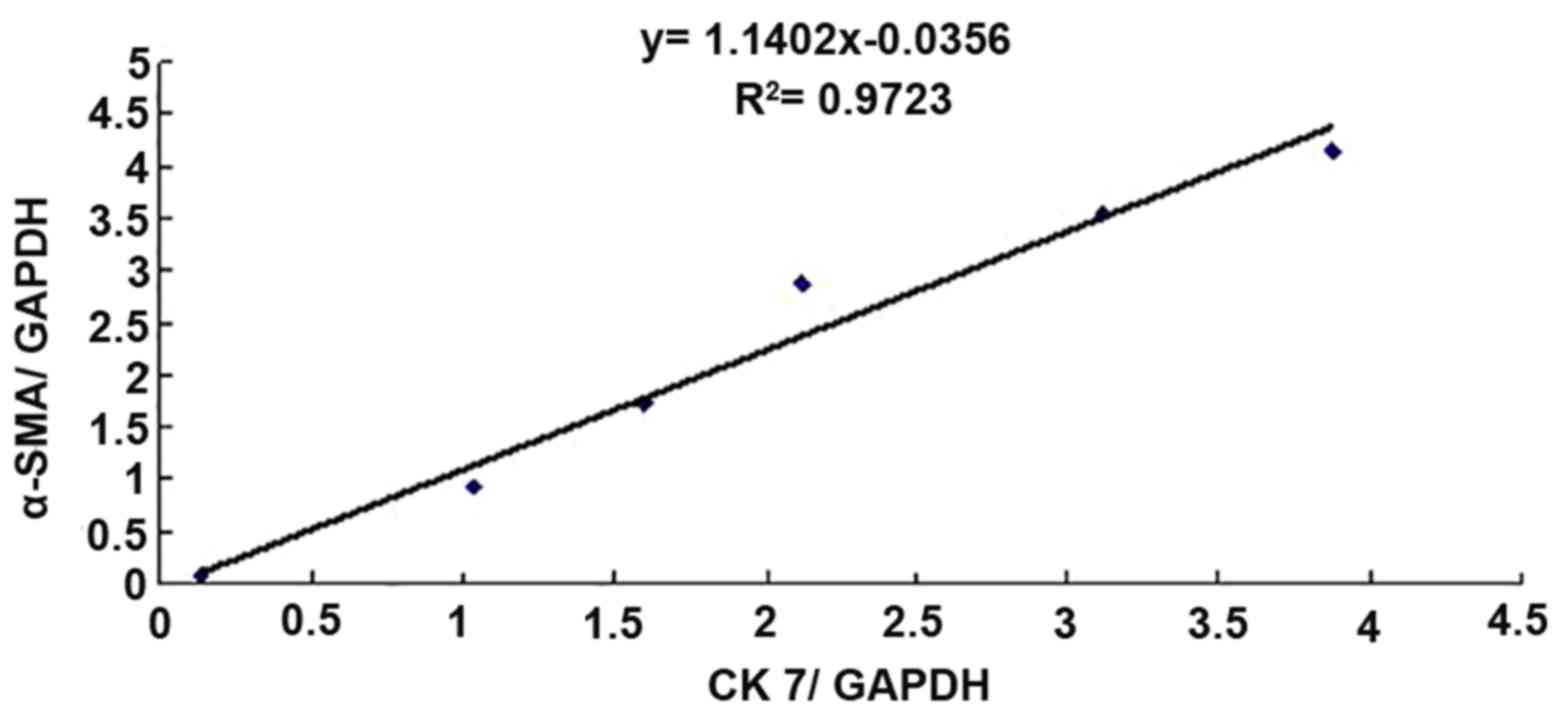
Furthermore, to perform a correlation analysis of
CK7 and α-SMA protein expression in rat liver tissues, the mean
values of CK7/GAPDH and α-SMA/GAPDH in the sham group (n=5) and BDL
group (n=5) at each time-point were statistically analyzed, and the
correlativity of CK7/GAPDH and α-SMA/GAPD in each group was
analyzed by generating a linear regression equation. It was
revealed that the expression of the two proteins was significantly
and linearly correlated (r=0.9860, P<0.01; Fig. 5).
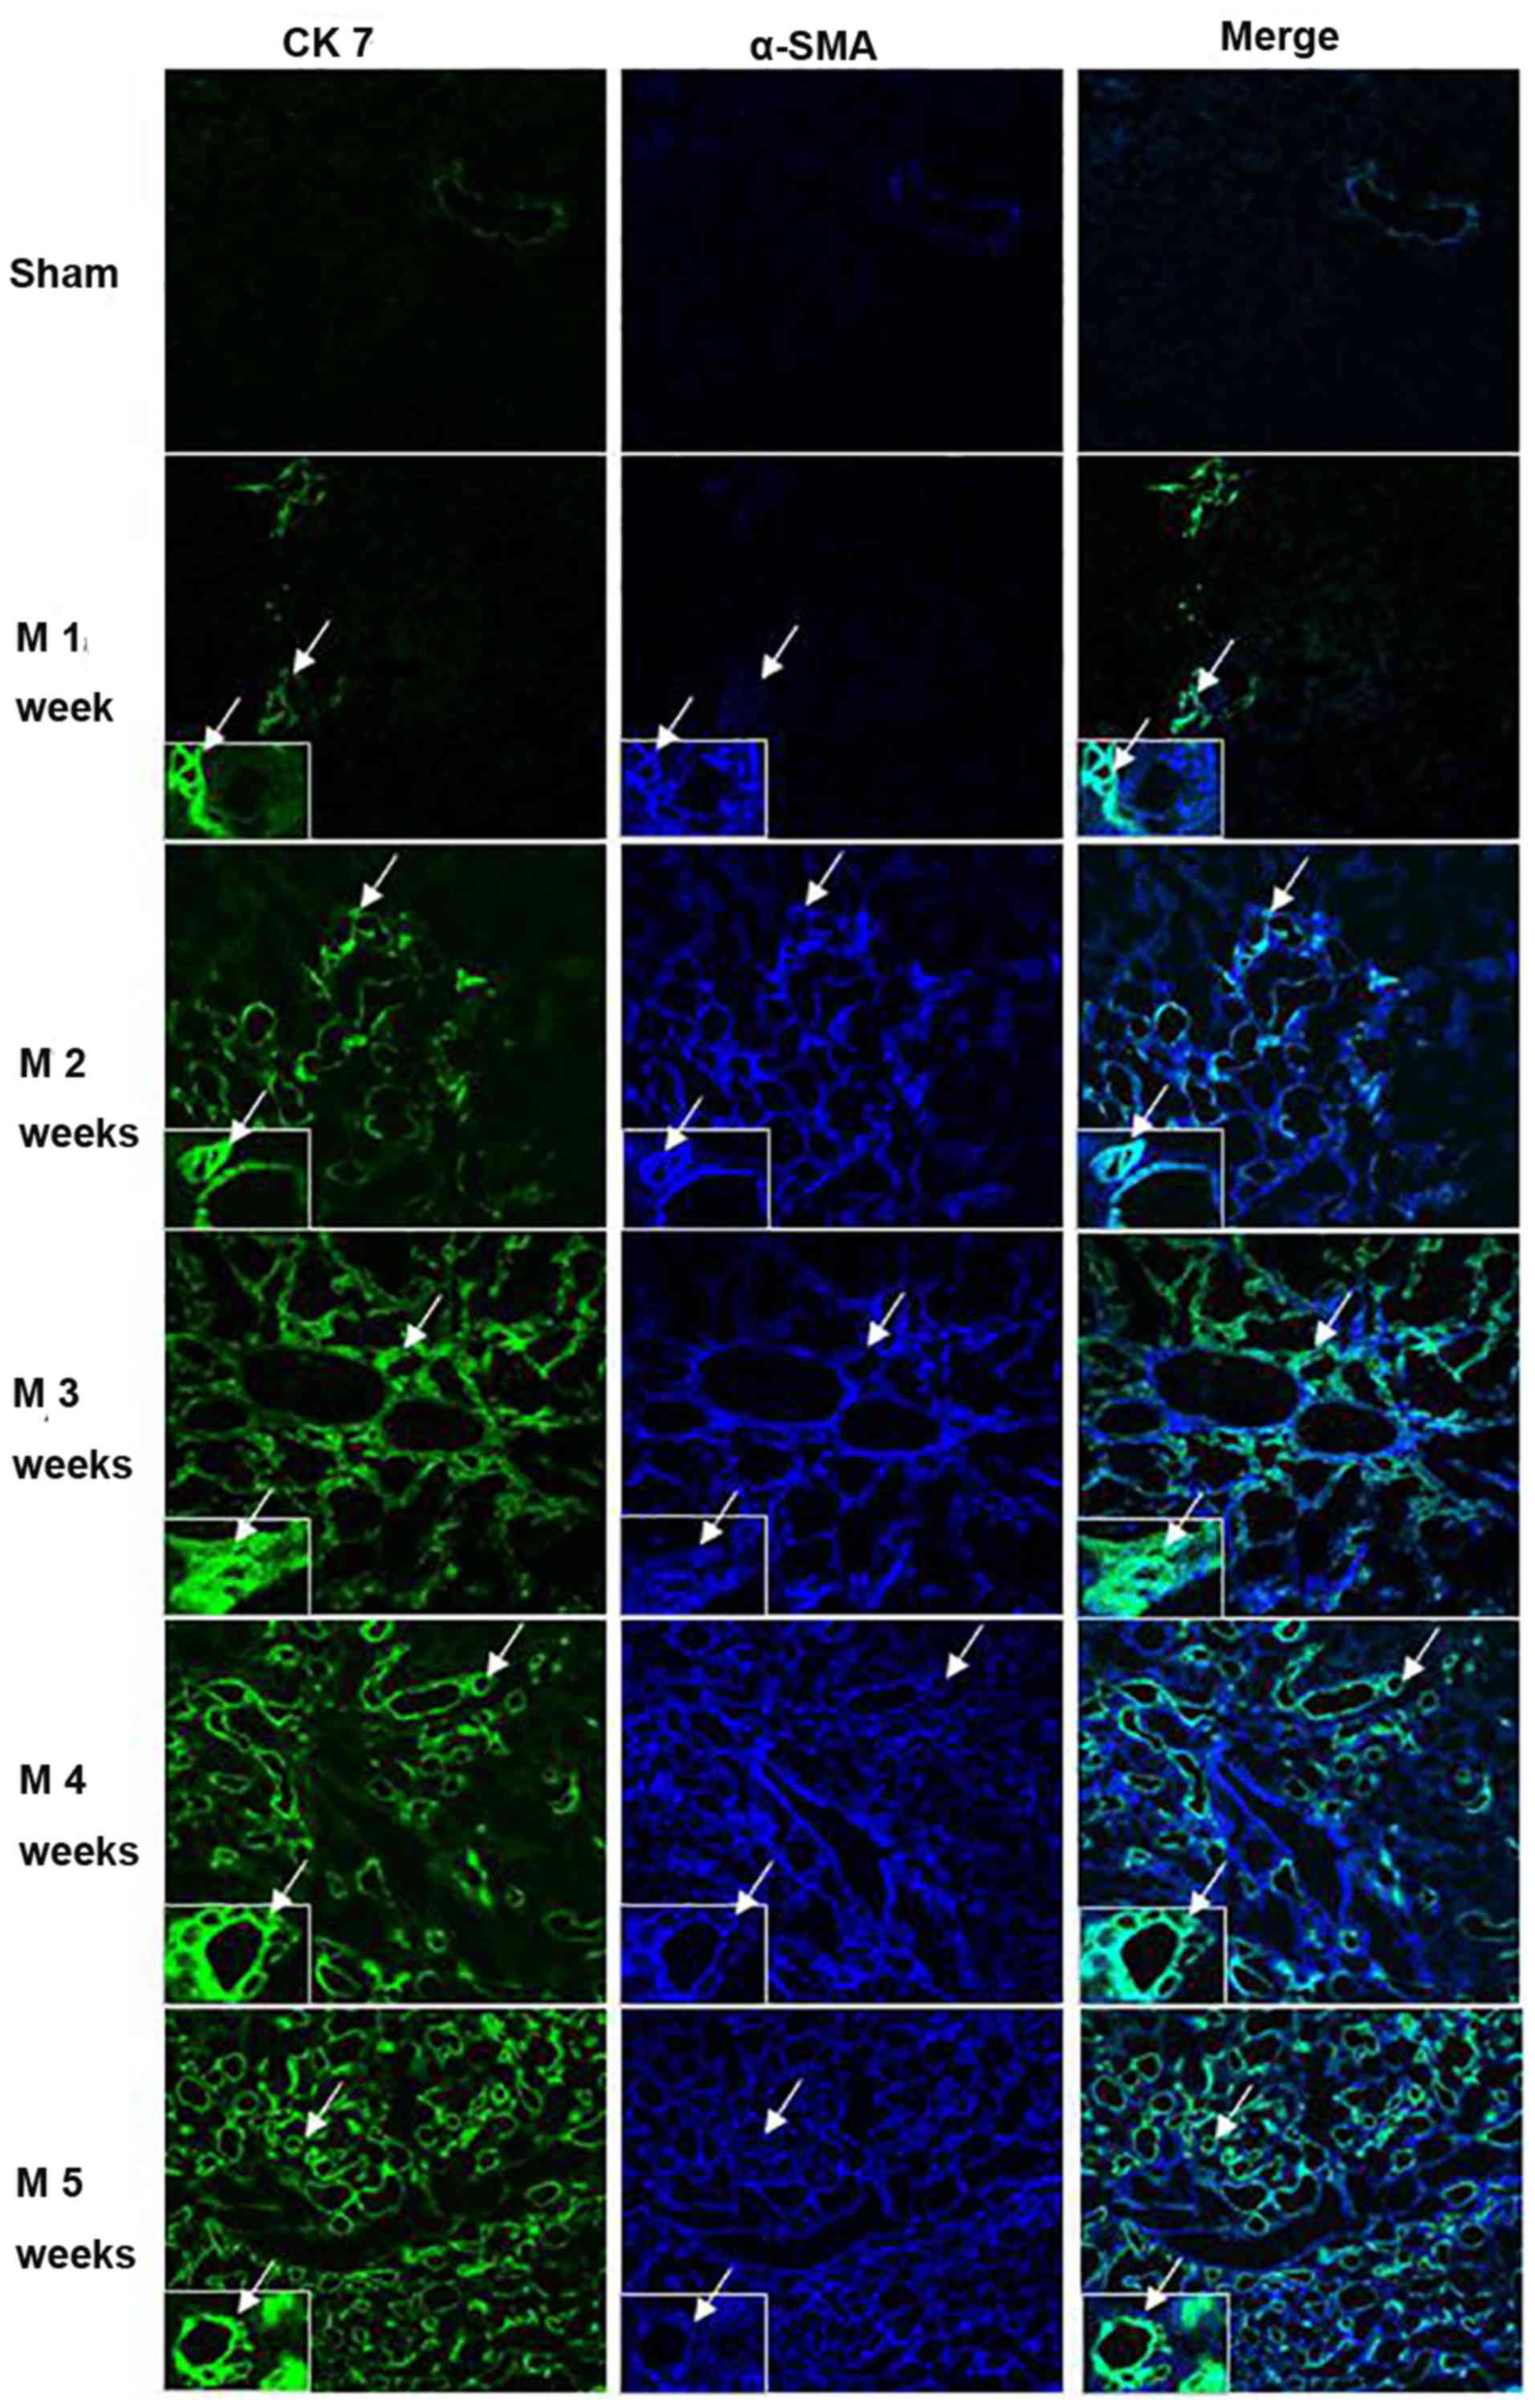
Co-localization of CK7 and α-SMA in
liver tissues of BDL rats is correlated with collagen
deposition
The co-localization of CK7 and α-SMA in rat liver
tissues was assessed by immunofluorescence staining and observation
under a laser scanning confocal microscope (Fig. 6, Table
I). Only a minor amount of staining for CK7 (green) and for
α-SMA (blue) was observed in the sham group. In rats subjected to
BDL, a gradual increase in cells stained for CK7 and α-SMA was
observed with increasing time. CK7/α-SMA co-staining (cyan) also
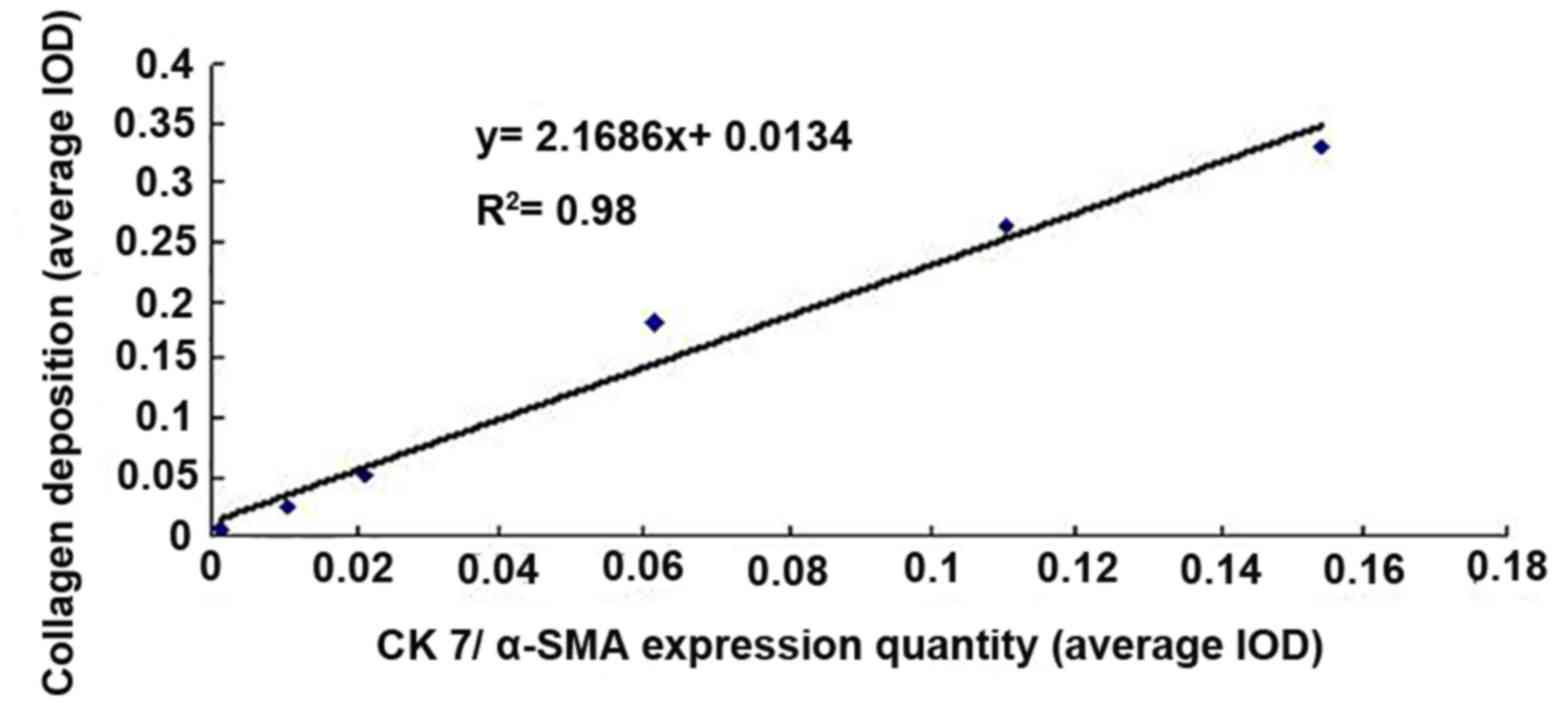
gradually increased. The correlation between the quantity of
co-localization of CK7 and α-SMA protein expression based on the
co-stained area and the quantity of collagen deposition in rat
liver tissues was analyzed using linear regression. The results
indicated a significant and linear correlation (r=0.9899,
P<0.01; Fig. 7).
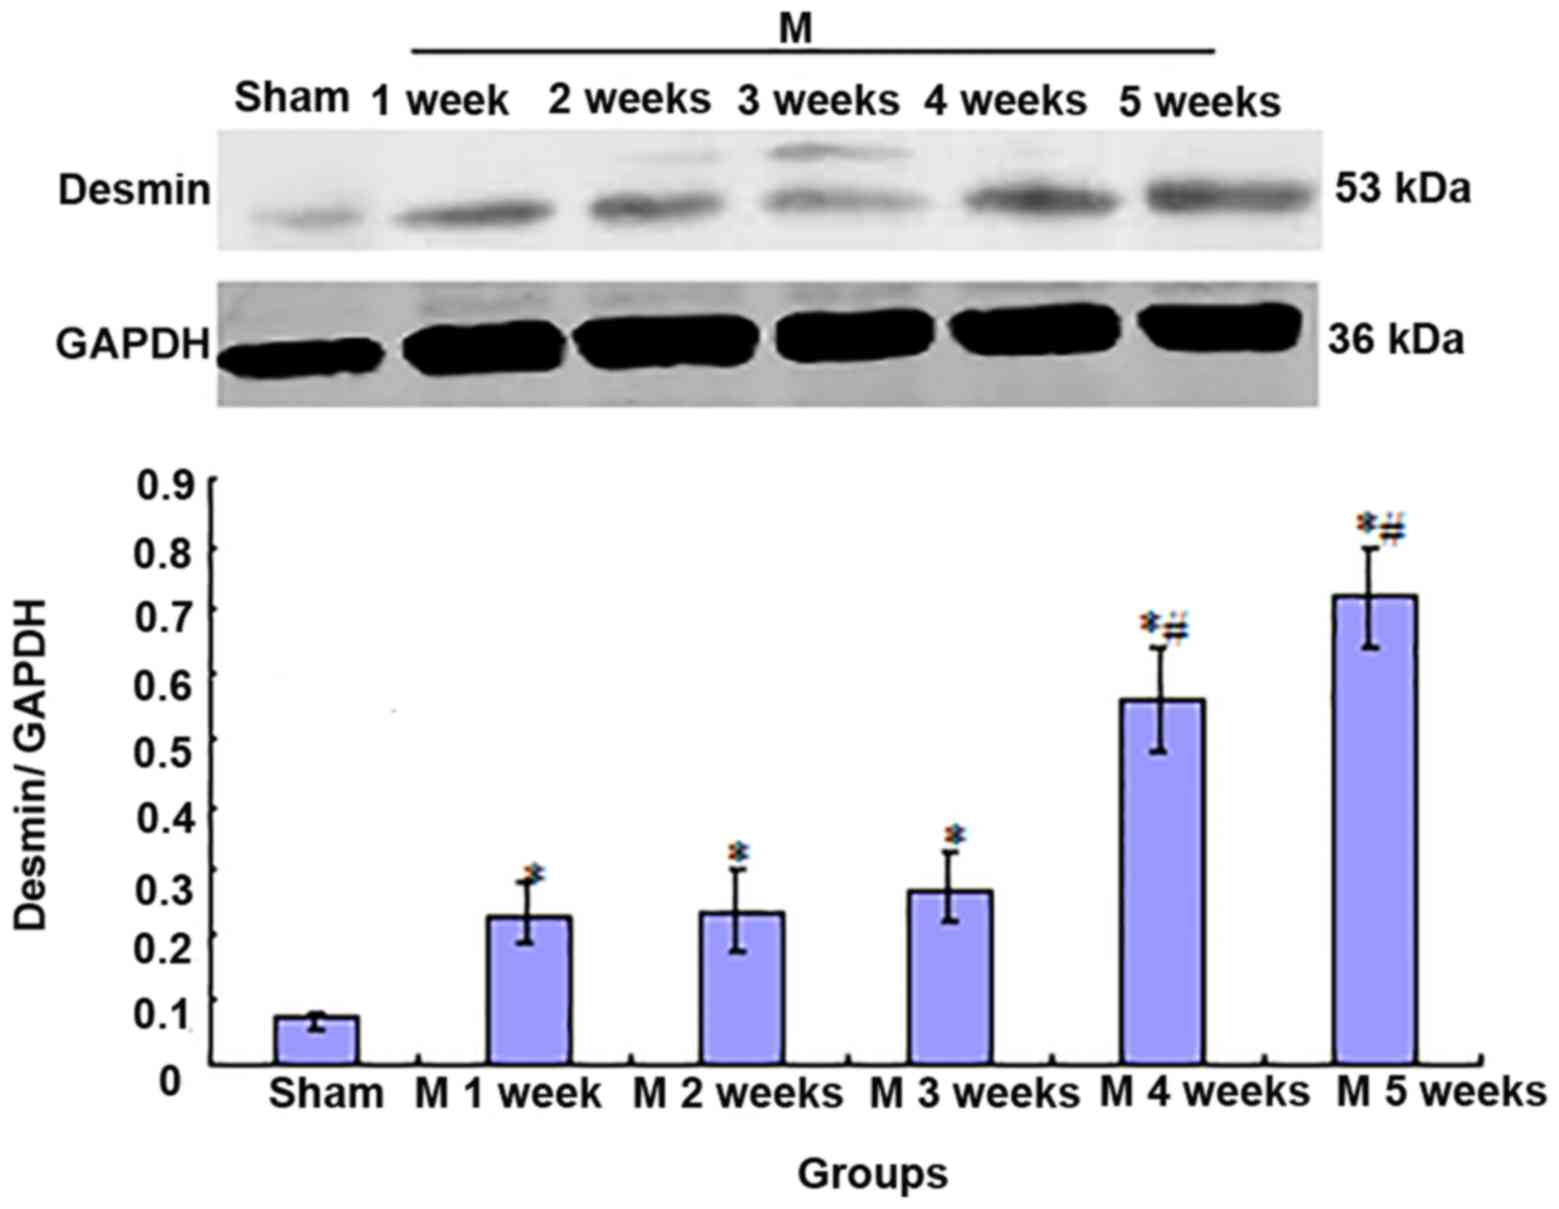
Expression of desmin protein in liver
tissues
Compared with that in rats in the sham group, desmin
expression was significantly increased in the livers of rats in the
BDL group after 1 week (P<0.01). This expression was stable
after 2 and 3 weeks (there were no significant differences among
the values at M2w, M3w and M1w). However, the expression
significantly increased after that (M3w<M4w<M5w; P<0.01;
Fig. 8).
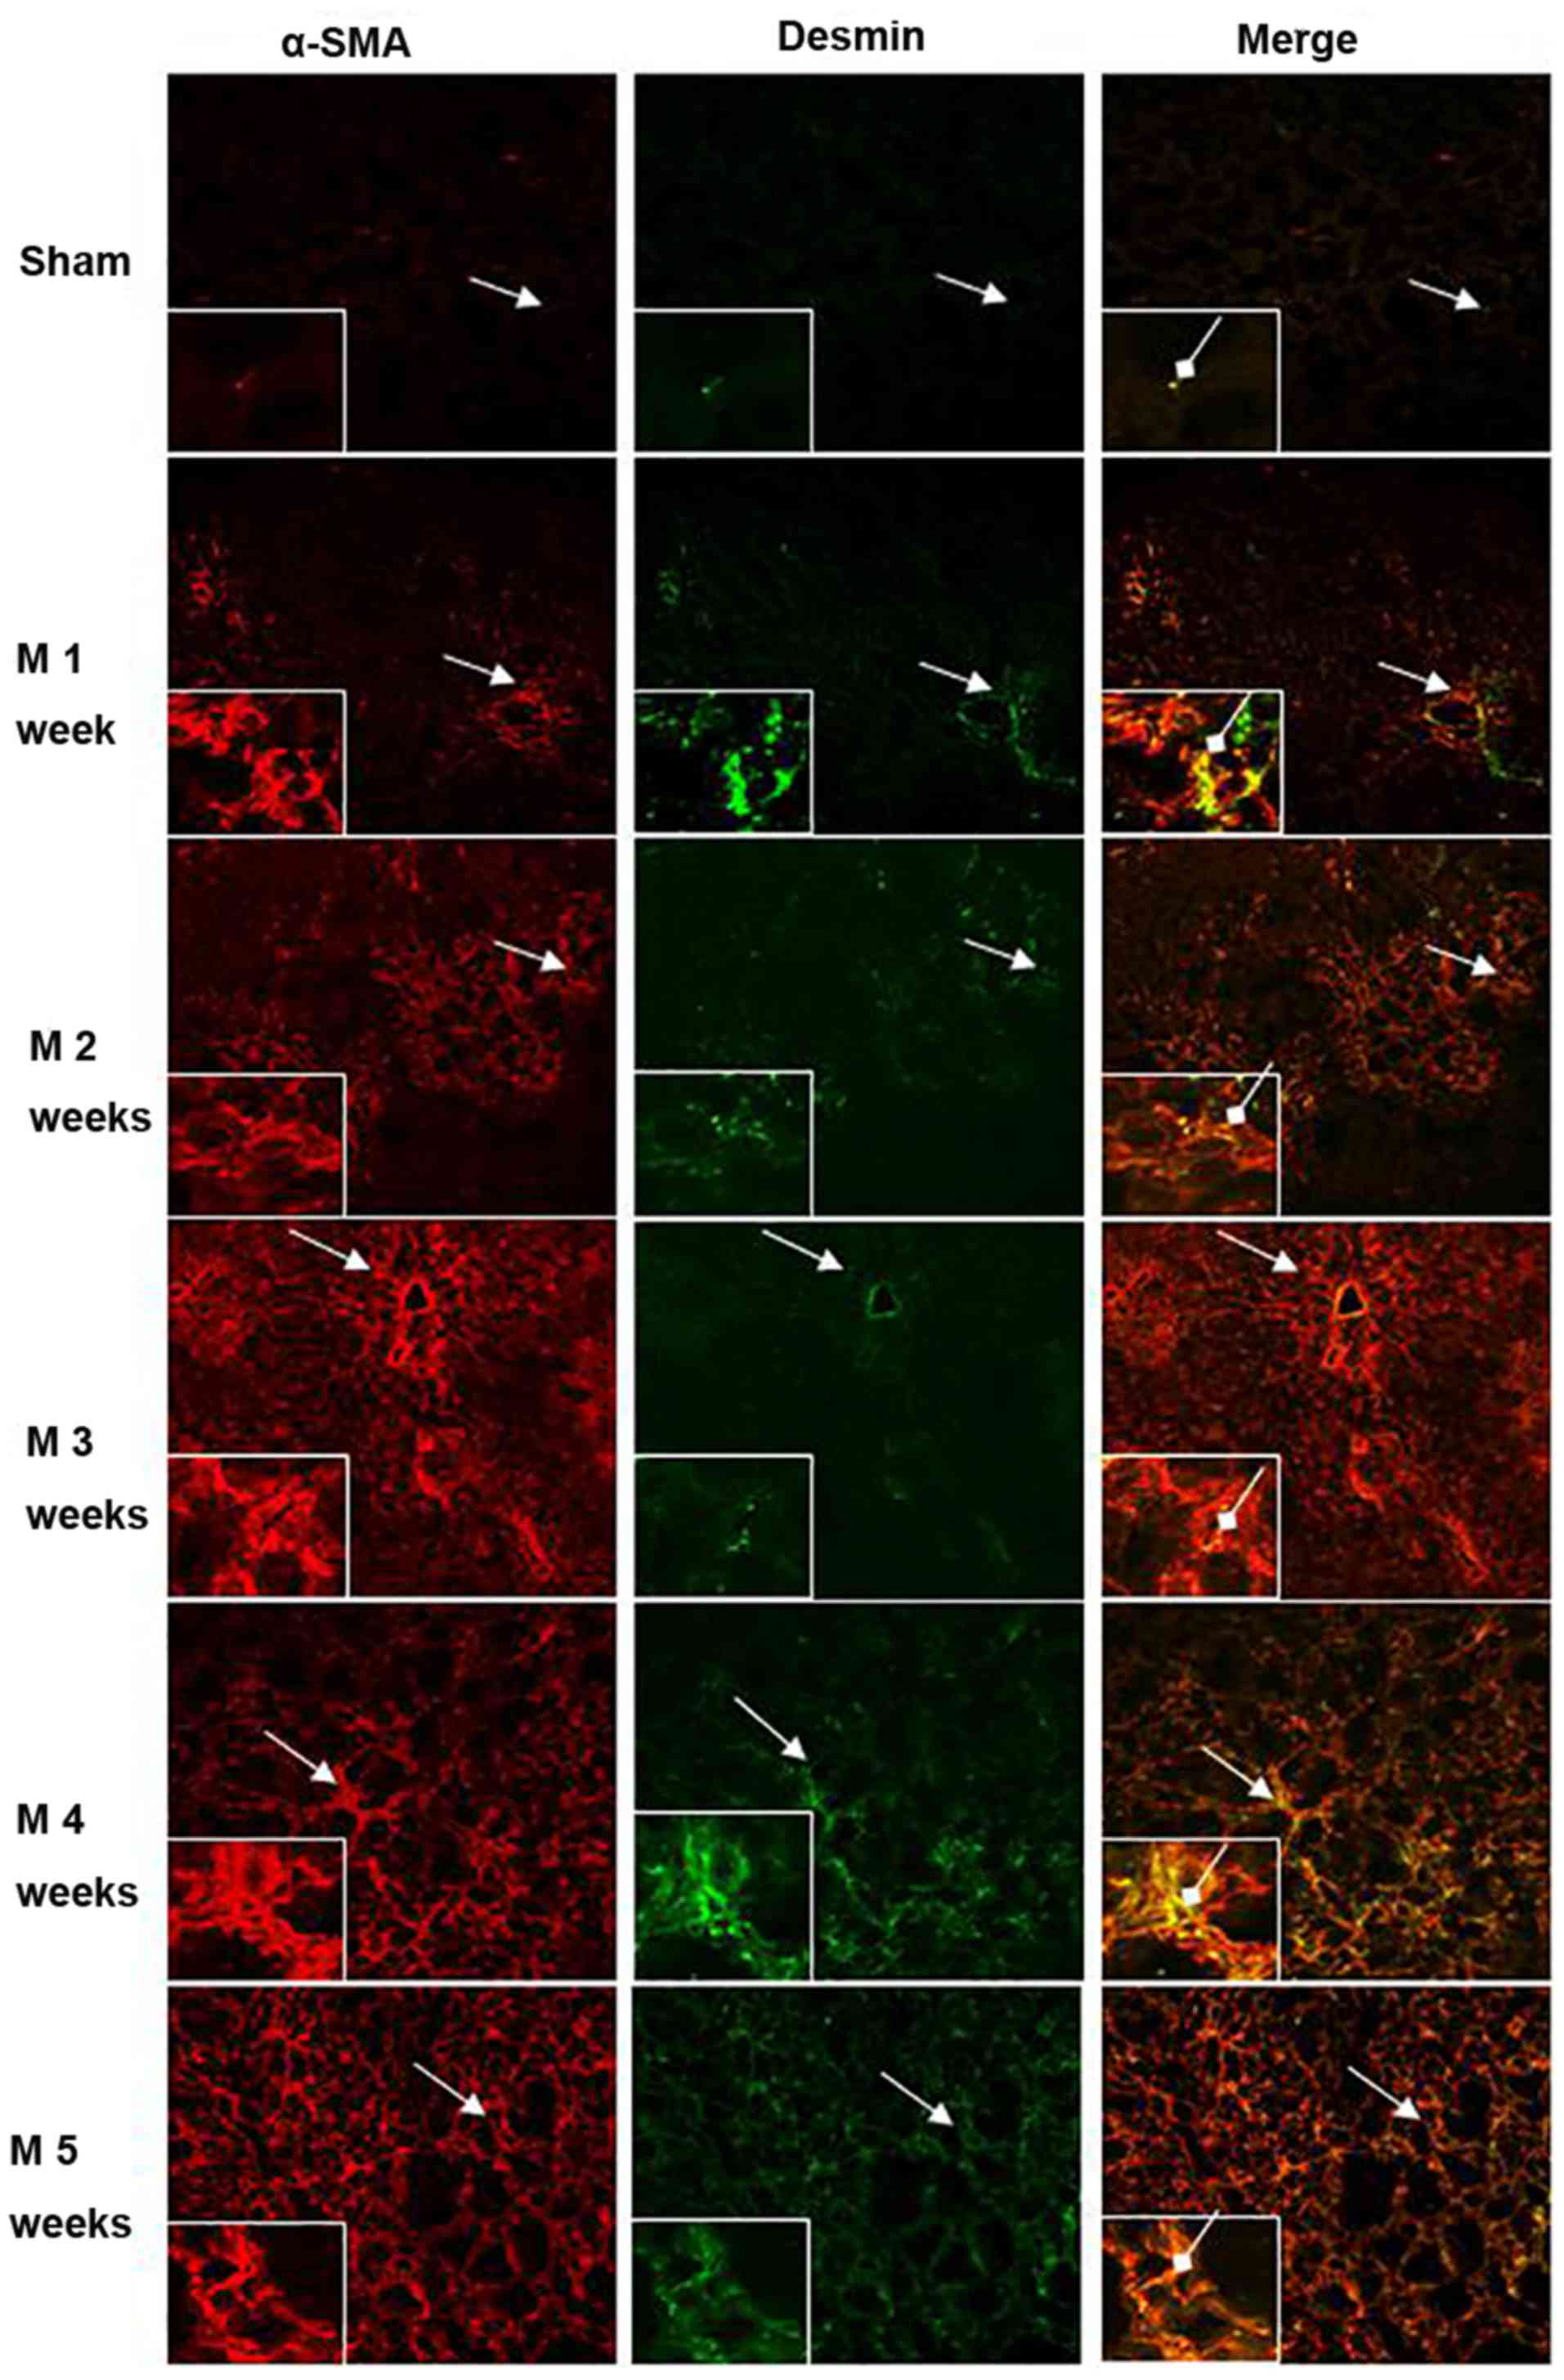
Co-localization of α-SMA and desmin in
liver tissues
The immunofluorescence co-localization of
α-SMA/desmin in rat liver tissues was observed under a laser
scanning confocal microscope (Fig.
9, Table I). Only minor amounts
of α-SMA (red) and desmin (green) expression as well as cellular
co-localization of α-SMA/desmin (yellow) were identified in the
sham group. Compared with the sham group, α-SMA- and
desmin-expressing cells as well as α-SMA/desmin co-localization
were significantly increased after BDL at 1 week (P<0.01). At
weeks 2 and 3, the expression of α-SMA expression continuously
increased, but desmin-expressing cells and α-SMA/desmin
co-localization were not significantly enhanced (no significant
differences among M2w, M3w and M1w). At 4 and 5 weeks,
α-SMA-expressing cells continued to increase, and also the amount
of desmin-expressing cells and cells with α-SMA/desmin
co-localization gradually increased (M3w<M4w<M5w; P<0.01).
However, no desmin protein expression was identified in the
majority of α-SMA-expressing cells.
Discussion
BDL is a model that has been widely used in the
study of the pathological mechanism of cholestatic hepatic fibrosis
(7). The results of the present
study revealed that after BDL, 30% of the rats died in the model
group within 5 weeks. The fatality of rats at weeks 2 and 3 was
primarily due to shedding of ligation. Furthermore, the fatality of
rats in weeks 4 and 5 were predominantly due to ascites and
abdominal infection. The overall mortality rate was consistent with
that reported by Ezure et al (7). Furthermore, the Hyp content in liver
tissues gradually increased and reached five times that in the sham
group at the end of the fifth week. Diffused BEC hyperplasia was
identified in the H&E-stained liver tissues. In addition, a
certain amount of collagen fiber deposition was observed in the
surroundings of the hyperplastic biliary epithelium, normal liver
cells were markedly reduced, inflammation and necrosis were mild,
and typical lesions of cholestatic hepatic fibrosis were
formed.
Studies on patients and experimental animals have
indicated that in the pathological state of cholestasis,
significant hyperplasia of mesenchymal cells and the extracellular
matrix were present, and a large amount of BEC hyperplasia was also
identified (2). This hyperplasia of
BECs may occur during the entire process of inflammatory damage of
the liver and its repair. When the factors that induce hyperplasia
of BECs were removed, BECs and the activated hepatic satellite
cells became apoptotic, tissue metalloproteinase activity
increased, and fibrosis and ductular hyperplasia faded away
(3). Due to its close association
with liver fibrosis formation, BEC hyperplasia is considered to be
the pacemaker of portal tract fibrosis (2), as well as the key pathological link to
cholestatic hepatic fibrosis formation.
Although the important role of BEC hyperplasia in
the pathogenesis of cholestatic hepatic fibrosis is widely
recognized, the exact mechanism has remained elusive (2). A large number of studies have
demonstrated that during the generation of organ fibrosis, the
epithelial cell phenotype may be transformed into a myofibroblast
phenotype, a process known as epithelial to mesenchymal transition
(EMT) (9,10). In addition, the phenotypic
transformation of this cell type has been considered to be the key
pathological link in the pathogenesis of fibrosis of the kidney,
lung, liver and other organs (11–13). In
BDL rats, the expression of vimentin, the characteristic phenotype
marker of mesenchymal cells, and the expression of protein α-SMA,
the characteristic phenotype marker of myofibroblasts, were
identified in a large number of hyperplastic BECs (6,14).
Furthermore, the expression of fibroblast-specific protein-1 was
detected in BECs of liver tissues of patients with primary
cholestatic cirrhosis (15,16). The mechanisms associated with the
pathology and progression of numerous chronic liver diseases,
including biliary atresia, were also identified to be associated
with the EMT phenomenon of BECs (17,18). In
addition, transforming growth factor-β1 was reported to stimulate
the differentiation of BECs into mesenchymal cells in vitro
(19).
In the present study, co-localization of BEC marker
CK7 (20) and myofibroblast marker
α-SMA (21) by immunofluorescence
detection revealed that after BDL, CK7- and α-SMA-expressing cells,
as well as cellular co-localization of the two proteins CK7 and
α-SMA were gradually increased. In addition, the expression of
these two proteins in liver tissue of the model at different
time-points was significantly correlated, suggesting that the
development of liver fibrosis in BDL rats was associated with the
transdifferentiation of hyperplastic BECs into myofibroblasts.
Desmin is specifically expressed in activated
hepatic satellite cells (22). In
the present study, western blot analysis and immunofluorescence
microscopy of CK7 and α-SMA revealed that in BDL in rats, only a
small amount of desmin protein expression was present and
desmin/α-SMA co-localization in cells was infrequent after 1–3
weeks. However, after 4 and 5 weeks, the expression of desmin
protein and cellular desmin/α-SMA co-localization gradually
increased, while most of the α-SMA-expressing cells did not express
desmin. This suggested that at 1–3 weeks following BDL, and among
the large number of α-SM-expressing fibroblasts, only a small
amount was derived from activated satellite cells. At 4 and 5
weeks, the proliferation and activation of satellite cells was
increased compared with that at 1–3 weeks. However, most of the
α-SMA-expressing myofibroblasts may still have been mainly derived
from the transdifferentiation of hyperplastic BECs.
In conclusion, the results of the present study
indicated that transdifferentiation of hyperplastic BECs into
myofibroblasts may be one of the key factors in the formation of
cholestatic hepatic fibrosis.
Acknowledgements
Not applicable.
Funding
No funding was received.
Availability of data and materials
The datasets used and/or analysed during the present
study available from the corresponding author on reasonable
request.
Authors' contributions
BFQ provided substantial contributions to the
conception and design of the work, GQZ, FMX, QX and TX contributed
to the acquisition, analysis, and interpretation of data. BFQ
drafted the manuscript and GQZ, FMX, QX and TX revised the
manuscript critically for important intellectual content. BFQ, GQZ,
FMX, QX and TX provided final approval of the version to be
published.
Ethics approval and consent to
participate
The animal protocol of the present study was
approved by the Ethics Committee of Zhoushan Hospital (Zhoushan,
China).
Patient consent for publication
Not applicable.
Competing interest
The authors declare that they have no competing
interests.
References
|
1
|
Westbrook RH, Dusheiko G and Williamson C:
Pregnancy and liver disease. J Hepatol. 64:933–945. 2016.
View Article : Google Scholar : PubMed/NCBI
|
|
2
|
Wells RG: The portal fibroblast: Not just
a poor man's stellate cell. Gastroenterology. 147:41–47. 2014.
View Article : Google Scholar : PubMed/NCBI
|
|
3
|
Glaser S, Han Y, Francis H and Alpini G:
Melatonin regulation of biliary functions. Hepatobiliary Surg Nutr.
3:35–43. 2014.PubMed/NCBI
|
|
4
|
Lazaridis KN and LaRusso NF: The
cholangiopathies. Mayo Clin Proc. 90:791–800. 2015. View Article : Google Scholar : PubMed/NCBI
|
|
5
|
Beuers U, Trauner M, Jansen P and Poupon
R: New paradigms in the treatment of hepatic cholestasis: From UDCA
to FXR, PXR and beyond. J Hepatol. 62 (1 Suppl):S25–S37. 2015.
View Article : Google Scholar : PubMed/NCBI
|
|
6
|
Xia JL, Dai C, Michalopoulos GK and Liu Y:
Hepatocyte growth factor attenuates liver fibrosis induced by bile
duct ligation. Am J Pathol. 168:1500–1512. 2006. View Article : Google Scholar : PubMed/NCBI
|
|
7
|
Ezure T, Sakamoto T, Tsuji H, Lunz JG III,
Murase N, Fung JJ and Demetris AJ: The development and compensation
of biliary cirrhosis in interleukin-6-deficient mice. Am J Pathol.
156:1627–1639. 2000. View Article : Google Scholar : PubMed/NCBI
|
|
8
|
Jamall IS, Finelli VN and Que Hee SS: A
simple method to determine nanogram levels of 4-hydroxyproline in
biological tissues. Anal Biochem. 112:70–75. 1981. View Article : Google Scholar : PubMed/NCBI
|
|
9
|
Nieto MA, Huang RY, Jackson RA and Thiery
JP: EMT: 2016. Cell. 166:21–45. 2016. View Article : Google Scholar : PubMed/NCBI
|
|
10
|
Anders HJ and Schaefer L: Beyond tissue
injury-damage-associated molecular patterns, toll-like receptors,
and inflammasomes also drive regeneration and fibrosis. J Am Soc
Nephrol. 25:1387–1400. 2014. View Article : Google Scholar : PubMed/NCBI
|
|
11
|
Benali SL, Lees GE, Castagnaro M and Aresu
L: Epithelial mesenchymal transition in the progression of renal
disease in dogs. Histol Histopathol. 29:1409–1414. 2014.PubMed/NCBI
|
|
12
|
Della Latta V, Cecchettini A, Del Ry S and
Morales MA: Bleomycin in the setting of lung fibrosis induction:
From biological mechanisms to counteractions. Pharmacol Res.
97:122–130. 2015. View Article : Google Scholar : PubMed/NCBI
|
|
13
|
Lee SJ, Kim KH and Park KK: Mechanisms of
fibrogenesis in liver cirrhosis: The molecular aspects of
epithelial-mesenchymal transition. World J Hepatol. 6:207–216.
2014. View Article : Google Scholar : PubMed/NCBI
|
|
14
|
Robertson H, Kirby JA, Yip WW, Jones DE
and Burt AD: Biliary epithelial-mesenchymal transition in
posttransplantation recurrence of primary biliary cirrhosis.
Hepatology. 45:977–981. 2007. View Article : Google Scholar : PubMed/NCBI
|
|
15
|
Omenetti A, Porrello A, Jung Y, Yang L,
Popov Y, Choi SS, Witek RP, Alpini G, Venter J, Vandongen HM, et
al: Hedgehog signaling regulates epithelial-mesenchymal transition
during biliary fibrosis in rodents and humans. J Clin Invest.
118:3331–3342. 2008.PubMed/NCBI
|
|
16
|
Schulze F, Schardt K, Wedemeyer I, Konze
E, Wendland K, Dirsch O, Töx U, Dienes HP and Odenthal M:
Epithelial-mesenchymal transition of biliary epithelial cells in
advanced liver fibrosis. Verh Dtsch Ges Pathol. 91:250–256.
2007.(In German). PubMed/NCBI
|
|
17
|
Park SM: The crucial role of
cholangiocytes in cholangiopathies. Gut Liver. 6:295–304. 2012.
View Article : Google Scholar : PubMed/NCBI
|
|
18
|
Lee SJ, Park JB, Kim KH, Lee WR, Kim JY,
An HJ and Park KK: Immunohistochemical study for the origin of
ductular reaction in chronic liver disease. Int J Clin Exp Pathol.
7:4076–4085. 2014.PubMed/NCBI
|
|
19
|
Sato Y, Harada K, Ozaki S, Furubo S,
Kizawa K, Sanzen T, Yasoshima M, Ikeda H, Sasaki M and Nakanuma Y:
Cholangiocytes with mesenchymal features contribute to progressive
hepatic fibrosis of the polycystic kidney rat. Am J Pathol.
171:1859–1871. 2007. View Article : Google Scholar : PubMed/NCBI
|
|
20
|
Weiss MC and Strick-Marchand H: Isolation
and characterization of mouse hepatic stem cells in vitro. Semin
Liver Dis. 23:313–324. 2003. View Article : Google Scholar : PubMed/NCBI
|
|
21
|
Tsukada S, Parsons CJ and Rippe RA:
Mechanisms of liver fibrosis. Clin Chim Acta. 364:33–60. 2006.
View Article : Google Scholar : PubMed/NCBI
|
|
22
|
Tsutsumi M, Takada A and Takase S:
Characterization of desmin-pvsitive rat liver sinusoidal cells.
Hepatology. 7:277–228. 1987. View Article : Google Scholar : PubMed/NCBI
|