Introduction
Bladder cancer is the second most common
genitourinary tumor, having an incidence of 357,000 new cases each
year worldwide; approximately one-third of these cases are likely
to be invasive or metastatic disease at the time of diagnosis
(1). Although radical cystectomy
is considered as the gold standard for the treatment of patients
with localized, but muscle-invasive, bladder cancer, nearly 50% of
patients develop metastases within 2 years after cystectomy and
subsequently die of the disease (2).
Neoadjuvant chemotherapy is usually applied to
muscle-invasive bladder cancer to manage micrometastases and
improve prognosis (3,4). A neoadjuvant chemotherapy regimen
involving gemcitabine and carboplatin (GC) as well as that of
methotrexate, vinblastine, doxorubicin and cisplatin (M-VAC),
followed by radical cystectomy, have been found to decrease the
recurrence rate compared to radical cystectomy alone and to improve
survival (5–8). Furthermore, a small subset of
patients who respond well to neoadjuvant chemotherapy may have a
chance to preserve bladder function and maintain a good quality of
life.
However, since no method yet exists for predicting
the response of an individual patient to GC therapy, some patients
suffer from adverse reactions to these drugs without achieving any
benefit in terms of a positive effect. They often are not able to
undergo additional treatment as their physical condition
deteriorates (9,10). Hence, the development of a reliable
method to predict the effectiveness of a specific therapy is
critical to assign the appropriate treatment to individual patients
with bladder cancer. Various factors have been reported to be
associated with chemosensitivity or prognosis, yet each of these
factors is not sufficiently effective to reliably predict
individual response. Since cancer cells in individual patients are
characterized by a large number of features, a larger body of
information is required to precisely characterize them. The
profiling of gene expression patterns on genome-wide microarrays
enables investigators to perform comprehensive analyses of complex
molecular activities in cancer cells. Systematic analysis of the
expression levels of thousands of genes is also a useful approach
for identifying molecules related to response to chemotherapy or
radiation therapy.
In this study, we report the establishment of a
system for predicting response to GC neoadjuvant chemotherapy for
patients with invasive bladder cancer using genome-wide information
obtained for 37 cases using a microarray consisting of 38,500
genes. This was carried out in combination with laser microbeam
microdissection of the tumors to enrich the proportion of cancer
cells for accurate analysis. We identified 12 genes that exhibited
significantly different levels of expression between responders and
non-responders who received a neoadjuvant GC regimen. In addition,
although the response rate to each of the M-VAC and GC regimens was
reported to be nearly 50%, we suggest that the personalized
selection of an appropriate chemotherapy regime using prediction
systems for the response to these regimens may improve the response
rate to approximately 80%. Our results strongly imply that
‘personalized therapy’ based on expression levels of a small number
of genes may improve the quality of life of a larger proportion of
patients with invasive bladder cancer.
Materials and methods
Patients, tissue samples and neoadjuvant
chemotherapy
Bladder cancer tissue samples from punch biopsy and
corresponding clinical information were obtained from the Iwate
Medical University after each patient provided written informed
consent. A total of 37 cancer samples from patients (6 females and
31 males; median age, 67 years; age range, 52–78 years) (Table I) histologically confirmed as
having transitional cell carcinoma of the bladder were selected for
this study. The clinical stage of each patient was judged according
to the International Union Against Cancer Tumor-Node-Metastasis
classification; we enrolled only patients who had no node
metastasis at clinical stages T2aN0M0 to T4aN0M0 and were expected
to undergo radical cystectomy without prior radiation therapy. All
participants had no serious abnormality in renal, hepatic or
hematologic function and an Eastern Cooperative Oncology Group
performance status (PS) judged to be ≤2. Three to five pieces of
cancer tissue were obtained from each patient at the time of biopsy
before neoadjuvant chemotherapy. These samples were immediately
embedded in TissueTek OCT compound (Sakura, Tokyo, Japan), frozen
and stored at −80°C. The frozen tissues were sliced into
8-μm sections using a cryostat (Sakura) and were then
stained with H&E for histologic examination. Bladder cancer
cells were selectively enriched for our experiments using the
EZ-cut system with a pulsed UV narrow beam focus laser (SL
Microtest GmbH, Germany) according to the manufacturer's protocols.
All patients were examined through chest X-ray, computed tomography
and magnetic resonance imaging of their abdomen and pelvis and were
confirmed to have neither lymph node nor distant metastases.
Patients were administered two 28-day cycles of GC neoadjuvant
chemotherapy as follows: gemcitabine (1,000 mg/m2) on
days 1, 8 and 15; carboplatin (5 AUC) on day 2. According to their
responses to the treatment, we categorized the patients into two
groups: ‘responders’ who achieved significant tumor shrinking
(>60%) after two courses of GC neoadjuvant chemotherapy, and
‘non-responders’ who revealed no significant tumor shrinking (≤60%)
after the two courses of chemotherapy.
 | Table I.Clinicopathological features of the
examined bladder cancer patients. |
Table I.
Clinicopathological features of the
examined bladder cancer patients.
| ID no. | Gender | Age | Stage | Grade | Response | Prediction | Post treatment |
|---|
| BCGC1006 | M | 60 | T4 | G3 | Responder | Learning | Cystectomy |
| BCGC1007 | F | 71 | T3a | G2 | Responder | Learning | Cystectomy |
| BCGC1010 | M | 67 | T3b | G3 | Responder | Learning | Cystectomy |
| BCGC1011 | M | 69 | T3b | - | Responder | Learning | Cystectomy |
| BCGC1016 | M | 53 | T3a | G2 | Responder | Learning | Cystectomy |
| BCGC1020 | F | 62 | T2a | G3 | Responder | Learning | Cystectomy |
| BCGC1021 | M | 67 | T3a | G2 | Responder | Learning | Cystectomy |
| BCGC1022 | M | 71 | T2a | G3 | Responder | Learning | Cystectomy |
| BCGC1029 | M | 56 | T3b | G3 | Responder | Learning | Cystectomy |
| BCGC1005 | M | 56 | T2b | G1 | Non-responder | Learning | Cystectomy |
| BCGC1009 | M | 60 | T4 | G3 | Non-responder | Learning | Radiation |
| BCGC1015 | M | 78 | T3a | G2 | Non-responder | Learning | Cystectomy |
| BCGC1017 | M | 59 | T3a | G3 | Non-responder | Learning | Cystectomy |
| BCGC1018 | M | 72 | T3a | G2 | Non-responder | Learning | Cystectomy |
| BCGC1024 | M | 67 | T2a | G2 | Non-responder | Learning | Cystectomy |
| BCGC1025 | M | 52 | T2b | G3 | Non-responder | Learning | Radiation |
| BCGC1026 | M | 62 | T4 | G3 | Non-responder | Learning | Radiation |
| BCGC1027 | M | 62 | T3b | G3 | Non-responder | Learning | Radiation |
| BCGC1001 | M | 60 | T4 | G1 | Responder | Test | Cystectomy |
| BCGC1003 | M | 64 | T3b | G3 | Responder | Test | Cystectomy |
| BCGC1012 | M | 67 | T2a | G3 | Responder | Test | Cystectomy |
| BCGC1013 | M | 74 | T3b | G2 | Responder | Test | Cystectomy |
| BCGC1014 | M | 76 | T3b | G2 | Responder | Test | Cystectomy |
| BCGC1019 | F | 71 | T2a | G2 | Responder | Test | TUR-Bt |
| BCGC1031 | M | 75 | T2a | G3 | Responder | Test | Cystectomy |
| BCGC1033 | F | 71 | T2a | G2 | Responder | Test | Cystectomy |
| BCGC1036 | M | 71 | T3b | G2 | Responder | Test | Cystectomy |
| BCGC1041 | M | 68 | T2b | G3 | Responder | Test | Cystectomy |
| BCGC1045 | M | 67 | T2b | G3 | Responder | Test | GCx1 |
| BCGC1030 | M | 55 | T2b | G2 | Non-responder | Test | Cystectomy |
| BCGC1032 | M | 70 | T2a | G3 | Non-responder | Test | Radiation |
| BCGC1034 | F | 59 | T2a | G2 | Non-responder | Test | - |
| BCGC1037 | M | 66 | T2a | G2 | Non-responder | Test | - |
| BCGC1039 | M | 73 | T3a | G2 | Non-responder | Test | - |
| BCGC1047 | M | 71 | T4 | G3 | Non-responder | Test | Radiation |
| BCGC1048 | M | 74 | T3b | G2 | Non-responder | Test | GCx1 |
| BCGC1049 | F | 70 | T4 | G3 | Non-responder | Test | GCx1 |
GeneChip hybridization
The Affymetrix human genome U133 Plus 2.0 GeneChip
arrays were used for microarray hybridizations. This GeneChip
comprises >54,000 probe sets and analyzes the expression level
of 47,400 transcripts. For microarray hybridization, we followed
the protocol described in the Affymetrix GeneChip 3′IVT Express Kit
User Manual Protocol (Affymetrix, Santa Clara, CA, USA). For the
synthesis of single-strand cDNA, 30–150 ng of total RNA was
reversely transcribed using the First-Strand Enzyme mix and Buffer
mix included in the GeneChip 3′IVT Express kit and double-strand
cDNA synthesis according to the manufacturer's instructions
followed by the Second-Strand Enzyme mix and Buffer mix included in
the GeneChip 3′IVT Express kit. IVT amplification generates
multiple copies of biotin-modified aRNA from the double-stranded
cDNA templates (Affymetrix). A 15-μg aliquot of the labeled
product was fragmented by heat and ion-mediated hydrolysis at 94°C
for 35 min in H2O and 8 μl of 5X fragmentation
buffer (Affymetrix). The fragmented cRNA was hybridized for 16 h at
45°C in a Hybridization Oven 640 to a U133 Plus 2.0 oligonucleotide
array (Affymetrix). The washing and staining of the arrays with
phycoerythrin-conjugated streptavidin (Molecular Probes, Eugene,
OR, USA) was completed in a Fluidics Station 450 (Affymetrix). The
arrays were then scanned using a confocal laser GeneChip scanner
3000 (Affymetrix).
Data analysis
The obtained image files were analyzed with the
Affymetrix data suite system, Microarray Suite 5.0 (MAS 5.0;
Affymetrix). Global normalization at a target value of 500 was
applied to all 38 arrays (37 cancer arrays and one array of the
universal control) using the Affymetrix®
GeneChip® Command Console 1.1 (Affymetrix). Normalized
data from text files were imported to a Microsoft Excel spread
sheet. Since data derived from low-signal intensities are less
reliable, we excluded transcripts with low intensities from further
analysis when the signal intensities of both the normal and cancer
cells were lower than that of the cut-off. For the other genes, we
calculated the signal intensities of the cancer/normal ratio using
the raw data of each sample (11).
Hierarchical clustering analysis
We used web-available software (‘Cluster’ and
‘TreeView’) written by M. Eisen (http://genome-www5.stanford.edu/MicroArray/SMD/restech.html)
to create a graphic representation of the microarray data and to
create a dendrogram of hierarchical clustering. Before the
clustering algorithm was applied, the fluorescence ratio for each
spot was first log-transformed, and then the data for each sample
were median-centered to remove experimental biases.
Identification of discriminating genes
for chemosensitivity
We applied a random permutation test to identify
genes that were expressed at a significantly different level
between the two groups; that is, tumors with good response and
those with poor response to the chemotherapy. Mean (μ) and
standard deviation (δ) were calculated from the log-transformed
relative expression ratios of each gene in the responder (r) and
non-responder (n) cases. A discrimination score (DS) for each gene
was defined as follows: DS = (μr −
μn)/(δr + δn).
We carried out permutation tests to estimate the
ability of these individual genes to distinguish between responders
and non-responders; samples were randomly permutated between the
two groups, 10,000 times. Since the DS data set of each gene showed
a normal distribution, we calculated a P-value for the user-defined
grouping (12). For the initial
analysis, we applied the expression data obtained for the 18 cases
(9 responders and 9 non-responders) that were obtained at an
earlier stage of the study.
Calculation of the prediction score
We calculated the prediction scores (PS) according
to procedures described previously (12). Each gene (gi) votes for either
responder or non-responder depending on whether the expression
level (xi) in the sample is closer to the mean
expression level of the responders or non-responders in the
reference samples. The magnitude of the vote (Vi)
reflects the deviation of the expression level in the sample from
the average of the two classes: Vi = l xi −
(μr + μn)/2 l.
We summed the votes to obtain total votes for the
responders (Vr) and non-responders (Vn) and
calculated PS values as follows: PS = [(Vr −
Vn)/(Vr + Vn)] × 100, reflecting
the margin of victory in the direction of either responder or
non-responder. PS values range from −100 to 100; a higher absolute
value of PS reflects a stronger prediction.
Evaluation of the classification and
leave-one-out method
We calculated the classification score (CS) using
prediction scores of the responders (PSr) and
non-responders (PSn) in each gene set as follows: CS =
[μ(PSr) −
μ(PSn)]/[δ(PSr) +
δ(PSn)].
A larger value of CS indicates better separation of
the two groups by the prediction scoring system. For the
leave-one-out test, one sample is withheld, the permutation P-value
and mean expression levels are calculated using the remaining
samples and the class of the withheld sample is subsequently
evaluated by calculating its prediction score. We repeated this
procedure for each of the 18 samples.
Quantitative reverse
transcription-PCR
Aliquots of the same aRNA hybridized to the
microarray from individual samples were reversely transcribed using
random hexamer and SuperScript II reverse transcriptase
(Invitrogen, Carlsbad, CA, USA). The expression of the 12
predictive genes and 1 endogenous control gene was measured by
quantitative-RT-PCR using TaqMan Gene Expression Assay products on
a Light Cycler 480 system (Roche Applied Science, Basel,
Switzerland) as described previously (13,14).
The sequences of the primers and fluorogenic TaqMan MGB probes are
listed in Table II. To normalize
the expression of each gene, we selected as internal controls
chaperonin-containing TCP1, subunit 6A (CCT6A), since this
showed the smallest fluctuations of cancer/normal ratio in our
bladder cancer microarray data as described previously (13). For the generation of standard
curves we used a mixture of mRNAs derived from the bladder cancer
samples. Quantitative RT-PCR experiments were performed in
duplicate for all 12 predictive genes, and the relative expression
ratios of each sample were calculated. The normalized gene
expression values were log-transformed (on a base 2 scale) in a
manner similar to the transformation of the microarray-based
hybridization data.
| Table II.List of primer sets and TaqMan
probes. |
Table II.
List of primer sets and TaqMan
probes.
| Public ID | Symbol | Forward primer | Reverse primer | TaqMan probe |
|---|
| Internal
control | | | | |
| AF385084 | CCT6A |
5′-CTCCTGCACTGTGATTGCCA-3′ |
5′-GACATTCCAGCTCGCATGATC-3′ |
5′-FAM-CAACATTCTCTTGGTTGATG-MGB-3′ |
| Predictive
genes | | | | |
| AL137335 | IPO7 |
5′-TTGTGGTGCACTCACCTCTGA-3′ |
5′-CAATGAAATACCACTAACCCCTTTTT-3′ |
5′-FAM-AGTGACTTGAATTCGG-MGB-3′ |
| BC043571 |
LOC613266 |
5′-CCTCCAAGAGTGTTCGATTTCAA-3′ |
5′-CCTGCGTTCAGGACTGAGTAAGA-3′ |
5′-FAM-CATTGTGCAATTTC-MGB-3′ |
| BF508662 | SPRY1 |
5′-CTTTTGGCCCCTTGGATAGTT-3′ |
5′-AGGCAAGGAAAACACAGAAGAGA-3′ |
5′-FAM-ACAGCTGAGTAATTCT-MGB-3′ |
| AI884890 | OSBPL11 |
5′-AGGTTCTTCTCTGTTTACCCTAAATCC-3′ |
5′-CAATCAGGAAGCAGGTCACTCA-3′ |
5′-FAM-CCCAGAATGGAGTCATT-MGB-3′ |
| NM_016220 | ZNF107 |
5′-TGCTCTTCATTCCTATTGTATTCACAT-3′ |
5′-CATAAATAATACCGACCTAACAGAAATGAT-3′ |
5′-FAM-CATGCATCAAAGATATGAGA-MGB-3′ |
| AI025829 | |
5′-TGTTTTTCAGTTGCTGCACTTTTT-3′ |
5′-GCATATTCCAGCAATTACCTTTGA-3′ |
5′-FAM-TTTAATCTTGCTCAGTCCC-MGB-3′ |
| AF090916 | |
5′-TGGCAATATCCTTTTCTCTGATTTT-3′ |
5′-GGCCTTGGTTGCCCAAA-3′ |
5′-FAM-AAAGTTAGGCTGAGTGCAGT-MGB-3′ |
| N63709 | LIN7C |
5′-CCTCTGCCAACAATCTGGTTTT-3′ |
5′-CCATACCTGGAATAACCTTTGAAGA-3′ |
5′-FAM-ATTGTTGTCTAAAGTTTGCTAGTAG-MGB-3′ |
| AL043021 | WDR90 |
5′-GCCTGGAGCAAGCTGTTGTAA-3′ |
5′-CAAAAGGGCAACAGGTATGAAAG-3′ |
5′-FAM-TTTGGCGCCCTGTGAA-MGB-3′ |
| NM_002555 |
SLC22A18 |
5′-TTTGGCGTCCCCGTCTT-3′ |
5′-GGACCAGGAGGACAAGGGTATT-3′ |
5′-FAM-CACGTGCAGGTTGCTA-MGB-3′ |
| NM_018129 | PNPO |
5′-ATCACACCTGCCTGAGAAGGA-3′ |
5′-CCTGACGGACTGGGAATAAAAA-3′ |
5′-FAM-TGGGCTGTCACTAGGA-MGB-3′ |
| NM_005207 | CRKL |
5′-TTGAGGCCATGGCGAGAT-3′ |
5′-GCAGCTAAGCCACTGCTTTGT-3′ |
5′-FAM-CTGCATGTTTGCTGTTC-MGB-3′ |
Simulation of response of GC- or
MVAC-treated patients to M-VAC or GC therapy
To simulate the clinical response of GC- or
MVAC-treated patients to M-VAC or GC therapy, we first estimated
the accuracies of the prediction scoring systems: positive and
negative prediction accuracies (PPA and NPA) for test cases with
positive and negative prediction scores, respectively. We
calculated the accuracy of each of the prediction scoring systems
for GC (PPAGC, NPAGC) and M-VAC
(PPAMVAC, NPAMVAC) therapies, respectively.
Among the 19 test cases (Fig. 2B)
for the GC therapy, all of the 10 cases with positive scores were
actually responders. Eight of the 9 cases with negative scores were
non-responders. Therefore, the positive and negative predictive
accuracies of this system were PPAGC = 10/10 and
NPAGC = 8/9. However, in our previous study among the 21
test cases for the prediction scoring system for the M-VAC therapy,
14 of 16 cases with positive prediction scores were responders and
the remaining 2 cases were non-responders (data not shown). All of
the 5 cases with negative prediction scores were non-responders
(data not shown). Therefore, the positive and negative predictive
accuracies were PPAMVAC = 14/16 and NPAMVAC =
5/5.
Based on these results, we re-estimated the number
of simulated GC/M-VAC responders: the number of estimated
non-responders using both the GC and M-VAC prediction scoring
systems was, based on the initial 13 cases (Fig. 4A–C), 13 × NPAGC ×
NPAMVAC. Also, among the 29 cases predicted to be GC
non-responders, but M-VAC responders, 29 × NPAGC × (1 -
PPAMVAC) cases should be reconsidered as non-responders
to both GC and M-VAC. Therefore, of the 76 cases in total, the
number of estimated GC/M-VAC responders was calculated to be: 76 −
[13 × NPAGC × NPAMVAC + 29 × NPAGC
× (1 − PPAMVAC)] = 61.2.
Results
Identification of genes associated with
GC neoadjuvant chemotherapy for bladder cancer
We enrolled 37 patients with invasive bladder cancer
whose clinicopathological features are summarized in Table I. We defined patients who achieved
significant tumor shrinking (>60%) after two courses of GC
neoadjuvant chemotherapy as ‘responders’, as we used the definition
for the establishment of the prediction score for response to M-VAC
therapy (13,15). We compared the microarray
expression profiles of tumors from the 9 responders and 9
non-responders and identified a set of genes that distinguished the
two groups in accordance with the following criteria: signal
intensities higher than the cut-off level in >60% of samples of
at least one group. Then, we carried out a random permutation test
to select genes that may be associated with the drug response (see
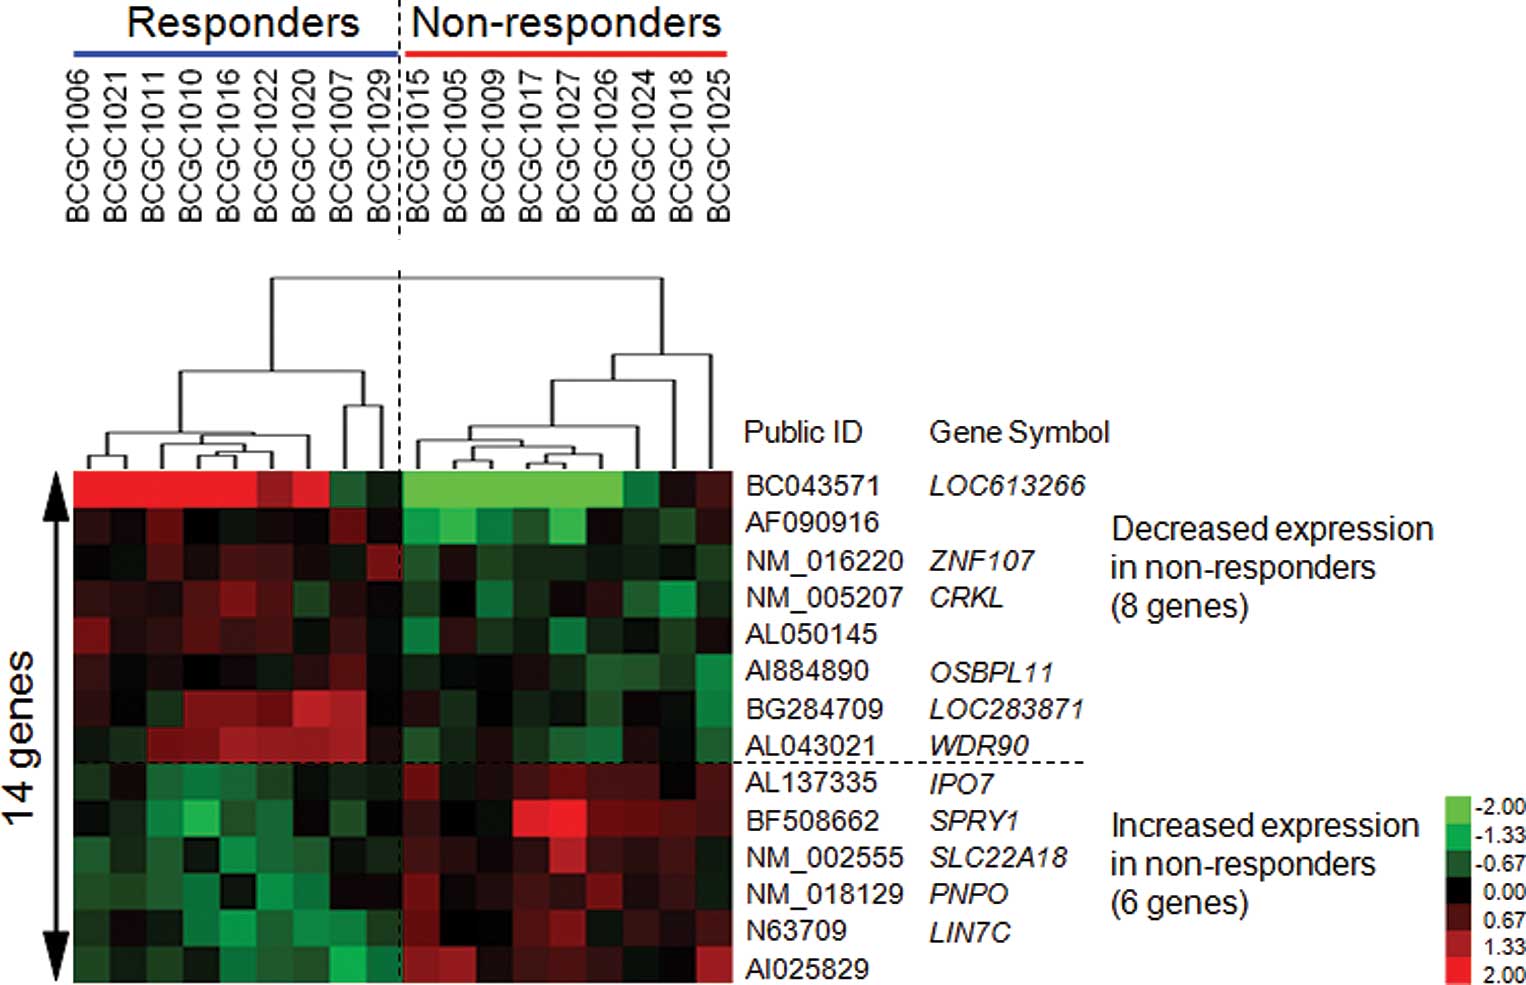
Materials and methods). We identified 14 genes that showed
permutation P-values of <0.0001 (Table III). As shown in Fig. 1, the expression levels of 8 genes
were increased and those of the remaining 6 were decreased in the
responder group as compared to the non-responder group. A
supervised hierarchical clustering analysis using this set of genes
with Cluster and Treeview software (http://rana.lbl.gov/EisenSoftware.htm) yielded good
separation of the two groups with regard to the response to GC
treatment (Fig. 1).
| Table III.List of 14 discriminating genes. |
Table III.
List of 14 discriminating genes.
| Public ID | Gene symbol | Gene name | P-valuea | Groupb |
|---|
| AL137335 | IPO7 | Importin 7 |
3.96×10⁻⁷ | − |
| BC043571 |
LOC613266 | Hypothetical
LOC613266 |
8.38×10⁻⁷ | + |
| BF508662 | SPRY1 | Sprouty homolog 1,
antagonist of FGF signaling (Drosophila) |
5.34×10⁻⁶ | − |
| AI884890 | OSBPL11 | Oxysterol binding
protein-like 11 |
1.81×10⁻⁵ | + |
| NM_016220 | ZNF107 | Zinc finger protein
107 |
1.96×10⁻⁵ | + |
| AI025829 | | CDNA clone
IMAGE:5287121 |
2.45×10⁻⁵ | − |
| AF090916 | | Clone HQ0312 |
2.90×10⁻⁵ | + |
| N63709 | LIN7C | Lin-7 homolog C
(C. elegans) |
3.18×10⁻⁵ | − |
| AL043021 | WDR90 | WD repeat domain
90 |
3.19×10⁻⁵ | + |
| NM_002555 |
SLC22A18 | Solute carrier
family 22, member 18 |
3.30×10⁻⁵ | − |
| NM_018129 | PNPO | Pyridoxamine
5′-phosphate oxidase |
4.75×10⁻⁵ | − |
| NM_005207 | CRKL | V-crk sarcoma virus
CT10 oncogene homolog (avian)-like |
6.92×10⁻⁵ | + |
| AL050145 | | Transcribed
locus |
7.78×10⁻⁵ | + |
| BG284709 |
LOC283871 | Hypothetical
protein LOC283871 |
9.11×10⁻⁵ | + |
Establishment of prediction scoring
system for clinical response to GC neoadjuvant chemotherapy
Using the 14-gene set that seemed to distinguish the
two groups, we calculated the prediction score of each sample by
the weighted-vote method (12).
Subsequently, we rank-ordered these candidates on the basis of the
significance of their permutation P-values (Table III) and calculated prediction
scores by the leave-one-out cross-validation test. For the
leave-one-out test, we withheld one sample and calculated the
permutation P-values and the mean expression levels using the
remaining samples to identify genes that most powerfully separated
the responder group from the non-responder group. As shown in
Table III, importin 7
(IPO7) and hypothetical LOC613266 (LOC613266)
revealed a P-value of <10−6 in the permutation test
(P=3.96×10⁻⁷ and P=8.38×10⁻⁷, respectively).
IPO7, which was up-regulated in the tumors belonging to the
non-responder group, imports proteins into the nucleus by acting as
an adapter-like protein (16) and
is reported to mediate the penetration of the interacting
extracellular signal-regulated kinases (ERK) into the nucleus
through nuclear pores (16). Since
the ERK signaling pathway was reported to be in part responsible
for the resistance to gemcitabine in hepatocellular, pancreatic and
cholangiocellular carcinomas (17,18),
up-regulated expression of IPO7 may contribute to resistance to
gemcitabine-combined therapy for bladder cancer through the ERK
signaling pathway.
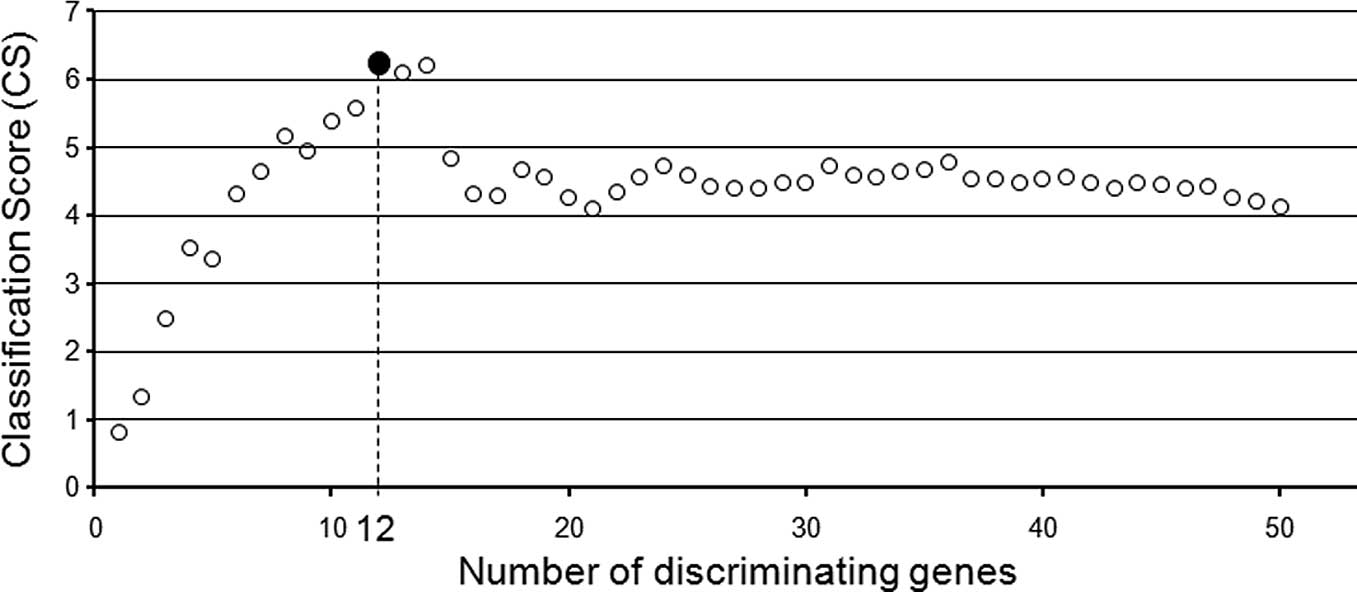
We calculated the classification score (CS) using
the prediction scores of the 9 responders and 9 non-responders in
various combinations of selected genes and obtained the best
separation of the two groups by using the 12 genes that were ranked
highest in our candidate gene list (Fig. 2A and B; Table IV). A hierarchical clustering
analysis using this set of genes with Cluster and Treeview software
yielded good separation of the two groups with regard to
sensitivity to the GC neoadjuvant chemotherapy (Fig. 2C).
| Table IV.List of the 12 predictive genes. |
Table IV.
List of the 12 predictive genes.
| Public ID | Gene symbol | Gene name |
|---|
| AL137335 | IPO7 | Importin 7 |
| BC043571 |
LOC613266 | Hypothetical
LOC613266 |
| BF508662 | SPRY1 | Sprouty homolog 1,
antagonist of FGF signaling (Drosophila) |
| AI884890 | OSBPL11 | Oxysterol binding
protein-like 11 |
| NM_016220 | ZNF107 | Zinc finger protein
107 |
| AI025829 | | CDNA clone
IMAGE:5287121 |
| AF090916 | | Clone HQ0312 |
| N63709 | LIN7C | Lin-7 homolog C
(C. elegans) |
| AL043021 | WDR90 | WD repeat domain
90 |
| NM_002555 |
SLC22A18 | Solute carrier
family 22, member 18 |
| NM_018129 | PNPO | Pyridoxamine
5′-phosphate oxidase |
| NM_005207 | CRKL | V-crk sarcoma virus
CT10 oncogene homolog (avian)-like |
Furthermore, to verify the prediction scoring system
based on the expression data for this set of 12 genes, we examined
19 ‘test’ cases (11 responders and 8 non-responders; Fig. 2B). We investigated gene expression
profiles in each of the 19 test cases and then calculated the
prediction scores. As shown in Fig.
2B, for 18 of the 19 test cases, the clinical responses were
correctly predicted according to the calculated prediction scores.
Our data suggest that expression levels of these 12 genes or a
subset may play important roles in cellular responses induced by GC
neoadjuvant chemotherapy.
Establishment of a quantitative reverse
transcription-PCR-based prediction scoring system
To further validate the results of the microarray
analysis, we carried out real-time quantitative RT-PCR for the 12
predictive genes and one quantitative control gene, CCT6A,
using the 32 cases (14 learning and 18 test cases) (13). We observed significant concordance
between the results from the microarray and those of the
quantitative RT-PCR experiments. As shown in Table V, Pearson and Spearman rank
correlations were positive and statistically significant for all of
the genes.
| Table V.Correlation of microarray expression
data with quantitative-PCR-derived values. |
Table V.
Correlation of microarray expression
data with quantitative-PCR-derived values.
| Public ID | Gene symbol | Pearson's
correlation coefficient | P-value | Spearman's rank
correlation | P-value |
|---|
| AL137335 | IPO7 | 0.67 |
2.6×10⁻⁵ | 0.69 |
2.4×10⁻⁵ |
| BC043571 |
LOC613266 | 0.88 |
6.9×10⁻⁹ | 0.96 |
2.5×10⁻⁶ |
| BF508662 | SPRY1 | 0.85 |
9.4×10⁻¹⁰ | 0.86 |
2.7×10⁻⁷ |
| AI884890 | OSBPL11 | 0.73 |
2.7×10⁻⁶ | 0.74 |
2.9×10⁻⁶ |
| NM_016220 | ZNF107 | 0.82 |
1.0×10⁻⁸ | 0.78 |
1.1×10⁻⁶ |
| AI025829 | | 0.47 |
6.2×10⁻³ | 0.50 |
4.0×10⁻³ |
| AF090916 | | 0.84 |
2.0×10⁻⁹ | 0.86 |
2.5×10⁻⁷ |
| N63709 | LIN7C | 0.81 |
1.9×10⁻⁸ | 0.74 |
3.1×10⁻⁶ |
| AL043021 | WDR90 | 0.79 |
7.1×10⁻⁸ | 0.79 |
9.1×10⁻⁷ |
| NM_002555 |
SLC22A18 | 0.85 |
8.1×10⁻¹⁰ | 0.84 |
4.3×10⁻⁷ |
| NM_018129 | PNPO | 0.70 |
7.4×10⁻⁶ | 0.70 |
1.7×10⁻⁵ |
| NM_005207 | CRKL | 0.54 |
1.3×10⁻³ | 0.60 |
3.3×10⁻⁴ |
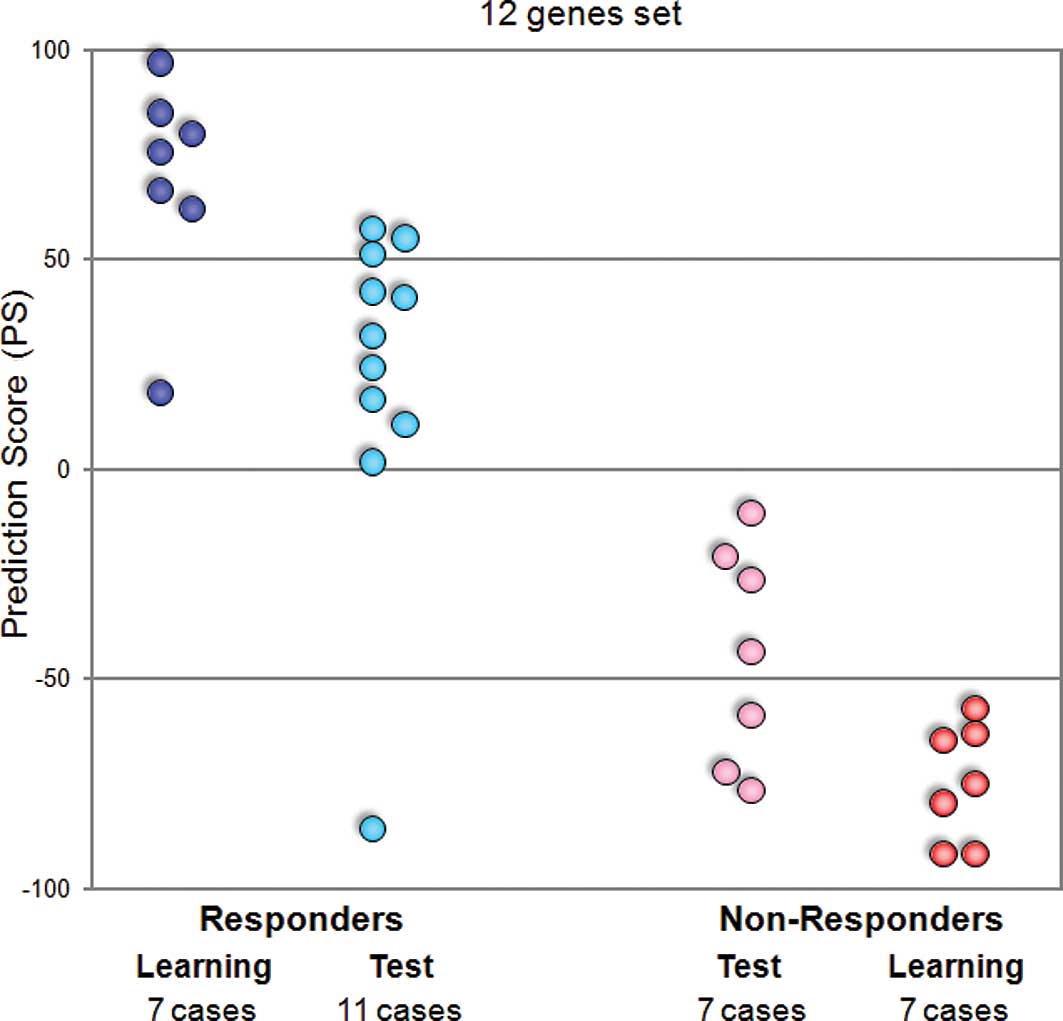
Hence, we attempted to adapt our prediction system
on the basis of quantitative real-time RT-PCR to apply to the
clinical test. We performed quantitative real-time RT-PCR of 12
predictive genes for 14 learning and 18 test cases, and calculated
the prediction scores for all cases. When we estimated these scores
by the leave-one-out cross-validation test, all learning cases and
17 of the 18 test cases were categorized correctly according to
their response to GC neoadjuvant chemotherapy (Fig. 3).
Clinical implication of the two systems
that predict the response to GC and M-VAC therapy
We previously reported a system with nearly 90%
accuracy to predict the clinical response to the M-VAC regimen, a
combination of methotrexate, vinblastine, doxorubicin and cisplatin
neoadjuvant chemotherapy, for patients with invasive bladder cancer
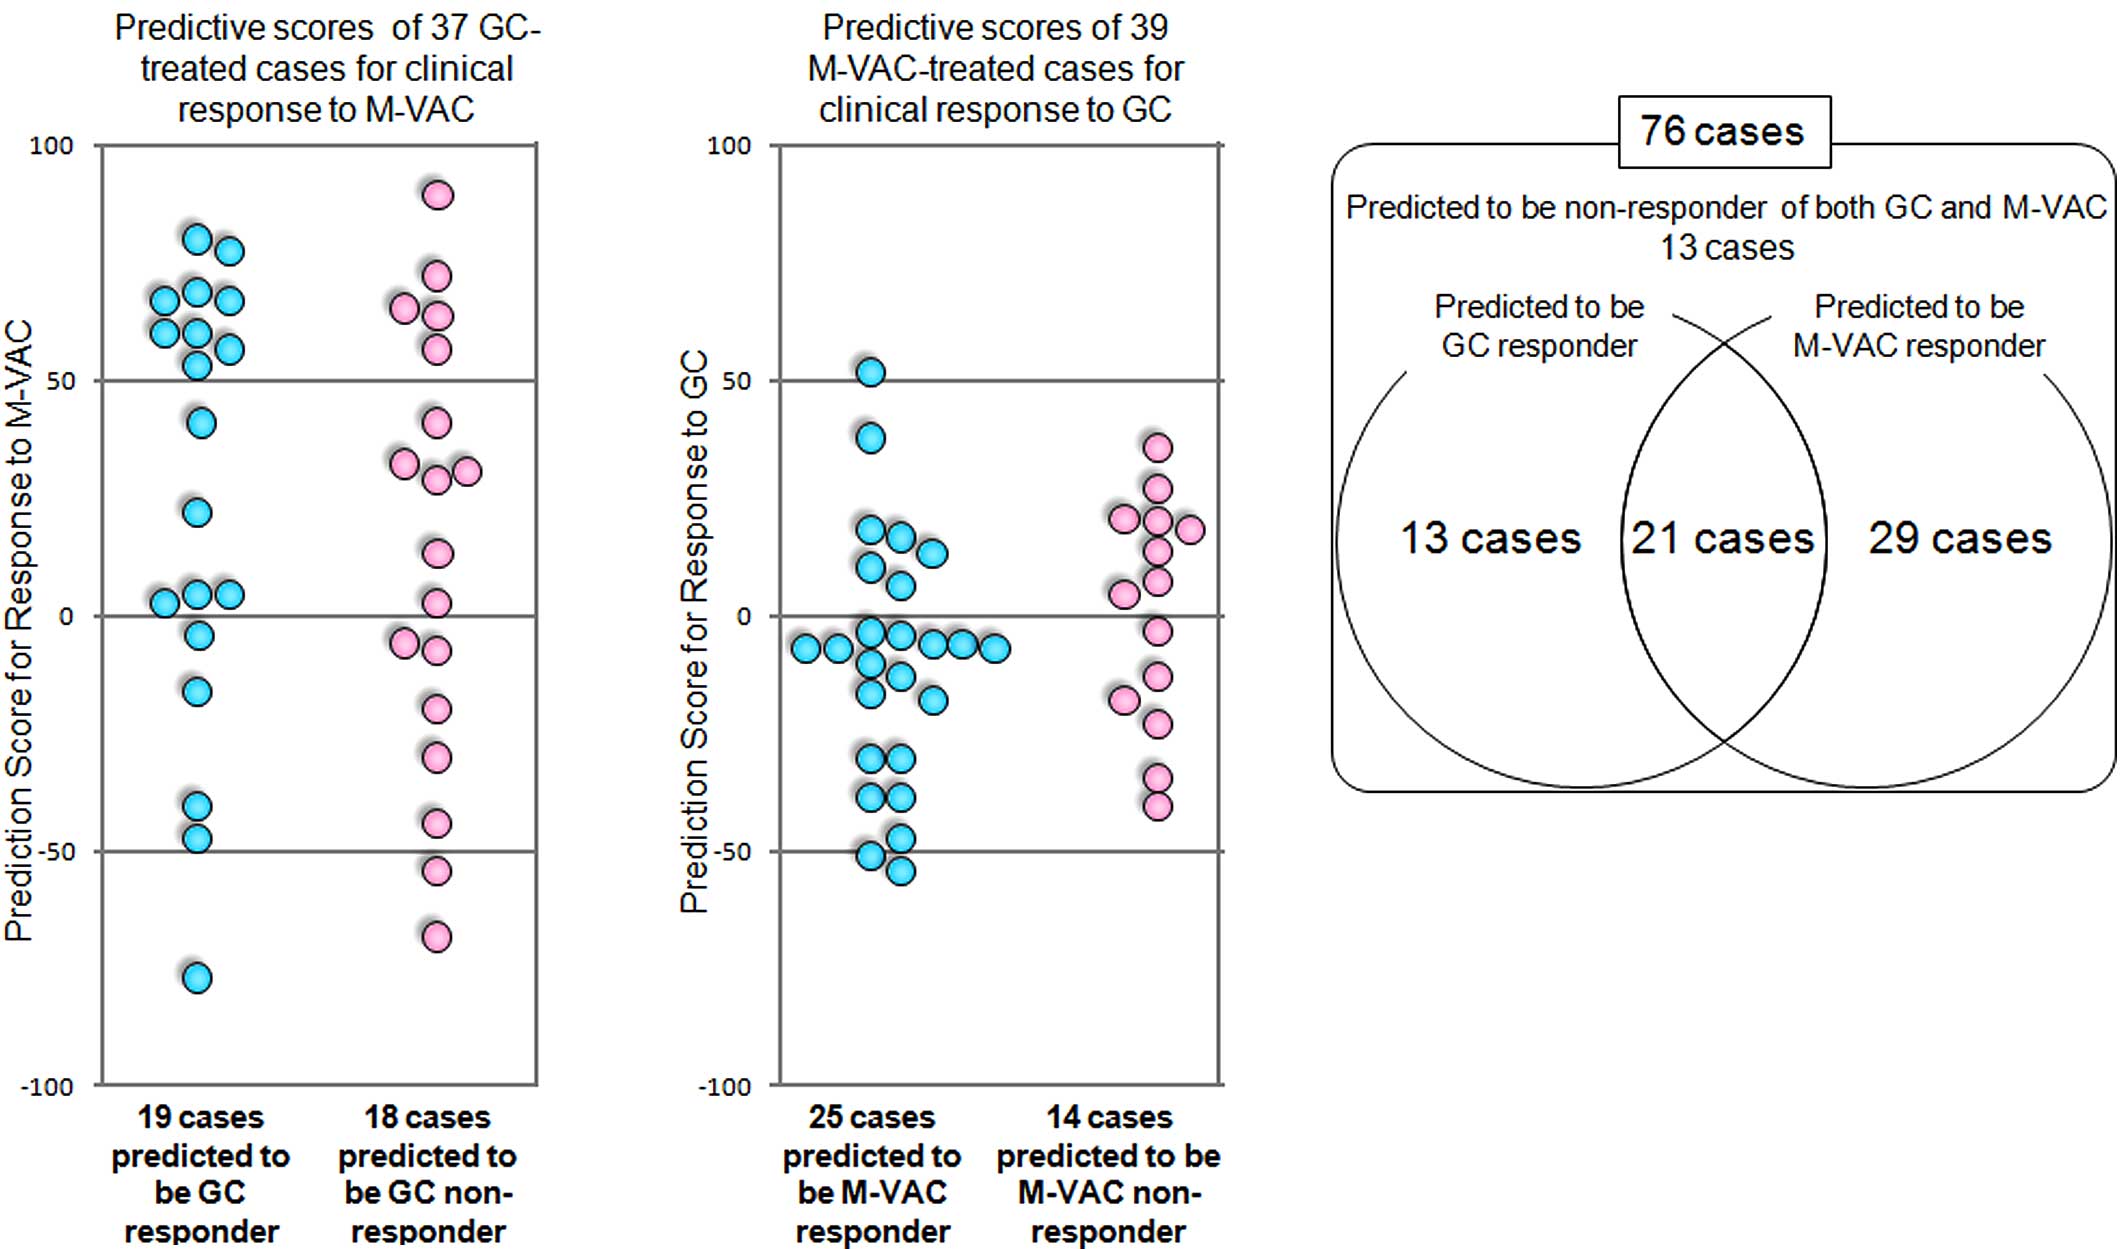
(13). To investigate how patients
treated with GC therapy respond to M-VAC therapy, we simulated the
clinical response of the 37 GC-treated patients to the M-VAC
therapy using our prediction system for M-VAC neoadjuvant
chemotherapy (13). As shown in
Fig. 4A, 14 of the 19 cases
predicted to be GC responders were suspected to be responders to
M-VAC therapy, and 11 of 18 cases predicted to be GC non-responders
were suspected to be responders to M-VAC therapy according to our
M-VAC prediction scoring system. On the other hand, we applied the
scoring system to the GC prediction system indicated above to the
39 M-VAC-treated patients that had been reported previously
(13). Seven of the 25 cases
predicted to be M-VAC responders were calculated to be responders
to GC therapy, and 8 of the 14 cases predicted to be M-VAC
non-responders were calculated to be responders to GC therapy
(Fig. 4B). The distribution of the
cases according to the predicted response to GC or M-VAC therapy is
summarized in Fig. 4C. Among the
the 76 patients treated with either GC or M-VAC, 21 patients were
predicted to be responders of both GC and M-VAC therapies, 13 were
predicted to be responders to GC therapy, 29 were predicted to be
responders to M-VAC therapy and 13 were likely to be non-responders
to both therapies (Fig. 4C).
Sixty-three of the 76 patients could be expected to respond to both
or either of these two regimens by applying our two prediction
systems. However, the positive and negative predictive accuracies
of the prediction systems for response to M-VAC
(PPAMVAC, NPAMVAC) and GC (PPAGC,
NPAGC) were: PPAMVAC = 14/16,
NPAMVAC = 5/5 (data not shown), PPAGC = 10/10
and NPAGC = 8/9 (Fig.
2B). Hence, 80.1% (1 - [13 x NPAGC ×
NPAMVAC + 29 × NPAGC × (1 −
PPAMVAC)]/76) of the 76 patients were calculated to be
responders to GC and/or M-VAC therapies (see Materials and methods)
by the combination of the two systems. Without these types of
prediction system, the responders to GC and M-VAC therapy were
limited to 54.1% (20 of 37 cases) and 59.0% (23 of 39 cases),
respectively (Fig. 4). Since
patients usually are able to undergo neoadjuvant treatment once,
the application of these prediction scores should improve the
quality of life of cancer patients.
Discussion
Microarray analysis is now widely applied to examine
the expression of thousands of genes simultaneously in cancer
cells. However, in the great majority of previous reports, adequate
attention has not been paid to the quality of the materials and
experiments. For example, clinical samples (surgically resected
tissues or biopsy materials) usually consist of various cellular
components, and the proportions of cancer cells in given individual
tissues vary enormously from one tumor to another (19). To obtain precise expression data of
cancer cells, we applied a laser microbeam microdissection system
to enrich as much as possible the populations of cancer cells from
the biopsy specimens of 37 invasive bladder cancers in order to
establish a scoring system to predict response to GC therapy.
Despite recent advances, approximately 50% of
patients with bladder cancer who receive GC chemotherapy show no or
very poor response in terms of staging, and a large proportion of
them suffer from adverse events, such as myelosuppression and/or
gastrointestinal toxicity (9,10).
Although certain factors have been reported to be associated with
chemosensitivity or prognosis of bladder cancer patients (20–24),
characterization of tumor features using only one or a few of these
factors has failed thus far to reliably predict individual
responses, indicating a need for a more accurate method for
predicting response to anticancer drugs. This study was designed to
develop a prediction system for GC neoadjuvant chemotherapy on the
basis of gene expression profiles of purified populations of
bladder cancer cells. We identified 14 genes whose expression was
significantly different between the responders and non-responders
and further ranked them by statistical significance of the
permutation test (P<0.0001; Table
III). Then, we further selected 12 genes and established the
numerical scoring system. Moreover, we tested the scoring system by
the leave-one-out cross-validation method and found it to provide
the best separation of the responders from the non-responders.
Furthermore, our scoring system was able to predict accurately the
response of 18 of the 19 additional test cases to GC neoadjuvant
chemotherapy (Fig. 2B).
The list of 14 genes that showed significant
differences between the two groups might provide insight into the
biological mechanism(s) underlying sensitivity or resistance to GC
chemotherapy. Among those 14 genes, IPO7, which imports
protein into the nucleus by acting as an adapter-like protein, was
up-regulated in the non-responders (Fig. 1, Table
III). Although hypoxia inducible factor 1, α subunit (HIF-1α),
which is one of the substrates of IPO7, is known to activate the
connective tissue growth factor/cysteine-rich 61 (CCN1) (25), CCN1 was found to confer resistant
to carboplatin or cisplatin-induced apoptosis by inhibiting
caspase-3 activity on ovarian cancer cells (25,26).
Therefore, up-regulated expression of IPO7 may contribute to
resistance to GC neoadjuvant chemotherapy through inhibiting
caspase-3 activity. Furthermore, solute carrier family 22, member
18 (SLC22A18), which is a polyspecific organic cation
transporter, was up-regulated in the non-responders. This gene
encodes a predicted protein with multiple membrane-spanning
segments that belongs to the polyspecific transporter/multi-drug
resistance gene family (27). The
pharmacogenomic approach based on the correlation of expression and
sensitivity data sets derived from the NCI-60 cell panel suggest
that SLC22A18 could be a transporter of gemcitabine (28). Hence, up-regulated expression of
SLC22A18 may contribute to resistance to GC neoadjuvant
chemotherapy by the efflux of gemcitabine from cancer cells through
the transporter.
Previously, other research groups have predicted the
prognosis or chemosensitivity of tumors based on quantitive RT-PCR
results for the expression of genes selected through microarray
analysis (29,30). To confirm the reliability of
microarray data and open the possibility of more convenient
prediction strategies for routine clinical use, we also performed
quantitive RT-PCR experiments using the 12 predictive genes and the
32 learning and test cases of bladder cancer selected after
microarray analysis. We confirmed a significant correlation between
the data obtained for the 32 paired samples upon microarray and
results of quantitive RT-PCR (Table
V). Moreover, we verified that our quantitative RT-PCR-based
prediction system could also correctly classify 17 of the 18
subsequent test cases with regard to their drug response (Fig. 3).
We previously reported a scoring system to predict
response to M-VAC therapy, applying a laser microbeam
microdissection system (13). In
the present study, in order to simulate how patients treated with
GC or M-VAC therapy respond to M-VAC or GC therapy, we calculated
their prediction scores for the response to M-VAC or GC therapy
using the two prediction systems, respectively. As shown in
Fig. 4, among the 76 patients,
only 21 and 13 cases were expected to be responders and
non-responders to both GC and M-VAC therapies, respectively,
suggesting that the sensitivity or resistance to M-VAC therapy was
unlikely to be correlated with the sensitivity or resistance to GC
therapy (Fig. 4C). Although a
number of patients with invasive bladder cancer have received
neoadjuvant chemotherapies, such as M-VAC or GC without prediction
of their responses, the response rate (complete or partial
response) to either of the GC or M-VAC therapy has been reported to
be approximately 50% (7–10). Since our present and previous
studies indicated that positive predictive accuracies for M-VAC and
GC were 87.5% (14/16; data not shown) and 100% (10/10),
respectively, personalized selection of an appropriate chemotherapy
with a combination of the two prediction systems would be expected
to improve the response rate to the chemotherapies. In addition, if
all patients with invasive bladder cancer were treated with
appropriate therapy based on the results of prediction systems,
80.1% would achieve significant tumor shrinking (>60%) by either
or both of the two regimens.
In conclusion, we imply with some confidence that
our prediction system for the sensitivity of invasive bladder
cancers to GC therapy as well as M-VAC therapy, which was reported
previously on the basis of either the microarray-derived expression
profiles or the quantitative RT-PCR results, should provide
opportunities for achieving better prognosis and improved quality
of life for patients, leading to higher response rate of
neoadjuvant chemotherapy, although a larger scale study is
certainly warranted. Moreover, appropriate neoadjuvant chemotherapy
for each patient with invasive bladder cancer using these systems
might encourage minimal surgery for invasive bladder cancer. Our
data suggest that the goal of ‘personalized medicine’, prescribing
the correct treatment regimen for each patient, may be achievable
by selecting specific sets of genes for their predictive values
according to the approach demonstrated here.
Abbreviations:
|
GC,
|
gemcitabine and carboplatin;
|
|
M-VAC,
|
methotrexate, vinblastine, doxorubicin
and cisplatin;
|
|
PR,
|
partial response;
|
|
PS,
|
performance status;
|
|
AUC,
|
area under the curve;
|
|
RT-PCR,
|
reverse transcription-polymerase chain
reaction
|
Acknowledgements
We thank Kumi Matsuda for the
real-time RT-PCR experiments, Noriko Sudo for the management of
clinical tissue, Noriko Ikawa for the preparation of tissue
sections and Takashi Morizono for the analysis of data. We also
thank all urologists of the Iwate Medical University for providing
patient samples and clinical information.
References
|
1.
|
Parkin DM, Bray F, Ferlay J and Pisani P:
Global cancer statistics, 2002. CA Cancer J Clin. 55:74–108. 2005.
View Article : Google Scholar
|
|
2.
|
Sternberg CN: The treatment of advanced
bladder cancer. Ann Oncol. 6:113–126. 1995.
|
|
3.
|
Fagg SL, Dawson-Edwards P, Hughes MA,
Latief TN, Rolfe EB and Fielding JW: Cis-diamminedichloroplatinum
(DDP) as initial treatment of invasive bladder cancer. Br J Urol.
56:296–300. 1984. View Article : Google Scholar : PubMed/NCBI
|
|
4.
|
Raghavan D, Pearson B, Coorey G, et al:
Intravenous cis-platinum for invasive bladder cancer. Safety and
feasibility of a new approach. Med J Aust. 140:276–278.
1984.PubMed/NCBI
|
|
5.
|
Advanced Bladder Cancer Meta-analysis
Collaboration: Neoadjuvant chemotherapy in invasive bladder cancer:
a systematic review and meta-analysis. Lancet. 361:1927–1934. 2003.
View Article : Google Scholar : PubMed/NCBI
|
|
6.
|
Grossman HB, Natale RB, Tangen CM, et al:
Neoadjuvant chemotherapy plus cystectomy compared with cystectomy
alone for locally advanced bladder cancer. N Engl J Med.
349:859–866. 2003. View Article : Google Scholar : PubMed/NCBI
|
|
7.
|
Von der Maase H, Sengelov L, Roberts JT,
et al: Long-term survival results of a randomized trial comparing
gemcitabine plus cisplatin, with methotrexate, vinblastine,
doxorubicin, plus cisplatin in patients with bladder cancer. J Clin
Oncol. 23:4602–4608. 2005.
|
|
8.
|
Cam K, Yildirim A, Ozveri H, Turkeri L and
Akdas A: The efficacy of neoadjuvant chemotherapy in invasive
bladder cancer. Int Urol Nephrol. 33:49–52. 2002. View Article : Google Scholar : PubMed/NCBI
|
|
9.
|
Dogliotti L, Carteni G, Siena S, et al:
Gemcitabine plus cisplatin versus gemcitabine plus carboplatin as
first-line chemotherapy in advanced transitional cell carcinoma of
the urothelium: results of a randomized phase 2 trial. Eur Urol.
52:134–141. 2007. View Article : Google Scholar : PubMed/NCBI
|
|
10.
|
Bamias A, Moulopoulos LA, Koutras A, et
al: The combination of gemcitabine and carboplatin as first-line
treatment in patients with advanced urothelial carcinoma. A Phase
II study of the Hellenic Cooperative Oncology Group. Cancer.
106:297–303. 2006. View Article : Google Scholar : PubMed/NCBI
|
|
11.
|
Nikolova DN, Zembutsu H, Sechanov T, et
al: Genome-wide gene expression profiles of thyroid carcinoma:
identification of molecular targets for treatment of thyroid
carcinoma. Oncol Rep. 20:105–121. 2008.PubMed/NCBI
|
|
12.
|
Golub TR, Slonim DK, Tamayo P, et al:
Molecular classification of cancer: class discovery and class
prediction by gene expression monitoring. Science. 286:531–537.
1999. View Article : Google Scholar : PubMed/NCBI
|
|
13.
|
Takata R, Katagiri T, Kanehira M, et al:
Predicting response to methotrexate, vinblastine, doxorubicin, and
cisplatin neoadjuvant chemotherapy for bladder cancers through
genome-wide gene expression profiling. Clin Cancer Res.
11:2625–2636. 2005. View Article : Google Scholar
|
|
14.
|
Yamanaka Y, Tamari M, Nakahata T and
Nakamura Y: Gene expression profiles of human small airway
epithelial cells treated with low doses of 14- and 16-membered
macrolides. Biochem Biophys Res Commun. 287:198–203. 2001.
View Article : Google Scholar : PubMed/NCBI
|
|
15.
|
Takata R, Katagiri T, Kanehira M, et al:
Validation study of the prediction system for clinical response of
M-VAC neoadjuvant chemotherapy. Cancer Sci. 98:113–117. 2007.
View Article : Google Scholar : PubMed/NCBI
|
|
16.
|
Zehorai E, Yao Z, Plotnikov A and Seger R:
The subcellular localization of MEK and ERK – a novel nuclear
translocation signal (NTS) paves a way to the nucleus. Mol Cell
Endocrinol. 314:213–220. 2009.
|
|
17.
|
Matsumoto K, Nagahara T, Okano J and
Murawaki Y: The growth inhibition of hepatocellular and
cholangiocellular carcinoma cells by gemcitabine and the roles of
extracellular signal-regulated and checkpoint kinases. Oncol Rep.
20:863–872. 2008.PubMed/NCBI
|
|
18.
|
Yokoi K and Fidler IJ: Hypoxia increases
resistance of human pancreatic cancer cells to apoptosis induced by
gemcitabine. Clin Cancer Res. 10:2299–2306. 2004. View Article : Google Scholar : PubMed/NCBI
|
|
19.
|
Iwao-Koizumi K, Matoba R, Ueno N, et al:
Prediction of docetaxel response in human breast cancer by gene
expression profiling. J Clin Oncol. 23:422–431. 2005. View Article : Google Scholar : PubMed/NCBI
|
|
20.
|
Esrig D, Elmajian D, Groshen S, et al:
Accumulation of nuclear p53 and tumor progression in bladder
cancer. N Engl J Med. 331:1259–1264. 1994. View Article : Google Scholar : PubMed/NCBI
|
|
21.
|
Cote RJ, Dunn MD, Chatterjee SJ, et al:
Elevated and absent pRb expression is associated with bladder
cancer progression and has cooperative effects with p53. Cancer
Res. 58:1090–1094. 1998.PubMed/NCBI
|
|
22.
|
Oosterhuis JW, Schapers RF,
Janssen-Heijnen ML, Smeets AW and Pauwels RP: MIB-1 as a
proliferative marker in transitional cell carcinoma of the bladder:
clinical significance and comparison with other prognostic factors.
Cancer. 88:2598–2605. 2000. View Article : Google Scholar : PubMed/NCBI
|
|
23.
|
Stein JP, Ginsberg DA, Grossfeld GD, et
al: Effect of p21WAF1/CIP1 expression on tumor progression in
bladder cancer. J Natl Cancer Inst. 90:1072–1079. 1998. View Article : Google Scholar : PubMed/NCBI
|
|
24.
|
Inoue K, Slaton JW, Karashima T, et al:
The prognostic value of angiogenesis factor expression for
predicting recurrence and metastasis of bladder cancer after
neoadjuvant chemotherapy and radical cystectomy. Clin Cancer Res.
6:4866–4873. 2000.
|
|
25.
|
Rho SB, Woo JS, Chun T and Park SY:
Cysteine-rich 61 (CYR61) inhibits cisplatin-induced apoptosis in
ovarian carcinoma cells. Biotechnol Lett. 31:23–28. 2009.
View Article : Google Scholar : PubMed/NCBI
|
|
26.
|
Gery S, Xie D, Yin D, et al: Ovarian
carcinomas: CCN genes are aberrantly expressed and CCN1 promotes
proliferation of these cells. Clin Cancer Res. 11:7243–7254. 2005.
View Article : Google Scholar : PubMed/NCBI
|
|
27.
|
Dao D, Frank D, Qian N, et al: IMPT1, an
imprinted gene similar to polyspecific transporter and multi-drug
resistance genes. Hum Mol Genet. 7:597–608. 1998. View Article : Google Scholar : PubMed/NCBI
|
|
28.
|
Okabe M, Szakacs G, Reimers MA, et al:
Profiling SLCO and SLC22 genes in the NCI-60 cancer cell line to
identify drug uptake transporters. Mol Cancer Ther. 7:3081–3091.
2008. View Article : Google Scholar : PubMed/NCBI
|
|
29.
|
Lossos IS, Czerwinski DK, Alizadeh AA, et
al: Prediction of survival in diffuse large-B-cell lymphoma based
on the expression of six genes. N Engl J Med. 350:1828–1837. 2004.
View Article : Google Scholar : PubMed/NCBI
|
|
30.
|
Ma XJ, Wang Z, Ryan PD, et al: A two-gene
expression ratio predicts clinical outcome in breast cancer
patients treated with tamoxifen. Cancer Cell. 5:607–616. 2004.
View Article : Google Scholar
|