Introduction
Chemotherapy is the primary treatment for many
different types of cancer, including solid cancers and hematologic
malignancies. Chemotherapeutic agents lead to potentially
life-threatening adverse events, including neutropenia, defined as
a below-normal count of neutrophils, which results in impairment of
the body’s ability to combat infectious pathogens. Severe
neutropenia is accompanied by an opportunistic infection that may
manifest as a fever in hosts that are capable of mounting a febrile
response to infection. In these patients with febrile neutropenia,
fever is the first signal of opportunistic infection. Febrile
neutropenia often leads to hospitalization, the need for
intravenous (i.v.) antibiotics, additional interventional care and
further treatment in the outpatient setting (1,2).
This may result in chemotherapy dose delays or dose reductions, and
interferes with delivery of optimal treatment, adversely affecting
patient outcomes, including survival (3–12).
Costs for chemotherapy treatments are significant
and costs incurred for treating chemotherapy-associated toxicities
contribute to the overall costs of cancer care. In 2007, US cancer
costs were estimated to be $219.2 billion, with 40% ($89 billion)
attributed to direct medical costs and 60% ($130.2 billion)
attributed to indirect costs (13). Neutropenic complications resulting
from chemotherapy contribute significantly to cancer care costs as
part of the treatment for cancer patients. In a study by Caggiano
et al, from 1999 data, the incidence of neutropenia-related
hospitalizations in the US was estimated to be 60,294 per year,
with average costs of $13,400 for neutropenia hospitalizations
across 13 cancer types (14).
Other studies have confirmed that neutropenic complications
contribute significantly to the direct and indirect costs of cancer
care. Kuderer et al (1),
using data from 1995 to 2000, reported average hospitalization
costs for febrile neutropenia of $12,372 for breast cancer
patients, $18,437 for lymphoma patients and $38,583 for leukemia
patients. The most recent data on neutropenia burden of illness are
from Weycker et al who used claims data from 2001–2003
(13). In that study, reported
average initial hospitalization costs due to neutropenic-related
complications (defined as hospitalizations with a primary or
secondary diagnosis of neutropenia, fever or infection) were $7,813
(95% CI 6,537–9,379) and downstream health care costs, including
antibiotic therapy, all hospitalizations and post-discharge
outpatient events were $6,594 (95% CI 5,217–8,272).
There are no recent studies estimating total costs
associated with neutropenic complications in hospitalized cancer
patients. Additionally, no studies to date have assessed the costs
and reimbursement in patients with neutropenic complications to
evaluate if costs are adequately covered by payers. In this
observational, retrospective cohort study, data from a database
that included costs from individual inpatient facilities (the
providers) were used to calculate the hospitalization costs and
outcomes associated with neutropenic complications. The primary
objective was to quantify the average total hospitalization costs
for cancer patients with neutropenic complications. Secondary
objectives were to estimate the average length of hospital stay and
mortality rate during hospitalization, and to assess reimbursement
rates for hospitalization costs in these patients.
Patients and methods
Aspen Healthcare Metrics requests data from multiple
sources throughout Primary Hospitals and Inpatient Facilities. The
collected data are the primary source of information by which Aspen
Healthcare Metrics conducts its consulting business. Once the
collected data are accepted, they are formatted, processed and
stored in a proprietary database known as the Navigator database.
The data are then made available for established reporting and
ad hoc purposes, as well as benchmarking.
Data
The collected data, specifically received from
Materials Management, Decision Support, Finance/Accounting, Case
Management and Pharmacy, among others, is allocated into spend and
patient segments. The spend data primarily consists of closed
receipt files (purchase orders/invoices), while the patient data
primarily consist of demographics (UB-04), diagnosis and procedure
codes, detailed charges and facility-specific charge masters. The
data received undergo multiple levels of quality assurance and
quality control checks, both automated and manual. The check
process may identify data containing irresolvable issues, which
require a resubmission pending resolution of identified issues.
Processing
Spend data processing is facilitated by Analysts
utilizing supply item descriptions and catalog numbers to
categorize spend. The spend data contain purchase order and invoice
data, manufacturer and vendor data, quantity and price data. The
description, manufacturer and vendor data are normalized, allowing
for unique categorization of the items. The associated spend data
may then be aggregated into unique categories, or into super-sets
of more general categories, such as implant, laboratory, ancillary,
pharmacy and medical/ surgical costs. Patient billing identifiers,
physician identifiers and other data may also be associated with
the items, allowing for trend analysis. The preliminary spend data
are summarized and then reviewed by Consultants through a spend
data update process identifying further spend enhancement
opportunities based on their subject matter expertise and market
knowledge. Once the spend data updates are applied, it is finalized
in the Navigator database.
Patient data processing is also facilitated by
Analysts, utilizing a unique patient billing identifier to
associate diagnosis and procedure codes, as well as expected
reimbursement. The procedure codes are then used to associate a
physician and physician group, if applicable. The patient billing
identifier is also associated with charge codes, including service
date, units and total charges. The charge codes, which uniquely
identify utilized items, are then associated with revenue codes
(UB-92) and Current Procedural Terminology, Fourth Edition (CPT-4)/
Healthcare Common Procedure Coding System (HCPCS) codes in a
facility-specific charge master. The charge master contains
facility-specific charges, total, variable and fixed costs for one
unit of each item, allowing for utilization analysis. In the event
that the facility does not store cost information in the charge
master, total costs are allocated at the item level using a ratio
of cost to charge based on the facility’s Medicare Cost Report
Worksheet C, Part I. The total cost is then broken down between
variable (directly related to patient care) and fixed (relatively
static overhead) costs based upon Aspen Healthcare Metric’s
experience. The preliminary patient data are then blended with the
finalized spend data, merging price and cost, and reviewed by
Consultants through a patient data update process, again
identifying further cost enhancements based on their subject matter
expertise and market knowledge. Once the patient data updates are
applied, it is finalized in the Navigator database.
Database
The Navigator database contains information from
more than 342 clinical providers across various geographic regions
of the US, and has over 300 million items of hospital utilization
data from approximately 11 million patients. Specific data
available in the database include patient demographics, costs
related to inpatient, outpatient, ambulatory surgery and
pharmaceuticals, and all-payer data, including Medicare Severity
Diagnosis Related Groups (MS-DRG) as well as International
Classification of Diseases, Ninth Revision, Clinical Modification
(ICD-9-CM) diagnosis and procedure codes.
For purposes of this study, data included in the
Navigator database were de-identified to preserve patient anonymity
and confidentiality, to comply with the Health Insurance
Portability and Accountability Act of 1996 (15) and Federal Guidelines on Public
Welfare and the Protection of Human Subjects (16). Additionally, data drawn from the
Navigator database have been previously scrutinized for accuracy
during presentation to Aspen Healthcare Metric’s customers, and are
believed to be accurate in quantifying cost and outcomes. The data
used in this study were therefore considered valid for use in
estimating hospitalization costs.
Patients
The study population included inpatients ≥18 years
of age who had at least 1 ICD-9-CM diagnosis code for malignant
neoplasm and a diagnosis code for neutropenia, or neutropenia with
infection or fever, and whose records were captured in the
Navigator database (Table I). The
study was limited to patients discharged between January 2005 and
June 2008. Since no single ICD-9-CM code for cancer-related
neutropenic complications exists, a combination of ICD-9-CM
diagnoses codes was used to identify cancer patients with i)
neutropenia, ii) neutropenia plus infection or fever, iii)
neutropenia without infection or fever and iv) neutropenia plus
infection (summarized in Table I).
This method has been used in other studies (13,17).
Patients were excluded if they were still hospitalized or were
expected to return as an outpatient, had undergone a bone marrow or
stem cell transplant, or had a diagnosis code for HIV (Table I). No institutional review board
approvals were required, since this was an observational,
retrospective cohort study.
 | Table I.Inclusion/exclusion criteria used to
identify hospitalized cancer patients with neutropenic
complications. |
Table I.
Inclusion/exclusion criteria used to
identify hospitalized cancer patients with neutropenic
complications.
Inclusion criteria:
-
Inpatients discharged between January 2005 and June
2008.
-
Were 18 years of age or older.
-
Had at least one diagnosis code (primary or
secondary) for malignant neoplasm (ICD-9-CM code 140.xx-208.xx) and
neutropenia (ICD-9-CM code 288.0).
-
Four groups of patients with neutropenic
complications were identified as follows:
-
Neutropenia: ICD-9-CM code 288.0.
-
Neutropenia plus infection or fever: ICD-9-CM code
288.0 and ICD-9-CM codes for opportunistic infection or ICD-9-CM
code 288.0 and ICD-9-CM code for fever of unknown origin
(780.6).
-
Neutropenia without infection or fever: ICD-9-CM
code 288.0 and no ICD-9-CM codes for opportunistic infection or
ICD-9-CM code 288.0 and no ICD-9-CM code for fever of unknown
origin (780.6).
-
Neutropenia plus infection: ICD-9-CM code 288.0 and
ICD-9-CM codes for opportunistic infection.
|
Exclusion criteria:
-
Had a UB-92 discharge status of 30 (still inpatient
or expected to return as an outpatient) or 99 (unknown).
-
Had undergone a bone marrow or stem cell transplant
(ICD-9-CM codes 41.00-41.09, V42.81 and V42.82 or CPT codes
38204-38242).
-
Had a diagnosis of HIV (ICD-9-CM code 042 or
V08).
|
Study measures
In this study, the economic impact of
hospitalizations for neutropenic complications was determined by
calculating average total inpatient hospital costs per admission
from clinical and billing records. Information on the utilization
of health care resources and actual costs (not charges) were
used.
Utilization of inpatient hospital resources was
categorized according to the following groups: critical care,
routine care, diagnostics, EKG/ECG, laboratory and blood tests,
medical, surgical and sterile supplies, occupational therapy, and
pharmacy and intravenous supplies. Costs were derived from the
actual invoiced costs of the items to the inpatient facility.
Inputs included unit variable costs, unit fixed costs, unit total
costs (e.g., pharmaceutical product costs were provided from
pharmaceutical distributor reports that detail exact price paid),
room and services, and other department costs. Physician fees were
not captured in the database.
Patient demographics and other treatment-related
variables collected include gender, age, length of stay (defined by
date of admission and date of discharge), admission source and
discharge status. Co-morbid health conditions, identified using
ICD-9-CM codes, were also collected.
Endpoints
The primary endpoint was average hospitalization
costs per admission. Secondary endpoints included length of
hospital stay, number of deaths by any cause during hospitalization
and hospitalization costs by cancer type. Also, average payer
reimbursement was calculated from all-payer data obtained from the
cost accounting systems of the facilities represented by these
patients and the percentage of inpatient hospitalization costs vs.
the reimbursement was determined.
Statistical analysis
No formal hypothesis was tested, since the primary
objective of the study was to estimate total costs. Descriptive
statistics, including both average hospital admission costs and
average reimbursement, were calculated. The analyses for this study
were performed using T-SQL commands within a 2002 SQL Server
database. Microsoft Excel 2007 was used to calculate confidence
intervals (CIs). The average hospitalization costs per admission
across sites with corresponding 95% CIs are presented. Mean
hospital costs per admission were adjusted to 2009 costs by
applying a 3% annual inflation rate, based on consensus guidelines
for conducting cost-effectiveness analyses published by the Panel
on Cost-effectiveness in Health and Medicine (18). Admission and discharge dates were
collected and used to calculate average length of hospital stay and
corresponding 95% CIs. Mortality, defined as the number of patient
deaths from all causes during the hospitalization for neutropenic
complications, was determined. For the primary analysis, as per
pre-defined exclusion criteria, patients who died within 1 day of
admission were excluded from the hospitalization costs, length of
hospital stay and reimbursement calculations because their data
would not accurately reflect the cost of caring for patients with
this disease state. Subgroup analyses on average total
hospitalization costs, length of hospital stay and all-cause
mortality stratified by cancer type, including hematologic
malignancies [excluding non-Hodgkin’s lymphoma (NHL)], lung or
bronchial or breast cancer, were also performed. In addition,
average reimbursement was calculated from all-payer data contained
in the database and the proportion of reimbursed hospitalization
costs was determined.
Sensitivity analyses were conducted on overall cost,
length of stay and reimbursement calculations, excluding patients
with hematologic malignancies (excluding NHL), since neutropenia
could be disease related and not causally related to chemotherapy.
An additional sensitivity analysis was conducted, including
patients who died within 1 day of hospital admission.
Results
Patients
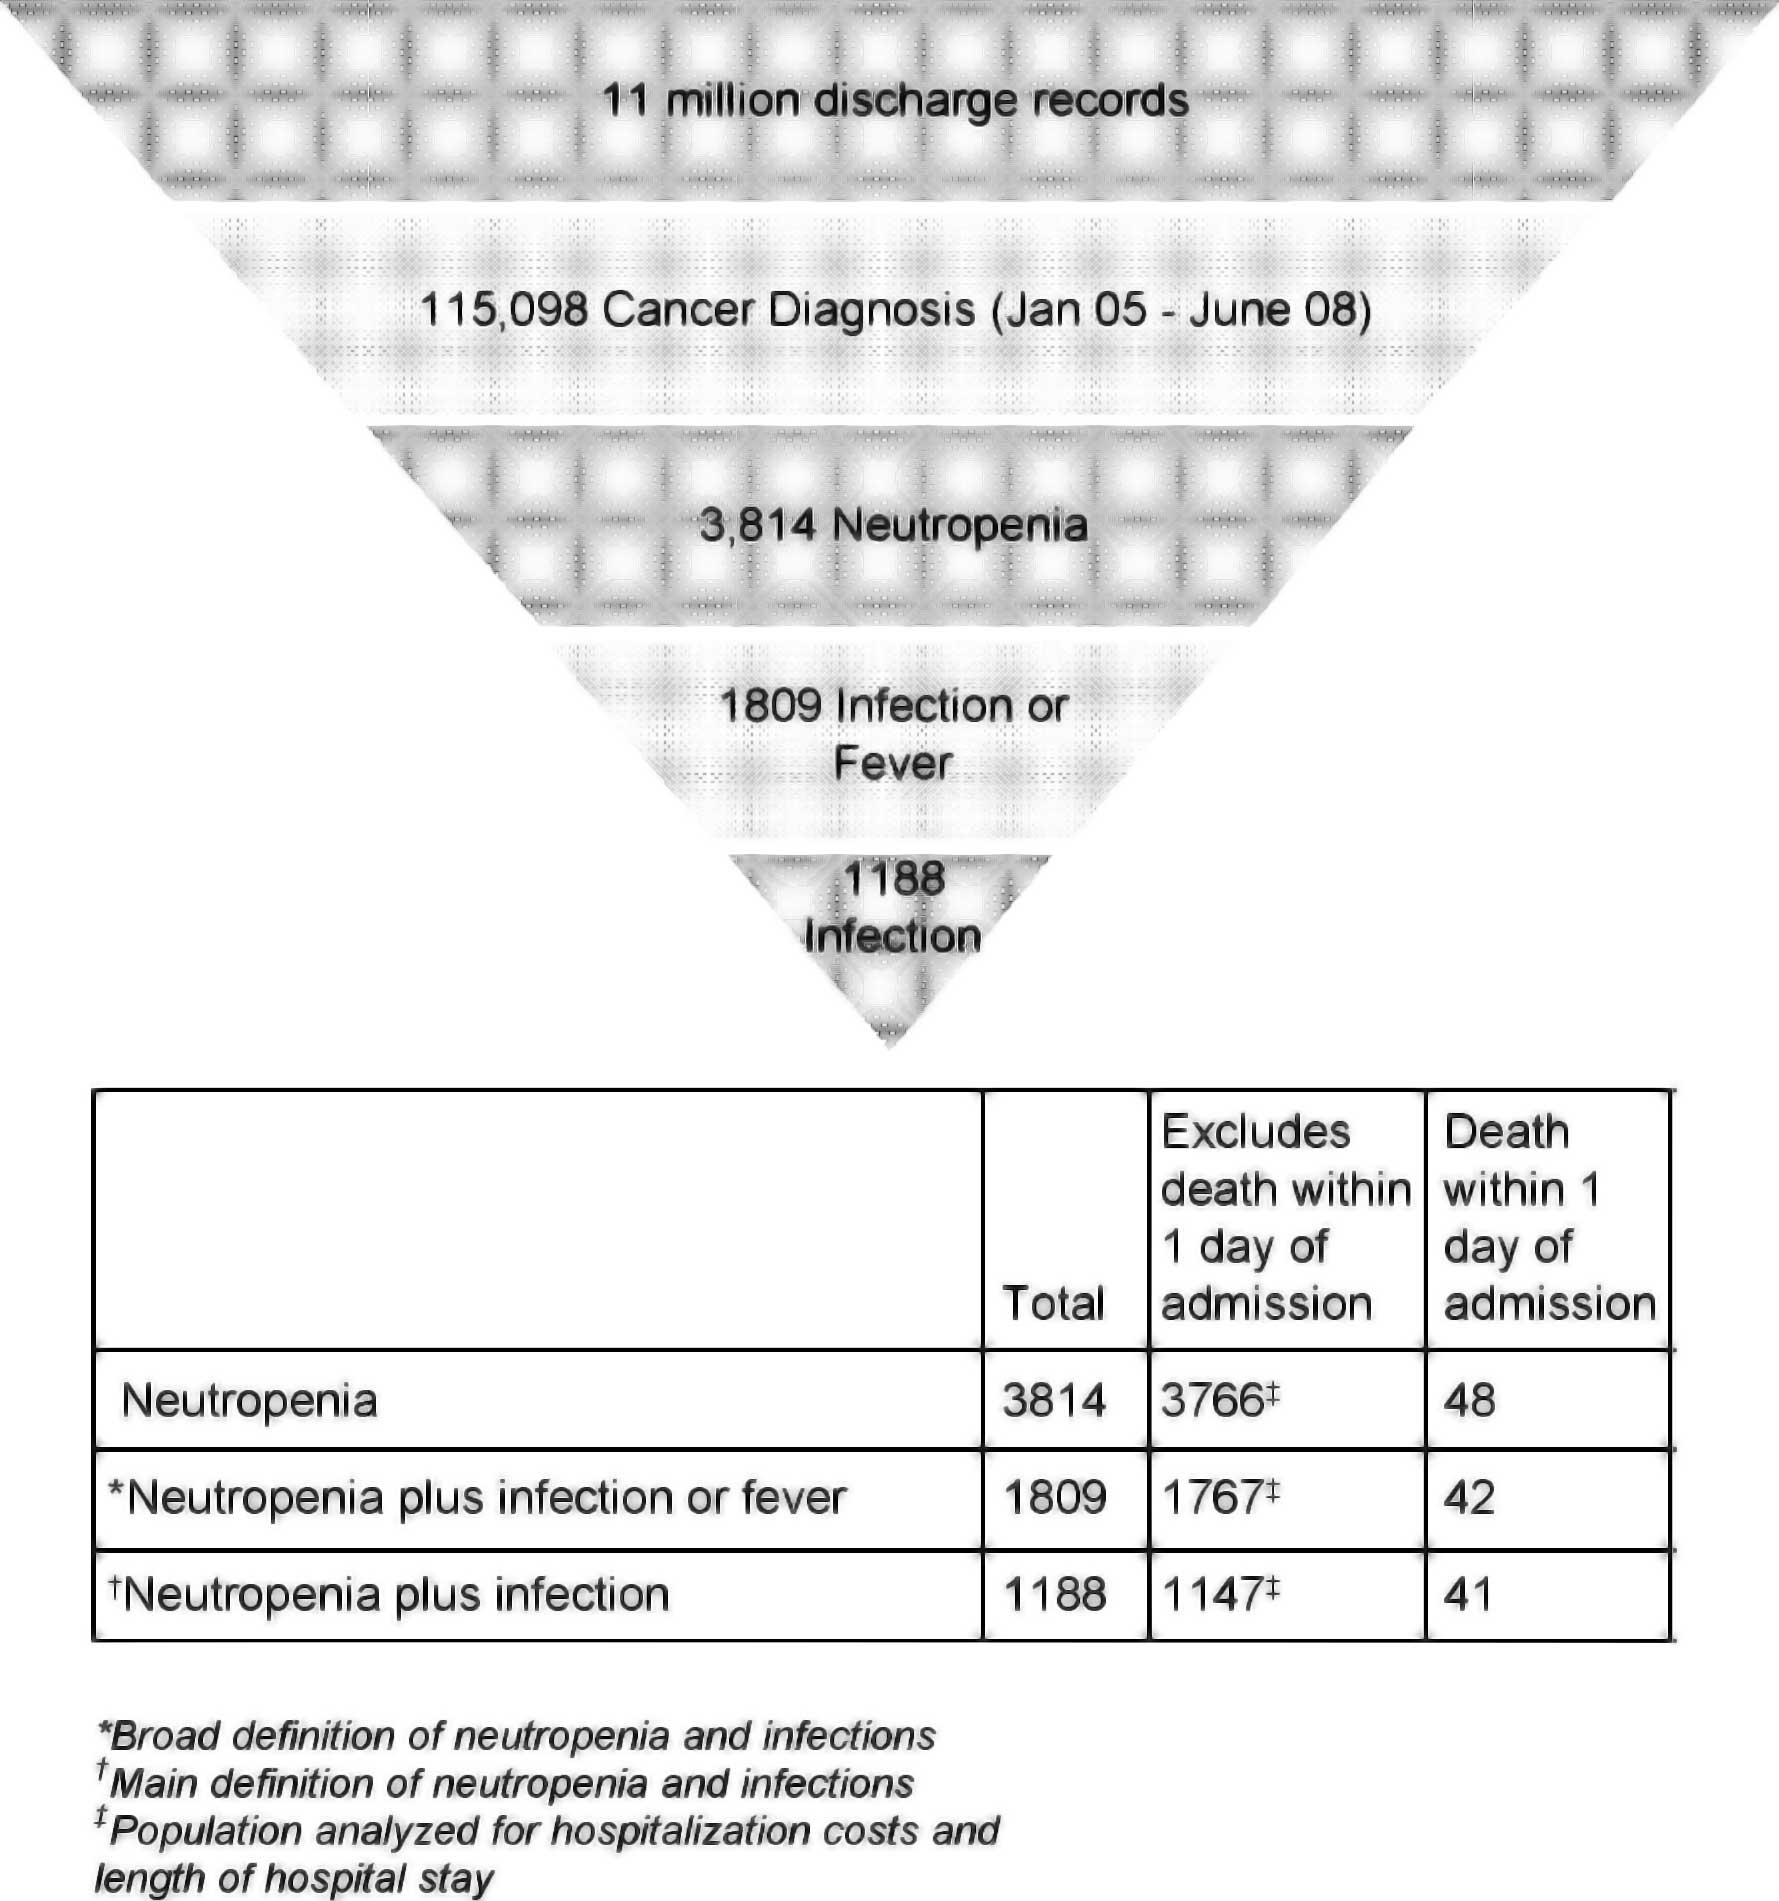
The Navigator database contained over 11 million
admission records for patients who were discharged during the
period of January 2005 to June 2008 (Fig. 1). The number of cancer patients
hospitalized with a primary or secondary diagnosis of neutropenia
identified from these records was 3,814. Of the patients with
cancer and neutropenia, a subset of 1,809 had neutropenia plus
infection or fever, and an additional subset of 1,188 had
neutropenia plus infection (Fig.
1).
Demographic data are presented for the 1,188
hospitalized cancer patients with neutropenia plus infection
(Table II). The patient population
was 53.6% male and 53% were ≥65 years of age. The most common
primary cancer types identified in this population were NHL
(15.4%), other hematologic (11.4%), lung or bronchial (8.3%),
metastatic breast (3.4%) and primary breast (3.1%) cancer. The most
common co-morbid conditions were electrolyte imbalance (45.4%),
acute pulmonary disease (44.0%), heart disease (40.5%), anemia
(37.4%), hypertensive disease (34.6%), cardiac dysrhythmias (22.3%)
and chronic pulmonary disease (19.0%).
| Table II.Patient demographic and clinical
characteristics. |
Table II.
Patient demographic and clinical
characteristics.
| Patients with
neutropenia plus infectiona,b (n=1,188) |
|---|
| Female, n (%) | 551 (46.4) |
| Age (years), median
(range) | 65 (18–100) |
| <65 years, n
(%) | 558 (47.0) |
| Cancer type, n
(%) | |
| NHL | 183 (15.4) |
| Lung and
bronchial | 99 (8.3) |
| Metastatic
breast | 40 (3.4) |
| Primary breast | 37 (3.1) |
| Other hematologic
cancersc | 135 (11.4) |
| History of
co-morbidity, n (%) | 1,111 (93.5) |
| Electrolyte
imbalance | 539 (45.4) |
| Acute pulmonary
disease | 523 (44.0) |
| Heart disease | 481 (40.5) |
| Anemia | 444 (37.4) |
| Hypertensive
disease | 411 (34.6) |
| Cardiac
dysrhythmias | 265 (22.3) |
| Chronic pulmonary
disease | 226 (19.0) |
| Diabetes | 207 (17.4) |
| Acute or chronic
renal failure | 192 (16.2) |
| Other chronic
ischemic heart disease | 160 (13.5) |
| Congestive heart
failure | 135 (11.4) |
| Cerebrovascular
disease | 30 (2.5) |
| Acute myocardial
infarction (initial episode) | 15 (1.3) |
Overall costs and outcomes associated
with hospitalized cancer patients with neutropenic
complications
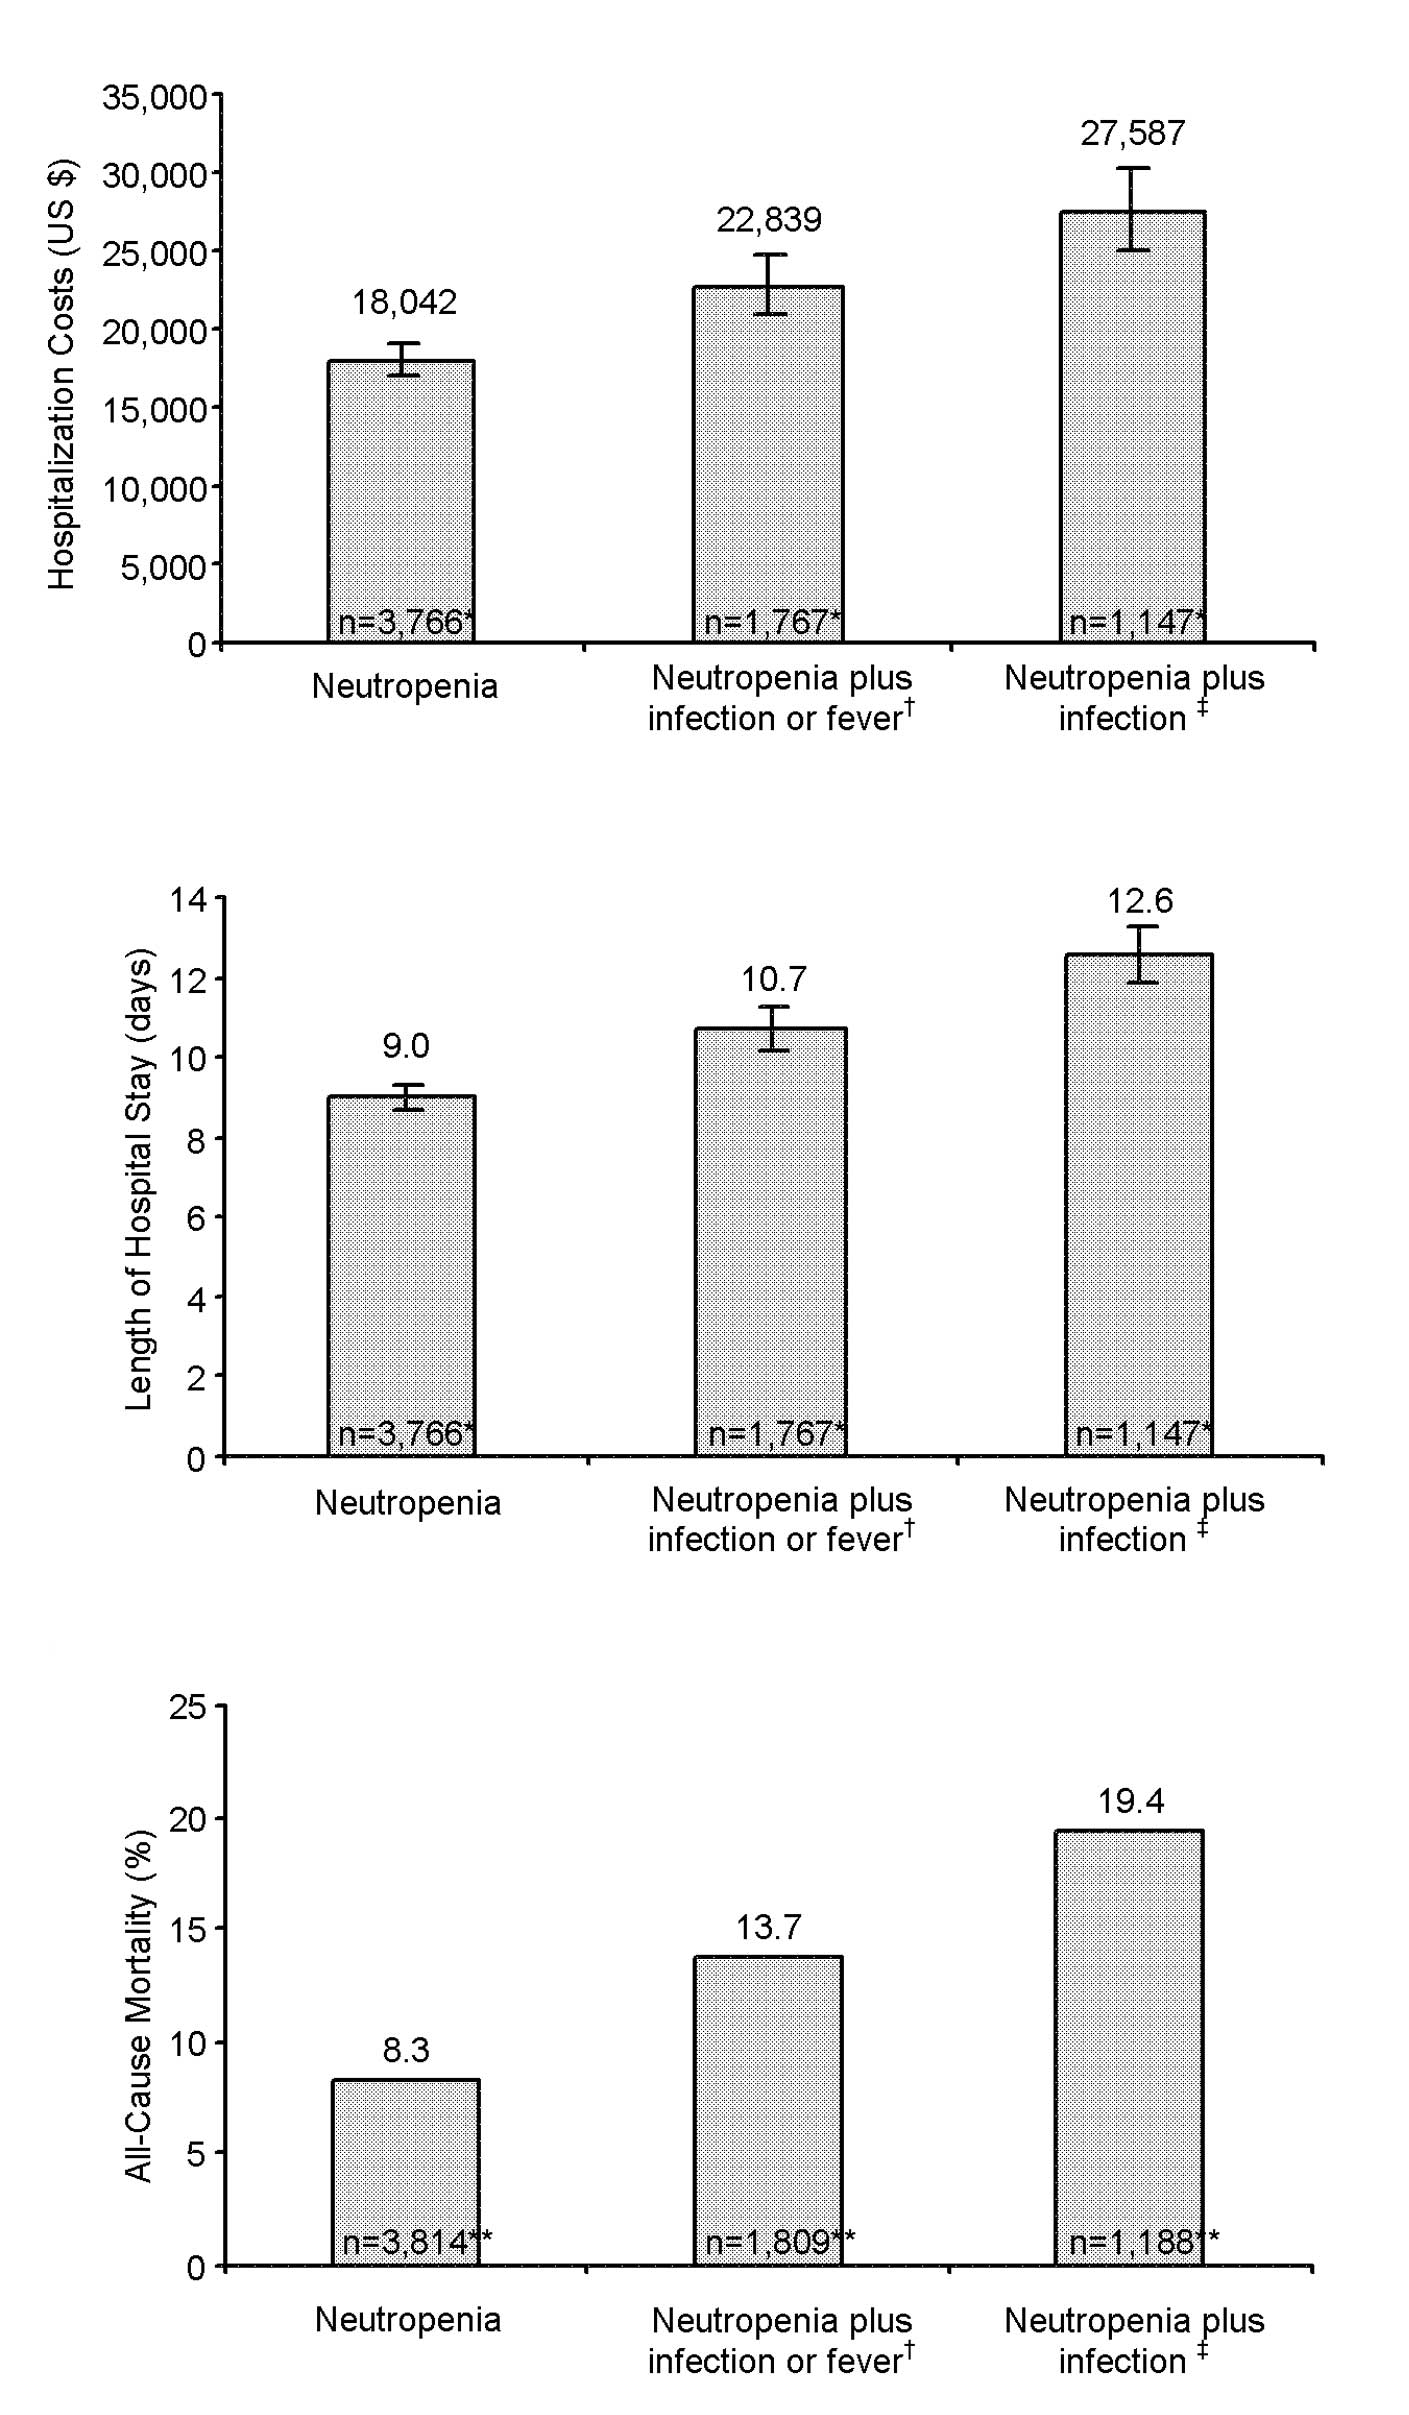
Mean hospitalization costs were $18,042 (95% CI
6.997–19,087) for cancer patients with neutropenia, $22,839 (95% CI
21,006–24,672) for cancer patients with neutropenia plus infection
or fever, and $27,587 (95% CI 24,927–30,247) for cancer patients
with neutropenia plus infection (Fig.
2A). The average length of hospital stay followed a directional
pattern consistent with that for the hospitalization costs; 9.0
(95% CI 8.7–9.3), 10.7 (95% CI 10.2–11.2) and 12.6 (95% CI
11.9–13.3) days, respectively (Fig.
2B). Frequency of death from any cause during hospitalization
also followed a similar trend; 8.3, 13.7 and 19.4%, respectively
(Fig. 2C).
Costs and outcomes by cancer type
associated with hospitalized cancer patients with neutropenic
complications
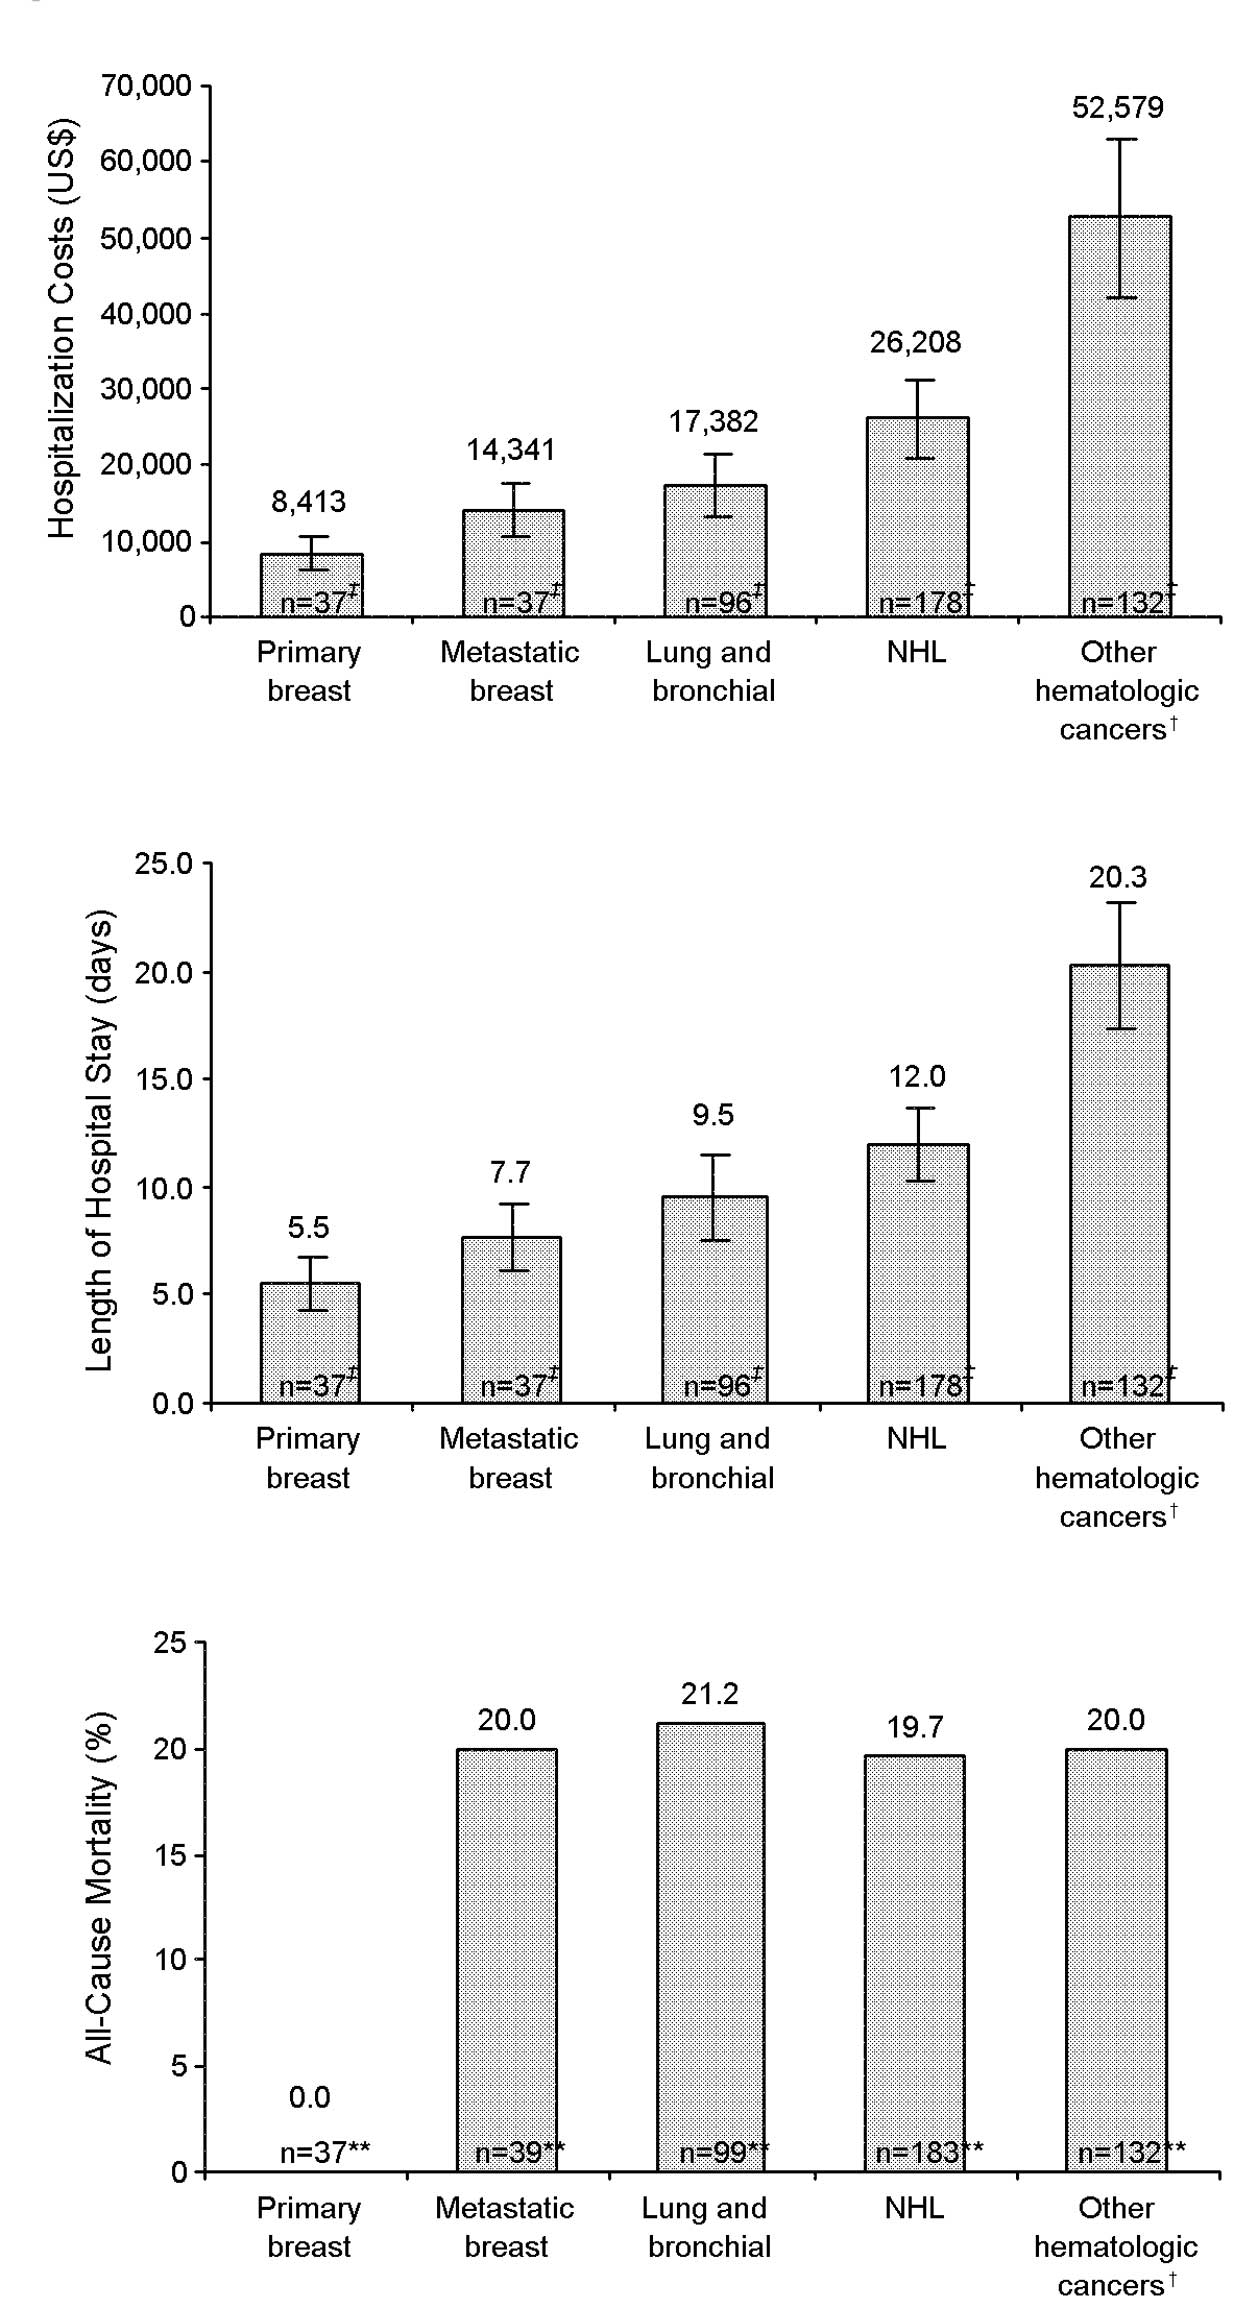
In cancer patients hospitalized with neutropenia
plus infection (n=1,147), the most common primary cancer types were
NHL (20.8%, 178 patients), other hematologic malignancies (15.5%,
132 patients), lung or bronchial (8.4%, 96 patients), metastatic
breast (3.2%, 37 patients) and primary breast (3.2%, 37 patients)
cancer. Mean length of hospital stay was 12.0 (95% CI 10.3–13.7),
20.3 (95% CI 17.4–23.2), 9.5 (95% CI 7.5–11.5), 7.7 (95% CI
6.2–9.2) and 5.5 (95% CI 4.2–6.8) days, respectively (Fig. 3B). All-cause mortality during
hospitalization (n=1,188) was 20.0% for other hematologic
malignancies, 19.7% for NHL, 21.2% for lung or bronchial cancer and
20.0% for metastatic breast cancer (Fig. 3C). No patients with primary breast
cancer died during hospitalization (Fig. 3C).
In a subgroup analysis by cancer type (Fig. 3A), other hematologic malignancies
had the highest average inpatient financial costs of $52,579 (95%
CI 42,183–62,975) followed by NHL ($26,208, 95% CI 21,202–31,214),
lung or bronchial cancer ($17,382, 95% CI 13,178–21,586),
metastatic breast cancer ($14,341, 95% CI 10,830–17,852) and
primary breast cancer ($8,413, 95% CI 6,103–10,723). Patients with
other cancers (n=507) were excluded from this subgroup analysis
because the number of patients per specific cancer were low and
treatments were too variable to generalize costs in a relevant
manner.
Reimbursement of costs associated with
hospitalized cancer patients with neutropenic complications
Analysis of average inpatient hospitalization costs
and average reimbursed costs for cancer patients hospitalized with
neutropenic complications shows that hospitalization costs were
principally reimbursed by payers (Table III). Mean reimbursement rates of
inpatient hospitalization costs for cancer patients with
neutropenia were 100%, and 101.5% for patients with neutropenia
plus infection or fever, with an average difference between average
hospitalization costs and average reimbursements of $11 (95% CI
−1,051 to 1,073) and $353 (95% CI −1,632 to 2,338), respectively.
Inpatient hospitalization costs in cancer patients with neutropenia
plus infection were reimbursed at an average of 95.4%, with an
average difference of $1,266 (95% CI −1,578 to 4,110).
| Table III.Costs and reimbursement associated
with hospitalized cancer patients with neutropenic
complications. |
Table III.
Costs and reimbursement associated
with hospitalized cancer patients with neutropenic
complications.
|
Neutropeniaa,b (n=3,766) | Neutropenia plus
infection or fevera,c
(n=1,767) | Neutropenia without
infection or fevera,c
(n=1,999) | Neutropenia plus
infectiona,d (n=1,147) |
|---|
| Hospitalization
costs, mean (95% CI) US$ | 18,042
(16,997–19,087) | 22,839
(21,006–24,672) | 13,801
(12,716–14,887) | 27,587
(24,927–30,247) |
| Hospital
reimbursements, mean (95% CI) US$ | 18,052
(16,769–19,335) | 23,191
(20,936–25,446) | 13,367
(12,067–14,667 | 26,321
(23,165–29,478) |
| Difference (loss)
(95% CI), US$ | 11 (−1,051 to
1,073) | 353 (−1,632 to
2,338) | 435 (−1,356 to
487) | 1,266 (−4,110 to
1,578) |
| Proportion of
hospitalization costs reimbursed (%) | 100.1 | 101.5 | 96.9 | 95.4 |
Sensitivity analyses
Since neutropenia could be disease-related and not
causally related to chemotherapy treatment, sensitivity analyses
that excluded patients with other hematologic malignancies (but
included NHL) showed slightly reduced overall costs ($14,891,
$18,653 and $22,981) and length of stay (7.9, 9.2 and 10.9 days),
and similar mortality (8.0, 13.6 and 19.9%) for cancer patients
with neutropenia, neutropenia plus infection or fever, and
neutropenia plus infection, respectively. In addition, patients who
died within 1 day of admission were excluded from the
hospitalization costs, length of hospital stay and reimbursement
calculations because their data would not accurately reflect the
cost of caring for patients with this disease state. Including
these patients into these analyses (data not shown), did not
significantly alter the results. Further investigation of these
costs indicated that costs were primarily related to morgue and
other non-disease related costs, some of them significant (e.g.,
cause of death investigation).
Discussion
Results from this retrospective observational study
show high average inpatient hospitalization costs for cancer
patients with neutropenia ($18,042), neutropenia plus infection or
fever ($22,839), and neutropenia plus infection ($27,587) (Fig. 2A). These average hospitalization
costs are higher than those previously reported (1,13,14).
A study by Caggiano et al, using 1999 data from a
longitudinal hospital discharge database that contained data from
across seven US states, reported average neutropenia
hospitalization costs (SD) of $13,400 ($21,000) across 13 cancer
types (14). A study by Kuderer
et al, using a longitudinal hospital discharge database with
data from 115 US academic medical centers collected over 6 years
(1995 to 2000), reported average febrile neutropenia
hospitalization costs of $19,110 (1). A recent study by Weycker et
al, using 2001 to 2003 data, reported average
neutropenia-related hospitalization costs of $7,813 (95% CI
6,537–9,379) (13). However, when
downstream health care costs, including antibiotic therapy,
hospitalizations and post-discharge outpatient events were
considered, additional costs of $6,594 (95% CI 5,217–8,272) were
observed (13). The authors of
that study concluded that prior research focusing on initial
hospitalizations only may have underestimated the total costs of
neutropenia complications by as much as 40% (13). Reasons behind the higher
hospitalization costs in our study compared to previous studies may
include inflationary price increases, changes in technology,
differences in sampled populations, databases used and treatments
provided to patients.
When analyzed by cancer type, hematologic
malignancies (excluding NHL) had the highest average inpatient
financial costs of $52,579, followed by NHL ($26,208), lung or
bronchial cancer ($17,382), metastatic breast cancer ($14,341) and
primary breast cancer ($8,413) (Fig.
3A). Earlier studies reported a similar pattern (1,14).
Caggiano et al (14)
reported higher average neutropenia-related hospitalization costs
for patients with NHL ($11,600) or leukemia ($28,200) than for
those with breast cancer ($7,100). Kuderer et al reported
average febrile neutropenia-related hospitalization costs of
$18,437 for patients with lymphoma, $38,583 for patients with
leukemia and $12,372 for patients with breast cancer (1). Findings for length of hospital stay
appear to support this pattern [Fig.
3B in our study and (14)],
with longer hospital stays for patients with hematologic
malignancies than for patients with other cancer types.
The administrative database utilized in our study
identifies specific utilization of health care resources down to
the item level and associated costs obtained from the supply costs
files linked to billing claims and reimbursement. Thus, the
database has an advantage of providing information comparing
hospitalization costs vs. reimbursed charges. Even though inpatient
hospitalization costs for cancer patients with neutropenic
infections were principally reimbursed, our data suggest that these
costs per tumor may vary. When hemato-logic malignancies (excluding
NHL) are excluded from the overall reimbursement analysis, average
reimbursement rates of inpatient hospitalization costs were 88% for
patients with neutropenia, 89% for patients with neutropenia plus
infection or fever, and 84% for patients with neutropenia plus
infection. These reimbursement rates are lower than those seen when
hematologic malignancies (excluding NHL) are included in the
overall analysis (Table III).
The findings from our study suggest that inpatient
facilities and payers carry the financial costs of managing
hospitalizations for cancer patients with neutropenic
complications. Facilities and payers should consider margin
management through clinical alterations aimed at decreasing costs
while maintaining quality of care. Furthermore, improvements in
future treatment of cancer patients with neutropenic complications
may reduce mortality and morbidity, but likely at a higher cost to
payers and providers. In general, hospitals break even or lose
small percentages of revenue. Mostly, payers cover hospitalization
costs for the care of cancer patients with neutropenia and
infections, and therefore have the greatest stake in understanding
costs.
In an era with tight constraints on payer budgets
and particularly government agencies, efforts should be made to
find the most cost-effective disease prevention and treatment
programs. Decisions by many government payers already dictate
treatment and reimbursement in high-cost disease settings (19). Private payers continually monitor
these decisions by government payers and often adopt them. In fact,
several conditions that are not completely preventable and occur
even during high-quality medical care are no longer reimbursed by
the Center for Medicare and Medicaid Services (19) (i.e., surgical site infections
following certain elective procedures, certain manifestations of
poorly controlled blood sugar levels, deep vein thrombosis or
pulmonary embolism following total knee and hip replacement
procedures and stage III and IV decubitus ulcers). A number of
public and private sector payers have also decided not to reimburse
hospitals for health care that follows from these events (19). If neutropenic complications were to
be considered preventable illnesses, given the financial
constraints of the current environment, there is a possibility that
reimbursement for these conditions could become restricted.
Hospitals would have no way of obtaining reimbursement for
conditions arising as a result of care provided by unaffiliated
facilities and physicians. Understanding the financial costs of
managing hospitalizations for cancer patients with neutropenic
complications would be an important issue with potentially
significant fiscal implications under this framework.
Effective methods for preventing neutropenic
complications include the use of primary prophylaxis with growth
factors during chemotherapy; however, the costs for prevention are
also high (8,20–24).
Costs and outcomes data could be used to compare the overall costs
and benefits of prophylactic use of growth factors vs. reactive
treatment in hospital facilities. Results from this study, along
with other decision-making tools, may help inform decision-makers
regarding the most cost-effective ways for managing cancer patients
who are at risk for acquiring neutropenic complications.
Limitations
There are limitations associated with observational
and retrospective studies of hospital costs using data from an
administrative database, including errors in coding. The foremost
limitation of the present study is the inability to link any of
these costs (including infections), specifically to neutropenic
complications or the chemotherapy that may have contributed to the
neutropenic complication. Since no ICD-9-CM code exists for the
clinical manifestation of neutropenic complications, this study
used a combination of codes for neutropenia, fever and infections.
With this non-clinically specific method, a possibility exists that
coding of neutropenia-related events may not be reliably or
uniformly documented across practices. However, similar issues and
resolution methods have been used in other claims-based studies
(13,17).
The analysis of health care costs in this study is
exploratory and descriptive in nature. Patient clinical and
treatment covariates, including pre-existing conditions, patient
histories, chemotherapy treatment regimens, diagnostic test results
and cause of death, were not available. This potentially leads to
incomplete or biased assessment of costs. In addition, this also
limits testing of associations of neutropenic complications with
several factors of interest, including chemotherapy administration
(chemotherapy-induced neutropenia), chemotherapy regimen cycle and
cause of death during hospitalization.
Since the Aspen Healthcare Metrics Navigator
database only captures institution-specific costs, physician fees
were not captured and as a result, total costs of care are
therefore underestimated. Finally, the study results are only
generalizable to patients at inpatient facilities (Aspen Healthcare
Metrics clients) of particular geographic regions and may not be
generalizable to patients in other settings.
In conclusion, cancer patients with neutropenic
complications are associated with high inpatient hospitalization
costs that exceed those previously published. All-cause mortality
during hospitalization is also high. Results from this study
suggest that costs for inpatient hospitalized cancer patients with
neutropenic complications are principally reimbursed by payers.
Acknowledgements
Funding for this study was provided by
the Amgen Inc. The assistance of Martha Mutomba, PhD, of Amgen
Inc., and Julie Gage of Gage Medical Writing with preparation of
the manuscript is acknowledged.
References
|
1.
|
Kuderer NM, Dale DC, Crawford J, et al:
Mortality, morbidity, and cost associated with febrile neutropenia
in adult cancer patients. Cancer. 106:2258–2266. 2006. View Article : Google Scholar : PubMed/NCBI
|
|
2.
|
Link BK, Budd GT, Scott S, et al:
Delivering adjuvant chemotherapy to women with early-stage breast
carcinoma: current patterns of care. Cancer. 92:1354–1367. 2001.
View Article : Google Scholar : PubMed/NCBI
|
|
3.
|
Adida C, Haioun C, Gaulard P, et al:
Prognostic significance of surviving expression in diffuse large
B-cell lymphomas. Blood. 96:1921–1925. 2000.
|
|
4.
|
Lyman GH, Dale DC and Crawford J:
Incidence and predictors of low dose-intensity in adjuvant breast
cancer chemotherapy: a nationwide study of community practices. J
Clin Oncol. 21:4524–4531. 2003. View Article : Google Scholar : PubMed/NCBI
|
|
5.
|
Hryniuk WM: Average relative dose
intensity and the impact on design of clinical trials. Semin Oncol.
14:65–74. 1987.PubMed/NCBI
|
|
6.
|
Klastersky J, Paesmans M, Rubenstein EB,
et al: The Multinational Association for Supportive Care in Cancer
risk index: a multinational scoring system for identifying low-risk
febrile neutropenic cancer patients. J Clin Oncol. 18:3038–3045.
2000.PubMed/NCBI
|
|
7.
|
Talcott JA, Siegel RD, Finberg R and
Goldman L: Risk assessment in cancer patients with fever and
neutropenia: a prospective, two-center validation of a prediction
rule. J Clin Oncol. 110:316–322. 1992.PubMed/NCBI
|
|
8.
|
Smith TJ, Khatcheressian J, Lyman GH, et
al: 2006 update of recommendations for the use of white blood cell
growth factors: an evidence-based clinical practice guideline. J
Clin Oncol. 24:3187–3205. 2006. View Article : Google Scholar : PubMed/NCBI
|
|
9.
|
Bonadonna G, Moliterni A, Zambetti M, et
al: 30 years’ follow up of randomized studies of adjuvant CMF in
operable breast cancer: cohort study. BMJ. 330:2172005.
|
|
10.
|
Epelbaum R, Faraggi D, Ben-Arie Y, et al:
Survival of diffuse large cell lymphoma. A multivariate analysis
including dose intensity variables. Cancer. 66:1124–1129. 1990.
View Article : Google Scholar : PubMed/NCBI
|
|
11.
|
Kwak LW, Halpern J, Olshen RA and Horning
SJ: Prognostic significance of actual dose intensity in diffuse
large-cell lymphoma: results of a tree-structured survival
analysis. J Clin Oncol. 8:963–977. 1990.PubMed/NCBI
|
|
12.
|
Lepage E, Gisselbrecht C, Haioun C, et al:
Prognostic significance of received relative dose intensity in
non-Hodgkin’s lymphoma patients: application to LNH-87 protocol.
The GELA (Groupe d’Etude des Lymphomes de l’Adulte). Ann Oncol.
4:651–656. 1993.PubMed/NCBI
|
|
13.
|
Weycker D, Malin J, Edelsberg J, Glass A,
Gokhale M and Oster G: Cost of neutropenic complications of
chemotherapy. Ann Oncol. 19:454–460. 2008. View Article : Google Scholar : PubMed/NCBI
|
|
14.
|
Caggiano V, Weiss RV, Rickert TS and
Linde-Zwirble WT: Incidence, cost, and mortality of neutropenia
hospitalization associated with chemotherapy. Cancer.
103:1916–1924. 2005. View Article : Google Scholar : PubMed/NCBI
|
|
15.
|
Health Insurance Portability and
Accountability Act of 1996, 42 USC. pp. 1320–1322. 1996
|
|
16.
|
US Dept of Health and Human Services:
Public Welfare-Protection of Human Subjects, 45 CFR 46. https://www.hhs.gov/ohrp/humansubjects/guidance/45cfr46.htm.
Accessed Aug 12, 2009.
|
|
17.
|
Weycker D, Malin J, Kim J, et al: Risk of
hospitalization for neutropenic complications of chemotherapy in
patients with primary solid tumors receiving pegfilgrastim or
filgrastim prophylaxis: a retrospective cohort study. Clin Ther.
31:1069–1081. 2009. View Article : Google Scholar
|
|
18.
|
Gold M, Siegel JE, Russell LB and
Weinstein MC: Cost-Effectiveness in Health and Medicine. Oxford
University Press; New York: pp. 91–92. 1996
|
|
19.
|
Center for Medicare and Medicaid Services:
Eliminating serious, preventable, and costly medical errors-never
events, CMS Fact Sheet, May, 18, 2006. https://www.cms.hhs.gov/apps/media/press/factsheet.asp?Counter=1863&intNumPerPage=10&checkDate=&checkKey=&srchType=1&numDays=3500&srchOpt=0&srchData=&keywordType=All&chkNewsType=6&intPage=&showAll=&pYear=&year=&desc=false&cboOrder=datehttps://www.cms.hhs.gov/apps/media/press/factsheet.asp?Counter=1863&intNumPerPage=10&checkDate=&checkKey=&srchType=1&numDays=3500&srchOpt=0&srchData=&keywordType=All&chkNewsType=6&intPage=&showAll=&pYear=&year=&desc=false&cboOrder=date.
Accessed Oct 5, 2009.
|
|
20.
|
National Comprehensive Cancer Network
clinical practice guidelines in oncology: Myeloid growth factors in
cancer treatment, version 2.2005[online]. www.nccn.org/professionals/physician_gls/PDF/myeloid_growth.pdf.2005.
Accessed Mar 12, 2009.
|
|
21.
|
Glaspy J, Hackett J, Flyer P, et al:
Febrile neutropenia is associated with an increase in the
incidence, duration, and severity of chemotherapy toxicities.
Blood. 98:432b2001.
|
|
22.
|
Brown RE, Hutton J and Burrell A: Cost
effectiveness of treatment options in advanced breast cancer in the
UK. Pharmacoeconomics. 19:1091–1102. 2001. View Article : Google Scholar : PubMed/NCBI
|
|
23.
|
Fortner BV, Stolshek B, Tauer KW, et al:
Final analysis: chemotherapy-induced neutropenia (CIN) is
associated with lower quality of life (QoL) in patients (pts) with
cancer. Ann Oncol. 13(Suppl 15): 1742002.
|
|
24.
|
Okon TA, Fortner BV, Schwartzberg L, et
al: Quality of life (QOL) in patients with grade IV
chemotherapy-induced neutropenia (CIN). Proc Am Soc Clin Oncol.
21:275b2002.
|