Introduction
Normal physiological function and a variety of
pathological changes to human brain tissue are closely associated
with changes in cerebral blood flow (CBF); therefore, access to
hemodynamic information on human tissues has attracted the
attention of imaging researchers (1–5). The
theoretical basis is derived from the use of data-processing
technology to generate cerebral perfusion images with
radionuclides. Radioactive tracers are administered as a bolus
injection into a vein, from where they enter the left heart and
travel to the back of the head. A time-density curve (TDC) is
obtained by dynamic scanning when the tracer passes through the
organ for the first time. Brain computed tomography perfusion
imaging (CTPI) is also performed for continuous dynamic scanning of
the layer in the region of interest (ROI) within a certain time
after the intravenous injection of the contrast agent. When the
contrast agent reaches the brain tissue, its density gradually
increases, peaks and then gradually decreases within a certain
time, until the contrast is restored to the density level in the
brain tissue prior to injection. The TDC for the contrast agent is
obtained by measuring density values in the brain tissue at various
times during the CT scan, as well as hemodynamic parameters,
including regional CBF (rCBF), regional cerebral blood volume
(rCBV), mean transit time (MTT) and time-to-peak (TP). The
perfusion images for CBF, CBV, MTT and TP of brain tissue are
obtained following pseudo-color processing. The brain CTPI reflects
the changes in physiological functions of brain tissue; therefere,
it is a functional imaging technique. Pseudo-color images of
multiple parameters are obtained within minutes of processing the
images with perfusion software, in a similar manner to magnetic
resonance perfusion imaging (MRPI). It is a multi-parameter imaging
method that is the preferred examination method for ultra-early and
early stroke patients.
The central premise of acute stroke thrombolysis is
the recovery of the ischemic penumbra (6,7).
Although repeated analysis of experimental data by the
International Stroke and Neurological Disorder Association has
identified no evidence for the efficacy of recombinant tissue
plasminogen activator (R-TPA) in the first 3 h (8,9), the
data also indicated that thrombolytic therapy beyond 3 h is safe
(10). To increase the accuracy of
the identification of the ischemic penumbra, extension of the
thrombolytic time window is necessary. This has become an urgent
requirement for acute stroke imaging. Brain CTP is an effective and
convenient method for evaluating acute stroke.
A dynamic scan of several different levels of the
brain is obtained through the injection of an iodine-containing
contrast agent to perfuse the brain tissue. Based on CT data of
dynamic brain perfusion, a number of early studies proposed
standards for determining the necrosis or penumbra of the brain
tissue. A number of studies considered the absolute value of the
CBF (1,2), while others were based on the
cerebrovascular autoregulation theory, proposing standards based on
a combination of CBF and CBV values (1–5,11,12)
to determine the presence of a cerebral infarction core and
ischemic penumbra.
The determination of the ischemic penumbra from CTP
data has been assessed in a number of studies using various
methods. These are often small scale studies using 2-slice, 4-slice
or <16-slice CTP machines (13). In the current study, 64-slice
spiral CT was selected for the examination of patients with
clinically suspected acute ischemic stroke, with the purpose of
implementing a systematic assessment of all CTP parameters (CBF,
CBV, MTT and TP) for acute stroke patients and also to ensure that
these parameters accurately detect cerebral ischemia and the
ischemic penumbra.
The current study is a small scale, independent
prospective study on the brain perfusion of ischemic stroke, with
the purpose of exploring judgment standards for the core area and
penumbra of cerebral infarction. In particular, the aim is to
explore the judgment criteria under lower temporal resolution (low
sampling rate), to facilitate the detection of the penumbra during
whole brain perfusion and to promote its application in primary
health care sites.
The main purpose of the thrombolytic treatment of
stroke patients is to save brain tissue in the ischemic penumbra
and this has been demonstrated to be effective and feasible.
Studies have demonstrated that thrombolytic therapy performed on
patients >3 h after the onset of ischemic stroke is safe and
reliable (14,15). Therefore, an accurate determination
of the existence and the extent of the penumbra is the basis for
the treatment of ischemic patients at various time windows. The
blood flow in normal human brain gray matter is ∼50–60 ml/100 g/min
(6). In the early stages of brain
tissue ischemia, a brain tissue hypoperfusion area exists between
the infarction core and normal brain tissue. Although this area of
brain tissue demonstrates physiological dysfunction, with no
significant cell potassium outflow and energy exhaustion, when the
normal blood supply is restored, its electrophysiological function
is capable of being restored.
CTP volumetric imaging shows a reversible area
surrounding the irreversibly infarcted area. The blood flow in
these surrounding areas is between the thresholds for electrical
activity failure and membrane failure and is known as the penumbra.
The ischemic penumbra is dynamic; it returns to a normal state or
may progress into infarction. However, the restoration of the
electrophysiological activity of brain tissue has a certain time
limit; 3–4 h after the onset of cerebral infarction, the vast
majority of the ischemic penumbra develops into an irreversibly
infarcted area. Therefore, the focus of studies in previous years
has been to save the living brain tissue in the ischemic penumbra,
which is the key to reducing or avoiding disability. Koenig et
al (16) performed brain CT
perfusion in patients with acute cerebral ischemia within 6 h of
symptom onset and the sensitivity of penumbra detection was 90%,
with a specificity of 100%.
The CBF ratio in the cerebral ischemic lesion center
may be used to distinguish between reversible and irreversible
ischemic areas. A disputed study determined a CBF ratio of 0.2 as
the minimum threshold for the survival of ischemic brain tissue and
stated that when the CBF ratio is <0.2, the brain tissue has
been necrotized, and when the CBF ratio is 0.2–0.35, the ischemic
penumbra should be considered (16) and the effect of thrombolytic
therapy is clear. Decreased CBF, normal or mildly elevated CBV,
abnormal MTT and normal or delayed TP are regarded as
characteristics of an abnormal perfusion area (11). MTT extension and a significant
decrease of CBF in the cerebral ischemia area indicate irreversible
damage; extension of the MTT and maintenance or increase of the CBV
also indicate irreversible damage (17). CTP shows the abnormal perfusion
areas as early as 30 min after the onset of symptoms (11).
Patients and methods
Clinical data
A total of 22 patients with neurological deficit
symptoms and with intracerebral hemorrhage ruled out using a CT
scan, who were admitted to the Emergency Department of Neurology of
Peking University First Hospital (Beijing, China) from August 2005
to June 2006, were retrospectively studied. This study was
conducted in accordance with the Declaration of Helsinki and with
approval from the Ethics Committee of Peking University First
Hospital. Written informed consent was obtained from all
participants. Inclusion criteria for the patients were as follows:
within 24 h of stroke onset; no previous history of stroke;
intracranial hemorrhage determined using a CT scan; and no
contraindications of imaging using iodinated contrast agent and
contraindications of MRI examination. Of the 22 patients, 13 were
male and 9 were female, aged 42–73 years, with a mean age of 56.7
years. The symptoms of the patients manifested as transient,
persistent or recurrent ischemic attacks. Of the 22 cases, 8
patients presented episodic limb weakness, 6 patients had
dysphonia, 4 patients presented tongue deflection, 2 patients
presented dysphonia and unresponsiveness and 2 patients presented
aphasia combined with unilateral hemiparesis. All patients received
a plain CT scan and the results were confirmed by CTPI and CT
angiography (CTA) at 1–24 h after the onset of the disease. All the
selected cases underwent MRI examination within 3–10 days of the
onset of the disease. This identified that the infarct areas were
larger than the range observed during perfusion.
Initial CT examination
The initial CT examination included CT brain scans,
head and neck vascular CTA and 4-slice brain CTP examination
(sampling rate of one slice per second). After reprocessing the
data, a variety of brain perfusion maps with a sampling rate of one
slice per second and with a sampling rate interval of 4 slices per
second were obtained. A plain brain scan using 64-slice spiral CT
was performed immediately after admission and CTPI and CTA
examinations were conducted once cerebral hemorrhage had been
excluded. The slice thickness of perfusion imaging was set to
2.5–10 mm (10 or 5 mm for the brain hemisphere and 5 or 2.5 mm for
the brainstem or cerebellum). The range of angiography was set from
the upper edge of the aortic arch to the calvaria.
CTPI examination
Patients were asked to avoid head movements and to
breathe quietly. The patient’s heads were fixed with straps and a
CT plain scan, CTP and CTA were completed within 5–10 min. A 40 ml
bolus injection of nonionic contrast agent (370 mg/ml; Ultravist,
Bayer Vital GmbH, Berlin, Germany) was administered into the ulnar
vein with a Medrad-stellant high-pressure syringe (binoculars) at a
flow rate of 4 ml/sec. A synchronous dynamic axial CT scan was
performed at the same time as the injection of the contrast agent.
The scan parameters were as follows: 120 kV; 400 mAsec; interval, 1
sec; scan time, 50 sec and coverage, 10 mm × 8 slices. A total of
200 images of slices in the ROI were obtained. The CBF of brain
tissue which was included in the scan range of 10 mm × 8 slices was
calculated. By which the brain blood supply was evaluated.
The slices in which lesions were identified with
clinical positioning and CT scanning were selected for assessment
and calculation. The processing software in the workstation
(Extended Brilliance™ Workspace workstation, Philips, Amsterdam,
The Netherlands) was employed for data processing to obtain the TDC
of the contrast agent passing through the brain tissue and to
calculate the CT parameter values in the selected lesions and
corresponding contralateral area. The midline was used as a mirror
plane, to symmetrically measure the MTT (sec) of the contrast agent
passing through the lesion and the corresponding contralateral
area. The rCBF (ml/min/100 g), rCBV (ml/100 g) and TP (sec) of the
contrast agent, as well as other hemodynamic parameter values were
quantitatively analyzed. On the pseudo-color images obtained from
post-processing, the thresholds were adjusted and determined and
then the blood vessels that may interfere with the results were
removed to avoid skull pseudo-shadow. The CBV, CBF, TP and MTT in
the abnormal area marked with red and green colors were displayed
and the parameter values in the lesion core and the surrounding
area were simultaneously measured, analyzed and compared.
Follow-up MR examination
Follow-up MR examination included fluid-attenuated
inversion recovery (FLAIR), diffusion-weighted imaging (DWI) axial
sequence and 3D time-of-flight (TOF) magnetic resonance angiography
(MRA). The infarct size was determined according to the final
outcome of the MR examination. Finally, indicators for the cerebral
perfusion parameters of the cerebral infarction core area and the
penumbra at varying sampling rates were proposed.
Image processing
After processing with the Extended Brilliance™
Workspace workstation, the images were jointly interpreted by two
radiologists and neurologists with five years’ relevant work
experience. In this study, the CTP threshold was adjusted according
to the nuclear magnetic resonance (NMR) image, to obtain abnormal
perfusion images that were similar to the NMR images and to measure
and obtain the parameter values in the area presenting abnormal
perfusion. The values of MTT, CBF, CBV, TP and other hemodynamic
parameters in the selected lesion and corresponding contralateral
areas were recorded. The differences in the values of the
hemodynamic parameters in the lesion core and the surrounding area
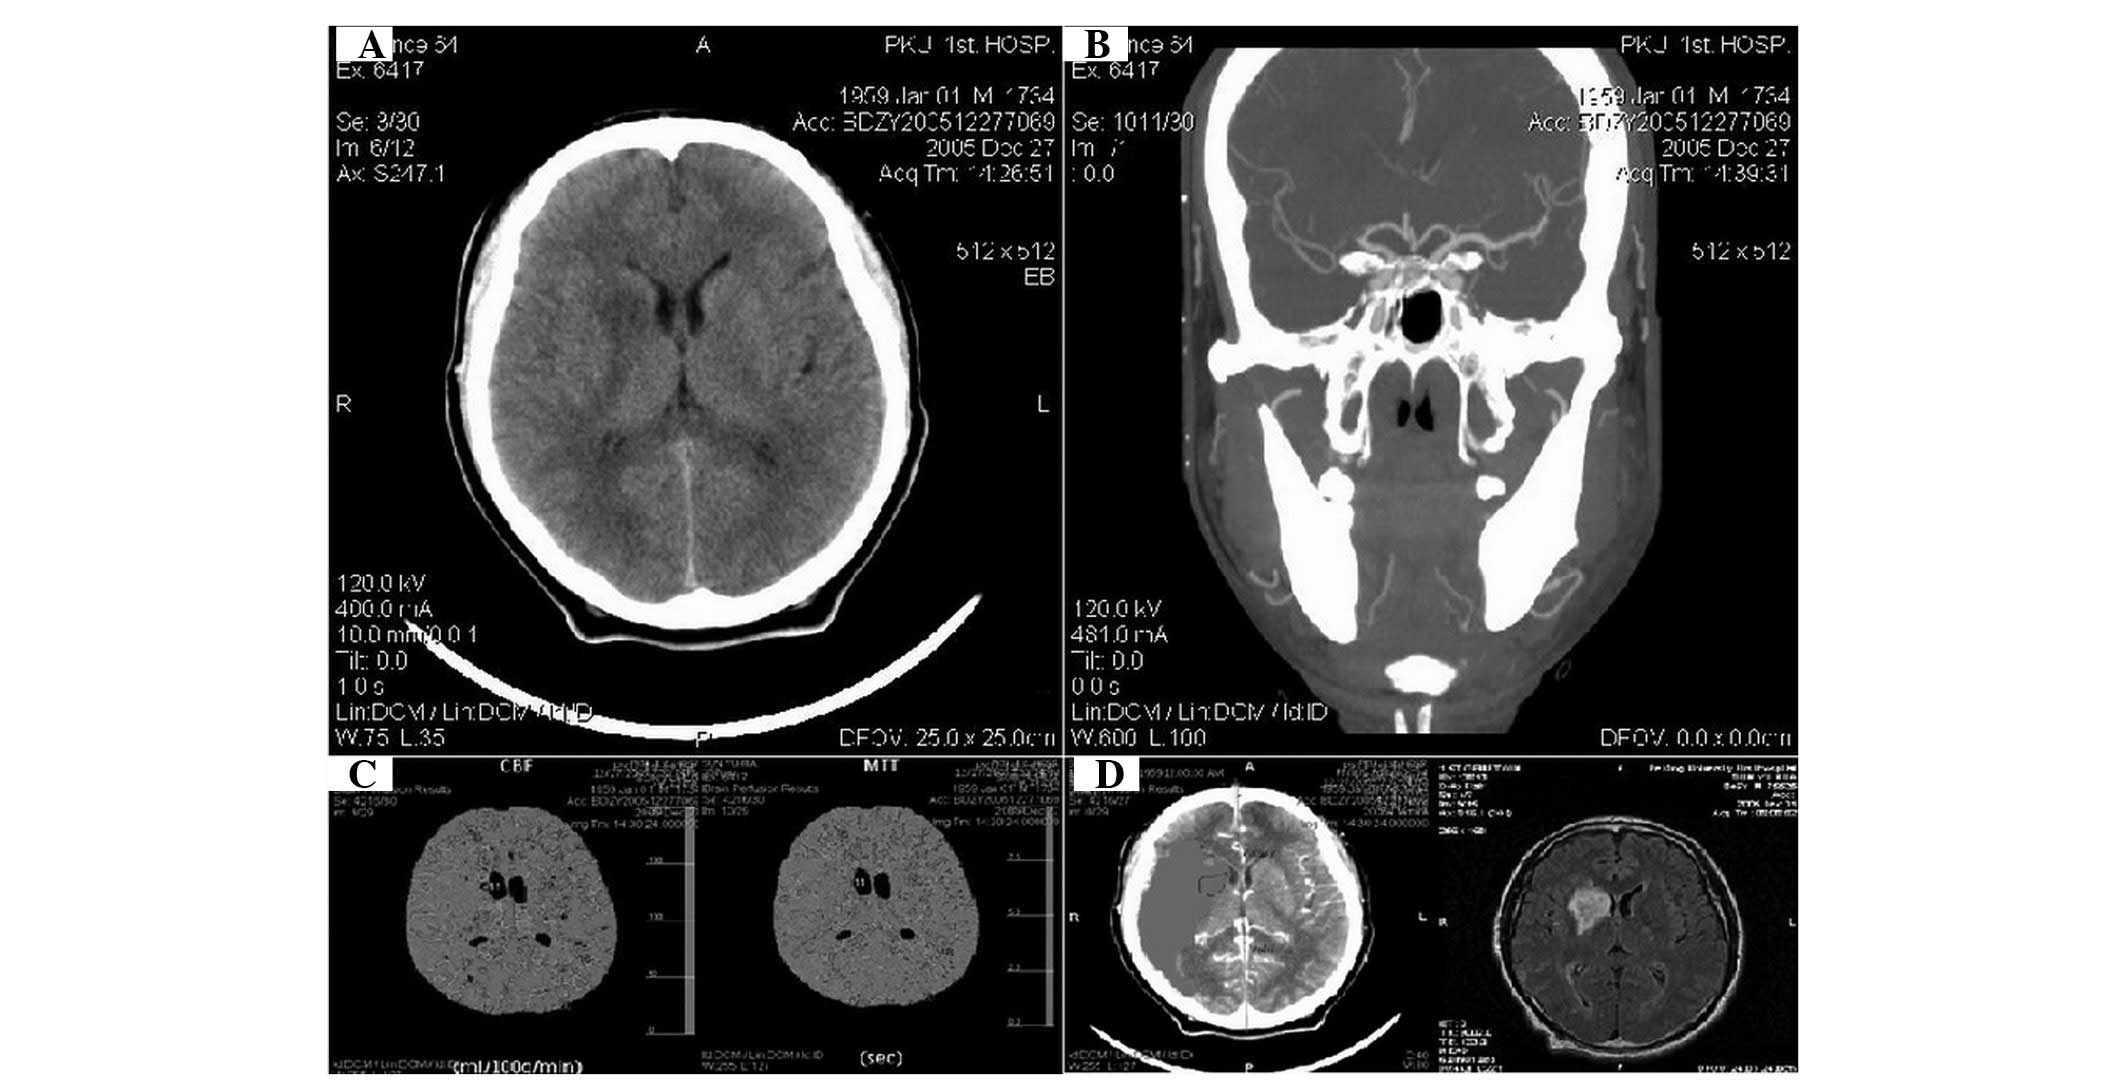
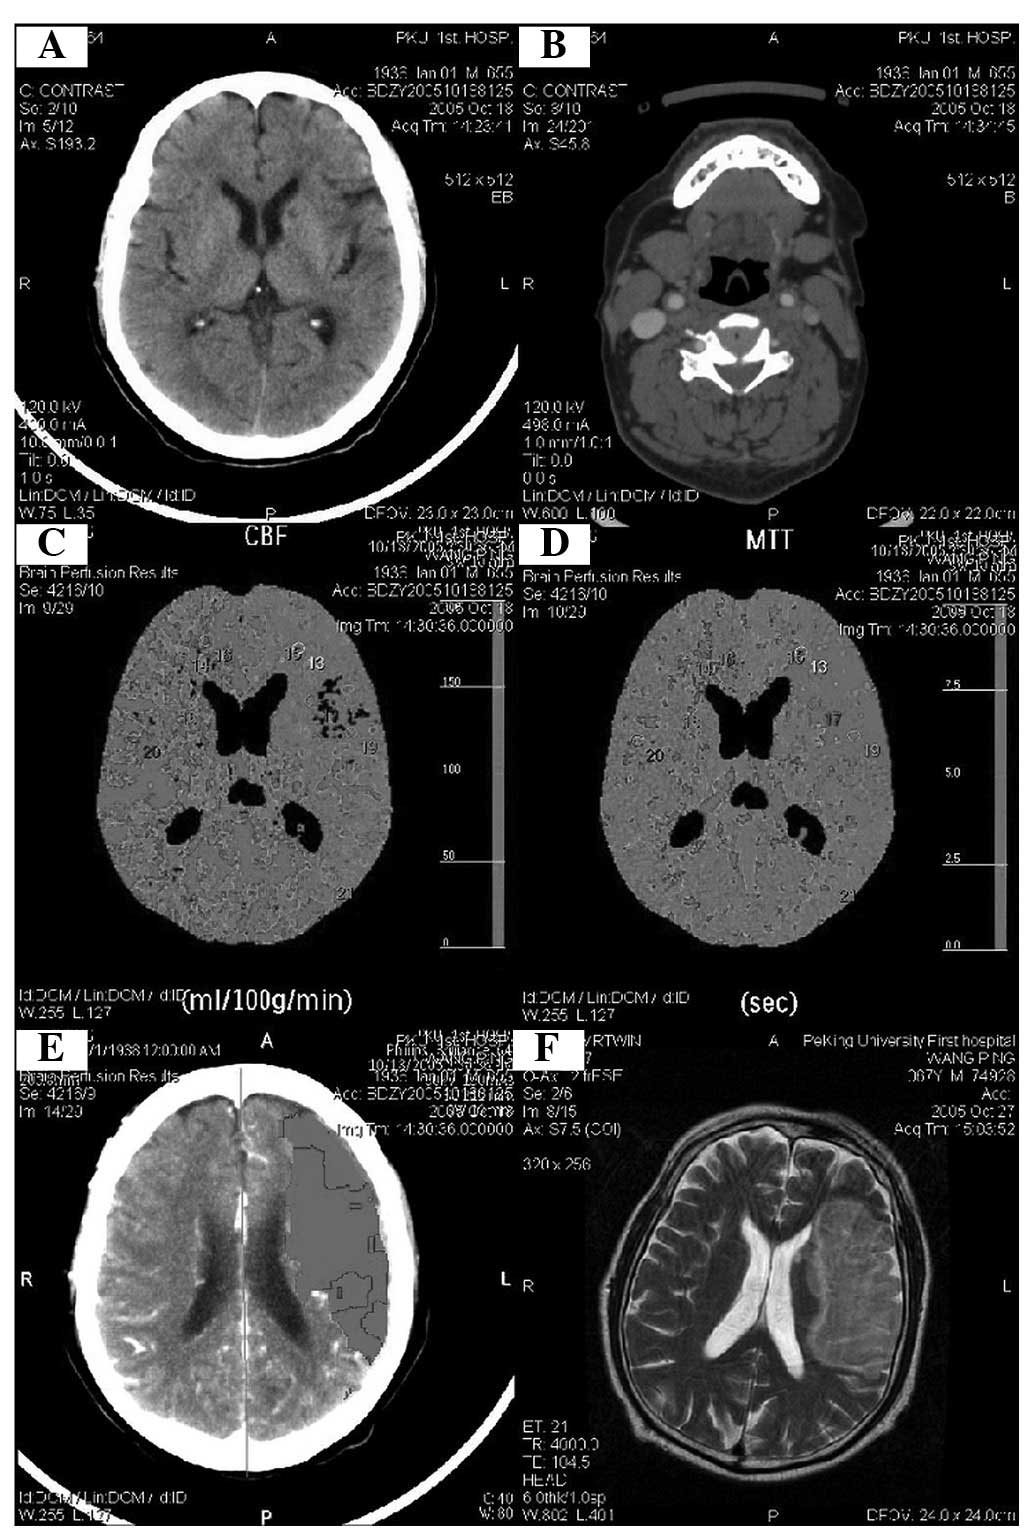
were simultaneously measured (Figs.
1 and 2).
Statistical analysis
All data were processed with SPSS 11.0 software
(SPSS Inc., Chicago, IL, USA). The absolute value of the parameters
in the perfusion area and the ratio of the lesion area and
contralateral area were calculated. The parameters of the affected
side and the control area were assessed with Wilcoxon signed ranks
test. The values of the ratio of the lesion area and contralateral
area −1 were assessed with an independent sample t-test. P<0.05
was considered to indicate a statistically significant result.
Results
A significant difference was observed between the
absolute values of the parameters in the ischemic penumbra and the
corresponding healthy side area, using Wilcoxon signed ranks test
(P<0.001; Table I),
demonstrating that the absolute values of each parameter reflect
lesion change. Among the values of the ratio of the lesion area and
contralateral area −1, assessed with the independent sample t-test,
the difference between the CBV ratio and the TP ratio was not
determined to be significant (P>0.05). The differences between
the other parameters were significant (P<0.05; Table II).
 | Table I.Wilcoxon signed ranks test between the
absolute values of parameters in the ischemic penumbra and
corresponding healthy side area. |
Table I.
Wilcoxon signed ranks test between the
absolute values of parameters in the ischemic penumbra and
corresponding healthy side area.
| Parameters | N | Mean rank | Sum of ranks | P-value |
|---|
| CBV2-CBV1 | | | | |
| Negative ranks | 77a | 72.18 | 5558.00 | <0.05 |
| Positive ranks | 57b | 61.18 | 3487.00 | |
| Ties | 1c | | | |
| Total | 135 | | | |
| CBF2-CBF1 | | | | |
| Negative ranks | 12d | 29.33 | 352.00 | |
| Positive ranks | 123e | 71.77 | 8828.00 | |
| Ties | 0f | | | |
| Total | 135 | | | |
| MTT2-MTT1 | | | | |
| Negative ranks | 130g | 68.10 | 8852.50 | |
| Positive ranks | 5h | 65.50 | 327.50 | |
| Ties | 0i | | | |
| Total | 135 | | | |
| TP2-TP1 | | | | |
| Negative ranks | 130j | 69.11 | 8984.00 | |
| Positive ranks | 5k | 39.20 | 196.00 | |
| Ties | 0l | | | |
| Total | 135 | | | |
| Table II.Independent sample t-test of the
ratios of the parameters in the lesions area and the corresponding
healthy side area. |
Table II.
Independent sample t-test of the
ratios of the parameters in the lesions area and the corresponding
healthy side area.
| Ratio 1 | Ratio 2 | Mean difference | Standard error | P-value | 95% Confidence
interval
|
|---|
| Lower bound | Upper bound |
|---|
| 1 | 2 | −0.7788a | 0.12466 | 0.000 | −1.0237 | −0.5339 |
| 3 | −1.0264a | 0.12466 | 0.000 | −1.2713 | −0.7816 |
| 4 | 0.0210 | 0.12466 | 0.866 | −0.2239 | 0.2659 |
| 2 | 1 | 0.7788a | 0.12466 | 0.000 | 0.5339 | 1.0237 |
| 3 | −0.2477a | 0.12466 | 0.047 | −0.4925 | −0.0028 |
| 4 | 0.7998a | 0.12466 | 0.000 | 0.5549 | 1.0447 |
| 3 | 1 | 1.0264a | 0.12466 | 0.000 | 0.7816 | 1.2713 |
| 2 | 0.2477a | 0.12466 | 0.047 | 0.0028 | 0.4925 |
| 4 | 1.0475a | 0.12466 | 0.000 | 0.8026 | 1.2923 |
| 4 | 1 | −0.0210 | 0.12466 | 0.866 | −0.2659 | 0.2239 |
| 2 | −0.7998a | 0.12466 | 0.000 | −1.0447 | −0.5549 |
| 3 | −1.0475a | 0.12466 | 0.000 | −1.2923 | −0.8026 |
Four of the parameters were normally distributed. By
comparing the arithmetic mean of the four parameters, we identified
that the value of the MTT ratio of the affected side and healthy
side −1 (Table III) was the
maximum value; therefore, the change in MTT was the maximum change.
In the Wilcoxon signed ranks test, a significant difference was
observed between the parameters in the infarct lesions and in the
healthy side (P<0.001; Table
IV). This demonstrated that the absolute value of each
parameter is reflective of lesion change.
| Table III.Parameter ratios in the ischemic
penumbra and the corresponding healthy side area −1. |
Table III.
Parameter ratios in the ischemic
penumbra and the corresponding healthy side area −1.
| Ratio | N | Minimum | Maximum | Mean | SD |
|---|
| 1 | 135 | 0.42 | 4.07 | 1.1446 | 0.49058 |
| 2 | 135 | 0.38 | 8.33 | 1.9233 | 1.25488 |
| 3 | 135 | 0.25 | 9.61 | 2.1710 | 1.52981 |
| 4 | 135 | 0.86 | 2.75 | 1.1236 | 0.19954 |
| Table IV.Wilcoxon signed ranks test of
parameter values in the ischemic penumbra and the corresponding
healthy side area. |
Table IV.
Wilcoxon signed ranks test of
parameter values in the ischemic penumbra and the corresponding
healthy side area.
| Parameter | N | Mean rank | Sum of ranks | P-value |
|---|
| CBV2-CBV1 | | | | |
| Negative
ranks | 7a | 8.29 | 58.0 | <0.001 |
| Positive
ranks | 24b | 18.25 | 438.0 | |
| Ties | 0c | | | |
| Total | 31 | | | |
| CBF2-CBF1 | | | | |
| Negative
ranks | 0d | 0.00 | 0 | |
| Positive
ranks | 31e | 16.00 | 496.0 | |
| Ties | 0f | | | |
| Total | 31 | | | |
| MTT2-MTT1 | | | | |
| Negative
ranks | 29g | 16.57 | 480.5 | |
| Positive
ranks | 2h | 7.75 | 15.5 | |
| Ties | 0i | | | |
| Total | 31 | | | |
| TP2-TP1 | | | | |
| Negative
ranks | 28j | 16.43 | 460.0 | |
| Positive
ranks | 3k | 12.00 | 36.0 | |
| Ties | 0l | | | |
| Total | 31 | | | |
By calculating the values obtained from the ratio of
parameters in the infarct area to the contralateral area −1, we
identified that the internal differences of the parameters were
large; however, they were not normally distributed (Table V). In these parameters, the
direction change of certain parameters does not match with that of
the majority of parameters, which may be related to the greater
difference of change in early infarct blood flow dynamics. The
results indicate that the four parameters should be jointly used
when defining and distinguishing infarct lesions.
| Table V.Ratio of parameters in the ischemic
penumbra area and the corresponding healthy side area. |
Table V.
Ratio of parameters in the ischemic
penumbra area and the corresponding healthy side area.
| Ratio | N | Mean | SD |
|---|
| 1 | 31 | 0.2578 | 0.44001 |
| 2 | 31 | 0.2996 | 0.42633 |
| 3 | 31 | 0.6376 | 0.25439 |
| 4 | 31 | 3.9747 | 8.99462 |
Our results (Tables
IV and V) indicate that the
currently available data do not distinguish the pros and cons of
the differences in the four parameters. The differences may be due
to: i) the screening criteria of the study subjects; ii) the onset
time differences in the study subjects; iii) selection of a
reasonable MRI and CTP examination time; iv) generation of large
differences between the values for different lesion sizes; v)
differences in the age and gender of the patients; and vi)
differences in the recovery or progress of lesions in the acute
phase.
Discussion
CTP has been reported to be a simple and effective
imaging technology for evaluating the scope and extent of the
ischemic penumbra in patients with acute stroke in the emergency
room (18). CTPI has a diagnostic
performance comparable to those of MRI [(DWI and perfusion-weighted
imaging (PWI)] and positron emission tomography (PET)-CT; however,
a CTP scan is more convenient and efficient to perform in the
majority of medical institutions (17–21).
Assessment of the penumbra and infarct core relies on a
multi-layered dynamic CTP, including the acquisition technology of
sequential CT data. This technology is derived from the bolus
injection method for intravenous injection of an iodine-containing
contrast agent. The 64-slice spiral CTP examination is an effective
and easy method for evaluating acute stroke. By injection of an
iodine-containing contrast agent, a dynamic scan of the same area
in several slices of the brain may be performed to obtain perfusion
data of the brain tissue.
Based on CT data of dynamic brain perfusion, a
number of studies have proposed standards for determining necrosis
or the ischemic penumbra in the brain tissue. A number of studies
considered the absolute value of the CBF (1,2),
while other studies were based on the cerebrovascular
autoregulation theory (1–5,11,12).
The latter proposed standards for data, based on combinations of
CBF with CBV, to determine the presence of the cerebral infarction
core and ischemic penumbra. However, the limited number of studies
have certain shortcomings. Firstly, the majority of the studies
included a small number of cases (12–22 cases). Secondly, the
standard of judgment was set relatively optionally. A study with a
relatively large number of cases (130 cases), in which the relative
and absolute values of the CBF, CBV, MTT and TP in the images of 25
cases were evaluated by Wintermark and Bogousslavsky (17), with the use of ROC curve analysis,
proposed the use of the relative MTT and absolute CBV values as the
standard for identifying the cerebral infarction core area and the
penumbra.
Results obtained in other studies are quite
different from these standards, and reliable reports and standards
for corresponding data are lacking; thus, it is difficult to
establish a corresponding standard using a certain set of data in
the literature. In addition, in one study (22), the method used had a sampling rate
of one slice per second (high resolution) and it requires a high
radiation dose. Additionally, the primary hospital equipment is
difficult to support and is not suitable for a wide range of whole
brain perfusion. By reducing the sampling rate of CTP (low
resolution), we are able to successfully obtain the parameters of
cerebral perfusion. However, normal brain perfusion parameters
acquired at low sampling rates have different results in different
studies. The current study identified that when time resolution is
reduced from one slice per second to an interval of 4 sec per
slice, the values of the perfusion parameter CBV decrease, while
the TP value is extended. Currently, there is no standard in which
a time resolution of 4 sec is used to determine the existence of
the penumbra within the brain tissue.
We conducted a small scale study of acute stroke
patients using a 64-slice CTP technique and all CTP parameters
(CBF, CBV, MTT and TP) were systematically assessed. MRI was used
for the final evaluation of the size of the stroke-affected area.
The ultimate goal was to determine the penumbra parameters and the
composite value of all parameters to produce more accurate
predictors of infarction and penumbra.
In this study, CTP examination was conducted within
24 h; however, MR examination was performed after 3–7 days, so
there was a time interval between the two results. The difference
between the lesion sizes identified in MR examination and the
lesion sizes in CTP were analyzed. In addition, based on the
results of statistical analysis, the CBV values in the infarction
area were not fully in line with theoretical values, which may be a
result of the varying amount of local blood supply in the
infarction area at the time of examination.
The purpose of this study was to investigate the
credibility of the various parameters in identifying the penumbra
and infarction area using CTP, rather than to study the consistency
of the results of CTP with MR results and the absolute accuracy of
MR. In addition, NMR was considered the gold standard; however, it
is not the only option, since a second plain CT following perfusion
may also be used as the gold standard to confirm the progress and
recovery condition shown in the penumbra and infarct.
The combination of 64-slice CTPI and CTA may be used
to respectively evaluate cerebral perfusion in 8–32 slices and 80
mm range up and down and may be conducted immediately after the
onset of clinical symptoms of ischemic lesions. The CBF of brain
tissue which was included in the scan range of 10 mm × 8 slices was
calculated. By which the brain blood supply was evaluated. Dynamic
CTP of the same area of multiple slices is achieved, with fast
scanning and a large scanning range. The automatic mAsec technique
reduces the amount of rays related to repeated scans and the use of
the respiratory gating technique reduces motion artifacts during
detection. We consider that the focal points in the development of
the technology to improve the quality of multi-slice brain CT
imaging should include: improvement of the physical temporal
resolution by increasing the rack speed; improvement of the spatial
resolution through the development of thinner detectors and more
advanced reconstruction algorithms; improvement of the image
quality through research and development of a detector with more
slices (for example, 256 slices) or even a flat panel detector;
expansion of the adaptive population of 64-slice CT brain imaging
through the development of more advanced respiratory gating
technology and to better apply the CT imaging technique adopted in
very small lesions (including the cerebellum and brainstem). With
the continuous development and progress in multi-slice CT
technology, this technique is likely to be more widely used in the
diagnosis of ischemic stroke.
References
|
1.
|
Schramm P, Schellinger PD, Klotz E, et al:
Comparison of perfusion computed tomography and computed tomography
angiography source images with perfusion-weighted imaging and
diffusion-weighted imaging in patients with acute stroke of less
than 6 hours’ duration. Stroke. 35:1652–1658. 2004.PubMed/NCBI
|
|
2.
|
Schramm P, Schellinger PD, Fiebach JB, et
al: Comparison of CT and CT angiography source images with
diffusion-weighted imaging in patients with acute stroke within 6
hours after onset. Stroke. 33:2426–2432. 2002.PubMed/NCBI
|
|
3.
|
Wintermark M, Fischbein NJ, Smith WS, Ko
NU, Quist M and Dillon WP: Accuracy of dynamic perfusion CT with
decon¬volution in detecting acute hemispheric stroke. AJNR Am J
Neuroradiol. 26:104–112. 2005.
|
|
4.
|
Wintermark M, Reichhart M, Cuisenaire O,
et al: Comparison of admission perfusion computed tomography and
qualitative diffusion- and perfusion weighted magnetic resonance
imaging in acute stroke patients. Stroke. 33:2025–2031. 2002.
View Article : Google Scholar
|
|
5.
|
Wintermark M, Reichhart M, Thiran JP, et
al: Prognostic accuracy of cerebral blood flow measurement by
perfusion computed tomography, at the time of emergency room
admission, in acute stroke patients. Ann Neurol. 51:417–432. 2002.
View Article : Google Scholar : PubMed/NCBI
|
|
6.
|
Astrup J, Siesjö BK and Symon L:
Thresholds in cerebral ischemia - the ischemic penumbra. Stroke.
12:723–725. 1981. View Article : Google Scholar : PubMed/NCBI
|
|
7.
|
Hossmann KA: Neuronal survival and revival
during and after cerebral ischemia. Am J Emerg Med. 1:191–197.
1983. View Article : Google Scholar : PubMed/NCBI
|
|
8.
|
Ingall TJ, O’Fallon WM, Louis TA, et al:
Initial findings of the rt-PA acute stroke treatment review panel.
Cerebrovasc Dis. 16(Suppl 4): S1–S125. 2003.
|
|
9.
|
Hacke W, Donnan G, Fieschi C, et al;
ATLANTIS Trials Investigators; ECASS Trials Investigators; NINDS
rt-PA Study Group Investigators: Association of outcome with early
stroke treatment: pooled analysis of ATLANTIS, ECASS, and NINDS
rt-PA stroke trials. Lancet. 363:768–774. 2004. View Article : Google Scholar : PubMed/NCBI
|
|
10.
|
Schellinger PD and Warach S: Therapeutic
time window of thrombolytic therapy following stroke. Curr
Atheroscler Rep. 6:288–294. 2004. View Article : Google Scholar : PubMed/NCBI
|
|
11.
|
Mayer TE, Hamann GF, Baranczyk J, et al:
Dynamic CT perfusion imaging of acute stroke. AJNR Am J
Neuroradiol. 21:1441–1449. 2000.PubMed/NCBI
|
|
12.
|
Reichenbach JR, Röther J, Jonetz-Mentzel
L, et al: Acute stroke evaluated by time-to-peak mapping during
initial and early follow-up perfusion CT studies. AJNR Am J
Neuroradiol. 20:1842–1850. 1999.PubMed/NCBI
|
|
13.
|
Latchaw RE, Yonas H, Hunter GJ, et al;
Council on Cardiovascular Radiology of the American Heart
Association: Guidelines and recommendations for perfusion imaging
in cerebral ischemia: A scientific statement for healthcare
professionals by the writing group on perfusion imaging, from the
Council on Cardiovascular Radiology of the American Heart
Association. Stroke. 34:1084–1104. 2003. View Article : Google Scholar
|
|
14.
|
Eastwood JD, Lev MH, Wintermark M, et al:
Correlation of early dynamic CT perfusion imaging with whole-brain
MR diffusion and perfusion imaging in acute hemispheric stroke.
AJNR Am J Neuroradiol. 24:1869–1875. 2003.PubMed/NCBI
|
|
15.
|
Eastwood JD, Lev MH, Azhari T, et al: CT
perfusion scanning with deconvolution analysis: pilot study in
patients with acute middle cerebral artery stroke. Radiology.
222:227–236. 2002. View Article : Google Scholar : PubMed/NCBI
|
|
16.
|
Koenig M, Klotz E, Luka B, Venderink DJ,
Spittler JF and Heuser L: Perfusion CT of the brain: diagnostic
approach for early detection of ischemic stroke. Radiology.
209:85–93. 1998. View Article : Google Scholar : PubMed/NCBI
|
|
17.
|
Wintermark M, Flanders AE, Velthuis B, et
al: Perfusion-CT assessment of infarct core and penumbra: receiver
operating characteristic curve analysis in 130 patients suspected
of acute hemispheric stroke. Stroke. 37:979–985. 2006. View Article : Google Scholar
|
|
18.
|
Wintermark M and Bogousslavsky J: Imaging
of acute ischemic brain injury: the return of computed tomography.
Curr Opin Neurol. 16:59–63. 2003. View Article : Google Scholar : PubMed/NCBI
|
|
19.
|
Barber PA, Hill MD, Eliasziw M, et al:
Imaging of the brain in acute ischemic stroke: comparison of
computed tomography and magnetic resonance diffusion-weighted
imaging. J Neurol Neurosurg Psychiatry. 76:1528–1533. 2005.
View Article : Google Scholar : PubMed/NCBI
|
|
20.
|
Rai AT, Carpenter JS, Peykanu JA, Popovich
T, Hobbs GR and Riggs JE: The role of CT perfusion imaging in acute
stroke diagnosis: a large single-center experience. J Emerg Med.
35:287–292. 2008. View Article : Google Scholar : PubMed/NCBI
|
|
21.
|
Na DG, Ryoo JW, Lee KH, et al: Multiphasic
perfusion computed tomography in hyperacute ischemic stroke:
comparison with diffusion and perfusion magnetic resonance imaging.
J Comput Assist Tomogr. 27:194–206. 2003. View Article : Google Scholar : PubMed/NCBI
|
|
22.
|
Nabavi DG, Cenic A, Craen RA, et al: CT
assessment of cerebral perfusion: experimental validation and
initial clinical experience. Radiology. 213:141–149. 1999.
View Article : Google Scholar : PubMed/NCBI
|