Introduction
Undiagnosed diabetes mellitus (DM) is characterized
by persistently high glucose levels, which can lead to debilitating
and life-threatening vascular-related secondary complications, such
as blindness or heart and kidney failure. It is well known that
early diagnosis is strongly associated with improved prognosis. The
early detection of impaired glucose tolerance (IGT) may result in
early lifestyle and/or pharmaceutical interventions that can delay
the onset of DM and reduce the severity of secondary complications
(1–3).
International health organizations recommend routine
clinical screening for populations at a high risk of type 2 DM
(4,5). A previous study revealed that, in the
majority of cases, patients reported positive experiences with the
type 2 DM screening procedure, regardless of the findings (6). The screening methods that are currently
used include questionnaires, which identify behavioral risk
factors, such as high-fat diets and sedentary lifestyles, and
biochemical tests, which can identify IGT by examining body fluids.
With regard to large-scale screening efforts, questionnaires are
popular due to the low cost of their administration and their
non-invasive nature, which enhances the probability of patient
compliance; however, when used alone, questionnaires often perform
poorly and numerous patients with IGT and/or DM remain undiagnosed
(7).
Biochemical tests have higher performance rates than
questionnaires but have a lower patient compliance rate due to the
fact that they are invasive, inconvenient and require fasting
samples for opportunistic testing. A survey on a series of
opportunistic screenings showed that 95% of the screenings were
conducted by random plasma glucose testing alone, which has the
lowest sensitivity for detecting IGT and diagnosing DM. Only 3% of
the screenings used the fasting plasma glucose (FPG) test, 2% used
the hemoglobin A1c (HbA1c) test and <1% used the oral glucose
tolerance test (OGTT) (8).
In the past decade, an EZSCAN™ device (Impeto
Medical, Paris, France) was developed to evaluate sweat-gland
function by measuring electrochemical skin conductance (ESC)
through chronoamperometry. This device has proven to be a
promising, rapid, convenient and non-invasive diagnostic strategy
for certain human diseases (9–11). This
technology was first validated in patients with cystic fibrosis
based on the high concentration of chloride in the sweat of
patients with the disease (12), and
was subsequently used as a method for measuring sudomotor
dysfunction in patients with type 2 DM (10).
Since dysglycemic patients present with reduced
distributions of sweat glands and subepidermal nerve fibers, it has
been suggested that the EZSCAN system is a useful screening tool
for IGT and DM. Studies investigating the use of EZSCAN in the
screening of patients for IGT and DM have shown that this test has
a sensitivity of 70–85% and a specificity of 54–100% (10,11,13);
however, the cut-off points for the EZSCAN values used to detect
these disorders were specific to study populations from France
(10) and India (11), and the ‘thresholds’ appeared to
differ in different ethnic groups. Another tool for determining
glucose status, the HbA1c test, has ethnic-specific optimal cut-off
points for detecting DM (14). We
hypothesized that an optimal cut-off point for EZSCAN results could
also be ethnically specific.
The aim of this preliminary study, therefore, was to
determine the optimal cut-off points for EZSCAN screening to detect
previously undiagnosed IGT and DM in a Chinese population.
Furthermore, the diagnostic performance of the EZSCAN system as a
screening tool was compared to that of the FPG and HbA1c tests.
Materials and methods
Study population
The subjects were selected from individuals visiting
the Xianghe Community Hospital (Xianghe, China) for routine health
check-ups between May and June 2011. Subjects were included in the
study only if they were at high risk of developing DM (age ≥45
years) and did not meet the exclusion criteria. The exclusion
criteria were as follows: Previous diagnosis of pre-DM or DM;
cancer; severe psychiatric disturbance; epilepsy; pregnancy;
consumption of drugs known to affect blood glucose levels
(corticosteroids, diuretics, epinephrine, lithium, phenytoin);
consumption of drugs known to affect the sympathetic nervous system
(β-blockers); arm or leg amputation; electrical implantable device
(pacemaker, defibrillator); or known allergy to nickel or to any
other standard electrode materials.
Finally, 270 subjects (180 women and 90 men) were
enrolled in the present study, and all provided informed consent
prior to taking part. This study was approved by the Medical ethics
Committee of Xianghe Community Hospital and was in accordance with
the ethical standards of the Declaration of Helsinki.
Anthropometric and biochemical
measurements
The study participants were invited to the clinic to
complete a questionnaire on demographics, lifestyle, medications
and medical history, and specially trained nurses performed the
anthropometric examinations. The measurements taken included
height, weight, waist circumference and blood pressure. Body mass
index (BMI) was calculated using the following formula: BMI =
weight (kg)/height (m)2. Blood pressure was measured
three times on the right arm using a sphygmomanometer and with a
10-min rest period between each measurement. Blood pressure was
recorded as the mean of these three measurements.
Following an overnight fast (8–10 h), blood samples
were drawn from all subjects for FPG, HbA1c and lipid profile
analyses. Each subject was then asked to consume 75 g liquid
glucose for an OGTT. A second blood specimen was taken 2 h after
administering the oral glucose load. All plasma and serum
biochemistry tests were performed in the clinical laboratory of the
Xianghe Community Hospital using standard operating procedures.
Plasma glucose levels were measured by the glucose oxidase method.
HbA1c levels were measured using high-performance liquid
chromatography (15,16) and serum lipid profiles, including
total cholesterol (TC), triglycerides, high-density lipoprotein
(HDL)- and low-density lipoprotein (LDL)-cholesterol, were
determined by standard enzymatic procedures.
EZSCAN values
As shown in the video tour of the device (http://www.impeto-medical.com/ezscan-demo-video/),
the EZSCAN system was designed to perform precise evaluations of
sweat gland functions through reverse iontophoresis and
chronoamperometry. The system measures ESC based on chloride
concentrations in sweat. The apparatus includes two sets of
electrodes for the hands and feet and a headband comprising a total
of six electrodes. The electrodes are connected to a computer,
which serves for recording and data management.
During the test, electrodes were placed on the areas
of a patient's skin known to be enriched in sweat glands, including
the forehead, the palmar sides of the hands and the plantar sides
of the feet. A continuous current of <4 V was induced and the
electrochemical conductance (in µS; ratio between current generated
and a constant DC stimulus) was determined for the face (left and
right sides), hands (left and right), feet (left and right) and the
whole body (global conductance). A time-ampere curve was recorded
for each derivation. Since conductance is dependent upon the
topographical distributions of sympathetic ganglions and nerve
fiber lengths, different parts of the body exhibit different
conductances. In each subject, identical electrochemical results
will be generated in a specific zone, except when the function of
the zone has been modified pathologically due to small fiber
neuropathy. Following the placement of the electrodes on the hands
and feet and the headband electrodes on the forehead of the
patient, the patient was asked to stand still for 2–3 min. The
EZSCAN scale ranged between 0 and 100% and was calculated using an
algorithm that took into account different parameters, including
demographic variables. The patient's details were displayed
instantaneously in the form of a geometric figure, enabling a
rapid, intuitive interpretation.
Study groups
The study subjects were categorized into three
groups based on the World Health Organization (WHO) criteria of
1999 (17): i) The normal glucose
tolerance (NGT) group (fasting glucose <6.1 mmol/l and 2-h
plasma glucose <7.8 mmol/l); ii) the IGT group (2-h plasma
glucose of 7.8 to <11.1 mmol/l) and iii) the newly diagnosed DM
(NDM) group (fasting glucose >7 mmol/l and/or 2-h plasma glucose
>11.1 mmol/l).
Statistical analysis
SPSS software version 16.0 (SPSS, Inc., Chicago, IL,
USA) was used for the statistical analysis. Results are presented
as the mean (standard deviation), median (25th-75th percentiles) or
percentages, as appropriate. One-way analysis of variance and
χ2 tests were used to compare the results for the groups
with different glycemic states. Pearson correlation analysis was
used to assess the correlation between the EZSCAN values and the
results from the FPG and HbA1c tests and the OGTT. Receiver
operating characteristic (ROC) curves were generated to evaluate
the performance of EZSCAN for IGT and DM detection as compared to
the FPG and HbA1c results. The areas under these ROC curves (AUCs)
and the corresponding 95% confidence intervals (CI) were calculated
and used to determine maximum sensitivity and specificity at
optimal cut-off points. P<0.05 was considered to indicate a
statistically significant difference.
Results
Subject characteristics and the
correlations between EZSCAN scores and blood glucose metabolism
variables
A total of 270 subjects were enrolled in this study.
None of the subjects had been previously diagnosed with any glucose
metabolism disorder. The demographic characteristics of the study
population are shown in Table I.
Based on the WHO criteria of 1999 (17), the subjects included 151
(55.9%) with NGT, 79 (29.3%) with IGT and 40 (14.8%) with NDM. No
significant differences were found among these three groups in
terms of weight, BMI, diastolic blood pressure, TC, HDL-cholesterol
or LDL-cholesterol; however, compared with subjects with NGT, those
with IGT and NDM were older, had greater waist circumferences,
higher systolic blood pressures and higher FPG and HbA1c levels.
Furthermore, the EZSCAN scores were significantly higher for
subjects with IGT (47±11%) and NDM (48±11%) than those for subjects
with NGT (34±13%). Thus, the EZSCAN values corresponded to other
abnormalities in subjects with IGT and NDM.
 | Table ICharacteristics of the study
subjects. |
Table I
Characteristics of the study
subjects.
| Characteristic | Total population | NGT | IGT | NDM | P-value |
|---|
| Subjects, n | 270 | 151 | 79 | 40 | - |
| Age, years | 58.6 (10.2) | 55.7 (10.2) | 62.2
(8.5)b | 62.5
(9.4)b | <0.001 |
| Male, % | 31.6 | 31.1 | 35.4 | 37.5 | 0.378 |
| Weight, kg | 66.8 (12.3) | 65.7 (12.7) | 69.1 (12.0) | 66.2 (11.1) | 0.134 |
| BMI,
kg/m2 | 25.6 (4.7) | 25.2 (4.8) | 26.2 (4.9) | 25.7 (3.8) | 0.354 |
| Waist, cm | 90.8 (10.2) | 89.1 (10.9) | 93.3
(8.8)b | 92.7 (8.6) | 0.006 |
| SBP, mmHg | 130.0
(120.0–150.0) | 130.0 (21.8) | 137.6 (21.3) | 145.3
(25.5)b | <0.001 |
| DBP, mmHg | 79.5 (11.2) | 78.7 (11.8) | 79.9 (11.2) | 81.7 (8.6) | 0.291 |
| TC, mmol/l | 5.02 (1.03) | 4.90 (0.96) | 5.24 (1.14) | 5.03 (1.03) | 0.610 |
| TG,
mmol/la | 1.61 (1.14–2.42) | 1.44 (1.06–1.89) | 1.85
(1.32–2.63)b | 1.87
(1.29–3.43)b | <0.001 |
| HDL, mmol/l | 1.32 (1.20–1.38) | 1.29 (0.20) | 1.31 (0.20) | 1.31 (0.23) | 0.684 |
| LDL, mmol/l | 2.78 (1.05) | 2.83 (0.94) | 2.82 (1.23) | 2.53 (0.98) | 0.255 |
| FPG, mmol/l | 5.59 (5.21–6.16) | 5.47 (0.58) | 5.89
(0.98)b | 8.04
(3.40)b,c | <0.001 |
| 2-h postload plasma
glucose mmol/l | 7.44 (6.18–9.72) | 6.16 (0.98) | 9.17
(0.91)b | 14.52
(3.81)b,c | <0.001 |
| HbA1c, % | 6.0 (5.7–6.4) | 5.9 (0.5) | 6.0 (0.5) | 7.3
(1.8)b,c | <0.001 |
| EZSCAN™, % | 42 (26–51) | 34 (13) | 47 (11)b | 48 (11)b | <0.001 |
For all subjects, the correlation coefficients of
the EZSCAN value were 0.462 with the 2-h post-glucose load OGTT
(P<0.001), 0.182 with FPG (P<0.001) and 0.379 with HbA1c
(P<0.001). Although these correlations were moderate, they were
statistically significant and indicated that the EZSCAN values
paralleled changes in markers associated with IGT and or NDM.
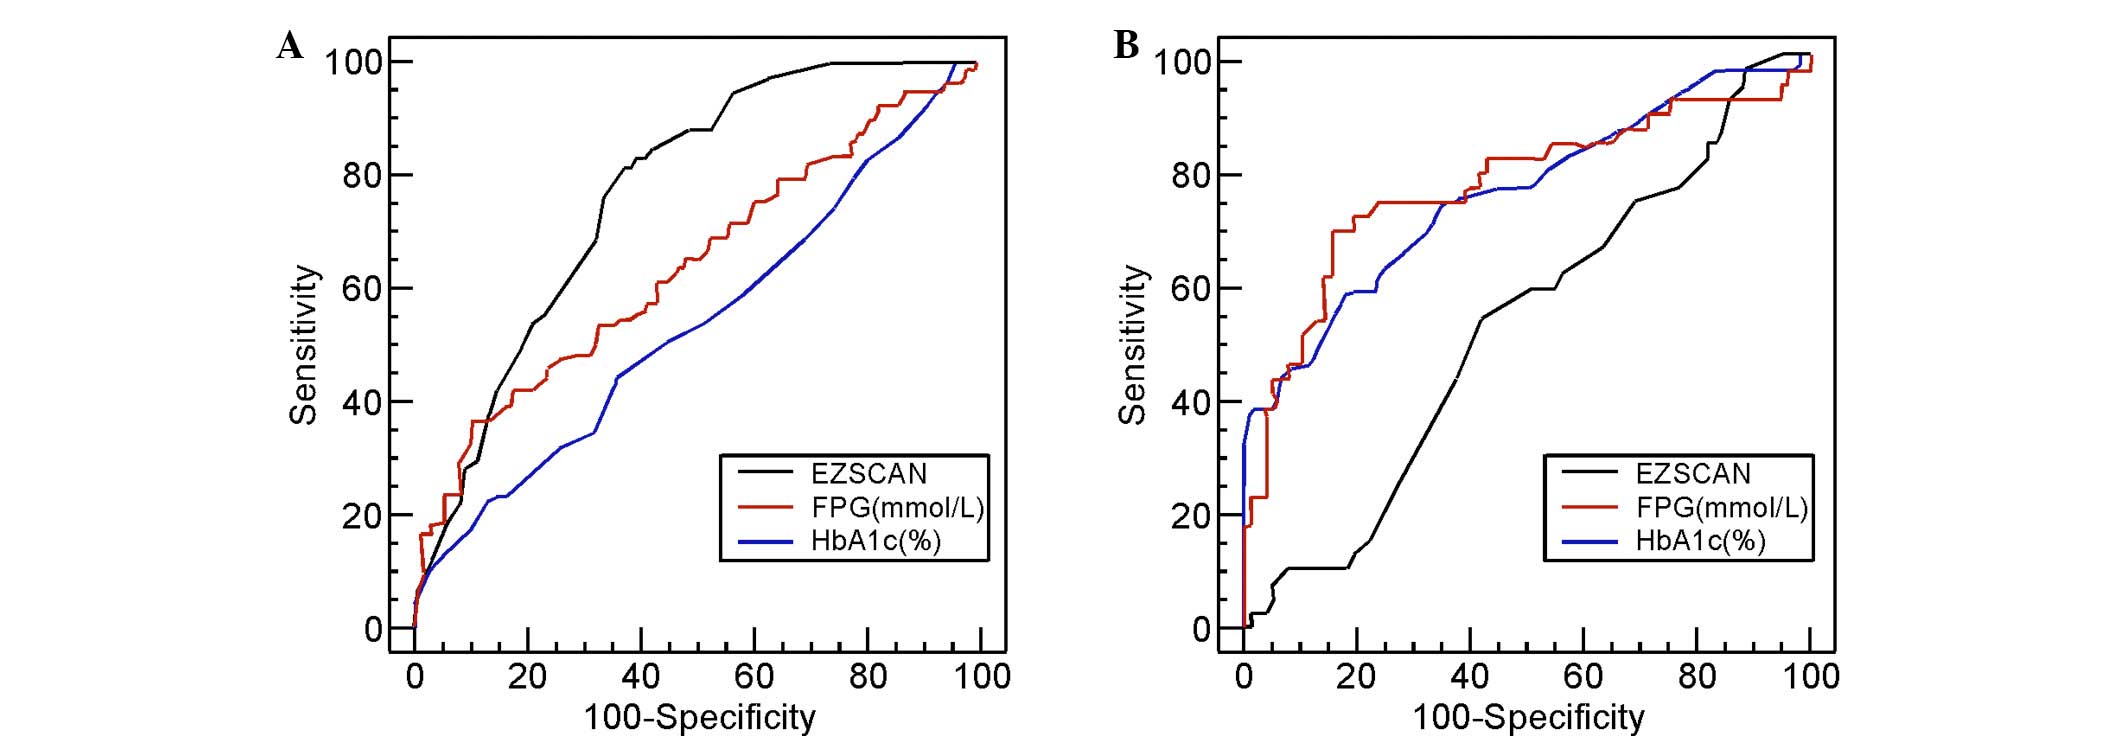
Diagnostic performance of the EZSCAN
values
ROC curves were generated for the EZSCAN values and
FPG and HbA1c levels for subjects with IGT (Fig. 1A) and those with NDM (Fig. 1B). Again, the subjects for whom these
curves were generated had, according to the WHO classification,
either IGT or NDM. Based on these curves, the optimal cut-off
points of these three variables were determined and were used to
assess their diagnostic performance. Table II summarizes the results.
| Table IIDiagnostic performances of EZSCAN™,
FPG and HbA1c testing for the detection of IGT and NDM. |
Table II
Diagnostic performances of EZSCAN™,
FPG and HbA1c testing for the detection of IGT and NDM.
| Screening
method | Cut-off | Sensitivity | Specificity | PPV | NPP | AUC |
|---|
| IGT |
|
| EZSCAN,
% | 37 | 82 (72.1–90.0) | 63 (55.1–71.0) | 54 (44.8–63.3) | 87 (79.3–92.8) | 0.778
(0.718–0.830) |
| FPG,
mmol/l | 6.1 | 35.9
(25.3–47.6) | 88.9
(82.7–93.6) | 63.6
(47.8–77.6) | 72.1
(64.9–78.5) | 0.639
(0.572–0.702) |
|
HbA1c,% | 6.0 | 46 (34.1–57.2) | 64 (55.1–71.3) | 40 (29.4–50.8) | 69 (60.1–76.4) | 0.540
(0.472–0.607) |
| NDM |
|
| EZSCAN,
% | 50 | 53 (36.1–68.5) | 59 (47.3–70.0) | 40 (26.5–54) | 71 (58.2–81.4) | 0.528
(0.433–0.622) |
| FPG,
mmol/l | 7.0 | 45.0
(29.3–61.5) | 89.7
(80.8–95.5) | 69.2
(47.8–86.0) | 76.1
(66.1–84.4) | 0.772
(0.685–0.845) |
| HbA1c,
% | 6.5 | 59 (42.1–74.4) | 82 (71.4–89.7) | 62 (44.4–77.7) | 80 (69.2–88.0) | 0.759
(0.671–0.834) |
For those patients with IGT, the optimal cut-off
point for EZSCAN was 37%, which gave a sensitivity of 82%, a
specificity of 63% and an AUC of 0.778. This AUC for EZSCAN was
significantly higher than that for FPG (0.639; P=0.0164) and HbA1c
(0.540; P<0.001). For those patients with NDM, the optimal
cut-off point was 50%, which gave a sensitivity of 53%, a
specificity of 59% and an AUC of 0.528. This AUC for EZSCAN was
significantly lower than that for FPG (0.772; P=0.001) and HbA1c
(0.759; P=0.0012). A superior performance in detecting IGT was
recorded for the EZSCAN values, compared to those of FPG or HbA1c;
however, the EZSCAN values did not perform as well in detecting NDM
in this study population. In addition, the gender-specific
diagnostic performance of the EZSCAN values was evaluated. Table III shows the sensitivities,
specificities and EZSCAN values for women and men with IGT and NDM.
No significant difference in sensitivity or specificity between the
genders was observed for either an EZSCAN cut-off point of 37% for
those patients with IGT (P>0.05) or an EZSCAN cut-off point of
50% for those patients with NDM (P>0.05). In addition, the mean
EZSCAN values for women and men were not significantly different
(P>0.05). Thus, the diagnostic performance of EZSCAN was similar
for women and men.
| Table IIIEZSCAN™ diagnostic performances for
female and male patients. |
Table III
EZSCAN™ diagnostic performances for
female and male patients.
|
| IGT | NDM |
|
|---|
|
|
|
|
|
|---|
| Gender |
Sensitivitya,% |
Specificitya, % |
Sensitivitya, % |
Specificitya, % | EZSCAN
valueb |
|---|
| Female | 81 (66.9–90.2) | 63 (52.9–72.1) | 44 (24.4–65.1) | 57 (42.2–70.7) | 39±13.3 |
| Male | 75 (55.1–89.3) | 65 (49.8–78.6) | 53 (26.6–78.7) | 60 (49.8–89.2) | 41±13.7 |
| P-value | >0.05 | >0.05 | >0.05 | >0.05 | 0.26 |
Table IV shows the
percentages of patients with NGT, IGT and NDM that were identified
when different EZSCAN value cut-off points were used. Based on the
WHO criteria of 1999 (17), when the
37% cut-off point was used, 82.1% of patients with IGT were
correctly identified. When the 50% cut-off point was used, 57.5% of
patients with NDM were correctly identified; however, this higher
cut-off point also misclassified 19.3% of patients with NGT and
51.3% of patients with IGT. Again, the EZSCAN values performed well
in detecting previously undiagnosed IGT, but their performance in
detecting NDM was marginal, at best.
| Table IVIdentification of subjects with NGT,
IGT and NDM using different EZSCAN™ cut-off points. |
Table IV
Identification of subjects with NGT,
IGT and NDM using different EZSCAN™ cut-off points.
| EZSCAN cut-off
points, % | NGT, n (%) | IGT, n (%) | NDM, n (%) |
|---|
| ≥25 | 107 (73.8) | 78 (100.0) | 40 (100.0) |
| ≥31 | 60 (41.4) | 66 (84.6) | 35 (87.5) |
| ≥37 | 56 (38.6) | 64 (82.1) | 33 (82.5) |
| ≥43 | 47 (32.4) | 54 (69.2) | 29 (72.5) |
| ≥50 | 28 (19.3) | 40 (51.3) | 23 (57.5) |
| ≥56 | 12 (8.3) | 17 (21.8) | 6 (15.0) |
| ≥62 | 2 (1.4) | 6 (7.7) | 4 (10.0) |
Discussion
The results of this preliminary investigation
suggested that an EZSCAN cut-off point of 37% was optimal for
detecting previously undiagnosed IGT, as this gave a sensitivity of
82% and a specificity of 62%. A cut-off point of 50% was optimal
for detecting DM, with relatively low sensitivity and specificity
(53 and 59%, respectively). The present results are in accordance
with the hypothesis that the EZSCAN system is an acceptable tool
for screening patients with IGT and DM. In addition, this study is
the first, to the best of our knowledge, to demonstrate the
efficacy of the EZSCAN system in the screening of a specific
Chinese population.
Two previous studies using the EZSCAN system to
detect IGT and DM were conducted with French (10) and Indian (11) study populations. The investigation
that took place in France, where the device was developed,
demonstrated that the EZSCAN system had 75% sensitivity and 100%
specificity for diagnosing DM (10).
The investigation conducted in India also showed that EZSCAN had a
high sensitivity for detecting both IGT and DM. Using a cut-off
point of 50% for this Asian Indian population, the device showed a
sensitivity of 75% for detecting DM and 70% for detecting IGT
(11). A third study testing the
EZSCAN device was conducted with patients in Hong Kong, China;
however, its aim was to determine the optimal cut-off point (i.e.,
55%) for detecting DM-associated kidney disease (18). A fourth study (13) was conducted with a Chinese population
to establish the efficacy of EZSCAN screening for detecting DM;
however, the cut-off point used was provided by the French
manufacturer and was based on a French population (13). Despite this, and consistent with our
recent report (19), a good
reproducibility of the EZSCAN test was suggested in the Chinese
population.
The present study provided novel information
regarding the ethnic-specific cut-off values for the EZSCAN system
in a Chinese population. These values were determined by ROC
curves, which were generated following the classification of the
subjects based on their OGTT results, the gold standard test for
the diagnosis of IGT and DM according to the WHO recommended
guidelines (17). It was found that,
in this Chinese population, the EZSCAN cut-off points of 37 and 50%
were optimal for detecting IGT and DM, respectively.
Since there is strong evidence that lifestyle
management can reduce the rate of progression from IGT to DM, it is
important to identify all individuals with pre-DM so that
prevention efforts may be implemented in a timely manner (20). The present results have shown that,
when using the 37% cut-off point, the EZSCAN test had a higher
sensitivity and a significantly greater AUC for detecting IGT than
either the FPG or the HbA1c test. The EZSCAN test may therefore be
the most effective screening method and the most efficient way to
ensure early intervention in the Chinese population; however,
further studies with larger groups of patients would assist in
refining the cut-off point in order to more accurately detect this
pre-diabetic state.
It was also observed that the AUC for the detection
of NDM in the Chinese population using EZSCAN was significantly
lower than that for either the FPG or the HbA1c test. The EZSCAN
system did, however, have a relatively high sensitivity. We
speculate that the EZSCAN test may be a more effective screening
tool for the detection of IGT than for the detection of DM. A
possible explanation for this may be that the nerves associated
with the sweat glands are in a phase of hypersensitivity during the
IGT phase, but in a phase of hyposensitivity in DM (21); however, further studies are required
to confirm this speculation, as the EZSCAN values of the subjects
with IGT (47±11%) and those with NDM (48±11%) were virtually
identical.
It is a fact that the distribution of hyperglycemic
states can vary based on ethnicity. For example, Western and
Chinese populations have different proportions of patients with
elevated FPG concentrations (40 vs. 19%, respectively), elevated
2-h post-load plasma glucose concentrations (31 vs. 44%) and
elevated FPG with elevated 2-h post-load plasma glucose
concentrations (29 vs. 37%) (22,23). In
the present study population, the IGT state was the more frequently
represented compared with FPG. Since the results indicated that the
EZSCAN test had a higher sensitivity for detecting IGT, we
hypothesize that EZSCAN may be more suitable for detecting IGT in
Chinese populations. Future studies should investigate this
possibility.
As noted previously in the study, the EZSCAN test
has several advantages over traditional biochemical tests. Firstly,
an EZSCAN test can be performed without fasting or other patient
preparation (24). Secondly, this
test is non-invasive and rapid, which promotes patient comfort and
compliance. Thirdly, the test is highly sensitive, and is likely to
diagnose cases that may fall below the detection thresholds of
other methods. The major limitation of EZSCAN is its relatively low
specificity, and future studies should address this issue in order
to develop an improved EZSCAN strategy. It has been suggested in
previous studies (12,13) that the EZSCAN values may also be
affected by the environment, such as temperature and humidity, and
the age of the subjects; however, the subjects in the present study
were tested in a dehumidified room with air-conditioning, the
temperature of which was maintained at 20°C. The subjects were
neither extremely old nor extremely young. Consequently, none of
the factors mentioned above played a significant role in this
particular study; however, further studies are warranted for a
definite conclusion.
The present study had several limitations. Firstly,
due to the fact that this was a preliminary study investigating
screening efficacy, the sample size was relatively small,
preventing direct extrapolations of the observations to the general
population. Larger population-based studies comprising composite
population groups from different regions of China are required to
better evaluate the capabilities of EZSCAN in diagnosing IGT and
DM. Secondly, continuous glucose monitoring during the test day was
not possible in the present study population, and only one OGTT was
performed on each subject. The moderate correlations that were
observed between the EZSCAN values and blood glucose concentrations
were, in part, due to the rather high variability of the 2-h
post-load plasma glucose levels between individuals. A study with
an extensive dataset for temporal glucose monitoring may provide
more meaningful insights into these correlations.
In conclusion, the EZSCAN optimal cut-off points for
detecting IGT and DM in Chinese patients, independently of other
tests, were determined to be 37 and 50%, respectively. These
cut-off points were different from those recorded in previous
studies, whose subjects were of different ethnic groups, and may
aid clinicians in interpreting EZSCAN results for patients of
different ethnicities. Although the EZSCAN test is a promising
approach for performing non-invasive, convenient screenings for IGT
and DM in Chinese populations, further studies, focusing on larger,
more diverse Chinese sub-populations, are necessary. Despite this,
the results of the present study provide a foundation for
conducting future studies on the cost-effectiveness of EZSCAN
versus plasma glucose testing and for investigating the potential
of EZSCAN to predict future DM or micro- and macrovascular
complications.
References
|
1
|
Yang W, Lu J, Weng J, Jia W, Ji L, Xiao J,
Shan Z, Liu J, Tian H, Ji Q, et al: China National Diabetes and
Metabolic Disorders Study Group: Prevalence of diabetes among men
and women in China. N Engl J Med. 362:1090–1101. 2010. View Article : Google Scholar : PubMed/NCBI
|
|
2
|
Expert Committee on the Diagnosis and
Classification of Diabetes Mellitus. Report of the expert committee
on the diagnosis and classification of diabetes mellitus. Diabetes
Care. 26:(Suppl 1). S5–S20. 2003. View Article : Google Scholar : PubMed/NCBI
|
|
3
|
Knowler WC, Barrett-Connor E, Fowler SE,
et al: Diabetes Prevention Program Research Group: Reduction in the
incidence of type 2 diabetes with lifestyle intervention or
metformin. N Engl J Med. 346:393–403. 2002. View Article : Google Scholar : PubMed/NCBI
|
|
4
|
Chiasson JL, Josse RG, Gomis R, et al:
STOP-NIDDM Trial Research Group: Acarbose for prevention of type 2
diabetes mellitus: The STOP-NIDDM randomised trial. Lancet.
359:2072–2077. 2002. View Article : Google Scholar : PubMed/NCBI
|
|
5
|
American Diabetes Association: Standards
of medical care in diabetes - 2010 = Diabetes Care. 33:(Suppl 1).
S11–S61. 2010.
|
|
6
|
Adriaanse M, Snoek F, Dekker J, van der
Ploeg H and Heine R: Screening for Type 2 diabetes: An exploration
of subjects' perceptions regarding diagnosis and procedure. Diabet
Med. 19:406–411. 2002. View Article : Google Scholar : PubMed/NCBI
|
|
7
|
World Health Organization: Screening for
Type 2 Diabetes: Report of a World Health Organization and
International Diabetes Federation meeting. https://www.who.int/diabetes/publications/en/screeningmnc03.pdfAccessed.
March 26–2012.
|
|
8
|
Ealovega MW, Tabaei BP, Brandle M, Burke R
and Herman WH: Opportunistic screening for diabetes in routine
clinical practice. Diabetes Care. 27:9–12. 2004. View Article : Google Scholar : PubMed/NCBI
|
|
9
|
Brunswick P, Mayaudon H, Albin V, Lair V,
Ringuede A and Cassir M: Use of Ni electrodes chronoamperometry for
improved diagnostics of diabetes and cardiac diseases. Conf Proc
IEEE Eng Med Biol Soc. 2007:4544–4547. 2007.PubMed/NCBI
|
|
10
|
Mayaudon H, Miloche PO and Bauduceau B: A
new simple method for assessing sudomotor function: Relevance in
type 2 diabetes. Diabetes Metab. 36:450–454. 2010. View Article : Google Scholar : PubMed/NCBI
|
|
11
|
Ramachandran A, Moses A, Shetty S, et al:
A new non-invasive technology to screen for dysglycaemia including
diabetes. Diabetes Res Clin Pract. 88:302–306. 2010. View Article : Google Scholar : PubMed/NCBI
|
|
12
|
Hubert D, Brunswick P, Calvet JH, Dusser D
and Fajac I: Abnormal electrochemical skin conductance in cystic
fibrosis. J Cyst Fibros. 10:15–20. 2011. View Article : Google Scholar : PubMed/NCBI
|
|
13
|
Sheng CS, Zeng WF, Huang QF, Deslypere JP,
Li Y and Wang JG: Accuracy of a Novel Non Invasive technology based
EZSCAN system for the diagnosis of diabetes mellitus in Chinese.
Diabetol Metab Syndr. 3:362011. View Article : Google Scholar : PubMed/NCBI
|
|
14
|
Bao Y, Ma X, Li H, et al: Glycated
haemoglobin A1c for diagnosing diabetes in Chinese population:
Cross sectional epidemiological survey. BMJ. 340:c22492010.
View Article : Google Scholar : PubMed/NCBI
|
|
15
|
Seino Y, Nanjo K, Tajima N, et al:
Committee of the Japan Diabetes Society on the Diagnostic Criteria
of Diabetes Mellitus: Report of the committee on the classification
and diagnostic criteria of diabetes mellitus. J Diabetes Investig.
1:212–228. 2010. View Article : Google Scholar : PubMed/NCBI
|
|
16
|
Kashiwagi A, Kasuga M, Araki E, et al:
Committee on the Standardization of Diabetes Mellitus-Related
Laboratory Testing of Japan Diabetes Society: International
clinical harmonization of glycated hemoglobin in Japan: From Japan
Diabetes Society to National Glycohemoglobin Standardization
Program values. J Diabetes Investig. 3:39–40. 2012. View Article : Google Scholar : PubMed/NCBI
|
|
17
|
World Health Organization: Definition,
diagnosis and classification of diabetes mellitus and its
complications: report of a WHO consultation. Part 1: Diagnosis and
classification of diabetes mellitus. https://www.staff.ncl.ac.uk/philip.home/who_dmg.pdfAccessed.
February 26–2010.
|
|
18
|
Ozaki R, Cheung KK, Wu E, et al: A new
tool to detect kidney disease in Chinese type 2 diabetes patients:
Comparison of EZSCAN with standard screening methods. Diabetes
Technol Ther. 13:937–943. 2011. View Article : Google Scholar : PubMed/NCBI
|
|
19
|
Chen L, Chen X, Ding R, Shi Q Jr and Hu D:
Evaluation of EZSCAN as a screening tool for impaired glucose
metabolism. Diabetes Res Clin Pract. 100:210–214. 2013. View Article : Google Scholar : PubMed/NCBI
|
|
20
|
Tuomilehto J, Lindström J, Eriksson JG,
Valle TT, Hämäläinen H, Ilanne Parikka P, Keinänen Kiukaanniemi S,
Laakso M, Louheranta A, Rastas M, et al: Finnish Diabetes
Prevention Study Group: Prevention of type 2 diabetes mellitus by
changes in lifestyle among subjects with impaired glucose
tolerance. N Engl J Med. 344:1343–1350. 2001. View Article : Google Scholar : PubMed/NCBI
|
|
21
|
Hilsted J and Low PA: Diabetic autonomic
neuropathyClinical Autonomic Disorders: Evaluation and Management.
Low PA: 2nd. Lippincott-Raven; Philadelphia, PA: pp. 487–507.
1997
|
|
22
|
No authors listed. Will new diagnostic
criteria for diabetes mellitus change phenotype of patients with
diabetes? Reanalysis of European epidemiological data. DECODE Study
Group on behalf of the European Diabetes Epidemiology Study Group.
BMJ. 317:371–375. 1998. View Article : Google Scholar : PubMed/NCBI
|
|
23
|
Qiao Q, Nakagami T, Tuomilehto J, Borch
Johnsen K, Balkau B, Iwamoto Y and Tajima N: International Diabetes
Epidemiology Group; DECODA Study Group: Comparison of the fasting
and the 2 h glucose criteria for diabetes in different Asian
cohorts. Diabetologia. 43:1470–1475. 2000. View Article : Google Scholar : PubMed/NCBI
|
|
24
|
Schwarz P, Brunswick P and Calvet JH:
EZSCAN™ a new technology to detect diabetes risk. Br J Diabetes
Vasc Dis. 11:204–209. 2011. View Article : Google Scholar
|