Introduction
Coronary artery disease (CAD) is the most common
cardiovascular disease, and its incidence increases in the elderly
(1). Early detection and
intervention for left ventricular (LV) dysfunction are of great
importance in patients with CAD (2).
Echocardiography is noninvasive, inexpensive and convenient. The
detection of patients with CAD by this method is likely to improve
the benefit-risk ratio in patients.
During recent years, strain and strain rate imaging
echocardiography have emerged as valuable tools that provide a
comprehensive and reliable assessment of myocardial function
(3–5). Studies have suggested that
two-dimensional speckle-tracking echocardiography (2D-STE) can be
used to assess LV systolic dysfunction (6,7).
However, 2D-STE has intrinsic limitations, such as long examination
times, a geometric assumption of LV morphology, and mistracking if
speckles move out of the scanning plane (8,9).
However, three-dimensional speckle-tracking
echocardiography (3D-STE) is free of geometric assumptions and
speckles moving out of the scanning plane. In addition, 3D-STE is
less time-consuming than conventional 2D-STE (10,11). It
provides an accurate and convenient assessment of LV function
(12) and has been shown to be
useful in the detection of subclinical LV dysfunction in patients
with early-stage heart failure (13)
and hypertension (14). In the
present study, the aim was to investigate the incremental value of
resting 3D-STE in the detection of LV dysfunction in patients with
CAD and to identify sensitive indicators for the detection of
CAD.
Patients and methods
Study population
The study evaluated 110 patients (68 males; age,
63±9 years) who were suspected of having CAD and who were referred
for coronary artery angiography (CAG) at Beijing Hospital (Beijing,
China) between June 2010 and August 2012. The mean height of the
patients was 166.4±7.8 cm and the body weight was 72.7±10.2 kg. The
exclusion criteria were arrhythmia, a history of myocardial
infarction and percutaneous coronary intervention (PCI), heart
failure, cardiomyopathy, valvular heart diseases, congenital heart
disease and poor 3D image quality. The present study was approved
by the Ethics Committees of Beijing Hospital of the Ministry of
Health (Beijing, China). All of the patients in the study signed an
informed consent form.
Echocardiographic image acquisition
and analyses
Echocardiographic data were acquired with a Artida
SSH-880A ultrasound system (Toshiba, Nasu, Japan), which was
equipped with a 2D transducer (frequency, 1–5 MHz), 3D volume
transducer, 3D speckle-tracking analysis software and a background
processing workstation. Firstly, general 2D ultrasonic detectors
were used to collect images of the parasternal long axis, short
axis and apical four-chamber view. During the inspection, all
patients were connected to timing ECG, and maintained in the left
lateral decubitus position. Secondly, following conversion to the
3D volume transducer with an apical four-chamber view, the pre-4D
mode was selected to obtain a clear image of the LV endocardium.
Then, as the full-4D mode was entered, the patient was asked to
hold their breath at the end of expiration. The imaging angle was
maintained at (70–80°)×(70–80°) and cardiac 3-D images in the form
of full-4D dynamic images were collected and stored.
The stored dynamic cardiac images were extracted in
the off-line state. This involved entering ‘3DT (three-dimensional
speckle tracking) mode’, adjusting the baseline and angle, clearly
displaying the image of the endocardium, mitral annulus and apex,
and speckle assignment on plane A and plane B separately. The
instrument then speckle-tracked automatically when the ‘start’
button was pressed. The curve of the endocardium was drawn (in
chart 1), and the software analyzed the data and calculated the
peak value strains [longitudinal strain (LS), circumferential
strain (CS), radial strain (RS) and area strain (AS) of 16 sections
of the left ventricle and the time to peak value of the
strains.
Observational indices
Strain values and the time to peak value of the
strain for 16 local myocardial segments from the 3D-STI were
observed. The strain values were RS, CS, LS and AS. The time to
peak values for the strains were time to peak radial strain (T-RS),
time to peak circumferential strain (T-CS), time to peak
longitudinal strain (T-LS) and time to peak area strain (T-AS).
Statistical analysis
The observation indices were numerical variable
data. After establishing the database, with the use of Excel
(Microsoft Corporation, Redmond, WA, USA) and SPSS version 16.0
(SPSS, Inc., Chicago, IL, USA), binary logistic regression analysis
and receiver operator characteristic curves (ROCs) were used to
analyze the sensitivity of the strains for the diagnosis of the
CAD. P<0.05 was considered to indicate a statistically
significant difference.
Results
Results of CAG
According to the CAG results, of the 110 patients
enrolled, 68 exhibited CAD (levels 1–4), which were assigned to the
CAD group. The other patients (level 0) were designated the non-CAD
group (Table I).
 | Table I.Results of CAG of 110 patients with
suspected CAD. |
Table I.
Results of CAG of 110 patients with
suspected CAD.
|
| Level |
|
|---|
|
|
|
|
|---|
| Artery | 0 | 1 | 2 | 3 | 4 | Total count |
|---|
| LAD | 23 | 19 | 17 | 47 | 4 | 87 |
| LCX | 51 | 11 | 13 | 27 | 8 | 59 |
| RCA | 43 | 20 | 16 | 25 | 6 | 67 |
3D-STI evaluation of LV local function
in different graded stenoses of coronary arteries
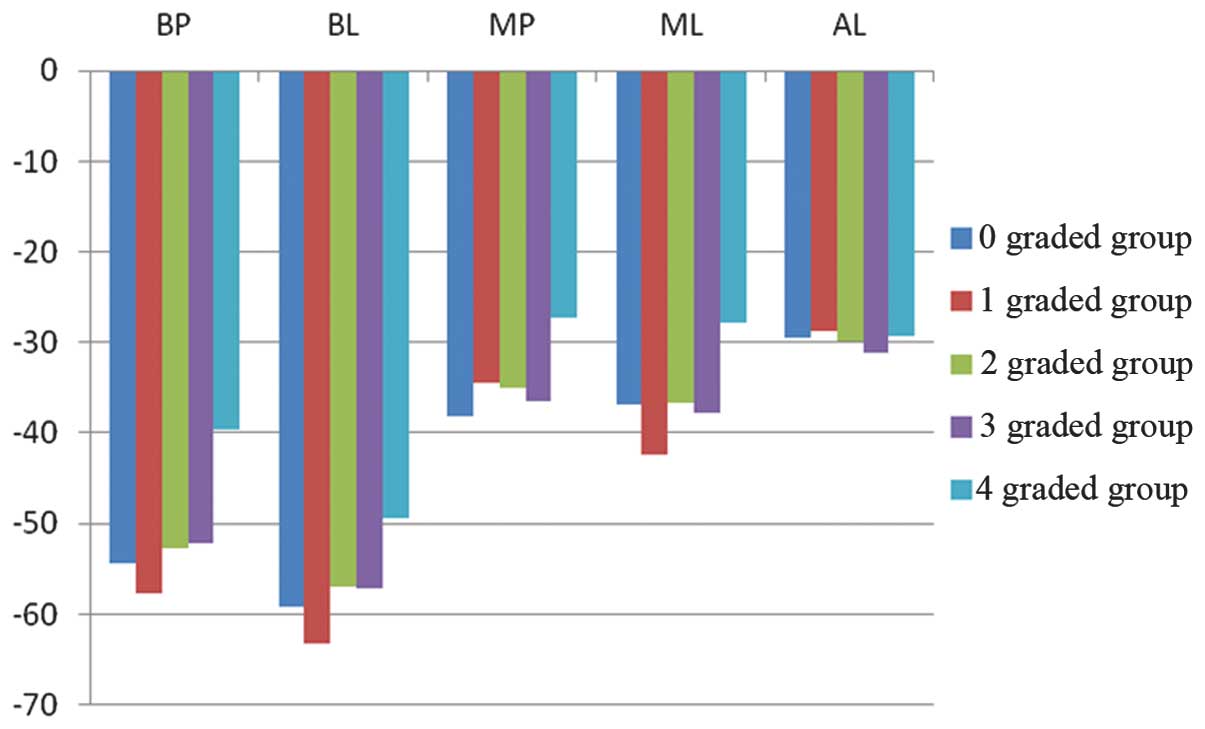
Generally, it was observed that the peak value of
strain of local segments of the left ventricle decreased as the
stenosis degree of the supplied vessel increased, that is, the
higher the degree of stenosis the lower the peak value. When
considering the time to the peak value of strain, the inverse
relationship was observed, that is, the higher the degree of
stenosis the longer the time to the peak value. In addition, these
relationships were most evident at the highest graded degree of
stenosis.
For example, the peak value of AS of certain
segments supplied by the left circumflex (LCX) artery exhibited a
reduction in differently graded coronary stenosis groups. The
higher the grade of stenosis the lower the peak value of AS
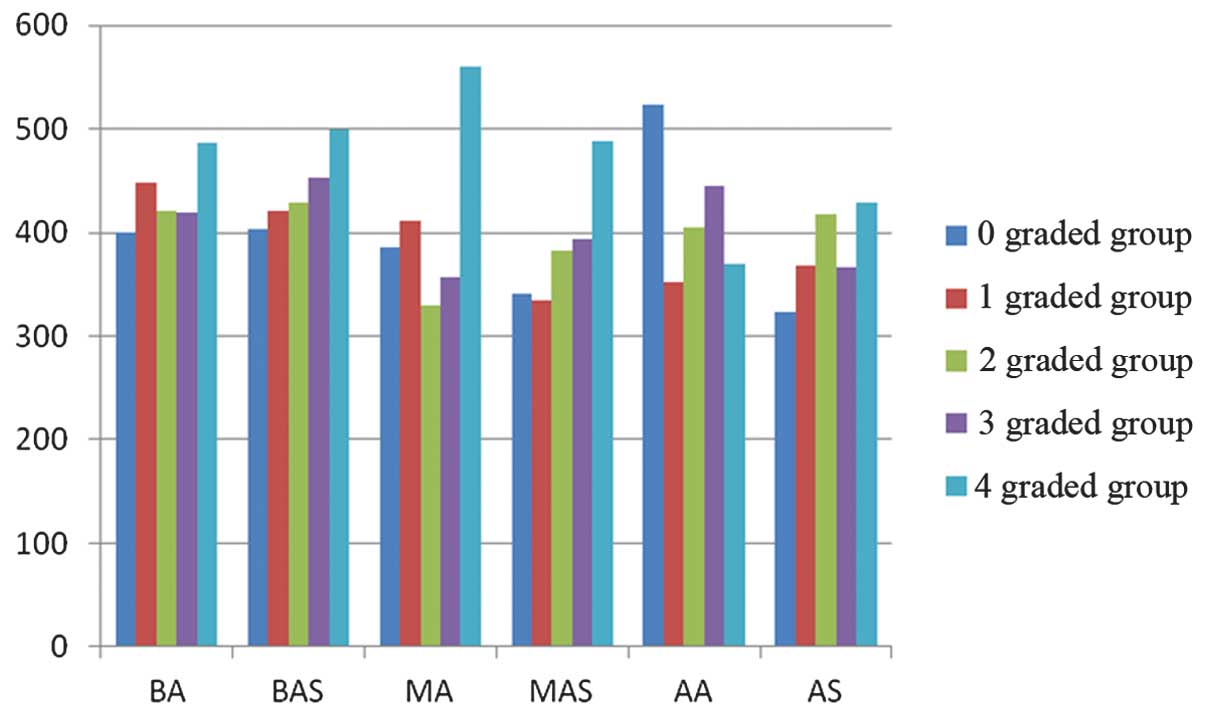
(Fig. 1). In addition, the T-LS of
certain segments supplied by the left anterior descending artery
ascended in differently graded coronary stenosis groups (Fig. 2).
ROC curve and sensitive
indicators
ROC curves were used to analyze the peak value and
the time to peak value of the strains that were measured by 3D-STE,
in order to investigate whether 3D-STE has value for the early
detection of CAD and to identify sensitive indicators.
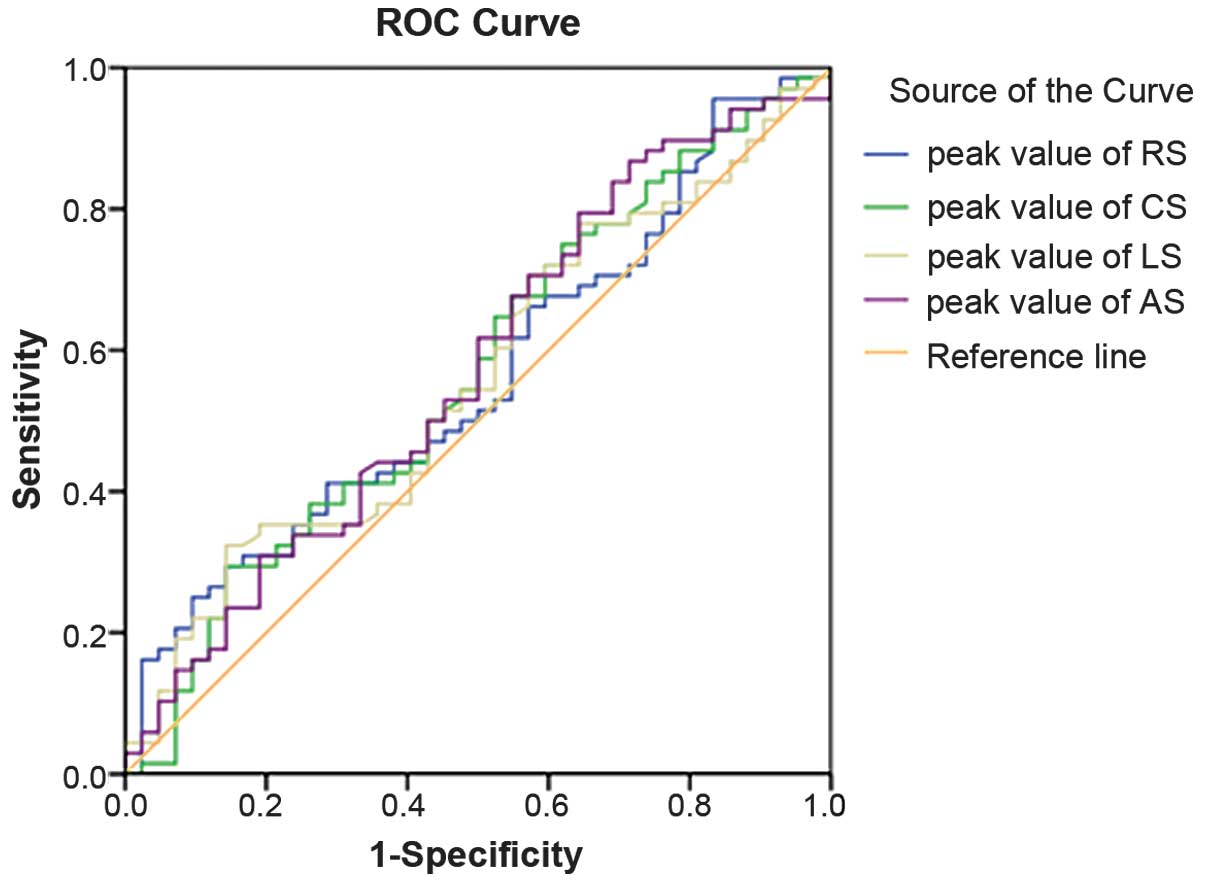
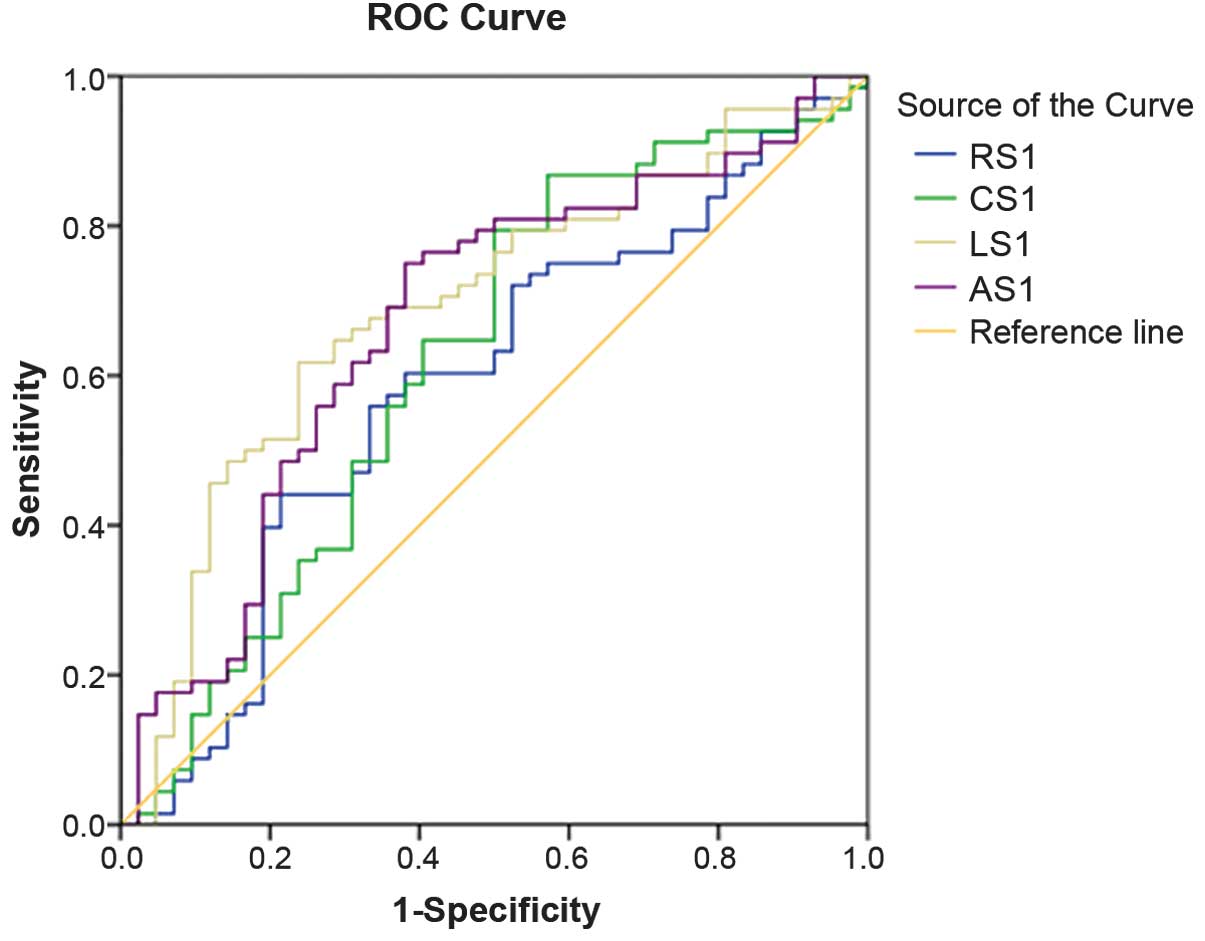
In this study, three kinds of ROC were generated.
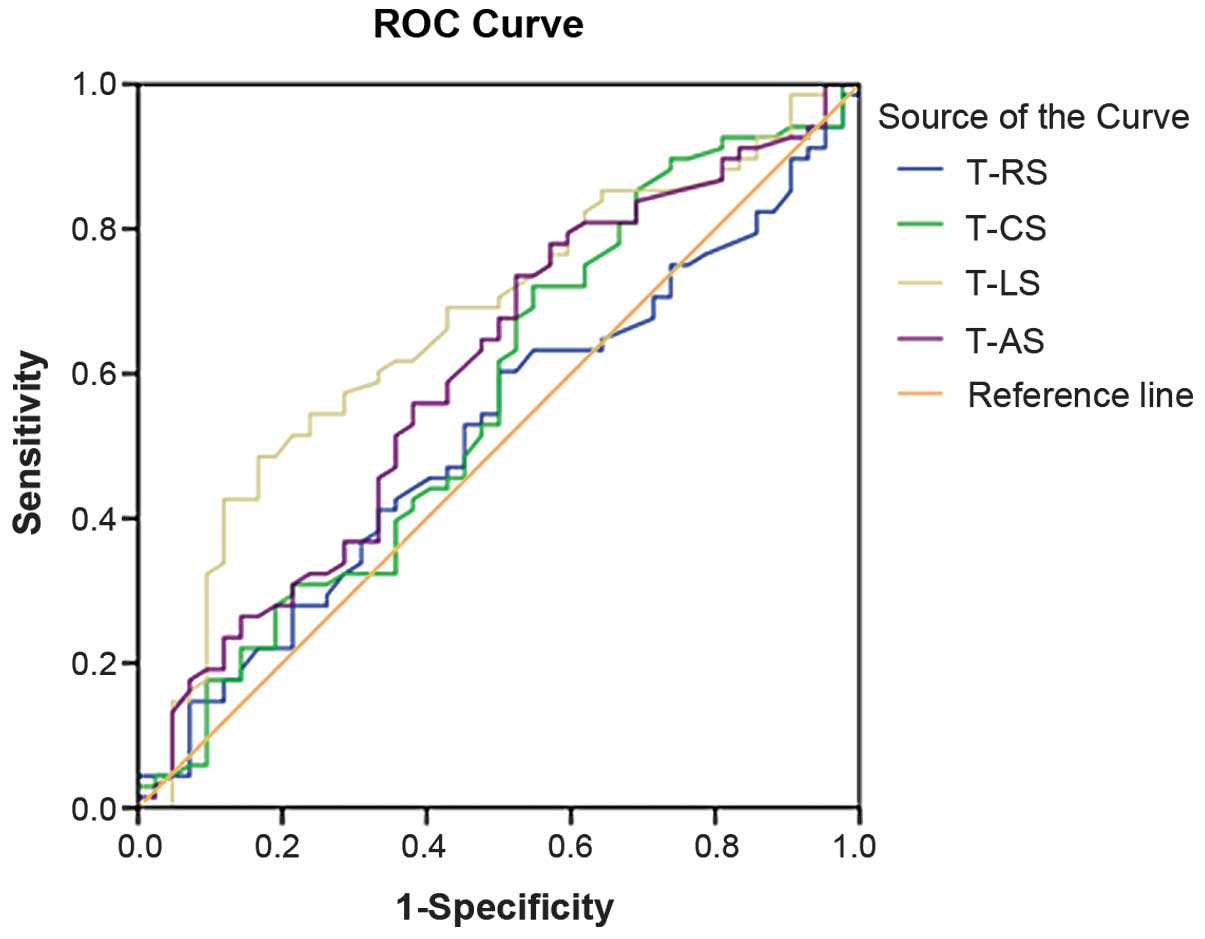
One was for the peak strains RS, CS, LS and AS (Fig. 3), one was for the time to the peak
strain, which comprised T-RS, T-CS, T-LS and T-AS (Fig. 4), and the third was for the composite
index. The composite indices were designated RS1, CS1, LS1 and AS1
(Fig. 5), which were combinations of
the peak strain value and time to peak of the RS, CS, LS and AS,
respectively. Through the ROC analysis, an area under the curve
(AUC) was determined for each index.
Analysis of the ROC curves and AUCs, revealed that
each individual peak value of strain, namely RS, CS, LS and AS, had
no diagnostic value for the early detection of CAD (P>0.05).
Only T-LS had statistical significance in the diagnosis of CAD
(P=0.003, AUC=0.667). However, the composite index of peak strain
and time to peak strain had significantly higher sensitivity for
the detection of CAD. The AUC of CS1 was 0.621 (P=0.034), of LS1
was 0.692 (P=0.001) and of AS1 was 0.672 (P=0.003). This suggests
that resting 3D-STE had value for the early detection of CAD, and
the sensitive indicators were T-LS, CS1, LS1 and AS1. In addition,
the AUC decreases in the order LS1 > AS1 > T-LS > CS1
(Table II), which means that LS1
has the highest diagnostic value for CAD.
| Table II.Sensitivity and specificity of the
sensitive indicators. |
Table II.
Sensitivity and specificity of the
sensitive indicators.
| Sensitive
indicators | AUC | Sensitivity % | Specificity % |
|---|
| LS1 | 0.692 | 61.8 | 76.2 |
| AS1 | 0.672 | 75.0 | 61.9 |
| T-LS | 0.667 | 48.5 | 83.3 |
| CS1 | 0.621 | 86.8 | 42.9 |
In summary, it may be concluded that the T-LS and
the composite indices that combine peak value and time to peak of
the longitudinal, circumferential and area strains have diagnostic
value for CAD. The AUCs are 0.667, 0.692, 0.621 and 0.672,
respectively (P<0.005). LS1 had the best diagnostic value for
the CAD and was found to have 62% sensitivity and 76% specificity
for the detection of CAD. However, the peak values of LS, C-S, RS
and AS and the T-CS, T-RS and T-AS were not identified to be of
diagnostic value for CAD.
Excellent diagnostic value and
individual prediction
Through the analysis of the ROC of LS1, it was
determined that the maximum Youden index was 0.38 and the excellent
diagnostic probability value (Pexce) of the LS1 was
Pexce=0.615. Pexce is an ROC-derived
statistical index that indicates the likelihood of a positive
diagnosis. In the excellent diagnostic value, the sensitivity and
the specificity were 61.8% and 76.2% respectively.
For individual prediction, the individual prediction
probability (Pindi) may be determined and compared with
the Pexce. Pindi is a probability value that
can be used to predict whether the individual patient is likely to
have the disease or not, and can be compared with Pexce.
When the Pindi is greater, a positive individual
judgment can be made, which is that the patient can be diagnosed
with CHD. For calculating Pindi of LS1, this study
established a binary logistic regression equation through logistic
regression analysis, as follows: Pindi=1/[1+e−
(−1.513+0.1×(LS-peak value)+0.009×(LS-time to peak value))].
Therefore, when the 3D-STE for the patient was completed, the peak
value and the time to peak value of LS were obtained by the
analysis software, and Pindi was calculated. Finally,
through the comparison of Pindi with Pexce,
an early decision of whether the patient has CHD or not could be
made.
Discussion
Speckle-tracking strain imaging has been
demonstrated to be an appropriate method for the examination of
global and regional LV functional properties (15,16),
which was confirmed in the present study. In this study, it was
found that changes in the peak value and time to peak value of
certain strains accorded with the physiological characteristics of
the left ventricle.
Secondly, through the ROC analysis of each parameter
measured by 3D-STE, certain sensitive indicators for the detection
of CAD by 3D-STE were identified. These were T-LS and the composite
indices LS1, AS1 and CS1. Among them, LS1 had the highest
diagnostic value for CAD, with an AUC of 0.692. With regard to
excellent diagnostic value, the sensitivity and specificity were
61.8 and 76.2%, respectively.
By convention, myocardial deformation is divided
into three directions (17). LS and
CS are considered to reflect the contraction of longitudinally
arranged endocardial fibers and circumferentially arranged midlayer
fibers, respectively. In general, the longitudinally arranged
subendocardial fibers are more vulnerable due to their direct
exposure to the intraventricular blood pressure and the anatomy of
the coronary circulation (18,19). As
a result, longitudinal function is impaired first in many diseases,
including CAD.
Severe CAD is known to lead to LV dysfunction.
However, the LV ejection fraction is usually normal at a relatively
early stage, particularly at the rest status (20). Thus, establishing a more sensitive
index for early-stage LV dysfunction is of great importance. In the
present study, it was demonstrated that resting 3D-STE had
incremental value for the prompt detection of coronary lesions and
a logistic regression equation was established. Therefore, in the
clinic, if the peak value and the time to peak value of LS are
obtained through 3D-STE, it should be possible to make a
preliminary judgment as to whether the patient has CHD or not. This
provides more information when making decisions about CAG
surgery.
In the present study, it was confirmed that the
resting 3D-STE had certain incremental value in the detection of
CAD, but the sensitivity and specificity were not high enough.
Future studies of stress echocardiography are planned, which aim to
improve the sensitivity. In addition, an evaluation model may be
established through the addition of risk factors such as
hypertension, diabetes, smoking and hyperlipidemia.
In conclusion, 3D-STE has incremental value for the
diagnosis of CAD in patients at rest. LS1 has the highest
sensitivity of 61.8% for the early detection of CAD. 3D-STE has the
potential to improve the value of echocardiography in the detection
of the CAD and to provide more information for clinical
physicians.
References
|
1
|
Dobesh PP, Beavers CJ, Herring HR, et al:
Key articles and guidelines in the management of acute coronary
syndrome and in percutaneous coronary intervention: 2012 update.
Pharmacotherapy. 32:e348–e386. 2012. View Article : Google Scholar : PubMed/NCBI
|
|
2
|
Gaemperli O: Role of noninvasive imaging
in cardiology. Praxis (Bern 1994). 102:29–37. 2013.(In German).
View Article : Google Scholar : PubMed/NCBI
|
|
3
|
Health Quality Ontario: Stress
echocardiography for the diagnosis of coronary artery disease: an
evidence-based analysis. Ont Health Technol Assess Ser. 10:1–61.
2010.
|
|
4
|
Hoit BD: Strain and strain rate
echocardiography and coronary artery disease. Circ Cardiovasc
Imaging. 4:179–190. 2011. View Article : Google Scholar : PubMed/NCBI
|
|
5
|
Dandel M and Hetzer R: Echocardiographic
strain and strain rate imaging - clinical applications. Int J
Cardiol. 132:11–24. 2009. View Article : Google Scholar : PubMed/NCBI
|
|
6
|
Shimoni S, Gendelman G, Ayzenberg O, et
al: Differential effects of coronary artery stenosis on myocardial
function: the value of myocardial strain analysis for the detection
of coronary artery disease. J Am Soc Echocardiogr. 24:748–757.
2011. View Article : Google Scholar : PubMed/NCBI
|
|
7
|
Kouzu H, Yuda S, Muranaka A, et al: Left
ventricular hypertrophy causes different changes in longitudinal,
radial, and circumferential mechanics in patients with
hypertension: a two-dimensional speckle tracking study. J Am Soc
Echocardiogr. 24:192–199. 2011. View Article : Google Scholar : PubMed/NCBI
|
|
8
|
Saito K, Okura H, Watanabe N, et al:
Comprehensive evaluation of left ventricular strain using speckle
tracking echocardiography in normal adults: comparison of
three-dimensional and two-dimensional approaches. J Am Soc
Echocardiogr. 22:1025–1030. 2009. View Article : Google Scholar : PubMed/NCBI
|
|
9
|
Biswas M, Sudhakar S, Nanda NC, et al:
Two- and three-dimensional speckle tracking echocardiography:
clinical applications and future directions. Echocardiography.
30:88–105. 2013. View Article : Google Scholar : PubMed/NCBI
|
|
10
|
Urbano-Moral JA, Patel AR, Maron MS, et
al: Three-dimensional speckle-tracking echocardiography:
methodological aspects and clinical potential. Echocardiography.
29:997–1010. 2012. View Article : Google Scholar : PubMed/NCBI
|
|
11
|
Altman M, Bergerot C, Aussoleil A, et al:
Assessment of left ventricular systolic function by deformation
imaging derived from speckle tracking: a comparison between 2D and
3D echo modalities. Eur Heart J Cardiovasc Imaging. 15:316–323.
2014. View Article : Google Scholar : PubMed/NCBI
|
|
12
|
Thorstensen A, Dalen H, Hala P, et al:
Three-dimensional echocardiography in the evaluation of global and
regional function in patients with recent myocardial infarction: A
comparison with magnetic resonance imaging. Echocardiography.
30:682–692. 2013. View Article : Google Scholar : PubMed/NCBI
|
|
13
|
Li CM, Li C, Bai WJ, et al: Value of
three-dimensional speckle-tracking in detecting left ventricular
dysfunction in patients with aortic valvular diseases. J Am Soc
Echocardiogr. 26:1245–1252. 2013. View Article : Google Scholar : PubMed/NCBI
|
|
14
|
Galderisi M, Esposito R,
Schiano-Lomoriello V, et al: Correlates of global area strain in
native hypertensive patients: A three-dimensional speckle-tracking
echocardiography study. Eur Heart J Cardiovasc Imaging. 13:730–738.
2012. View Article : Google Scholar : PubMed/NCBI
|
|
15
|
Seo Y, Ishizu T, Enomoto Y, et al:
Validation of 3-dimensional speckle tracking imaging to quantify
regional myocardial deformation. Circ Cardiovasc Imaging.
2:451–459. 2009. View Article : Google Scholar : PubMed/NCBI
|
|
16
|
Luis SA, Yamada A, Khandheria BK, et al:
Use of three-dimensional speckle-tracking echocardiography for
quantitative assessment of global left ventricular function: a
comparative study to three-dimensional echocardiography. J Am Soc
Echocardiogr. 27:285–291. 2014. View Article : Google Scholar : PubMed/NCBI
|
|
17
|
Urbano-Moral JA, Arias-Godinez JA, Ahmad
R, et al: Evaluation of myocardial mechanics with three-dimensional
speckle tracking echocardiography in heart transplant recipients:
comparison with two-dimensional speckle tracking and relationship
with clinical variables. Eur Heart J Cardiovasc Imaging.
14:1167–1173. 2013. View Article : Google Scholar : PubMed/NCBI
|
|
18
|
Tsai WC, Liu YW, Huang YY, et al:
Diagnostic value of segmental longitudinal strain by automated
function imaging in coronary artery disease without left
ventricular dysfunction. J Am Soc Echocardiogr. 23:1183–1189. 2010.
View Article : Google Scholar : PubMed/NCBI
|
|
19
|
Jasaityte R, Heyde B and Dhooge J: Current
state of three-dimensional myocardial strain estimation using
echocardiography. J Am Soc Echocardiogr. 26:15–28. 2013. View Article : Google Scholar : PubMed/NCBI
|
|
20
|
Parato VM, Mehta A, Delfino D, et al:
Resting echocardiography for the early detection of acute coronary
syndromes in chest pain unit patients. Echocardiography.
27:597–602. 2010. View Article : Google Scholar : PubMed/NCBI
|