Introduction
Lower limb ischemia typically occurs as a result of
peripheral arterial disease (PAD) and manifests with foot ulcers
and necrotic lesions that may require amputation, severely
affecting patients' quality of life (1). Early-stage diabetes may be accompanied
by vascular malformation, atherosclerosis and thrombotic plaque
(2). Diabetic lower limb ischemia
frequently occurs in diabetic patients with an extensive medical
history. In the early stages of ischemia, the disease presents with
no clear symptoms. However, following the emergence of clinical
symptoms, irreversible pathological damage may occur in the blood
vessels, which complicates treatment. Therefore, methods for the
early diagnosis of diabetes-associated lower limb ischemia are
required to reduce the risk for diabetic patients with PAD and
ensure quality of life. A previous study indicated that the
systemic inflammation factor C-reactive protein (CRP) may function
as a diagnostic marker for increased risk of PAD (3). However, CRP is not a specific
diagnostic marker for PAD and there are a number of limitations to
its use (4).
The cysteine proteinase inhibitor cystatin C is
composed of 120 amino acid residues and is expressed in various
organisms, including plants, animals and protozoa. The gene
encoding cystatin C is located on band 2, area 13 in the short arm
of human chromosome 20. The gene is ∼4.3 kb in length, including 3
exons and 2 introns, and may be consistently transcribed and
translated in all nucleated cells (5). Under physiological conditions, cystatin
C is able to inhibit endogenous cysteine protease activity.
Previous studies demonstrated that cystatin C is a sensitive
indicator for evaluating early kidney damage; however, recent
studies have indicated that the imbalanced expression of cystatin C
is notably associated with the occurrence and development of
cardiovascular diseases, including hypertension, coronary heart
disease, atherosclerosis and diabetic lower limb ischemia (6–9).
Furthermore, Liu et al observed a significant association
between the expression of cystatin C and diabetic lower limb
ischemia, with elevated expression of cystatin C indicating an
increased risk of lower limb ischemia in diabetic patients
(10).
MicroRNAs (miRNAs) are a group of small non-coding
RNAs, typically 18–22 nucleotides in length, that are able to
regulate gene expression. miRNAs regulate target genes by
interfering with transcription or inhibiting translation, in
addition to participating in numerous signaling pathways. miRNAs
are widely expressed in various body fluids, including blood
(plasma, blood platelet, red blood cells and nucleated blood cells)
and urine, and are not degraded by endogenous RNA polymerases
(11). In addition, numerous reports
have indicated that blood miRNAs function as signaling molecules in
intercellular signaling pathways (12,13).
miRNAs serve crucial functions in multiple cardiovascular cell
processes, including development, proliferation, migration,
apoptosis, metabolism, damage, regeneration, repair and phenotype
change. miRNAs also participate in the occurrence and development
of numerous cardiovascular diseases, including coronary heart
disease, myocardial infarction, heart failure, hypertension,
arrhythmia, myocardial fibrosis, cardiac hypertrophy and heart
failure (14–16). Furthermore, miRNAs possess marked
tissue, pathological and normal-state specificity and sensitivity,
which are criteria of ideal biomarkers. In the process of
atherosclerosis, circulating platelets in the blood may directly
adhere to vascular lesion sites and release various regulatory
factors, including miRNAs, accelerating disease progression
(17).
The present study aimed to investigate the
association between miR-92a and cystatin C expression levels. In
addition, the potential use of miR-92a as a new diagnostic marker
for diabetic lower limb ischemia was further analyzed.
Materials and methods
Patient selection
Between May 2012 to December 2013, 199 patients
diagnosed with diabetes were enrolled in this study. Patients were
grouped according to their ankle-brachial index (ABI) score, as
follows: Patients with an ABI score of 0.91–1.30 formed the simple
type II diabetes mellitus group (T2DM group; n=60), patients with
an ABI of 0.41–0.90 comprised the diabetes with light to moderate
lower limb ischemia group (LLI-LM group; n=70) and patients with an
ABI <0.40 comprised the diabetes with severe lower limb ischemia
group (LLI-S group, n=69). The gender composition of each group was
as follows: T2DM group, 30 males and 30 females; LLI-LM group, 40
males and 30 females; and the LLI-S group, 38 males and 31 females.
Furthermore, 60 healthy outpatients were selected at random over
the same period as a control population, which consisted of 32
males and 28 females. Patients with diabetes (screened using the
oral glucose tolerance test), hypertension, other endocrine and
metabolic diseases, or a family history of diabetes were excluded
from the control population. In addition, subjects were excluded if
they exhibited infection, diabetic ketoacidosis, blood system
diseases, and any history of cancer, hormone drug use or surgical
stress. Prior written informed consent was obtained from all
patients and the study protocol was approved by the ethics
committee of Shandong Provincial Hospital (Jinan, China).
Clinical data and biochemical
indices
Height, weight, waist and hip circumference, and
systolic and diastolic blood pressure were measured for each
patient, and the body mass index (BMI) and waist-hip ratio were
subsequently calculated. Cystatin C was detected using immune
transmission nephelometry (Shanghai Beijia Medical Devices Co.
Ltd., Shanghai, China). Total cholesterol (TC) and fasting plasma
glucose (FPG) were detected using the Total Cholesterol and Blood
Glucose Test kits (Shenzhen Mindray Bio-Medical Electronics Co.,
Ltd., Shenzhen, China) according to the manufacturers'
instructions. Triglyceride (TG) levels were determined using the TG
Assay kit (Shenzhen Mindray Bio-Medical Electronics Co., Ltd.)
according to the manufacturers' instructions. High density
lipoprotein cholesterol (HDL-C) and low density lipoprotein
cholesterol (LDL-C) were detected using a HDL-C Assay kit (Shenzhen
Mindray Bio-Medical Electronics Co., Ltd.). Hemoglobin A1c
(HbA1c) was detected by high pressure liquid
chromatography (HLC-723G7; Tosoh, Tokyo, Japan) and fasting insulin
(FINS) using an Insulin Assay kit (Siemens Healthcare Diagnostics
Inc., Erlangen, Germany). Homeostasis model assessment of insulin
resistance (HOMA-IR) was employed, using the formula: HOMA-IR =
[FINS (mU/l) × FPG (mmol/l)]/22.5. Patient bilateral limb ABI data
were obtained using a Philips iU22 Doppler Ultrasound system
(Philips Healthcare, Best, The Netherlands). ABI was calculated
using the formula: ABI = ankle artery systolic/brachial artery
systolic blood pressure.
Leukocyte-depleted platelet (LDP)
preparation
Peripheral blood samples were collected and citrate
dextrose (85 mM trisodium citrate, 78 mM citrate and 111 mM
glucose) was then added, followed by centrifugation at 80 × g for
10 min. EDTA (2 mM) was added to the platelet-rich plasma, and
platelets were precipitated by centrifugation at 1,000 × g for a
further 10 min. The pellet was resuspended in 3 ml bead buffer
(0.8% NaCl, 0.02% KCl, 0.144% Na2HPO4, 0.024%
KH2PO4, 0.5% bovine serum albumin and 2 mM
EDTA) and 40 µl human CD45 MicroBeads reagent (Miltenyi Biotec,
Bergisch Gladbach, Germany) was added, followed by incubation at
room temperature for 45 min with gentle mixing. A MACS magnetic
bead separation system (Miltenyi Biotec) was employed to separate
LDPs and obtain platelets with >99.99% purity.
Bioinformatics
The online prediction software packages miRWalk
(http://www.umm.uni-heidelberg.de/apps/zmf/mirwalk/),
miRanda (http://www.microrna.org/) and Targetscan
(http://www.targetscan.org) were used to
predict genes potentially involved in the regulation of cystatin C
expression, using the cystatin C gene sequence. The presence of any
predicted gene in platelets, and its effect when transfected into
endothelial cells were subsequently investigated.
Cell culture and transfection
Human pulmonary artery endothelial cells were
purchased from the American Type Culture Collection (ATCC,
Manassas, VA, USA). The cells were cultured in Dulbecco's modified
Eagle's medium (DMEM) containing 10% fetal bovine serum (FBS) and
maintained in a tissue-culture incubator at 37°C with an atmosphere
of 95% O2 and 5% CO2.
For cell transfection, pGCMV/EGFP/miR-92a mimic and
inhibitor plasmids were purchased from Invitrogen Life Technologies
(Carlsbad, CA, USA) and were transfected into the endothelial cells
using Liposome 2000 (Invitrogen Life Technologies) according to the
manufacturer's instructions. Briefly, cells at the logarithmic
phase were seeded into 24-well plates at 2×10⁵/well one
day prior to transfection. The following day, at a cell confluence
of 80%, the cells were transfected with pGCMV/EGFP/miR-92a mimic or
inhibitor using Liposome 2000 and incubated with OptiMEM I
(Invitrogen Life Technologies) for 6 h. Endothelial cells without
transfection (endothelial cell control, EC) and with mock
transfection (negative control, NC) were used as controls. At 4 h
after transfection, the transfection medium was replaced with DMEM
high glucose culture medium containing 10% FBS. Cells were
collected at 48 h following transfection for further analysis.
SYBR-green fluorescence reverse
transcription-quantitative polymerase chain reaction (RT-qPCR)
Total RNA was extracted from the patient's platelets
or transfected endothelial cells using TRIzol reagent (Invitrogen
Life Technologies) according to the manufacturer's instructions.
The extracted RNA was reverse transcribed into cDNA using an M-MLV
reverse transcription kit (Takara Biotechnology Co., Ltd., Dalian,
China), according to the manufacturer's instructions. Following the
reverse transcription, fluorescence qPCR was performed. Primer
sequences were as follows: Cystatin C, forward 3′-AGA TCT ACG CTG
TGC CTT GG-5′ and reverse 3′-CAG AGC CTG TGG GGT AAA CA; miR-92a,
forward 3′-ACT ATT GCA CTT GTC CCG-5′. The reaction system was
composed of 12.5 µl SYBR Premix Ex Taq (Takara Biotechnology Co.,
Ltd.), 1 µl PCR forward primer, 1 µl reverse primer or Uni-miR qPCR
Primer (Takara Biotechnology Co., Ltd.), 2 µl cDNA template and 8.5
µl ddH2O, with a total volume of 25 µl. Each sample was
evaluated in triplicate. The amplification program was set up as
follows: Pre-denaturation at 95°C for 30 sec, followed by 40 cycles
of 95°C for 5 sec and 60°C for 20 sec. The 2−ΔΔT ±
standard error of the mean was used to calculate the relative miRNA
expression level. The U6 gene was used as an internal control.
Western blot analysis
At 48 h after transfection, the endothelial cells
were collected, lysed and centrifuged at 12,000 × g for 5 min at
4°C, and the supernatant was retained. A 50-µg protein sample was
subjected to SDS-PAGE (10%; Beyotime Institute of Biotechology,
Haimen, China) and the proteins were subsequently transferred to
PVDF membranes (Millipore, Billerica, MA, USA). The membrane was
blocked with non-fat milk for 1 h at room temperature. Next,
monoclonal mouse anti-human anti-cystatin C primary antibodies
(1:1,000; #ab24327; Abcam, Cambridge, MA, USA) were added and the
membranes were incubated overnight at 4°C. After washing three
times with Tris Buffered Saline with Tween® 20 (TBST; Bioscience
& Biotechnology Co., Ltd., Shanghai, China), polyclonal goat
anti-mouse IgG horseradish peroxidase-conjugated secondary
antibodies (1:2,000; #ab6789; Abcam) were added and the membranes
were incubated for 2 h at room temperature. Image Lab imaging
software (Bio-Rad Laboratories Inc., Hercules, CA, USA) was used to
perform data analysis. β-actin was used as an internal control and
the relative levels of cystatin C protein were calculated against
the levels of β-actin.
Statistical analysis
All preliminary data were tested for normality and
processed using the SPSS statistical software, version 16.0 (SPSS
Inc., Chicago, IL, USA). Final data are expressed as the mean ±
standard deviation. Analysis of variance was used for multi-group
comparison, and the t-test was used for comparison between two
groups. P<0.05 was considered to indicate a statistically
significant difference.
Results
Comparison of clinical data
To compare the differences in clinical features,
clinical data of each group was compared. The BMI, waist
circumference and waist-hip ratio of the T2DM, LLI-LM and LLI-S
groups were significantly higher compared with those of the control
group (P<0.05). The waist circumference of the LLI-S group was
significantly higher compared with those of the T2DM and LLI-LM
groups (P<0.05), while no statistically significant difference
was observed between the T2DM and LLI-LM groups. The waist-hip
ratio of the LLI-S group was significantly higher compared with
that of the T2DM group (P<0.05), but not that of the LLI-LM
group. The systolic blood pressure in the LLI-LM and LLI-S groups
was significantly higher compared with those of the control and
T2DM groups (P<0.05), and the value of the LLI-S group was the
highest among the groups. Furthermore, the difference between the
systolic blood pressure in the control and T2DM groups was not
statistically significant. The diastolic blood pressure in the
LLI-S group was the highest among the groups. The diastolic blood
pressure in the T2DM, LLI-LM and LLI-S groups was significantly
higher compared with that in the control group. In addition, the
diastolic blood pressure in the LLI-LM and LLI-S groups was
significantly higher compared with that in the T2DM group
(P<0.05); however, the difference between the LLI-LM and LLI-S
groups was not statistically significant (Table I). These results confirmed that
patients in the LLI-S group were more serious cases of diabetic
lower limb ischemia than the T2DM and LLI-LM groups were.
 | Table I.Analysis of clinical and biochemical
indices in each group. |
Table I.
Analysis of clinical and biochemical
indices in each group.
| Variable | NC | T2DM | LLI-LM | LLI-S |
|---|
| Number (M/F) | 60 (32/28) | 60 (30/30) | 70 (40/30) | 69 (38/31) |
| Age (years) |
51.0±10.20 |
52.3±7.86 |
60.5±8.53a,b |
60.8±8.2a,b |
| BMI
(kg/m2) |
22.32±1.73 |
23.68±2.03a |
24.75±3.13a |
26.42±3.51a,b |
| WC (cm) |
74.13±6.25 |
83.9±11.29a |
87.1±7.89a |
91.08±9.67a–c |
| WHR |
0.80±0.07 |
0.85±0.09a |
0.89±0.05a |
0.91±0.05a,b |
| SBP (mmHg) |
116±15 |
121±20 |
135±17a,b |
145±25a–c |
| DBP (mmHg) |
72±7 |
78±16a |
83±11a,b |
85±12a,b |
| FPG (mmol/l) |
5.18±1.59 |
8.13±2.23a |
8.26±2.81a |
8.34±2.63a |
| FINS (mU/l) |
6.85±2.58 |
9.12±4.32a |
10.35±4.12a,b |
10.40±4.43a,b |
| HOMA-IR |
1.57±1.86 |
3.16±2.03a |
3.80±2.12a,b |
3.85±1.96a,b |
| HbA1c
(%) |
5.09±0.41 |
7.71±1.63a |
8.25±2.11a |
8.66±1.78a |
| TC (mmol/l) |
4.61±1.13 |
4.68±1.01 |
4.82±1.2 |
4.92±1.36 |
| TG |
1.39±1.40 |
1.43±1.23 |
1.51±1.19 |
1.59±1.53 |
| HDL-C (mmol/l) |
1.16±0.34 |
1.12±0.25a |
1.10±0.21a |
1.05±0.31a |
| LDL-C (mmol/l) |
2.28±0.67 |
2.43±0.81 |
2.85±0.75a,b |
2.65±0.82a,b |
| Cystatin C
(mg/l) |
0.76±0.26 |
0.78±0.39 |
1.07±0.53a,b |
1.55±0.78a–c |
Comparison of biochemical indices in
each group
Biochemical indices of each group were tested and
compared among the groups. As presented in Table I, FPG, FINS, HOMA-IR and
HbA1C values in the T2DM, LLI-LM and LLI-S groups were
significantly higher compared with those in the control group
(P<0.05). The FINS and HOMA-IR values in the LLI-LM and LLI-S
groups were significantly higher compared with those in the T2DM
group (P<0.05). HDL-C levels in the T2DM, LLI-LM and LLI-S
groups were significantly lower compared with those in the control
group (P<0.05). No significant differences were observed in the
levels of FPG, HbA1C and HDL-C among the T2DM, LLI-LM
and LLI-S groups. The LDL-C levels in the LLI-LM and LLI-S groups
were significantly increased compared with those in the control and
T2DM groups (P<0.05); however, the difference between the LLI-LM
and LLI-S groups was not statistically significant. The expression
levels of cystatin C in the LLI-LM and LLI-S groups were
significantly higher compared with those in the control and T2DM
groups, and were significantly higher in the LLI-S group compared
with the LLI-LM group (P<0.05). The difference in cystatin C
expression levels was not statistically significant between the
T2DM and control groups. Furthermore, no statistically significant
difference was observed in the TC and TG values among the groups
(Table I). These results indicate
that the expression levels of cystatin C are closely associated
with the level of diabetic lower limb ischemia.
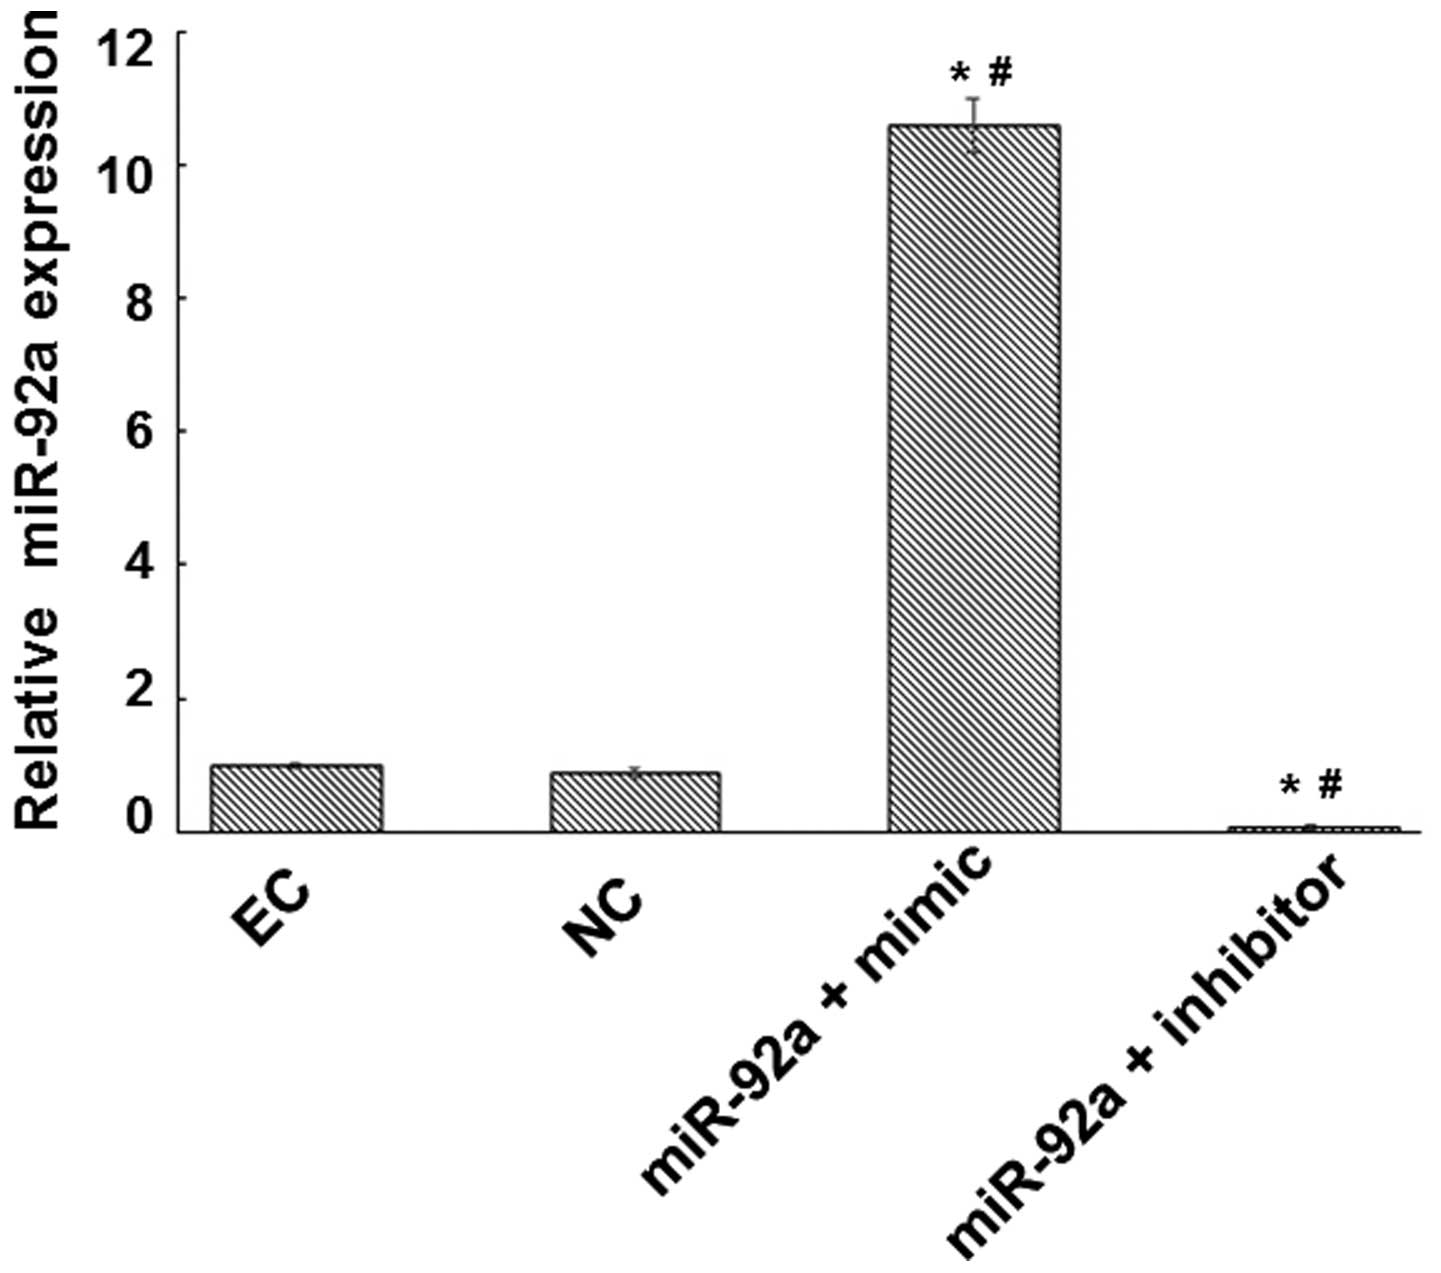
miR-92a suppresses the expression of
cystatin C
Bioinformatic analysis and associated confirmatory
experiments were performed in order to identify an miRNA able to
regulate cystatin C expression. miRWalk, miRanda and Targetscan
suggested miR-92a as a potential candidate. Detection of miR-92a
expression in platelets was subsequently performed, based on these
bioinformatic results. Platelets are able to contact with and
adhere to endothelial cells in the vascular surface during the
atherosclerotic process. Therefore, an miR-92a mimic and an
inhibitor were respectively transfected into endothelial cells to
determine whether miR-92a was able to regulate cystatin C at the
mRNA and protein levels. Fluorescence RT-qPCR was used to detect
miR-92a expression and evaluate the transfection efficiency. The
expression of miR-92a was increased by a factor of 10.57 in the
miR-92a + mimic group and reduced by a factor of 14.29 in the
miR-92a + inhibitor group compared with that in the NC group
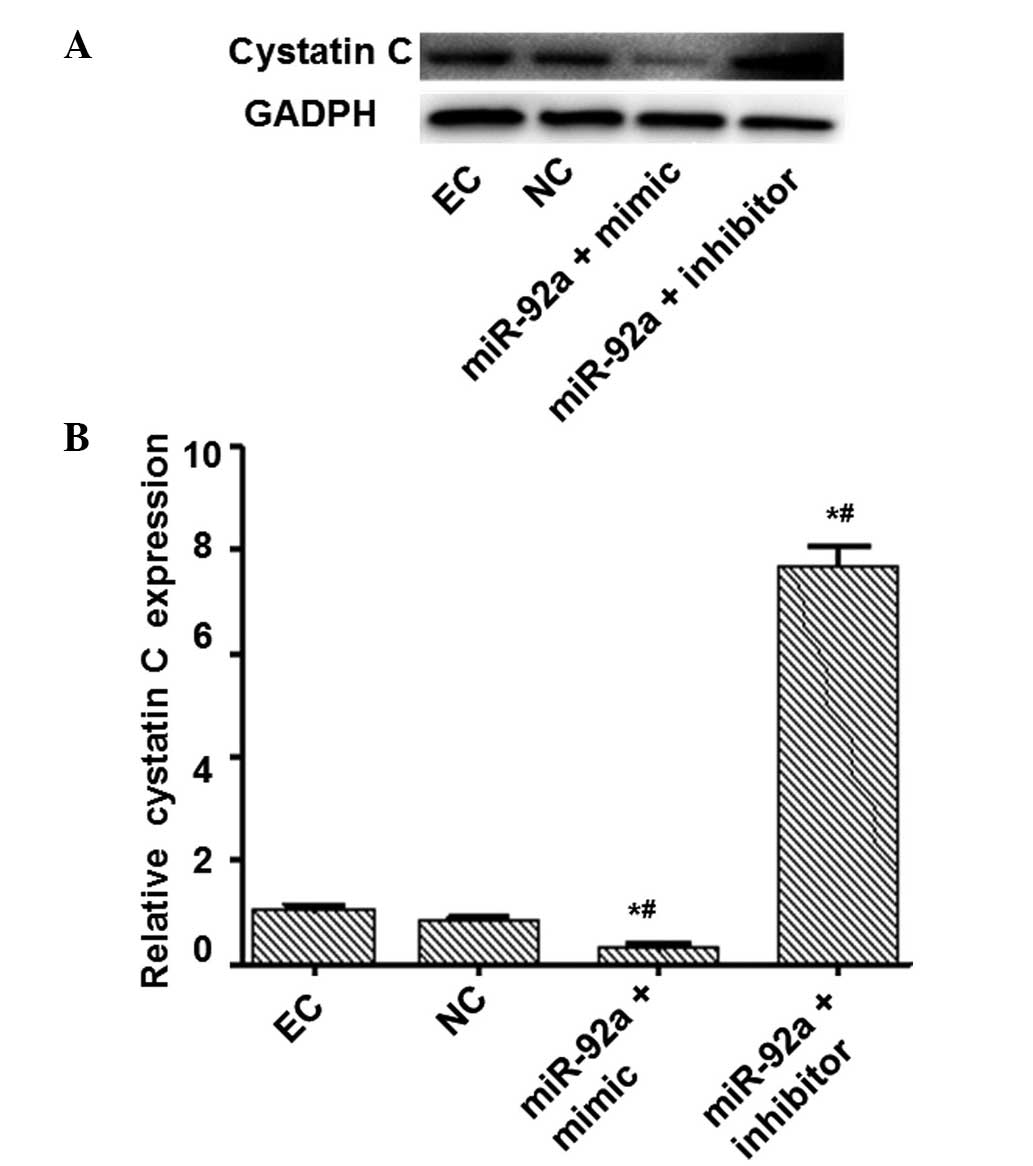
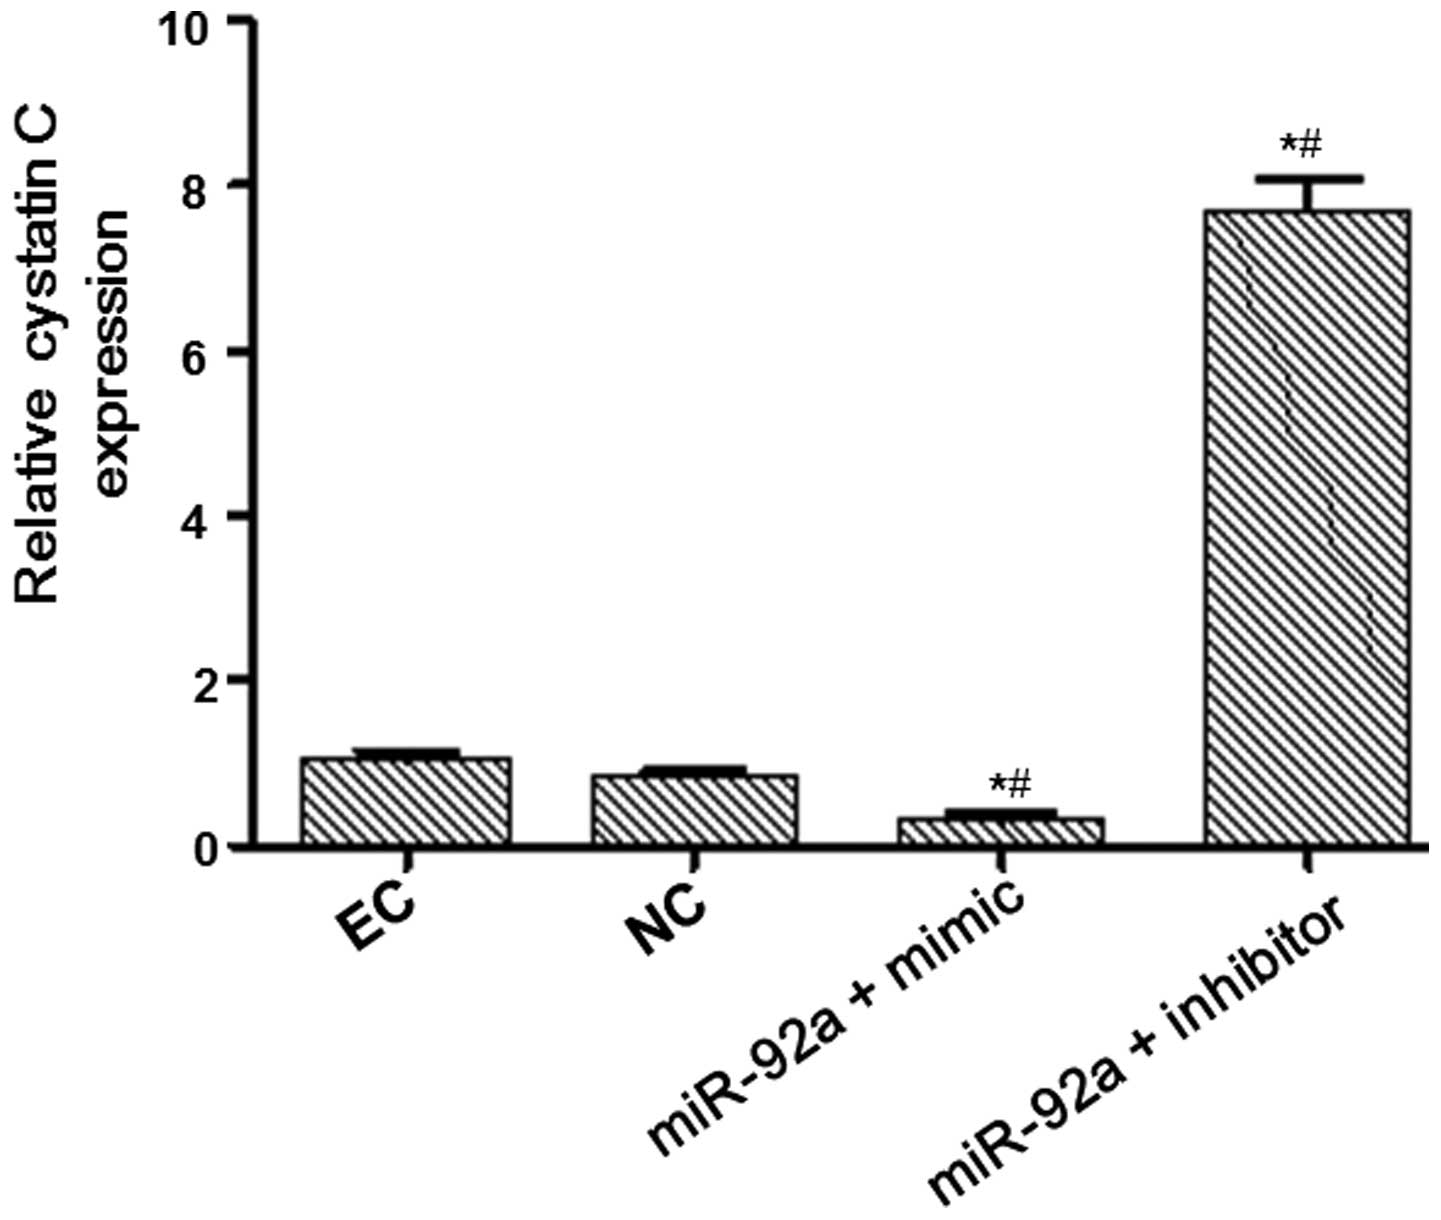
(Fig. 1). RT-qPCR and western blot
analysis were performed to measure the mRNA and protein expression
levels of cystatin C (Figs. 2 and
3). The mRNA and protein expression
levels of cystatin C were significantly reduced in the miR-92a +
mimic group compared with those in the NC group, and significantly
increased in the miR-92a + inhibitor group. These results suggest
that miR-92a is able to downregulate the expression of cystatin C
at the mRNA and protein levels.
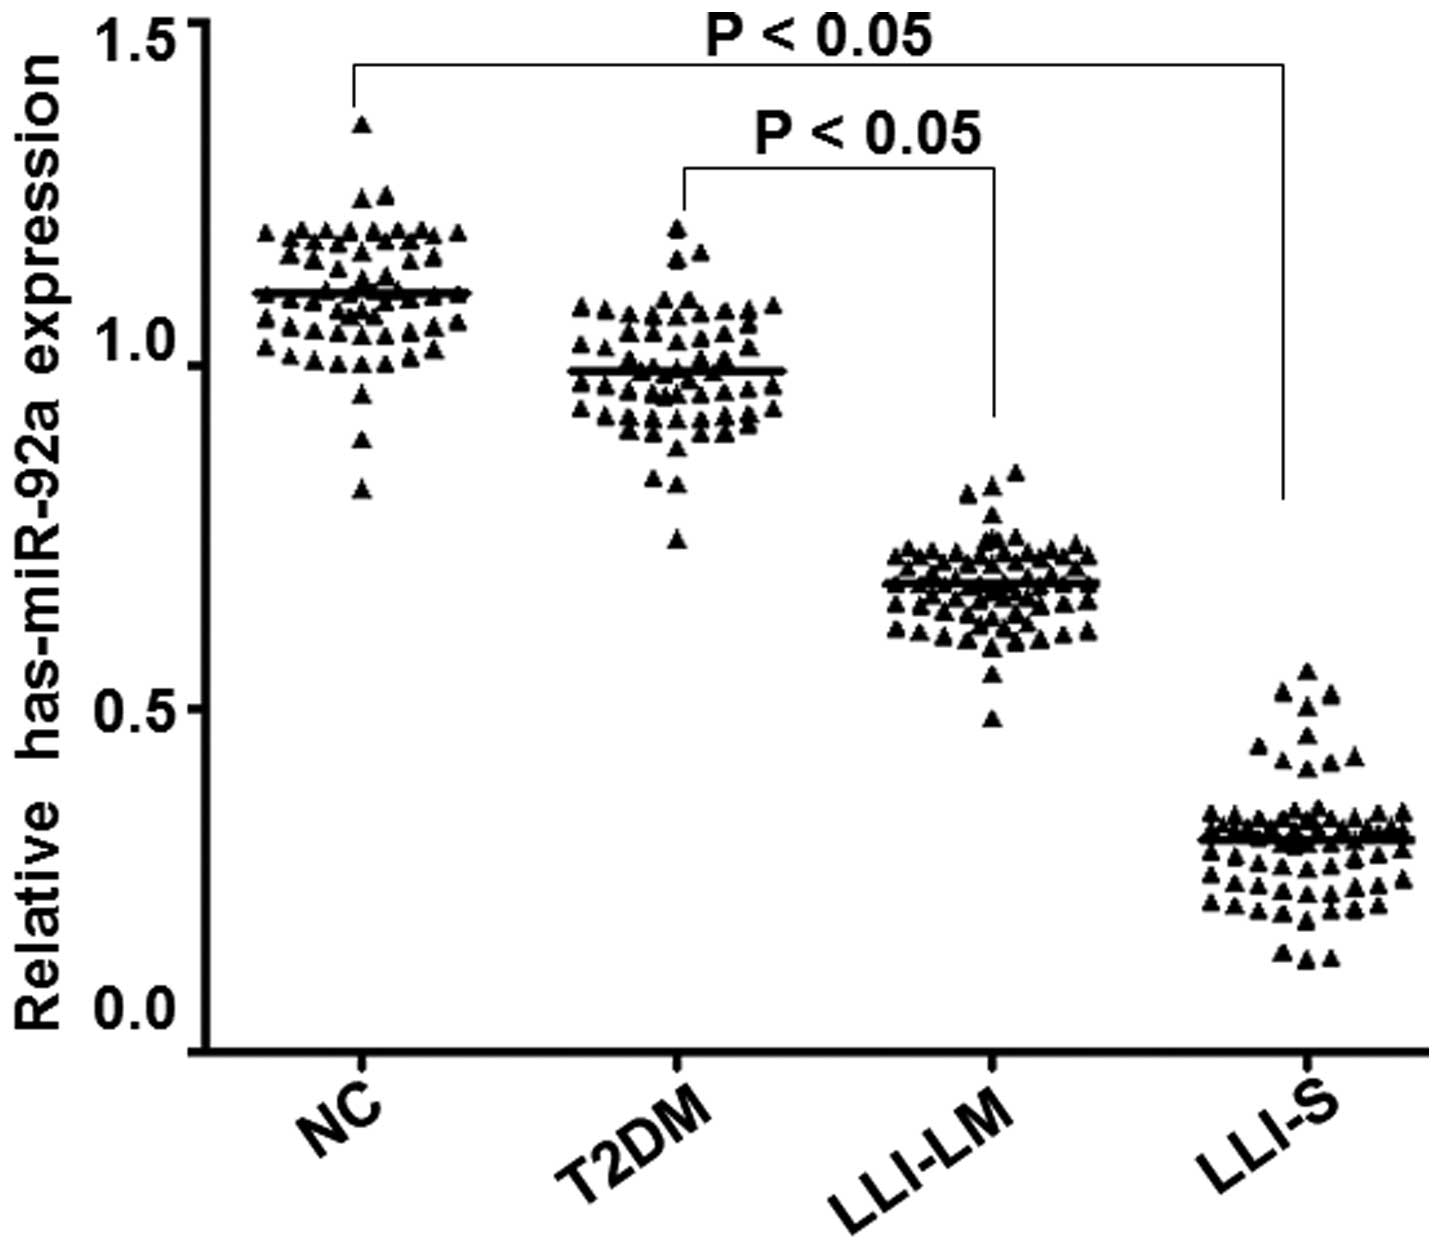
Expression of miR-92a in different
groups
Fluorescence RT-qPCR was employed to detect the
expression of the miR-92a gene in vivo, in order to
determine whether miR-92a expression differed between groups. As
presented in Fig. 4, miR-92a
expression levels in the peripheral blood platelets of the LLI-LM
and LLI-S groups were significantly reduced compared with those in
the control and T2DM groups (P<0.05). Furthermore, miR-92a
expression levels decreased with the severity of diabetic lower
limb ischemia. In addition, miR-92a expression in the LLI-S group
was significantly reduced compared with that in the LLI-LM group
(P<0.05), whereas no significant difference was observed between
the T2DM and control groups (P>0.05). These results indicate
that miR-92a expression levels reduce in correlation with the
severity of diabetic lower limb ischemia.
Discussion
Lower limb ischemia is a severe complication of
diabetes. The condition results from atherosclerosis of the lower
extremity arteries and the obstruction of blood circulation in the
lower limbs. Numerous studies have suggested that a large number of
platelets are involved in the atherosclerotic process and may
promote plaque formation (18–21). Liu
et al reported that the abnormal expression of cystatin C in
serum may be used as a diagnostic indicator of diabetic lower limb
ischemia (10). Furthermore,
previous studies indicate that cystatin C is closely associated
with the occurrence and development of cardiovascular diseases, and
is abnormally expressed in diseases such as lower limb ischemia,
hypertension, coronary heart disease and heart failure (22–24).
Taglieri et al observed that high levels of serum cystatin C
increased levels of CRP, induced inflammation, elevated
concentrations of procoagulant factors and were closely associated
with atherosclerosis (23).
In the present study, bioinformatic analysis was
used to predict the genes that regulate cystatin C expression, and
the results indicated that cystatin C may be a target of miR-92a.
Transfection of miR-92a into endothelial cells demonstrated that
miR-92a is able to regulate the expression of cystatin C. This
observation suggests that in the pathological progression of
atherosclerosis, platelets may release miR-92a directly into
endothelial cells via cell-cell interactions and thereby regulate
cystatin C expression. Furthermore, the expression levels of
miR-92a were determined in the platelets of patients in the
control, T2DM, LLI-LM and LLI-S groups. Data analyses demonstrated
that the platelet-derived miR-92a was negatively correlated with
serum cystatin C expression in patients. miR-92a expression was
particularly low in the platelets of diabetic patients with severe
lower limb ischemia, while serum cystatin C levels remained notably
high. This result clearly indicates that with the detection of
platelet-derived miR-92a and serum cystatin C expression, combined
with the comprehensive evaluation of clinically relevant
manifestations, the early diagnosis of diabetic lower limb ischemia
may be accurately achieved. Early diagnosis of diabetic lower limb
ischemia may aid the early detection and treatment of lower limb
ischemic disease, thus reducing patient risk.
Acknowledgements
The authors thank Dr. Xing Jin for supervising this
study.
References
|
1
|
Ouriel K: Peripheral arterial disease.
Lancet. 358:1257–1264. 2001. View Article : Google Scholar : PubMed/NCBI
|
|
2
|
Beckman JA, Creager MA and Libby P:
Diabetes and atherosclerosis: Epidemiology, pathophysiology and
management. JAMA. 287:2570–2581. 2002. View Article : Google Scholar : PubMed/NCBI
|
|
3
|
Ridker PM, Cushman M, Stampfer MJ, Tracy
RP and Hennekens CH: Plasma concentration of C-reactive protein and
risk of developing peripheral vascular disease. Circulation.
97:425–428. 1998. View Article : Google Scholar : PubMed/NCBI
|
|
4
|
Arain FA and Cooper Jr LT: Peripheral
arterial disease: Diagnosis and management. Mayo Clin Proc.
83:944–949. 2008. View Article : Google Scholar : PubMed/NCBI
|
|
5
|
Abrahamson M, Olafsson I, Palsdottir A,
Ulvsbäck M, Lundwall A, Jensson O and Grubb A: Structure and
expression of the human cystatin C gene. Biochem J. 268:287–294.
1990.PubMed/NCBI
|
|
6
|
Koenig W, Twardella D, Brenner H and
Rothenbacher D: Plasma concentrations of cystatin C in patients
with coronary heart disease and risk for secondary cardiovascular
events: More than simply a marker of glomerular filtration rate.
Clin Chem. 5l:321–327. 2005. View Article : Google Scholar
|
|
7
|
Watanabe S, Okura T, Liu J, Miyoshi K, et
al: Serum cystatin C level is a marker of end-organ damage in
patients with essential hypertension. Hypertens Res. 26:895–899.
2003. View Article : Google Scholar : PubMed/NCBI
|
|
8
|
Arpegård J, Ostergren J, de Faire U,
Hansson LO and Svensson P: Cystatin C - A marker of peripheral
atherosclerotic disease? Atherosclerosis. 199:397–401. 2008.
View Article : Google Scholar : PubMed/NCBI
|
|
9
|
de Groot M, Anderson R, Freedland KE,
Clouse RE and Lustman PJ: Association of depression and diabetes
complications: A meta-analysis. Psychosom Med. 63:619–630. 2001.
View Article : Google Scholar : PubMed/NCBI
|
|
10
|
Liu F, Shen J, Zhao J, et al: Cystatin C:
A strong marker for lower limb ischemia in Chinese type 2 diabetic
patients? PloS One. 8:e669072013. View Article : Google Scholar : PubMed/NCBI
|
|
11
|
Berezikov E, Cuppen E and Plasterk RH:
Approaches to microRNA discovery. Nat Genet. 38:(Suppl). S2–S7.
2006. View
Article : Google Scholar : PubMed/NCBI
|
|
12
|
Stuwe E, Tóth KF and Aravin AA: Small but
sturdy: Small RNAs in cellular memory and epigenetics. Genes Dev.
28:423–431. 2014. View Article : Google Scholar : PubMed/NCBI
|
|
13
|
Liu D, Tao T, Xu B, et al: MiR-361-5p acts
as a tumor suppressor in prostate cancer by targeting signal
transducer and activator of transcription-6 (STAT6). Biochem
Biophys Res Commun. 445:151–156. 2014. View Article : Google Scholar : PubMed/NCBI
|
|
14
|
Loyer X, Potteaux S, Vion AC, et al:
Inhibition of microRNA-92a prevents endothelial dysfunction and
atherosclerosis in mice. Circ Res. 114:434–443. 2014. View Article : Google Scholar : PubMed/NCBI
|
|
15
|
Sun X, Belkin N and Feinberg MW:
Endothelial microRNAs and atherosclerosis. Curr Atheroscler Rep.
15:3722013. View Article : Google Scholar : PubMed/NCBI
|
|
16
|
Vickers KC, Rye KA and Tabet F: MicroRNAs
in the onset and development of cardiovascular disease. Clin Sci
(Lond). 126:183–194. 2014. View Article : Google Scholar : PubMed/NCBI
|
|
17
|
Creemers EE, Tijsen AJ and Pinto YM:
Circulating microRNAs: Novel biomarkers and extracellular
communicators in cardiovascular disease? Circ Res. 110:483–495.
2012. View Article : Google Scholar : PubMed/NCBI
|
|
18
|
Huo Y, Schober A, Forlow SB, et al:
Circulating activated platelets exacerbate atherosclerosis in mice
deficient in apolipoprotein E. Nat Med. 9:61–67. 2003. View Article : Google Scholar : PubMed/NCBI
|
|
19
|
Wilcox JN, Smith KM, Williams LT, Schwartz
SM and Gordon D: Platelet-derived growth factor mRNA detection in
human atherosclerotic plaques by in situ hybridization. J Clin
Invest. 82:1134–1143. 1988. View Article : Google Scholar : PubMed/NCBI
|
|
20
|
Huo Y and Ley KF: Role of platelets in the
development of atherosclerosis. Trends Cardiovasc Med. 14:18–22.
2004. View Article : Google Scholar : PubMed/NCBI
|
|
21
|
Nomura S, Suzuki M, Katsura K, et al:
Platelet-derived microparticles may influence the development of
atherosclerosis in diabetes mellitus. Atherosclerosis. 116:235–240.
1995. View Article : Google Scholar : PubMed/NCBI
|
|
22
|
Shi GP, Sukhova GK, Grubb A, et al:
Cystatin C deficiency in human atherosclerosis and aortic
aneurysms. J Clin Invest. 104:1191–1197. 1999. View Article : Google Scholar : PubMed/NCBI
|
|
23
|
Taglieri N, Koenig W and Kaski JC:
Cystatin C and cardiovascular risk. Clin Chem. 55:1932–1943. 2009.
View Article : Google Scholar : PubMed/NCBI
|
|
24
|
Watanabe S, Okura T, Liu J, Miyoshi K,
Fukuoka T, Hiwada K and Higaki J: Serum cystatin C level is a
marker of end-organ damage in patients with essential hypertension.
Hypertens Res. 26:895–899. 2003. View Article : Google Scholar : PubMed/NCBI
|