Introduction
Chronic liver inflammation represents a major
driving force for progressive extracellular matrix (ECM)
accumulation, leading to liver cirrhosis with resultant
complications that include portal hypertension and hepatocellular
carcinoma (1,2). The activation of hepatic stellate
cells (HSCs) is one of the critical events involved in hepatic
fibrosis (3). Previously, the
reduction and/or reversal of liver fibrosis were shown to be
associated with apoptosis of activated HSCs (4,5).
Phosphatase and tensin homology deleted on
chromosome ten (PTEN) is a tumor-suppressor gene with double
phosphatase activities (6).
Recent studies have demonstrated that the expression of PTEN is
decreased in the myofibroblasts of lung tissues in idiopathic
pulmonary interstitial fibrosis. PTEN has been shown in
vitro to negatively regulate the differentiation of
myofibroblasts (7). Additionally,
we previously showed that the expression of PTEN is reduced in
activated HSCs in fibrotic hepatic tissues in vivo (8). Conversely, the upregulation of PTEN
may induce apoptosis in activated HSCs in vitro (9).
Carbon tetrachloride (CCl4) is widely
used to experimentally induce liver injury in rodents. Its
prolonged administration leads to liver fibrosis, cirrhosis and
hepatocellular carcinoma. Reversal of liver fibrosis occurs with
CCl4 discontinuation (10). This model has been used
extensively to examine the pathogenesis of cirrhosis.
In the current study, we exposed rats to
CCl4 and discovered that PTEN expression was reduced in
activated HSCs during liver fibrogenesis. Upon withdrawal of
CCl4, PTEN expression was increased in apopotic
activated HSCs with the reversal of liver fibrosis. Our results
suggest that PTEN may be an important therapeutic target for the
management of liver fibrosis.
Materials and methods
Animal models
One hundred and eight adult male Wistar rats
weighing 350–450 g were obtained from the Experimental Animal
Center of Hebei Medical University. The research was conducted in
accordance with the internationally accepted principles for
laboratory animal use and care as found in the US guidelines (NIH
publication #85-23, revised in 1985). The experiment was performed
in compliance with the national ethical guidelines for the care and
use of laboratory animals (certificate no. 911102).
A rat model of hepatic fibrosis was established by
hypodermic injection of CCl4 mixed with olive oil at the
concentration of 40% (Huarui Scientific & Technological Co.,
Shijiazhuang, China) for 5 weeks (2 ml/kg, twice a week); the
reversal model was established through 4 weeks of normal feedings
based on hypodermic injection of 40% CCl4 for 5 weeks (2
ml/kg, twice a week). One hundred and eight male Wistar rats were
randomly divided into the following groups (n=6 in each group):
model group (containing 1, 2, 3, 4 and 5 week groups), model
control group, reversal group (containing Re 1, 2, 3 and 4 week
groups), and the reversal control group. Rats were sacrificed at
the indicated times and their livers were harvested for subsequent
analysis.
Histopathology
Liver specimens were fixed 12–24 h in 4%
phosphate-buffered paraformaldehyde (Huarui Scientific &
Technological Co.) and then embedded in paraffin for light
microscopy examination. Tissue sections (4-μm thick) were
stained with hematoxylin and eosin (H&E) for morphological
evaluation and Masson trichrome (MT) for assessing the degree of
fibrosis.
Immunof luorescent detection of PTEN and
α-SMA
Immunof luorescent studies were performed on
4-μm frozen sections. Briefly, the sections were fixed by 4%
phosphate-buffered paraformaldehyde and washed with 0.1% Triton
X-100 TBS (TBSTx). Five percent bovine serum albumin (BSA) TBSTx
was used as a sealed liquid and then the specimens were incubated
overnight at 4°C with the primary antibody (either mouse anti-PTEN
monoclonal antibody at a dilution of 1:100 or rabbit anti-α-SMA
monoclonal antibody at a dilution of 1:200) (Santa Cruz
Biotechnology, Inc., Santa Cruz, CA, USA). After the sections were
washed, the Cy3-labeled goat anti-mouse IgG secondary antibody or
FITC-labeled goat anti-rabbit (1:400 dilution) (Beyotime Institute
of Biotechnology, Shanghai, China) was added and the sections were
incubated at 37°C for 1 h. DAPI was used for nuclear staining. The
negative control samples were processed under the same conditions,
except that 5% BSA TBSTx was used in place of the primary antibody.
The α-SMA and PTEN-positive expression levels were measured by a
Motic Med 6.0 digital video image analysis system (Motic China
Group Co., Ltd., Xiamen, China) and expressed as optical density
values.
Immunofluorescence double labeling
confocal laser scanning microscopy of PTEN and α-SMA
The primary antibodies used were mouse anti-PTEN
monoclonal (1:100) and rabbit anti-α-SMA monoclonal (1:200)
antibodies, and the secondary antibodies were avidin-Cy3-labeled
goat anti-mouse and FITC-labeled goat anti-rabbit antibodies.
Sections underwent the same washing, blocking and primary detection
procedure as mentioned above. The co-expression of PTEN and α-SMA
was observed using a confocal laser scanning microscope.
PTEN-positive expression appeared as red fluorescent foci,
α-SMA-positive expression appeared as green fluorescent foci and
the colocalization of the two markers appeared as yellow
fluorescent foci.
Immunofluorescence double labeling
confocal laser scanning microscopy of TUNEL and α-SMA
Immunofluorescent studies were performed on
4-μm frozen sections. The sections were fixed by 4%
phosphate-buffered paraformaldehyde and washed with PBS. Five
percent BSA TBSTx was used as a sealed liquid, and the specimens
were then incubated overnight at 4°C with the primary antibody
mouse anti-α-SMA polyclonal (1:100 dilution). The Cy3-labeled goat
anti-mouse IgG secondary antibody (1:400 dilution) and terminal
deoxynucleotidyltransferase-mediated dUTP nick end labelling
(TUNEL) liquid solution (TdT enzyme 2 μl + fluorescent
marker liquid 48 μl for each section) (Beyotime Institute of
Biotechnology) were added and the sections were incubated for 1 h.
DAPI was used for nuclear staining. The negative control samples
were processed under the same conditions, except that 5% BSA TBSTx
was used in place of the primary antibody and TdT enzyme. The
apoptotic cells appeared as green fluorescent foci by TUNEL kit and
α-SMA-positive expression appeared as red fluorescent foci and
colocalization of the two markers appeared as yellow fluorescent
foci. The apoptotic index was calculated as the ratio of yellow
cells to total green cells.
Western blot analysis
Primary antibodies used were mouse anti-PTEN
monoclonal (1:200) and rabbit anti-GAPDH polyclonal (1:500)
antibodies. Western blotting was performed as previously described
(8).
Real-time fluorescent quantitation PCR
assay
The total RNA of hepatic tissue was extracted with
the TRIzol reagent (Invitrogen, USA) according to the
manufacturer’s instructions. cDNA was generated by using 2
μg total RNA, 0.5 μl RNasin (50 U/μl), 1
μl random primers (500 μg/ml), 2 μl 10 mM
dNTP, 4 μl 5X reverse transcription reaction buffer
(Tris-HCl 250 mM, pH 8.3; KCl 375 mM; MgCl2 15 mM) and 1
μl M-MLV reverse transcriptase (200 U/μl) and were
mixed to a final volume of 20 μl with DEPC water (Kangwei
Corporation, Beijing, China). First, the reaction mixture was
incubated at 37°C for 55 min, 94°C for 5 min (to deactivate reverse
transcriptase) and then frozen at −20°C.
Primer Express 5.0 was used to design the following
primers: PTEN forward primer, 5′-GGA AAG GAC GGA CTG GTG TA-3′ and
reverse primer, 5′-TGC CAC TGG TCT GTA ATC CA-3′ (101 bp amplicon);
GAPDH forward primer, 5′-GGC AAG TTC AAC GGC ACA G-3′ and reverse
primer, 5′-CGC CAG TAG ACT CCA CGA CAT-3′ (122 bp amplicon). The
primers were synthesized by Saibaisheng Gene Co., Ltd. (Beijing,
China). Real-time fluorescent quantitative PCR was performed using
12.5 μl 2 UltraSYBR Mixture, 0.5 μl forward primer,
0.5 μl reverse primer and 2 μl cDNA template in a
total volume of 25 μl. Reaction conditions were: 95°C for 10
min, 1 cycle; 95°C for 15 sec, 60°C for 1 min, 35 cycles. An ABI
Prism 7700 real-time fluorescent quantitative PCR thermal cycler
(Applied Biosystems, Foster City, CA, USA) was used. The mRNA
expression of the PTEN gene was normalized to GAPDH.
Statistical treatment
Data are presented as the means ± SD and analyzed
with SPSS 18.0 software. The statistical analyses that were
performed included one-way ANOVA, the LSD test and Pearson’s
correlation analysis. P<0.05 was considered to indicate a
statistically significant difference.
Results
Gross and histopathological
characterization of CCl4-induced liver fibrosis
CCl4-induced hepatic injury in rats has
been used as a model system to study liver fibrogenesis. The gross
appearance of the liver became progressively turgescent, coarse and
relatively bloodless over 5 weeks of CCl4 administration
(Fig. 1A). In contrast,
withdrawal of CCl4 improved gross liver morphology
(reduced surface coarseness and increased reddish color) over time
(Fig. 1A).
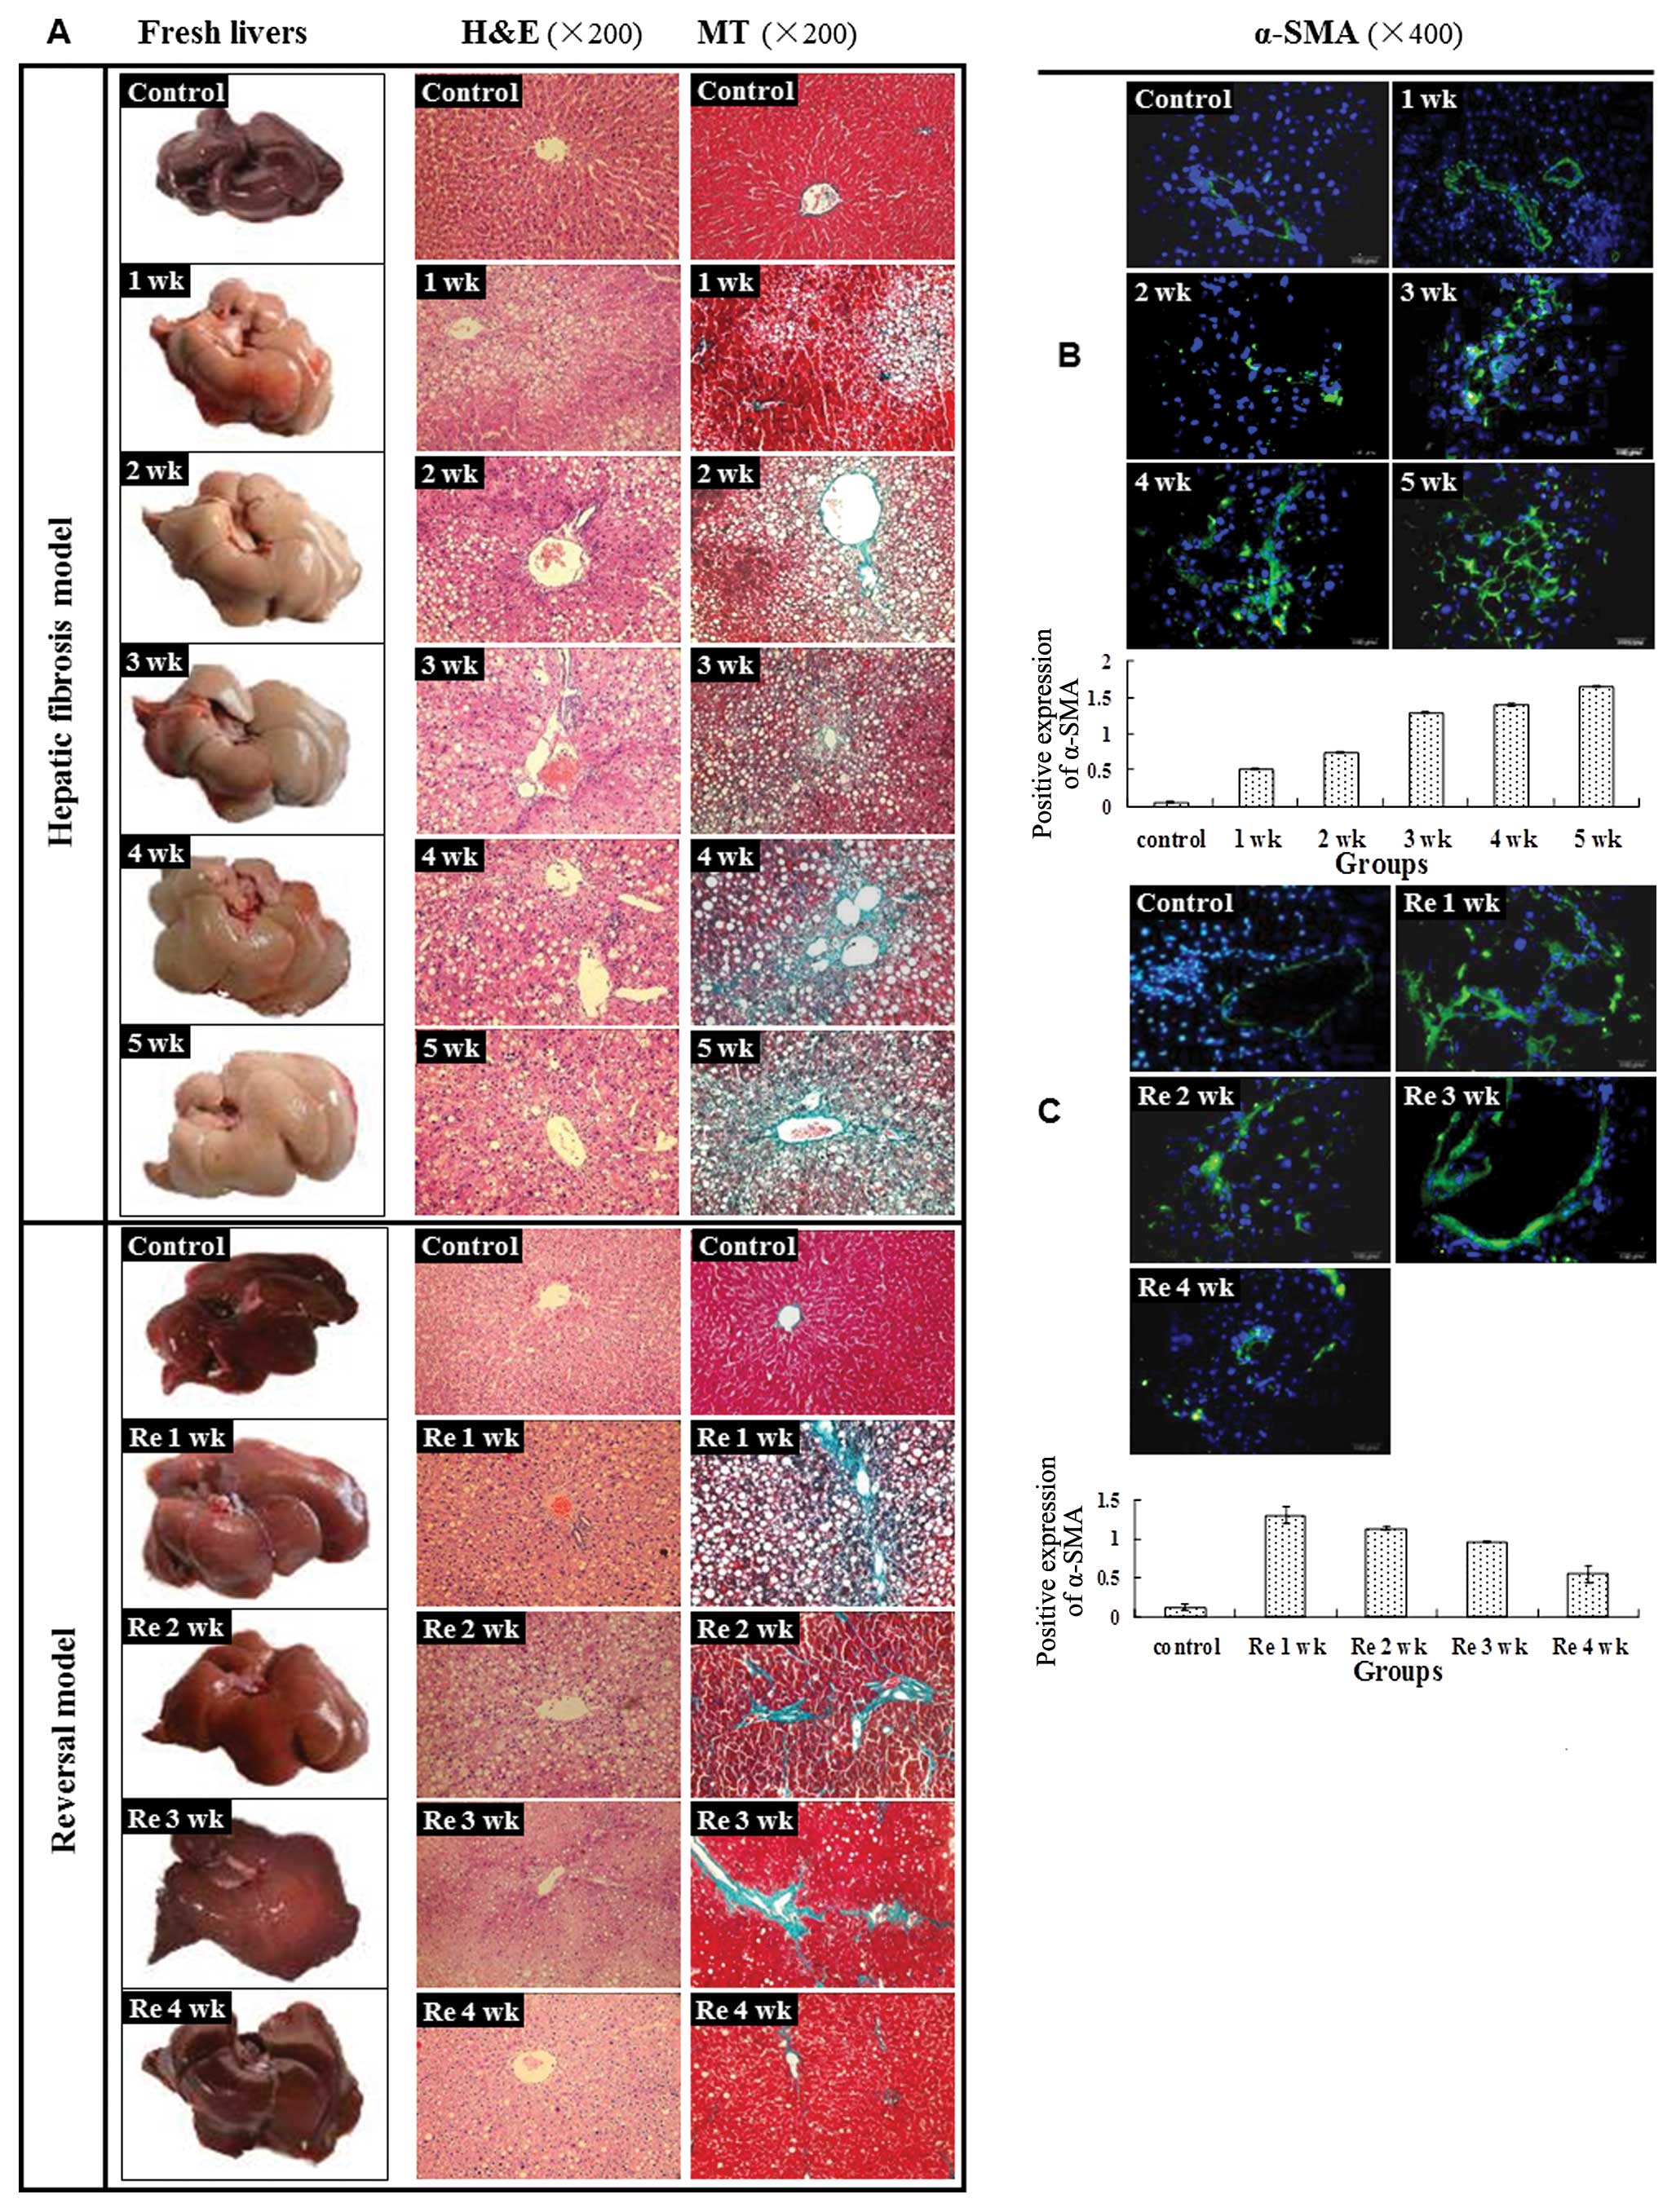 | Figure 1Hepatic fibrosis model and reversal
model were successfully established. (A) Representative images of
the fresh livers without fixation demonstrated that the livers of
the control group were smooth, lustrous and reddish. However, after
treatment with CCl4, the liver was turgescent and its
surface appeared coarse and relatively bloodless. The above changes
became more evident from 1 to 5 weeks. At the end of
CCl4 treatment, the liver surfaces, although slightly
coarse, became more reddish, lustrous and blood-filled and
gradually returned to normal from Re 1 to 4 weeks. Liver sections
stained with H&E demonstrated that hepatic cells were swollen
and fatty degeneration, necrosis and regeneration were evident.
Continuous CCl4 treatment led to worse liver damage from
1 to 5 weeks in the model group. After CCl4 treatment,
the above histopathological changes gradually returned to normal.
Liver sections stained with MT demonstrated that fibrosis spread
from the vascular smooth muscle cells to the portal area and
damaged hepatic cells; the latter appeared as fatty degeneration,
necrosis and regeneration. The continuous CCl4 treatment
led to an enlarged fibrotic area from 1 to 5 weeks in the model
group. After termination of CCl4 treatment, the damaged
hepatic cells gradually returned to normal and the fibrotic tissue
area decreased from Re 1 to 4 weeks. (B) In the normal rat liver,
α-SMA was occasionally detected in vascular smooth muscle cells and
the expression level was low, revealing limited activation of HSCs.
After CCl4 administration, the α-SMA spread to the
portal area, demonstrating an increased activation of HSCs.
Immunofluorescence staining was used to discover a significant
increased expression of α-SMA from 1 to 5 weeks in the model group
(0.51±0.02, 0.74±0.02, 1.29±0.02, 1.40±0.01, 1.65±0.02)
(P<0.01), compared with the control group (0.07±0.01)
(P<0.01). (C) A significant decrease in expression of α-SMA was
noted from Re 1 to 4 weeks (P<0.05). |
Histologic examination of the
CCl4-treated liver revealed swelling of the hepatocytes,
fatty degeneration, necrosis and regeneration, particularly with
continued CCl4 administration (Fig. 1A). After termination of
CCl4 treatment, the above histopathological changes
returned to normal over time (Fig.
1A).
To determine whether there was increased collagen
deposition, MT staining was performed. Increased MT staining in the
periportal region was discovered with CCl4
administration from 1 to 5 weeks (Fig. 1A). At the end of CCl4
administration, the damaged hepatic cells gradually returned to
normal and the degree of MT staining was reverted to the baseline
level at Re 4 weeks (Fig.
1A).
Activation profile of HSCs with liver
fibrosis
To assess the role of HSCs, the expression analysis
of α-SMA was performed. On activation, HSCs undergo proliferation
and differentiation, becoming myofibroblast-like α-smooth muscle
actin (α-SMA)-positive cells that produce ECM proteins,
particularly type I collagen (2).
In the normal rat liver, α-SMA was occasionally detected in
vascular smooth muscle cells and the expression level was low,
revealing a limited activation of HSCs (Fig. 1B). After CCl4
administration, the α-SMA spread to the portal area, demonstrating
an increased activation of HSCs. Compared with the control group
(0.07±0.01), treatment with CCl4 led to a significant
and progressively increased expression of α-SMA from 1 to 5 weeks
(0.51±0.02, 0.74±0.02, 1.29±0.02, 1.40±0.01, 1.65±0.02; P<0.01)
(Fig. 1B). CCl4
withdrawal resulted in a significantly decreased α-SMA expression
between Re 1, 2, 3 and 4 weeks (1.31±0.11, 1.14±0.03, 0.97±0.01,
0.55±0.11; P<0.05) (Fig.
1C).
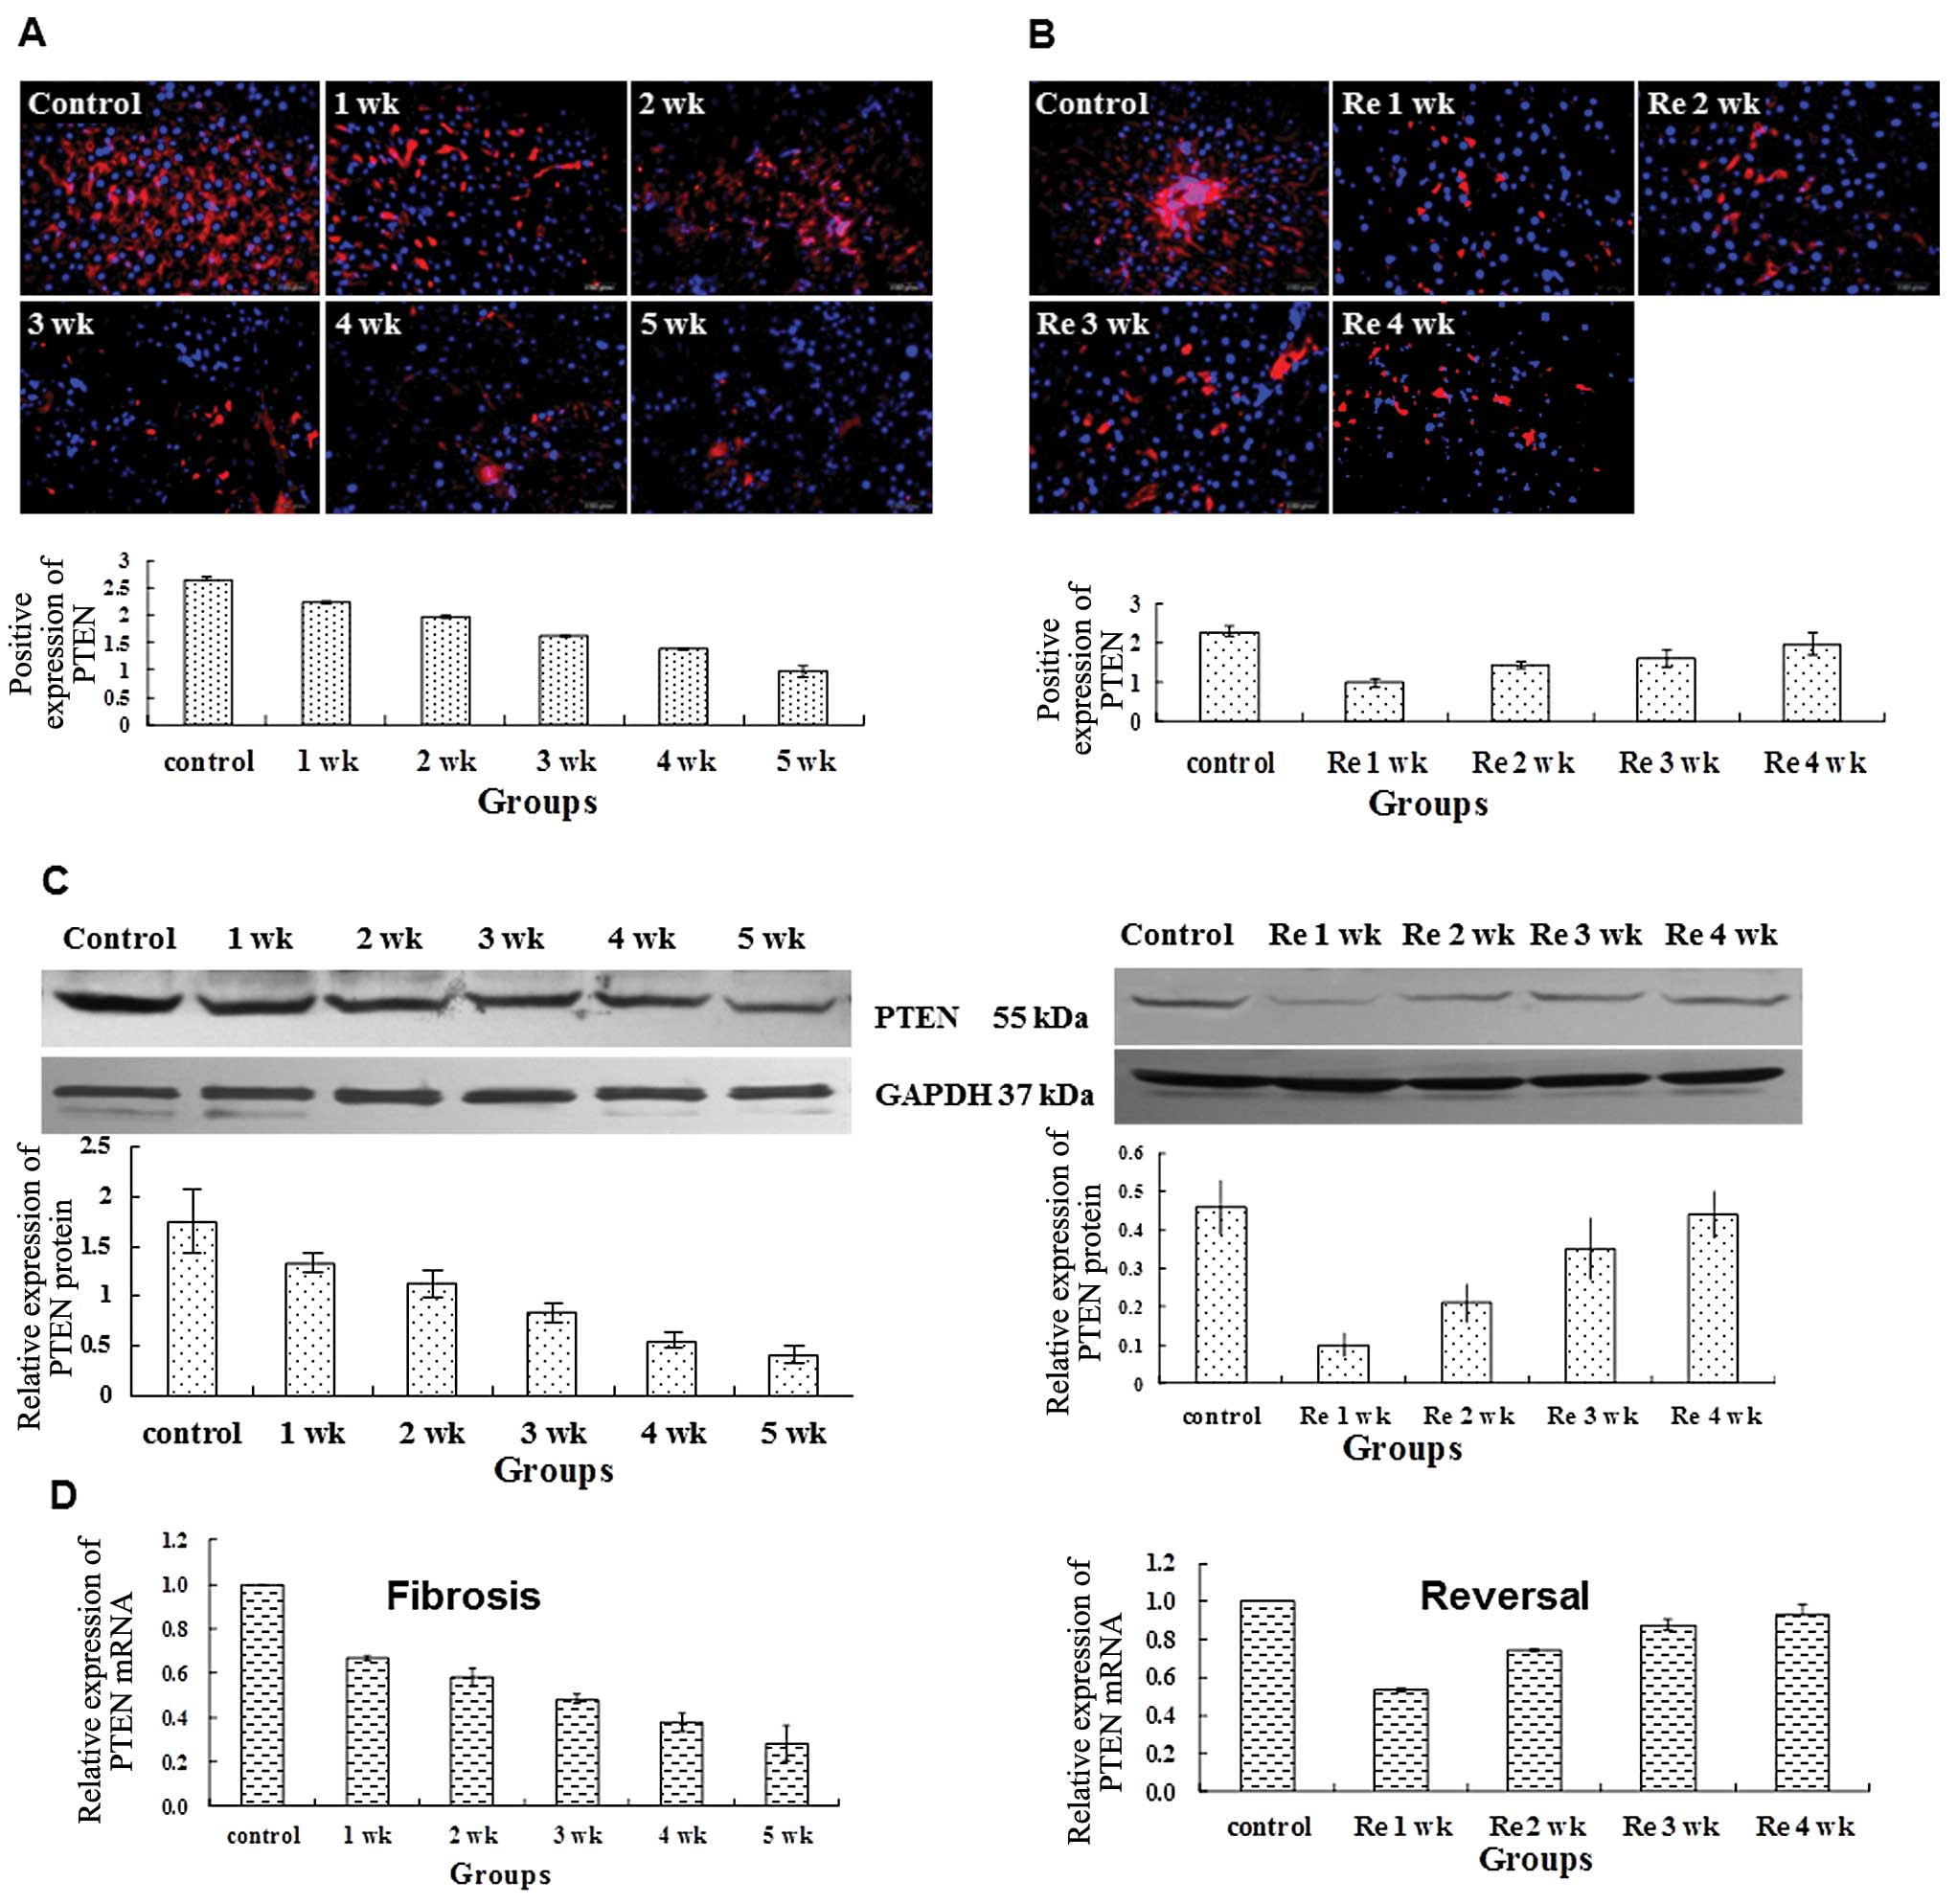
PTEN expression declines during liver
fibrogenesis and increases during reversal of fibrosis
In normal rat liver tissue recent reports
demonstrate that there is an inverse correlation between PTEN and
fibrogenesis in pulmonary fibrosis (7). We then assessed the potential
association between PTEN and liver fibrosis. In the normal rat
liver tissue, PTEN protein existed in widespread areas (Fig. 2A). As the normal hepatic cells
were damaged by the administration of CCl4, the PTEN
expression decreased significantly from 1 to 5 weeks (2.23±0.02,
1.96±0.03, 1.61±0.02, 1.37±0.02, 0.98±0.01; P<0.01), compared
with the control group (2.67±0.02) (Fig. 2A). Withdrawal of CCl4
led to the progressive increase in PTEN protein expression from Re
1 to 4 weeks (1.01±0.11, 1.46±0.09, 1.62±0.22, 1.99±0.30;
P<0.01); however it remained less the normal level of the
control group (2.31±0.12) (Fig.
2B).
We next used western blot analysis and real-time
(RT)-PCR to quantitate the expression change of PTEN. Compared to
the control, the relative expression levels of PTEN/GAPDH in rat
hepatic tissues were significantly lower at 1, 2, 3, 4 and 5 weeks.
As CCl4 was withdrawn, PTEN expression increased over
time (Fig. 2C). However, PTEN
expression remained significantly lower compared to the control.
Consistent with the changes in PTEN expression at the protein
level, the relative expression levels of PTEN mRNA in rat liver
tissues were significant lower at 1, 2, 3, 4 and 5 weeks in the
model group compared to the control group (Fig. 2C). Withdrawing CCl4 led
to a gradual increase in PTEN expression over time (Fig. 2C). Collectively, we demonstrate
that PTEN expression declines during liver fibrogenesis and
increases during reversal of fibrosis.
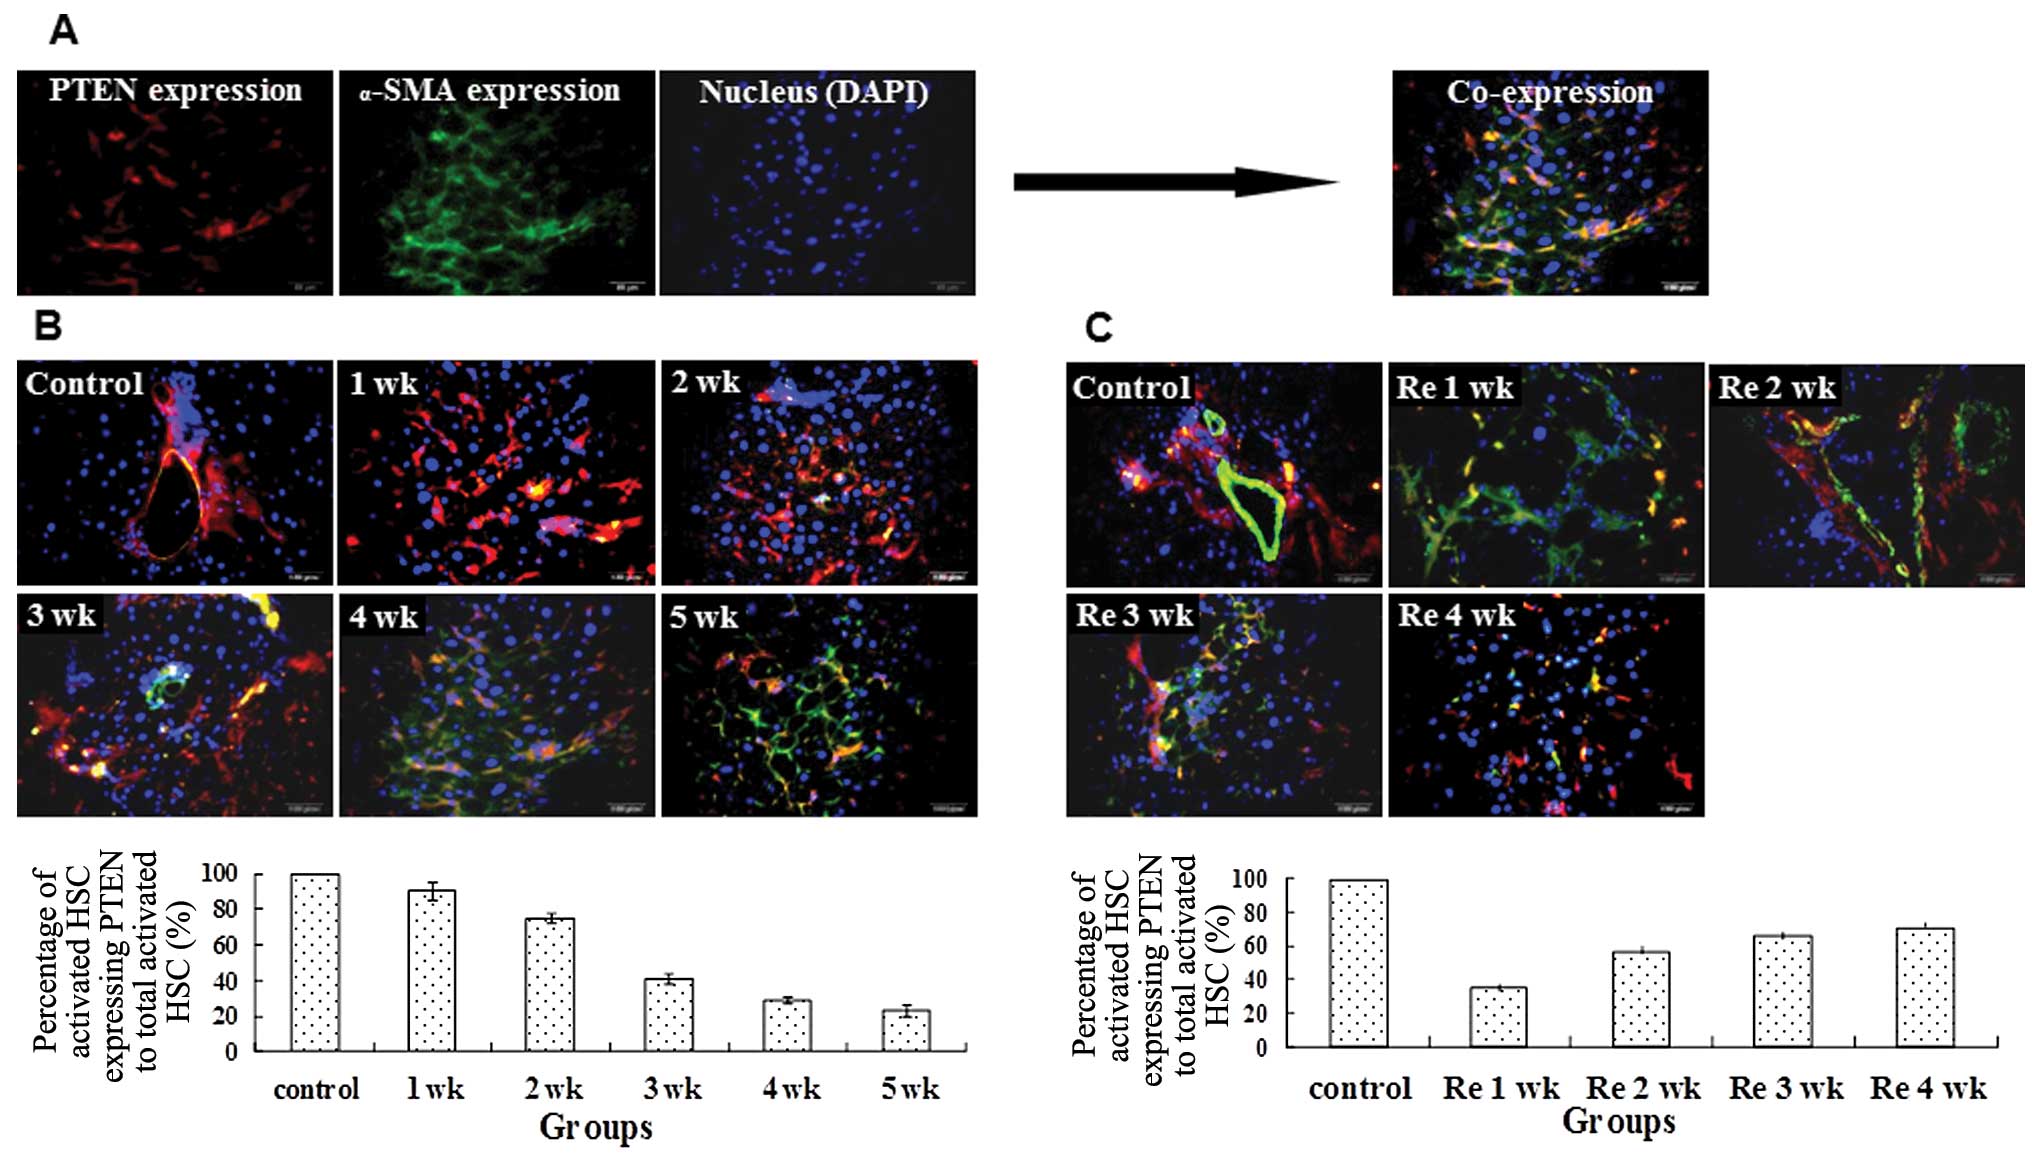
PTEN expression in activated HSCs
The potential role of PTEN in HSCs during liver
fibrogenesis and reversal was investigated. We used α-SMA as a
marker of HSC activation and measured the co-localization with
PTEN. Administration of CCl4 led to reduced
immunofluorescent staining of PTEN in activated HSCs from 1 to 5
weeks (Fig. 3A). During reversal
of fibrosis, the percentage of activated HSCs expressing PTEN
increased (Fig. 3B and C).
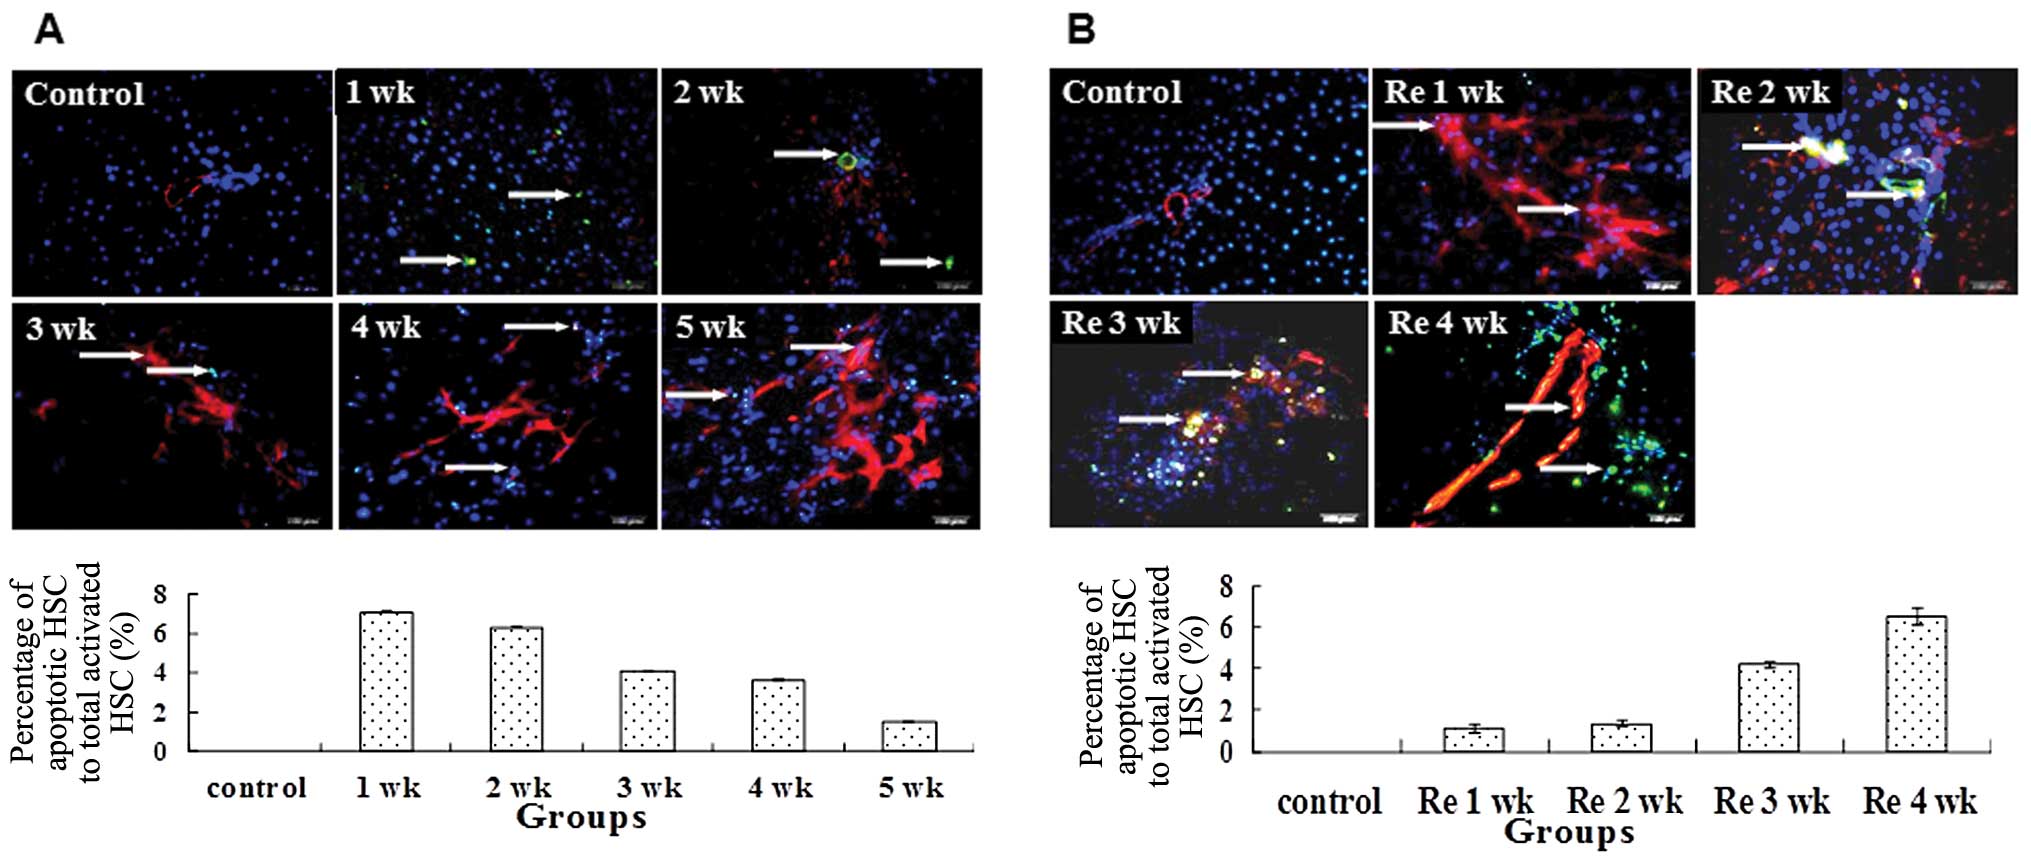
Since the number of activated HSCs was dynamic
during fibrogenesis and its reversal, we assessed whether apoptosis
was one of the mechanisms required to regulate the number of
activated HSCs. TUNEL staining demonstrated that the percentage of
apoptotic activated HSCs to total activated HSCs decreased from 1
to 5 weeks with the administration of CCl4 (Fig. 4A). By contrast, the reduced number
of activated HSCs was correlated with the increased apoptotic
activity during withdrawal of CCl4 (Fig. 4B).
Correlation analysis
Pearson’s correlation analysis discovered a
significant negative correlation between PTEN and α-SMA expression
(r=−0.979, P<0.05). Significant positive correlations were
observed between PTEN expression to PTEN-positive activated HSCs
(r= 0.962, P<0.05) and PTEN expression and the apoptotic index
of activated HSCs (r= 0.991, P<0.05). Collectively, our data
demonstrate that PTEN is negatively correlated with the activation
of HSCs and positively correlated with the apoptosis of activated
HSCs.
Discussion
In addition to its role in cell proliferation and
tumor biology (11–14), recent studies have unveiled a
novel role of PTEN in fibrosis including diffuse systemic sclerosis
(15) and idiopathic pulmonary
interstitial fibrosis (16).
Additionally, recent studies have shown that PTEN had a negative
relation with the activation and proliferation of HSCs in fibrotic
hepatic tissues induced by bile duct ligation (BDL) (8). The upregulation of PTEN was found to
inhibit the activation and proliferation in HSCs of fresh isolated
rats (17,18) and induce apoptosis of activated
HSCs in vitro (9). We used
the CCl4 hepatic fibrosis model to further investigate
the potential role of PTEN in fibrogenesis.
Using immunofluorescent staining, PTEN protein is
present mostly in cytolymph with occasional expression in the
nucleus. The expression of PTEN is dynamic during fibrogenesis and
reversal of fibrosis. Consistent with previous results (8,9),
we revealed that PTEN expression was reduced in activated HSCs
during fibrogenesis and increased in activated HSCs during reversal
of fibrosis.
HSCs are typically found in the space of Disse in a
quiescent state (19). HSCs may
be activated to myofibroblasts expressing α-SMA by several stimuli
such as cytokines and inflammatory mediators (20,21). Activated HSCs migrate to and
proliferate in sites of liver injury (20,21), synthesize ECM components and
upregulate the expression levels of α-SMA and collagen matrices
(22). Hence, α-SMA is a marker
of HSC activation and proliferation. We demonstrated that in normal
rat liver, α-SMA was occasionally detected in vascular smooth
muscle cells and the expression level was low, revealing limited
activation of HSCs. After CCl4 administration, the α-SMA
spread to the portal area, demonstrating an increased activation of
HSCs. During reversal of fibrosis, the number of activated HSCs
declined via apoptosis. Together, our results further implicate
that PTEN may participate in the pathogenesis of hepatic fibrosis
by affecting the activation state and apoptosis of HSCs. We propose
that PTEN may inhibit the activation and proliferation of HSCs
whereas its downregulation promotes the activation and
proliferation of HSCs, leading to fibrogenesis
It has been reported that PTEN may regulate the
activity of fibroblasts (23);
low expression of PTEN may promote the differentiation of
myofibroblasts and enhance the morbidity of pulmonary interstitial
fibrosis (7). High expression of
PTEN may inhibit the proliferation and migration of hepatocarcinoma
cells (24) and induce apoptosis
(25). Our previous study also
revealed that the upregulation of PTEN expression induced apoptosis
of activated HSCs in vitro (9). In this study, we demonstrated that
during reversal of fibrosis, elimination of activated HSCs by
apoptosis occurred. It has been previously shown that aspergillin,
sulfasalazine and anti-TIMP1 antibodies promoted the reversal of
liver fibrosis by inducing the apoptosis of activated HSCs
(26). Since PTEN expression is
positively correlated with the apoptosis of activated HSCs, one of
the potential molecular mechanism for reversal of fibrosis is
possibly through apoptotic elimination of activated HSCs through
PTEN expression.
In conclusion, our data demonstrated that the
dynamic expression of PTEN in rat liver tissues had a significant
negative correlation with the activation and proliferation of HSCs
and had a significant positive correlation with the apoptosis of
activated HSCs in vivo. The association of PTEN expression
with HSC activation and apoptosis implicates its role in liver
fibrosis and its reversal. Accumulating evidence from our current
study and previously published data suggest that PTEN is a novel
and relevant target for the treatment of liver fibrosis.
Acknowledgements
This study was supported by the
National Natural Science Foundation of China (no. 30872513), the
Hebei Provincial Natural Science Foundation of China (C2010000565)
and the Department of Science and Technology in Hebei Province
(09966108D). The authors would like to thank the Foundations for
their support.
References
|
1.
|
D PoveroC BuslettaE NovoLV di BonzoS
CannitoC PaternostroM ParolaLiver fibrosis: a dynamic and
potentially reversible processHistol
Histopathol2510751091201020552556
|
|
2.
|
SL FriedmanMechanisms of hepatic
fibrogenesisGastroenterology13416551669200810.1053/j.gastro.2008.03.00318471545
|
|
3.
|
SL FriedmanHepatic stellate cells:
protean, multifunctional, and enigmatic cells of the liverPhysiol
Rev88125172200810.1152/physrev.00013.200718195085
|
|
4.
|
AM LaknerTL WallingIH McKillopLW
SchrumAltered aquaporin expression and role in apoptosis during
hepatic stellate cell activationLiver
Int314251201110.1111/j.1478-3231.2010.02356.x20958918
|
|
5.
|
T KisselevaDA BrennerHepatic stellate
cells and the reversal of fibrosisJ Gastroenterol Hepatol21Suppl
3S84S87200610.1111/j.1440-1746.2006.04584.x
|
|
6.
|
J LiC YenD LiawPTEN, a putative protein
tyrosine phosphatase gene mutated in human brain, breast, and
prostate
cancerScience27519431947199710.1126/science.275.5308.19439072974
|
|
7.
|
ES WhiteRG AtraszB HuNegative regulation
of myofibroblast differentiation by PTEN (phosphatase and tensin
homolog deleted on chromosome 10)Am J Respir Crit Care
Med173112121200610.1164/rccm.200507-1058OC16179636
|
|
8.
|
LS HaoXL ZhangJY AnPTEN expression is
down-regulated in liver tissues of rats with hepatic fibrosis
induced by biliary
stenosisAPMIS117681691200910.1111/j.1600-0463.2009.02515.x19703128
|
|
9.
|
LS HaoXL ZhangJY AnAdenoviral transduction
of PTEN induces apoptosis of cultured hepatic stellate cellsChin
Med J (Engl)12229072911200920092800
|
|
10.
|
I MontfortR Perez-TamayoCollagenase in
experimental carbon tetrachloride cirrhosis of the liverAm J
Pathol924114201978209692
|
|
11.
|
SJ CotlerN HayH XieML ChenPZ XuTJ LaydenG
GuzmanImmunohistochemical expression of components of the
Akt-mTORC1 pathway is associated with hepatocellular carcinoma in
patients with chronic liver diseaseDig Dis
Sci53844849200810.1007/s10620-007-9934-x17763954
|
|
12.
|
JP LaiS BaoIC DavisDL KnoellInhibition of
the phosphatase PTEN protects mice against oleic acid-induced acute
lung injuryBr J
Pharmacol156189200200910.1111/j.1476-5381.2008.00020.x19134000
|
|
13.
|
M PeyrouL BourgoinM FotiPTEN in
non-alcoholic fatty liver disease/non-alcoholic steatohepatitis and
cancerDig Dis28236246201010.1159/00028209520460918
|
|
14.
|
VR DasariK KaurKK VelpulaUpregulation of
PTEN in glioma cells by cord blood mesenchymal stem cells inhibits
migration via downregulation of the PI3K/Akt pathwayPLoS
One5e10350201010.1371/journal.pone.001035020436671
|
|
15.
|
S BuY AsanoA BujorK HighlandF HantM
TrojanowskaDihydrosphingosine 1-phosphate has a potent antifibrotic
effect in scleroderma fibroblasts via normalization of phosphatase
and tensin homolog levelsArthritis Rheum6221172126201020309867
|
|
16.
|
H XiaW KhalilJ KahmJ JessurunJ KleidonCA
HenkePathologic caveolin-1 regulation of PTEN in idiopathic
pulmonary fibrosisAm J
Pathol17626262637201010.2353/ajpath.2010.09111720395445
|
|
17.
|
W SatoY HorieE KataokaHepatic gene
expression in hepatocyte-specific Pten deficient mice showing
steatohepatitis without ethanol challengeHepatol
Res34256265200610.1016/j.hepres.2006.01.00316490391
|
|
18.
|
M TakashimaCJ ParsonsK IkejimaS WatanabeES
WhiteRA RippeThe tumor suppressor protein PTEN inhibits rat hepatic
stellate cell activationJ
Gastroenterol44847855200910.1007/s00535-009-0073-319436944
|
|
19.
|
A GeertsHistory, heterogeneity,
developmental biology, and functions of quiescent hepatic stellate
cellsSemin Liver Dis21311335200110.1055/s-2001-1755011586463
|
|
20.
|
R BatallerDA BrennerHepatic stellate cells
as a target for the treatment of liver fibrosisSemin Liver
Dis21437451200110.1055/s-2001-1755811586471
|
|
21.
|
SL FriedmanMolecular regulation of hepatic
fibrosis, an integrated cellular response to tissue injuryJ Biol
Chem27522472250200010.1074/jbc.275.4.224710644669
|
|
22.
|
MJ ArthurFibrogenesis II.
Metalloproteinases and their inhibitors in liver fibrosisAm J
Physiol Gastrointest Liver Physiol279G245G249200010915630
|
|
23.
|
RS NhoH XiaD DieboldJ KahmJ KleidonE
WhiteCA HenkePTEN regulates fibroblast elimination during collagen
matrix contractionJ Biol
Chem2813329133301200610.1074/jbc.M60645020016963781
|
|
24.
|
T TianKJ NanH GuoPTEN inhibits the
migration and invasion of HepG2 cells by coordinately decreasing
MMP expression via the PI3K/Akt pathwayOncol
Rep2315931600201020428814
|
|
25.
|
LQ CaoXL ChenQ WangUpregulation of PTEN
involved in rosiglitazone-induced apoptosis in human hepatocellular
carcinoma cellsActa Pharmacol
Sin28879887200710.1111/j.1745-7254.2007.00571.x17506947
|
|
26.
|
DA BrennerMolecular pathogenesis of liver
fibrosisTrans Am Clin Climatol Assoc120361368200919768189
|