Introduction
Nerve growth factor (NGF) is a polypeptide growth
factor with specific trophic function in nerve cells, which plays
an important role in the regulation of several processes, including
neuronal survival, proliferation, differentiation, neurite growth
and neurotransmission (1).
Adrenal medullary cells are derived from the neural
crest ectoderm and are connected with the sympathetic division of
the autonomic nervous system; in a glucocorticoid microenvironment,
they invade the adrenal primordium and then develop into medullary
cells with endocrine functions. Therefore, adrenal medullary cells
and sympathetic neurons bear many similarities, such as
synthesizing, storing and releasing catecholamines and
neuropeptides (2). Similarly,
mature and immature adrenal medullary cells have a pluripotent
differentiation capacity in varying degrees (3,4).
It has been verified by in vivo (5,6)
and in vitro (3,7,8)
studies that in a environment rich in NGF, adrenal medullary cells
can transform from an endocrine phenotype into a neuronal one and
their endocrine function simultaneously changes with the
transformation.
The aim of this study was to explore the NGF-induced
transdifferentiation of adrenal medullarry cells into neurons based
on the culture of the primary adrenal medullary cells. Using
proteomics technology, we screened the major candidate
differentially expressed proteins involved in the
transdifferentiation. Our results may provide new clues to further
illustrate the signal transduction process of NGF-regulated adrenal
medullary cell differentiation.
Materials and methods
Separation and primary culture of adrenal
medullary cells
Healthy newborn calf adrenal tissues were obtained
from the Cell Center of Xiangya Medical College of Central South
University, Changsha, China. The bilateral adrenal glands were
removed under aseptic conditions, and were immediately placed into
cleaning fluid with 3 antibiotics (100 μ/ml penicillin, 100 μg/ml
streptomycin and 50 μg/ml gentamicin) and washed 3 times. The
adrenal glands were cut longitudinally into 2 halves and the
external cortexes were cut off. Separated small pieces of medulla
were collected into the mouth of a sterile test tube. Small pieces
of medulla were cut into pieces with a sterile curved scissors;
then 4–5 ml 0.1% collagenase were added and the sections were
placed into a 37ºC water bath and allowed to dissolve for 45–60
min. The tubes were gently vibrated during the dissolution process
to mix the tissue completely with digestive juice. After the
dissolution, the filtrate was filtered through a 200-mesh sieve and
collected with a sterile centrifuge tube. Subsequently, 5% BSA
D-Hanks solution was added followed by centrifugtion for 5 min at
50–100 rpm. The fog-like supernatant was carefully absorbed and
abandoned. Subsequently, 1% D-Hanks solution was added to the
precipitate. D-Hanks solution containing 5% BSA with twice the
original volume of cell suspension was added to another sterile
centrifuge tube, and the cell suspension was gently added onto the
surface of the solution. Cellular sediment was detected at the
bottom of the tube after the solution was centrifuged at 100 rpm
for 5 min. The supernatant was carefully absorbed and abandoned.
Cells were washed with 1% BSA D-Hanks solution once and 10% of
FBS-DMEM complete medium was added. Cells were implanted in a 50-ml
glass cell culture bottle and a small number was obtained for cell
counting. The cells were then placed in an incubator at 37ºC with
5% CO2 and cultured in a 5% CO2 and 95% air
atmosphere. Two hours later, when non-adrenal chromaffin cells
adhered to the wall, the supernatant was gently absorbed and moved
into a culture bottle, and the solution was changed once every 2
days (9,10).
Electron microscopic identification of
adrenal medullary cells
Cells cultured in the culture bottle were dissolved
and collected with 0.25% of trypsin and 0.01% of EDTA, then
pre-fixed with 2.5% of glutaraldehyde, rinsed with 0.01 M PBS,
post-fixed with 1% of osmium tetroxide, and then rinsed with 0.01 M
PBS, stepwise dehydrated with acetoneacid (50, 70, 90 and 100%),
soaked with EPON 812 epoxy resin embedding medium and 100% acetone
in ratio of 1:1, then soaked and embed with pure embedding medium.
The blocks were trimmed on a pyramitome, sliced using a
ultramicrotome, and then double staining was performed using uranyl
acetate and lead nitrate. Finally, the ultrastructure of the
adrenal medullary cells was observed under an H-600 transmission
electron microscope and distinctive chromaffin granules with
homogeneous density were noted in the cytoplasm of normal adrenal
chromaffin cells.
Cell morphology and endocrine functional
changes with NGF intervention
The isolated adrenal medullary cells obtained using
the digestion method were equivalently (1×10⁶) divided
into the control group and the NGF-treated group, which were
inoculated directly in culture flasks for culture at 37ºC in a 5%
CO2 incubator. In the NGF-treated group, the adrenal
medullary cells were co-cultured with NGF (100 ng/ml) as previously
described (11) and the final
concentration was maintained at 10−4 mM. Equivalent
amounts of PBS were added to the control group. Morphological
changes were observed under a phase contrast microscope, and the
medium was changed every 2 days. Cell culture supernatant was
collected on the 1st, 2nd, 4th and 6th day. Epinephrine
concentration in the culture supernatant was detected by
enzyme-linked immunosorbent assay (ELISA).
Observations of cell ultrastructural
changes following treatment with NGF under an electron
microscope
Primary cultures of adrenal medullary cells were
collected 7 days after treatment with NGF, fixed in 2.5%
glutaraldehyde, rinsed with 0.01 M PBS, post-fixed with osmium
tetroxide, rinsed with 0.01 M PBS, stepwise dehydrated with pyruvic
acid (50, 70, 90 and 100%), soaked with EPON 812 epoxy resin
embedding medium and 100% acetone in ratio of 1:1, then soaked and
embed with pure embedding medium. The blocks were trimmed on a
pyramitome, sliced using a ultramicrotome, and then double staining
was performed using uranyl acetate and lead nitrate. Finally, the
ultrastructure of the adrenal medullary cells was observed under an
H-600 transmission electron microscope.
Two-dimensional gel electrophoresis, gel
image analysis and mass spectrum analysis
Adrenal medullary cells were collected 7 days
following treatment with NGF and the supernatant was removed by
centrifugation and washed 3 times with 0.9% NaCl solution. The
supernatant was removed by a brief centrifugation at 10,000 rpm.
Subsequently, 400 μl of tissue lysate were added to these cells (7
M urea, 2 M thiourea, 4% CHAPS, 65 mM DTT, 40 mM Tris, 0.5 mM EDTA,
2% NP-40, 1% Triton X-100, 5 mM PMSF and 2% pharmalyte) and mixed
using a pipette tip. The sequence of freezing and thawing was
repeated for a total of 3 times in liquid nitrogen tank. It was
allowed to stand for 60 min in a 37ºC water bath and centrifuged
for 30 min at 12,000 rpm. The supernatant was collected in another
2 Eppendorf tubes. Attention should be paid not to draw the lower
cell debris sediment. Five microliters sample of each specimens
were retained for the measurement of the concentration. The
extracted protein samples were stored at −70ºC. Protein
concentrations were measured using the 2D Quant protein
quantification kit (2D Quant kit, Amersham Biosciences, Uppsala,
Sweden) for two-dimensional gel electrophoresis analysis.
Solid phase Ph gradient - SDS
two-dimensional gel electrophoresis
The operating steps were carried out according to
the IPGphor isoelectric focusing system guide. The required sample
volume was calculated based on the concentration of cellular
proteins. The protein sample level of each rubber stripe was 800 μg
and appropriate amount of hydration liquid was added (8 M urea, 2%
CHAPS, 40 mM Tris, 18 mM of DTT, 0.5% IPG buffer PH3-10L, a trace
of bromophenol blue) and thoroughly mixed. The sample volume was
450 μl and it was added to the IPG gel tank (holder). Automatic IPG
dry strip hydration and isoelectric focusing were performed at
20ºC, the total voltage time product was 69,990 V/h, wherein 30 V
low voltage hydrated for 13 h, then 100 V for 1 h (100 Vhr), 500 V
for 1 h (500 Vhr), 1,000 V for 1 h (1,000 Vhr), and finally
stabilized at 8,000 V for 8.5 h for isoelectric focusing. After
isoelectric focusing, the strips were placed in the balance tubes
with the gel side facing up. Ten milliliters of balanced salt
solution A and 10 ml of balanced salt solution B were poured into
the tubes successively for a two-step balance. Shaking was carried
out on a rocker with each balance for 15 min. After equilibration,
the IPG strips were transferred to the upper end of a 12.5%
SDS-PAGE gel, and then placed in the Ettan DALT II vertical
electrophoresis tank (Amersham Biosciences) for a second vertical
electrophoresis. After electrophoresis, the two-dimensional
polyacrylamide gel electrophoresis (2-DE) gel was stained with
coomassie blue and the experiment was repeated 3 times. Coomassie
blue-stained gels were scanned using an ImageScanner gel scanner
(Amersham Biosciences) and LabScan scanning software (Applied
Biosystems, Foster City, CA, USA) to obtain images. The differences
in the two-dimensional electrophoresis pattern of the control group
and NGF-treated group were analyzed using PDQuest 2-DE software
(Bio-Rad, Hercules, CA, USA). The protein spots showing a >2
-fold change in expression were selected for mass spectrometry
analysis.
Differential protein expression patterns were
obtained by mass spectrometry. The protein spots of interest
showing differential expression were cut into Eppendorf tubes,
decolorated for 30 min with 50% acetonitrile and 100 mM ammonium
bicarbonate. They were then dehydrated, frozen and drained; then 10
μl TPCK trypsin (0.1 mg/l) was added followed by imbibition on ice
for 60 min, followed by enzymolysis at 37ºC for 12 h; 30 μl extract
was then used (100% acetonitrile:5% formic acid, 1:1) for
extraction for 60 min; extraction was repeated one more time. The
extract was collected in 0.5 ml Eppendorf tubes, which was frozen
and concentrated to be completely lyophilized. The prepared samples
were analyzed by electrospray ionization quadrupole time-of-flight
(ESI-Q-TOF) electrospray ionization tandem mass spectrometry. All
measurements were performed in the positive ion mode with nitrogen
as the atomizing gas and argon as the collision gas. The source
temperature was 80ºC, the cone voltage was 50 V, TOF acceleration
voltage was 0.2 kV and micro-channel plate (MCP) detector voltage
was 2.7 kV. When liquid chromatography (LC)-ESI-MS/MS automatic
analysis was being performed, the capillary voltage was 3,000 V.
The measurement results were presented in the form of a peak list
document. The NCBI database was retrieved using Mascot software for
the identification of proteins.
Verification of protein spots showing
differential expression levels by western blot analysis
The adrenal medullary cells which were treated with
NGF for 2, 4 and 6 days were collected and sufficiently washed with
PBS. They were then added to the pre-cooled lysis buffer solution
(50 mM Tris pH of 8.0, 150 mM NaCl, 0.1% SDS, 1% Triton X-100, 0.5%
sodium deoxycholate, l mM PMSF, 5 μg/l aprotinin, 5 μg/l
leupeptin), then vortex mixed. After cracking on ice for 30 min,
they were removed by centrifugation at 12,000 × g for 10 min. The
supernatant was the cell total protein. When the protein
concentration was determined, 30 μg [ras homologus oncogene (Rho)
GDP dissociation inhibitor α (RhoGDIα) detected] or 100 μg
(peripherin detected) total proteins were absorbed for the
separation of 12.5% SDS-PAGE. The proteins were transferred onto a
nitrocellulose membrane. The blotting membrane was blocked at room
temperature for 1 h with 5% skim milk. Dilution of the first
antibody (RhoGDIα antibody 1:600 dilution, peripherin antibody
1:150 dilution, β-actin antibody 1:2,000 dilution) was added to the
hybridization bags and incubated overnight at 4ºC in an orbital
shaker platform (generally for 18–20 h). Horseradish peroxidase
(HRP) was added to hybridization bags to label goat anti-rabbit
(1:10,000 dilution) and incubated at 37ºC in an orbital shaker
platform for 1 h, then washed 3 times with PBS. ECL reagents were
used for luminescence and development. β-actin was served as an
internal reference and the experiment was repeated 3 times.
Statistical analysis
The results are presented as the means ± standard
deviation. The data were obtained by univariate analysis of
variance using SPSS11.0 statistical software. A comparison between
the untreated and the group treated with NGF was performed by
repeated measures analysis of variance and a P-value <0.05 was
considered to indicate a statistically significant difference.
Results
Identification of adrenal medullary
cells
As observed under an electron microscope, there were
characteristic evenly distributed light black chromaffin cell
secretory granules (Fig. 1A) in
the cytoplasm of the adrenal medullary cells; thus, chromaffin
cells of the adrenal medulla were confirmed.
 | Figure 1Electron microscopic identification of
adrenal medullary cells. (A) As revealed by an electron microscope
(x10,000), there were characteristic evenly distributed light black
chromaffin cell secretory granules (arrow). (B) Treatment with
nerve growth factor (NGF) altered the ultrastructure of the adrenal
medullary cells, as observed under an electron microscope (x6,000);
the freshly isolated adrenal medullary cells were round in shape,
while in the control group, they remained round at 2 days and at 4
days, a small number of cells transformed into bipolar- or short
rod-like shaped cells or cells with a club-like shape (arrow). (C)
Primary cultures of adrenal medullary cell under a phase contrast
microscope (x400); 2 days after the cells were treated with NGF,
filamentous or mesh protrusions were noted in the cells and the
length of the protrusions gradually increased with time. (D)
Ultrastructure of adrenal medullary cells following treatment with
NGF under a phase contrast microscope (x400). Following treatment
with NGF, a high number of club-like shaped cells and villi were
observed on the surface of cell membrane, as well as the formation
of small vesicles near the cell membrane with a cytoplasm rich in
mitochondria but with an obscure structure, with a loss of part of
the ridges, part of the endoplasmic reticulum expansion and
vacuoles in some cytoplasms. |
Effect of NGF on the biological behavior
of adrenal medullary cells
Under a phase contrast microscope, the freshly
isolated adrenal medullary cells were round in shape, while in the
control group, the cells remained round for 2 days; after 4 days a
small number of cells transformed into bipolar-or short rod-like
shaped cells or cells with a club-like shape (Fig. 1B). In the NGF group, 2 days after
the cells were treated with NGF, filamentous or mesh protrusions
were noted in the adrenal medullary cells and the length of the
protrusions gradually increased with time (Fig. 1C).
Under an electron microscope, the surface of the
adrenal medulla normal cell membrane was smooth and the
mitochondria were clear without vesicles. After the cells were
treated with NGF, a high number of club-like shaped cells and villi
were observed on the surface of cell membrane; we also observed the
formation of small vesicles near the cell membrane and the
cytoplasm was rich in mitochondria but obscure in structure; part
of the ridges were lost, as well as part of the endoplasmic
reticulum and vacuoles in some of the cytoplasms (Fig. 1D).
Epinephrine concentration changes before
and after treatment with NGF
The total effect of adrenaline after treatment with
NGF was F=10.338, P=0.018 and it was confirmed that the adrenaline
concentrations were significantly lower after treatment with NGF
(Table I).
 | Table IEpinephrine concentration changes
before and after treatment with nerve growth factor (NGF). |
Table I
Epinephrine concentration changes
before and after treatment with nerve growth factor (NGF).
| Before treatment
(ng/ml) | | After treatment
(ng/ml) |
|---|
| Day 2 | 10.04±0.53 | | 9.44±1.26 |
| Day 4 | 9.78±1.08 | | 7.14±0.92 |
| Day 6 | 9.62±1.32 | | 7.0±1.35 |
| F-value | | F=10.338 | |
| P-value | | P=0.018 | |
Two-dimensional gel electrophoresis
pattern before and after treatment of adrenal medullary cells with
NGF
The same batch of total proteins of adrenal
medullary cell samples treated with NGF with the sample volume of
1,000 μg were assayed repeatedly 3 times. The 3 two-dimensional gel
electrophoresis patterns were quite similar. An ImageScanner was
used to obtain 2 images and they were then analyzed using
PDQuest7.1.0 software (Bio-Rad). The average protein spots in the
adrenal medullary cell group and NGF-treated group were 752±34 and
693±46, respectively and the matching rate reached 92.1%.
Subsequently, 50 protein spots from 3 of the same sample gel
pattenrs were randomly selected with mutual matching
characteristics and clear distinctions. A point near the center was
selected as the origin and the reference gel (Marker) was taken as
the reference position. The measured deviation of the protein spots
among the different gels in the direction of the isoelectric point
was 0.857±0.214 mm and the measured deviation in the direction
molecular weight was 0.912±0.235 mm; therefore, two-dimensional gel
electrophoresis patterns in the adrenal medullary cell group and
NGF-treated group with higher resolution and better repeatability
were obtained. The two-dimensional gel electrophoresis patterns are
shown in Fig. 2.
Separation and identification of protein
spots showing differential expression
Based on the better repeatability and comparability
obtained, we used PDQuest software to analyze the differentially
expressed proteins between the 2 groups. Protein spots showing
differential expression were referred as the point at which the
expression level differed by >2 fold and the 3 electrophoretic
patterns revealed the same changes. Forty-eight spots showed an
upregulated expression and 37 spots showed a downregulated
expression in the NGF-treated group and no ‘all-or-none’ spots with
significant differences in expression were found. Fourteen protein
spots showing an upregulated expression and 6 proteins spots
showing a downregulated expression within the above scope were
randomly selected for identification by matrix-assisted laser
desorption/ionization-time-of-flight mass spectrometry
(MALDI-TOF-MS).
Twenty protein spots showing a >2 fold change in
expression were selected from the gel. After the identification and
analysis by MALDI-TOF, Mascot was used to query MSDB or NCBInr
database. The search results were comprehensively evaluated by
Mascot scoring, the number of matching segments and the coverage
rate. A total of 20 protein spots were identified by mass
spectrometry and 17 good peptide mass fingerprintings were
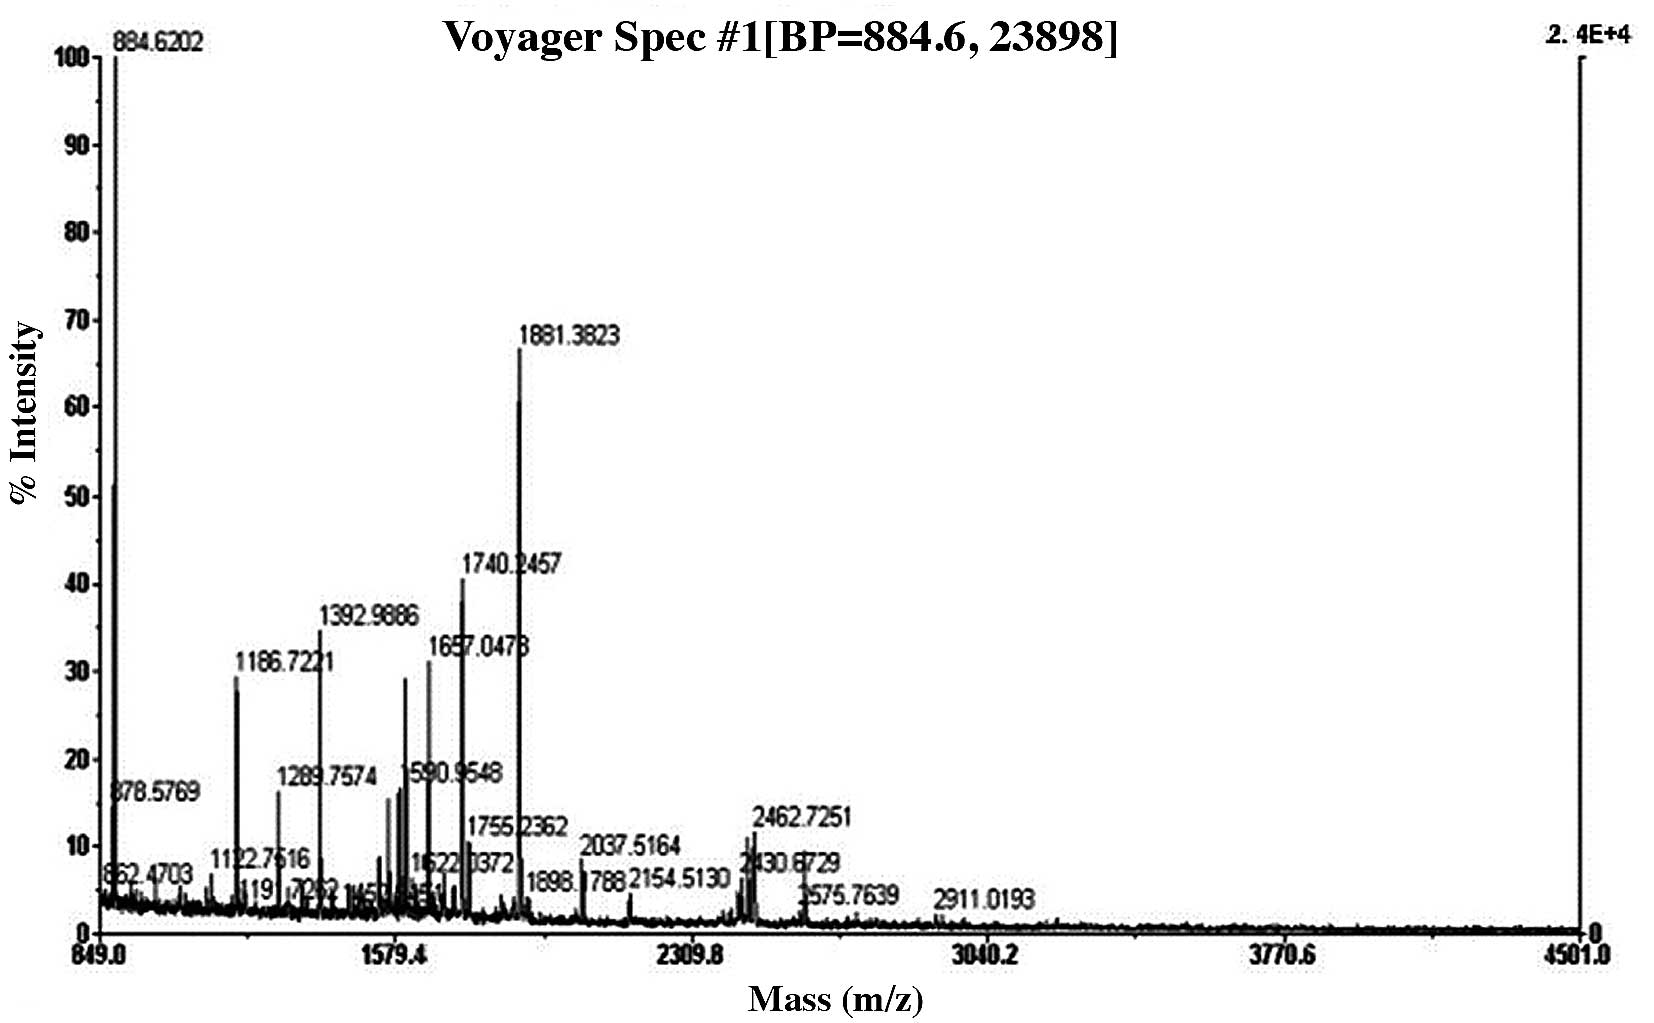
obtained, in which point 1, 9 and 16 had no results. Table II shows the obtained matched
conditions of the peptide fragments of the protein spots with
differential expression through identification, expression after
treatment with NGF, protein name, molecular weight and the coverage
rate of the isoelectric point. Figs.
3 and 4 show the peptide mass
fingerprintings of differential protein spots 10 and 19 obtained by
identification through MALDI-TOF-MS.
| Table IIThe features of the 17 protein spots
with the most prominent differential expression. |
Table II
The features of the 17 protein spots
with the most prominent differential expression.
| Spot | Database ID | Isoelectric
point | Matching
peptides | Molecular weight | Sequence coverage
(%) | Score | Protein name |
|---|
| 2 | Q80WH8_9MU | 5.83 | 33 | 54058 | 72 | 269 | Type II cytoskeletal
8 |
| 3 | RIQ61509 | 6.20 | 9 | 30212 | 39 | 100 | Elongation factor 2
(Fragment) |
| 4 | Q4FZS2 | 6.36 | 19 | 37330 | 69 | 146 | Hypothetical
protein |
| 5 | Q566Q8 | 5.28 | 9 | 27647 | 40 | 86 | Basophilic leukemia
expressed protein BLES03 |
| 6 | JN0924 | 6.12 | 15 | 22865 | 73 | 185 | Heat shock 27
protein |
| 7 | Q6PDU9 | 6.23 | 11 | 27703 | 50 | 75 | NADH dehydrogenase
(ubiquinone) flavoprotein 2 |
| 8 | ALDR | 6.28 | 13 | 36099 | 53 | 135 | Aldose reductase |
| 10 | Q496Z5 | 5.32 | 47 | 53503 | 82 | 370 | Peripherin
intermediate filament protein |
| 11 | Q5DK8 | 6.43 | 39 | 39064 | 59 | 102 | NADH dehydrogenase
Fe-S protein |
| 12 | PPIA | 8.37 | 13 | 17960 | 66 | 123 | Peptidyl-prolyl
cis-trans isomerase A |
| 13 | AAB46848 | 6.14 | 14 | 15321 | 77 | 149 | Fatty acid-binding
protein |
| 14 | S54181 | 8.11 | 14 | 38233 | 52 | 89 | Stretch-binding
protein CSBP |
| 15 | A41015 | 8.17 | 14 | 47668 | 40 | 80 | Dihydrolipoamide
S-succinyltransferase |
| 17 | R6RTP2 | 4.44 | 9 | 11685 | 93 | 96 | Acidic ribosomal
protein P2 |
| 18 | APOA1_BOVIN | 5.71 | 13 | 30258 | 40 | 73 | ApolipoproteinA-I
precursor |
| 19 | Q8BPI0 | 5.20 | 13 | 22991 | 66 | 87 | Rho GDP
dissociation inhibitor (GDI)α |
| 20 | TVHUH | 5.16 | 12 | 21627 | 79 | 96 | Transforming
protein p21 |
Functional classification was performed for the
preliminary identified differentially expressed proteins and the
main types of proteins were divided into: i) cytoskeletal proteins:
type II cytoskeletal 8 and peripherin intermediate filament
protein; ii) basic metabolic enzymes: aldose reductase,
peptidyl-prolyl cis-trans isomerase A, NADH dehydrogenase
(ubiquinone) flavoprotein 2, NADH dehydrogenase (ubiquinone) Fe-S
protein 1, dihydrolipoamide S-succinyltransferase; iii) molecular
chaperone: heat shock protein 27; iv) signal transduction proteins
RhoGDIα, fatty acid-binding protein; v) cell proliferation and
apoptosis-associated proteins: elongation factor 2 (fragment), dC
stretch-binding protein; vi) proteins of unknown function,
hypothetical proteins. The features of the 17 protein spots
identified with the most prominent differential expression are
summarized in Table II.
Decreased expression of RhoGDIα
The expession of RhoGDIα at different time points
following treatment with NGF was examined by western blot analysis.
Compared with the control group (1.87±0.21), RhoGDIα protein
expression in the adrenal medullary cells at 2 and 4 days following
tretment with NGF continued to decrease (1.26±0.15, P<0.05;
1.00±0.18, P<0.01). However, no significant difference was noted
in the RhoGDIα expression level between 4 and 6 days following
treatment with NGF (Fig. 5A).
Peripherin expression increased at different time
points following treatment with NGF. As shown by western blot
analysis, compared with the control group (0.81±0.07), peripherin
expression in the adrenal medullary cells at 2 days following
treatment with NGF (1.25±0.11, P<0.05) significantly increased,
and there was no significant difference in peripherin protein
expression after the 2-day time point (between 2 and 6 days
(Fig. 5B).
Discussion
Chromaffin cells of the adrenal medulla are the
precursor cells of sympathetic ganglion cells and adrenal medullary
cells with 2 phenotypes, the endocrine and neuronal phenotype
(12). The phenotype in normal
target tissue is the endocrine phenotype. With the same origin of
neurons, these cells have a potential capability to transform into
neurons, apart from their endocrine function. The study proves that
adrenal medullary cells undergo neuron-like changes following
treatment with NGF, demonstrated by the change in their morphology,
ultrastructure and endocrine function.
Following treatment with NGF, two-dimensional gel
electrophoresis and mass spectrometry revealed that among the
protein spots with the most prominent differential expression, 48
spots showed an upregulated expression and 37 spots showed a
downregulated expression; no ‘all-or-none’ spots with significant
differences in expression were found. Within the abovementioned
scope, 14 protein spots with upregulated expression and 6 with
downregulated expression were randomly selected for identification
with MALDI-TOF-MS. The results revealed that 17 protein spots
showed a prominent differential expression. Peripherin and RhoGDIα
may play a role in this process of differentiation.
Peripherin is not only a type III intermediate
filament protein, but the most important intermediate filament
protein in sympathetic neurons and PC12 cells. It is mainly
involved in the constitution of the cytoskeleton, as well as the
cell’s internal and external information transmission and cell
differentiation. It is expressed in some neurons of the developing
or differentiated peripheral and central nervous system. The gene
expression of peripherin has strict tissue specificity, but it can
be transformed from one type to another in the main differentiation
stages or under the influence of intrinsic and extrinsic factors.
Previous studies have demonstrated that NGF induces the
upregulation of the peripherin expression in PC12 cells and is
involved in the process of axon growth and extension (13,14). In the process of cell development,
regeneration and differentiation, a significant increase in
peripherin expression level is consistent with the time phase of
the germination and growth of neural axons. As previously shown
(15,16), 12 h after the treatment of PC12
cells with NGF, peripherin expression was observed and 48 h later,
peripherin expression levels began to increase this increase was
maintained for a long time. On the contrary, if peripherin
expression is intervened by peripherin-siRNA, it can obviously
resist the germination, extension and maintainance (17) of cell axons. The results of the
present study showed that the peripherin expression level in
adrenal medullary cells was upregulated following treatment with
NGF and western blot analysis verified that peripherin expression
levels also increased, indicating that NGF induces an increase in
neuronal cytoskeletal protein expression in adrenal medullary
cells; thus, it can be hypothesized that the transformation of
medullary cells to neurons may be the result of an increase in the
expression of neuronal-specific peripherin induced by NGF.
Rho protein is one of the members of the Ras
superfamily of guanosine triphosphatase (GTPase), which can
generally exist in either an active or inactive state, that is, it
will be activated if it combines with GTP and it will be
inactivated if it combines with guanosine diphosphate (GDP)
(18,19). The active RhoGTP enzyme can
combine with effector proteins, involved in the regulation of a
series of important biological processes in cells, such as the
regulation of gene transcription, cell transformation and the
cytoskeleton. The regulation effect of GDIs is of the most
important among the circulating regulatory factors of active and
inactive Rho protein. Studies have shown that RhoGDI can, when used
as a negative regulator, affect the growth regulation and
transformation of cells by activating Rho-family members Cdc42
(20,21). RhoGDIα is an important regulatory
factor for the maintenance of cell morphology and function. As the
intracellular RhoGDIα expression level is almost equal to the total
Rho protein expression levels (including RhoA, Rac and Cdc42,
etc.), it may be presumed that all the RhoGDIα in cells can combine
RhoGTPase (active or inactive status) and form complexes.
Stimulated by endogenous and exogenous NGF, the reduction of total
RhoGDIα expression levels in cells means that more and more Rho
protein can be dissociated from complexes and be activated by
guanine nucleotide exchange factors (GEFs), and then act on
downstream effector molecules. The study by Li et al
(23) showed that the obvious
decrease in the RhoGDI expression level can relieve the inhibitory
effects on endogenous Racl and protein molecules of other Rho
family members, thus regulating the secretory function of
chromaffin cells. Studies on vascular smooth muscle cells (VSMCs)
have shown (24) that when cells
undergo differentiation following endogenous and exogenous
stimulation, RhoGDIα expression levels in cells significantly
decrease accompanied by the obvious increase in the Rac expression
level. Using siRNA-RhoGDIα to transfect VSMCs can upregulate
h1-calponin (a type of smooth muscle cell-specific differentiation
marker protein), while using siRNA-Rac to transfect VSMCs can
downregulate h1-calponin. In the present study, we found that the
RhoGDIα protein expression level in adrenal medullary cells
decreased following treatment with NGF. Western blot analysis also
verified the obvious decrease in RhoGDIα expression. We
hypothesized that the downregulated expression of RhoGDIα may be
associated with cell growth regulation, transformation and the
formation of the cytoskeleton by releasing more Rho GTPase and
transforming them into an activated form.
In conclusion, in this study, we isolated and
identified a group of proteins with a significant change in
expression in primary adrenal medullary cells treated with NGF by
two-dimensional gel electrophoresis combined with mass
spectrometry, and verified changes in peripherin and RhoGDIα
protein expression by immunoblotting. These data revealed the key
proteins that may lead to the changes in the biological behavior of
adrenal medullary cells. Our results may provide an important basis
and clues for the further investigation of the signal transduction
mechanisms of the NGF-induced transdifferentiation of adrenal
medullary cells.
Acknowledgements
This study was supported by grants from the National
Natural Science Foundation of China (nos. 30960143 and
30570802).
References
|
1
|
Freund-Michel V and Frossard N: The nerve
growth factor and its receptors in airway inflammatory diseases.
Pharmacol Ther. 117:52–76. 2008. View Article : Google Scholar : PubMed/NCBI
|
|
2
|
Unsicker K, Huber K, Schütz G and Kalcheim
C: The chromaffin cell and its development. Neurochem Res.
30:921–925. 2005. View Article : Google Scholar : PubMed/NCBI
|
|
3
|
Barreto-Estrada JL, Medina-Ortiz WE and
Gareia-Arraras JE: The morphological and biochemical response of
avian embryonic sympathoadrenal cells to nerve growth factor is
developmentally regulated. Brain Res Dev Brain Res. 144:1–8. 2003.
View Article : Google Scholar
|
|
4
|
Forander P, Broberger C and Stromberg I:
Glial-cell-line-derived neurotrophic factor induces nerve fibre
formation in primaly cultures of adrenal chromaffin cells. Cell
Tissue Res. 305:43–51. 2001. View Article : Google Scholar : PubMed/NCBI
|
|
5
|
Wang J, Hu CP and Feng JT: Dysfunction of
releasing adrenaline in asthmatic adrenaline medullary chromaffin
cells due to functional redundancy primed by nerve growth factor.
Zhonghua Jie He He Hu Xi Za Zhi. 29:812–815. 2006.(In Chinese).
|
|
6
|
Li QG, Wu XR, Li XZ, Yu J, Xia Y, Wang AP
and Wang J: Neural-endocrine mechanisms of respiratory syncytial
virus-associated asthma in a rat model. Genet Mol Res.
11:2780–2789. 2012. View Article : Google Scholar : PubMed/NCBI
|
|
7
|
Lillien LE and Claude R: Nerve growth
factor is a mitogen for cultured chromaffin cells. Nature.
317:632–634. 1985. View
Article : Google Scholar : PubMed/NCBI
|
|
8
|
Unsicker K, Zwarg U and Habura-Flüh O:
Differentiation and transdifferentiation of adrenal chromaffin
cells of the guinea pig. III Transplants under the kidney capsule.
Cell Tissue Res. 229:299–308. 1983. View Article : Google Scholar : PubMed/NCBI
|
|
9
|
Livett BG: Adrenal medullary chromaffin
cells in vitro. Physiol Rev. 64:1103–1161. 1984.PubMed/NCBI
|
|
10
|
Unsicker K and Muller TH: Purification of
bovine adrenal chromaffin cells by differential plating. J Neurosci
Methods. 4:227–241. 1981. View Article : Google Scholar : PubMed/NCBI
|
|
11
|
Koike T: A possible involvement of
cytoplasmic Ca2+ in sodium dependency of neurite
outgrowth of rat pheochromocytoma PC12 cells. Biochim Biophys Acta.
763:258–264. 1983.PubMed/NCBI
|
|
12
|
Unsicker K, Krisch B, Otten U and Thoenen
H: Nerve growth factor-induced fiber outgrowth from isolated rat
adrenal chromaffin cells: impairment by glucocorticoids. Proc Natl
Acad Sci USA. 75:3498–3502. 1978. View Article : Google Scholar : PubMed/NCBI
|
|
13
|
Aletta JM, Shelanski ML and Greene LA:
Phosphorylation of the peripherin 58-kDa neuronal intermediate
filament protein. Regulation by nerve growth factor and other
agents. J Biol Chem. 264:4619–4627. 1989.PubMed/NCBI
|
|
14
|
Sterneck E, Kaplan DR and Johnson PF:
Interleukin-6 induces expression of peripherin and cooperates with
Trk receptor signaling to promote neuronal differentiation in PC12
cells. J Neuroehem. 67:1365–1374. 1996. View Article : Google Scholar : PubMed/NCBI
|
|
15
|
Leonard DG, Gorham JD, Cole P, et al: A
nerve growth factor-regulated messenger RNA encodes a new
intermediate filament protein. J Cell Biol. 106:181–193. 1988.
View Article : Google Scholar : PubMed/NCBI
|
|
16
|
Troy CM, Greene LA and Shelanski ML:
Neurite outgrowth in peripherin-depleted PC12 cells. J Cell Biol.
117:1085–1092. 1992. View Article : Google Scholar : PubMed/NCBI
|
|
17
|
Helfand BT, Mendez MG, Pugh J, et al: A
role for intermediate filaments in determining and maintaining the
shape of nerve cells. Mol Biol Cell. 14:5069–5081. 2003. View Article : Google Scholar : PubMed/NCBI
|
|
18
|
Sah VP, Seasholtz TM, Sagi SA and Brown
JH: The role of Rho in G protein-coupled receptor signal
transduction. Annu Rev Pharmacol Toxicol. 40:459–489. 2000.
View Article : Google Scholar : PubMed/NCBI
|
|
19
|
Meriane M, Mary S, Comunale F, et al:
Cdc42Hs and Rac1 GTPases induce the collapse of the vimentin
intermediate filament network. J Biol Chem. 275:33046–33052. 2000.
View Article : Google Scholar : PubMed/NCBI
|
|
20
|
Gibson RM, Gandhi PN, Tong X, et al: An
activating mutant of Cdc42 that fails to interact with Rho
GDP-dissociation inhibitor localizes to the plasma membrane and
mediates actin reorganization. Exp Cell Res. 301:211–222. 2004.
View Article : Google Scholar
|
|
21
|
Lin Q, Fuji RN, Yang W and Cerione RA:
RhoGDI is required for Cdc42-mediated cellular transformation. Curr
Biol. 13:1469–1479. 2003. View Article : Google Scholar : PubMed/NCBI
|
|
22
|
Michaelson D, Silletti J, Murphy G, et al:
Differential localization of Rho GTPases in live cells: regulation
by hypervariable regions and RhoGDI binding. J Cell Biol.
152:111–126. 2001. View Article : Google Scholar : PubMed/NCBI
|
|
23
|
LI Q, Ho CS, Marineseu V, et al:
Facilitation of Ca(2+)-dependent exocytosis by Rac1-GTPase in
bovine chromaffin cells. J Physiol. 550:431–445. 2003.
|
|
24
|
Qu MJ, Liu B, Qi YX and Jiang ZL: Role of
Rac and Rho-GDI alpha in the frequency-dependent expression of
h1-calponin in vascular smooth muscle cells under cyclic mechanical
strain. Ann Biomed Eng. 36:1481–1488. 2008. View Article : Google Scholar : PubMed/NCBI
|