Introduction
The prevalence of obesity worldwide has
progressively increased over the past few decades in the majority
of high- and low-income countries (1). Obesity and the metabolic pathologies
associated are the most common and detrimental metabolic diseases,
affecting over 50% of the adult population. Obesity is a
multi-factorial disease that develops from the interaction between
genetic, environmental and psychosocial factors (2). Accordingly, identifying any of these
factors is beneficial for the prevention and/or treatment of
obesity.
The calcium-sensing receptor (CaSR) is a
G-protein-coupled receptor that plays a critical role in modulating
calcium homeostasis (3). It was
cloned from the bovine parathyroid gland by Brown et al in
1993 (4). Subsequently, CaSR has
been reported to be expressed in several other organs, where it
plays various roles (3). In 2005,
Cifuentes et al first cloned CaSR in human omental adipose
tissue (5). The activation of
CaSR has been shown to induce an antilipolytic effect in adipose
cells (6). In a previous study,
we demonstrated that the activation of CaSR inhibits lipolysis by
mediating the intracellular calcium ([Ca2+]i)
and cyclic adenosine monophosphate (cAMP) pathways in human SW872
cells (7). In addition, we also
reported that CaSR activation promotes adipogenesis by regulating
key transcription factors, including peroxisome
proliferator-activated receptor γ (PPARγ) and CCAAT element-binding
protein α (C/EBPα) (8). In
another previous study, we demonstrated that CaSR activation
affects fat accumulation in rats fed a low calcium diet (9). These findings collectively suggest
the important role of CaSR in the development of obesity.
CaSR can be stimulated allosterically, by changes in
its expression, or by a combination of both (3). CaSR regulates calcium homeostasis by
sensing extracellular calcium concentrations and by mediating
alterations in parathyroid hormone (PTH) secretion (10). The activation of CaSR produces
rapid, transient increases in cytosolic calcium levels by
mobilizing calcium from intracellular stores and by increasing
calcium influx through voltage-sensitive calcium channels in the
cell membrane (11).
[Ca2+]i plays an important role in the
metabolic disorders of obesity and insulin resistance (12–14). Obese patients usually exhibit
elevated basal [Ca2+]i levels in adipocytes
(14). Therefore, it is
reasonable to assume that CaSR may play a role in the development
of obesity by mediating the increase in
[Ca2+]i levels and affecting lipogenesis. In
addition, extracellular calcium and L-amino acids have been shown
to activate CaSR, as evidenced by [Ca2+]i
mobilization (15).
Changes in the expression of CaSR may also induce
various effects in different tissues (3). The mRNA and/or protein expression of
CaSR is modulated by a variety of substances and biochemical
conditions, such as extracellular calcium (16), vitamin D (17) and phosphorus (18). Obesity is associated with a state
of low-grade chronic inflammation and this may represent a link
between the obese state and health complications associated with
obesity, such as cardiovascular disease and insulin resistance
(19,20). In 2010, Cifuentes et al
reported that obesity-associated pro-inflammatory cytokines
increase CaSR protein expression in adipocytes (21) and that CaSR activation elevates
pro-inflammatory cytokine expression in human adipose cells and
adipose tissue (22), suggesting
that inflammatory factors are possible regulators of CaSR in obese
individuals. In a previous study, we also found that CaSR
expression was induced in the white adipose tissue of rats fed a
low calcium diet (9). However, to
our knowledge, no studies to date have identified the specific
mechanisms of action of CaSR in the white adipose tissue of obese
subjects.
In this study, we investigated the gene and protein
expression of CaSR in the white adipose tissue of obese human
individuals and rats. We also determined the possible regulators of
CaSR, such as serum calcium, vitamin D, inflammatory cytokines and
amino acids. Our results revealed that obesity produces a state of
lower vitamin D and amino acids and a state of higher inflammation,
with the adipose tissue CaSR expression remaining unaltered. These
data, in conjunction with those from our previous studies, suggest
that CaSR functions in the white adipose tissue of human subjects
and rats through an allosteric mechanism.
Materials and methods
Human subjects
Ten obese [aged 18–50 years; body mass index (BMI)
≥28 kg/m2] and 10 non-obese males (aged 18–50 years; BMI
≥18 to ≤24 kg/m2) undergoing elective abdominal surgery
in the Second Affiliated Clinical Hospital of Harbin Medical
University, Harbin, China were recruited in this study. To avoid
the influence of sex hormones on CaSR gene and protein expression,
we recruited only male subjects in this study. Height was measured
without wearing shoes by using a steel tape with a maximum of 2 m
and an accuracy of 0.1 m. Body weight was measured using an
electronic scale with a dial showing a maximum of 136 kg and an
accuracy of 0.5 kg. Fat mass was measured using the bioelectric
impedance method with a body FM analyzer (Tanita TBF-300; Tanita
Corp., Tokyo, Japan) according to the manufacturer’s instructions.
This method has been validated for Asian children (23) and adults (24) and has been used by us in previous
studies (25,26). The subjects were instructed to
stand barefoot on the metal sole plates of the machine. Gender and
height details were entered manually into the system. The
measurement of impedance uses a standard 50 kHz-0.8 mA sine wave
constant current. BMI was calculated as weight (kg) divided by the
square of height (m). Subjects with a BMI ≥28 kg/m2 were
categorized as obese according to the criteria for the Chinese
population (27). Blood samples
were collected after 12 h of overnight fasting. The samples were
left to coagulate at 4°C and then centrifuged at 3,000 rpm for 15
min to extract serum. None of the patients were acutely ill, or
showed any clinical evidence of endocrine diseases. The clinical
characteristics of the subjects are presented in Table I. Information on age, height,
alcohol consumption, cigarette smoking and physical activity at
work and at leisure was obtained from questionnaires. Following
anesthesia, samples of subcutaneous adipose tissue (average,
1.0–1.5 g) were obtained from the incision site 10–20 min after
surgery commenced and frozen below −80°C prior to the detection of
CaSR mRNA and protein expression. Informed consent was obtained
from the donors and the study was approved by the Ethics Committee
of Harbin Medical University.
 | Table IClinical characteristics and serum
lipids of obese and normal weight subjects. |
Table I
Clinical characteristics and serum
lipids of obese and normal weight subjects.
| Group |
|---|
|
|
|---|
|
Characteristics | Control (n=10) | Obese (n=10) |
|---|
| Age (years) | 42.81±6.96 | 41.22±6.84 |
| Body weight
(kg) | 63.51±5.25 | 81.56±6.22a |
| BMI
(kg/m2) | 22.79±1.43 | 30.36±0.94a |
| Fat mass (kg) | 13.33±3.82 | 29.85±5.21a |
| Triglyceride levels
(mmol/l) | 1.45±0.22 | 1.85±0.31a |
| Total cholesterol
levels (mmol/l) | 4.01±0.83 | 5.32±0.62a |
| HDL-C levels
(mmol/l) | 1.13±0.41 | 0.82±0.21a |
| LDL-C levels
(mmol/l) | 2.53±0.42 | 3.36±0.63a |
| TNF-α levels
(pg/ml) | 2.52±0.36 | 3.91±0.52a |
| IL-6 levels
(pg/ml) | 4.26±0.95 | 7.53±1.26a |
Animals and diet
In this study, 48 male Wistar rats (weight, 180–220
g) from the Shanghai Laboratory Animal Center, Chinese Academy of
Sciences (SLACCAS; Shanghai, China) were housed individually in
stainless steel cages in an animal room at a constant temperature
(22±3°C) and a 12-h light/dark cycle. For a 10-week period, 12 rats
were fed a standard diet (STD) and 36 rats were fed a high-fat diet
(HFD) based on a purified AIN-93G diet (28). Distilled water was provided ad
libitum. The ingredients of the diets are presented in Table II. The rats were weighed weekly
during the 10-week experimental period. Food consumption was
measured daily. After the 10-week period, 36 rats were divided into
3 groups according to weight gain, with the lower 33% of the rats
having gained no additional weight, the upper 33% of the rats
having become obese, and the remaining 33% of the rats having
gained moderate weight. The obese and control rats were fasted for
12 h, then anesthetized using pentobarbital (15–20 mg/kg,
intraperitoneal) and sacrificed by exsanguination from the
abdominal aorta. The blood samples were centrifuged at 3,000 rpm
for 15 min to extract serum. Peri-renal, omental and epididymal fat
pads were dissected from each animal. Tissues were weighed
immediately after dissection to avoid evaporative weight loss, and
then frozen at −80°C for subsequent analysis. Visceral fat content
was calculated as follows: 100 (perirenal + epididymal + omental
fat pads)/body weight. The animal care and experimental procedures
were approved by the Animal Experimental Committee of Harbin
Medical University.
| Table IIIngredients of the diets used for
feeding the rats. |
Table II
Ingredients of the diets used for
feeding the rats.
| Amount (g/100 g
diet) |
|---|
|
|
|---|
| Ingredients | STD | HFD |
|---|
| Casein | 20 | 20 |
| L-cysteine | 0.3 | 0.3 |
| L-methionine | 0.16 | 0.16 |
| Carbohydrates | 66.84a | 55.84b |
| Fat | 7.00c | 18.00d |
| Cellulose | 1 | 1 |
| Vitamin mix,
AIN-93G | 1 | 1 |
| Mineral mix,
AIN-93G | 3.5 | 3.5 |
| Choline bitartrate
(50% choline) | 0.2 | 0.2 |
| Sources of energy
(%) |
| Protein | 20 | 17 |
| Carbohydrates | 65 | 48 |
| Fat | 15 | 35 |
Measurement of serum lipid
concentrations
The human and rat serum triglyceride (TG), total
cholesterol (TC) and high-density lipoprotein cholesterol (HDL-C)
levels were assayed by standard enzymatic colorimetric methods
using commercial kits (BioSino Biotechnology, Beijing, China) and
with an auto-analyzer (Autolab PM 4000; AMS Corp., Rome, Italy).
Low-density lipoprotein cholesterol (LDL-C) levels were calculated
using the equation presented in the study by Friedewald et
al (29).
Measurement of serum inflammatory
cytokine levels
Human and rat serum levels of tumor necrosis
factor-α (TNF-α) and interleukin-6 (IL-6) were measured using
commercial ELISA kits (R&D Systems, Minneapolis, MN, USA)
according to the manufacturer’s instructions.
Measurement of serum amino acid
levels
Human serum amino acid concentrations were
determined using high performance liquid chromatography (HPLC) as
previously described (30).
Briefly, serum samples were spiked with acetonitrile, vortex-mixed,
centrifuged and the supernatant was recovered. An Alliance 2695
Separations Module and a 2487 UV detector from Waters Corp.,
(Milford, MA, USA) were used for the HPLC analysis. Derivatization
and gradient of serum amino acids were performed according to the
manufacturer’s instructions.
Measurement of serum calcium, vitamin D
and PTH concentrations
Human serum total calcium levels were measured by
the arsenazo III dye method using a commercial calcium kit (Kehua
Bio-Engineering Co., Ltd., Shanghai, China). 25-Hydroxy vitamin
D3 (25(OH)D3) was measured by ultra
performance liquid chromatography (UPLC). Proteins in 100 μl serum
were precipitated by the addition of 200 μl acetonitrile. Samples
were vortexed and centrifuged at 10,000 rpm. Supernatants were
separated into new 2-ml tubes and diluted by the addition of 100 μl
distilled water. 25(OH)D3 was extracted using an Oasis
HLB 96-well μElution Plate (Waters Corp.) and detected by Acquity
UPLC (Waters Corp.). PTH levels were measured using an Intact PTH
ELISA kit (Alpco Diagnostics, Salem, NH, USA) according to the
manufacturer’s instructions.
Measurement of
[Ca2+]i and cAMP concentrations
Rat adipocytes were isolated from epididymal fat
pads from the obese and control rats by washing, mincing,
collagenase (Invitrogen Life Technologies, Grand Island, NY, USA)
digestion and filtration of the cells, as previously described
(9) according to the method
presented in the study by Rodbell (31). Adipocytes were loaded with fluo-3
AM and then [Ca2+]i levels were measured by
laser scanning confocal microscopy (ECLIPSE TE2000-E; Nikon, Tokyo,
Japan) as previously described (9). The florescence intensity value of
the obesity group is expressed as a percentatage of the control
group. The intracellular cAMP concentration was measured using a
cAMP assay kit (Assay Designs, Ann Arbor MI, USA) according to the
manufacturer’s instructions. The data are expressed as pmol cAMP/mg
total protein. Protein concentrations were measured using a BCA kit
(Beyotime Institute of Biotechnology, Haimen, China).
Extraction of total RNA and quantitative
reverse transcription PCR (qRT-PCR) analyses
Total RNA was isolated from 0.2 g human subcutaneous
fat, or rat perirenal, epididymal or omental fat pads using TRIzol
reagent (Invitrogen Life Technologies) and 1 μg of total RNA was
used to synthesize cDNA using random primers according to the
manufacturer’s instructions (Invitrogen Life Technologies). The
qRT-PCR amplification procedure was carried out as follows: samples
were pre-denatured at 95°C for 10 min and then subjected to 40
cycles of amplification consisting of 15 sec at 95°C, 30 sec at
60°C and 30 sec at 72°C. β-actin was used as the internal control.
The expression levels of each mRNA were determined with the ABI
Prism 7500 Fast Real-Time PCR system (Applied Biosystems, Foster
City, CA, USA) using a SYBR-Green PCR Master mix (Applied
Biosystems). Samples were analyzed using the 2−ΔΔCt
method (32). The sequences of
the primers (Sangon Biotech Co., Ltd., Shanghai, China) are
presented in Table III.
| Table IIIPrimer sequences, annealing
temperature and number of cycles. |
Table III
Primer sequences, annealing
temperature and number of cycles.
| Primer | Sequence | Length (bp) | Annealing
temperature (°C) | No. of cycles |
|---|
| CaSR | Sense |
5′ATGACTTCTGGTCCAATGAG3′ | 156 | 60 | 40 |
| Antisense |
5′TGCGGAACTTGATAAACAC3′ | | | |
| β-actin | Sense |
5′ACTATCGGCAATGAGCG3′ | 220 | 60 | 40 |
| Antisense |
5′GAGCCAGGGCAGTAATCT3′ | | | |
Western blot analysis
CaSR protein expression in white adipose tissue was
determined by western blot anlysis. Human subcutaneous fat, or rat
perirenal, epididymal or omental adipose tissue (0.5 g) was washed
twice with ice-cold PBS, crushed in a mortar with liquid nitrogen,
and then lysed in cold lysis butter (Beyotime) for 30 min. The
lysates were centrifuged at 12,000 rpm for 20 min at 4°C. Protein
concentrations were measured using a BCA protien assay kit
(Beyotime). A CaSR band of 121 kDa was identified under reducing
conditions (samples were heat denatured in SDS-PAGE loading buffer
supplemented with 5% β-mercaptoethanol). Equal amounts of protein
were separated by SDS-PAGE and electro-transferred onto
polyvinylidene difluoride membranes (Invitrogen Life Technologies).
The membranes were blocked with 1% BSA and probed overnight with
primary antibodies against CaSR and β-actin (Abcam, Cambridge, UK).
The membranes were then washed 3 times with TBS-T buffer (150
mmol/l NaCl, 20 mmol/l Tris-HCl, pH 7.4, 0.05% Tween-20) for 10
min, incubated with rabbit IgG antibody (Santa Cruz Biotechnology,
Santa Cruz, CA, USA) for 1 h at 37°C, and then washed again 3 times
with TBS-T buffer. The blots were detected using alkaline
phosphatase (Promega Corporation, Madison, WI, USA). The protein
bands were subjected to autoradiography (Champ-Gel-3200, Sage
Creation, China), and densitometry was quantified by Alpha EaseFc
software (FluorChem, Alpha Innotech, San Leandro, CA, USA). Data
are presented as the ratios of target protein to β-actin.
Experiments were replicated at least 3 times and representative
blots are shown.
Statistical analysis
Differences were analyzed for significance using the
Student’s t-test. Data were expressed as the means ± SD and a
P-value <0.05 was considered to indicate a statistically
significant difference. ANOVA was used to compare serum amino acid
levels between the obese and normal weight controls, adjusting for
age, smoking history, alcohol consumption and physical activity at
work and at leisure. Each value is the mean of at least 3
repetitive experiments in each group. Statistical analyses were
performed using the SPSS 13.0 statistical program (version 13.01S;
Beijing Stats Data Mining Co., Ltd., Beijing, China).
Results
Lipids and inflammatory factors in obese
human and rat serum
The concentrations of TG, TC and LDL-C, but not
HDL-C, were significantly higher in the obese versus the non-obese
individuals. The serum levels of TNF-α and IL-6 were also
significantly higher in the obese versus non-obese individuals
(Tables I and IV), suggesting a hyperlipidemic and
inflammatory status in obese individuals. There were no significant
differences between the groups as regards age, smoking history,
alcohol consumption and physical activity (data not shown).
| Table IVBody weight, fat content and serum
lipid concentrations in the obese and control rats. |
Table IV
Body weight, fat content and serum
lipid concentrations in the obese and control rats.
|
Characteristics | Control (n=12) | Obese (n=12) |
|---|
| Body weight
(g) | 471.22±28.9 | 520.8±39.4a |
| Fat content
(%) | 3.92±1.24 | 5.42±1.05a |
| Triglyceride levels
(mmol/l) | 0.73±0.24 | 1.26±0.34a |
| Total cholesterol
levels (mmol/l) | 1.72±0.31 | 2.12±0.23a |
| HDL-C levels
(mmol/l) | 0.84±0.23 | 0.64±0.12a |
| LDL-C levels
(mmol/l) | 0.54±0.22 | 0.90±0.16a |
| TNF-α levels
(pg/ml) | 42.38±4.61 | 56.22±6.21a |
| IL-6 levels
(pg/ml) | 10.53±2.68 | 18.62±2.65a |
Calcium, vitamin D and PTH concentrations
in human serum
Calcium is the primary agonist of CaSR. In this
study, serum calcium concentrations in the obese group did not
differ from those in the control group (Fig. 1A). Vitamin D has been reported to
regulate the expression of CaSR in several types of tissue.
25(OH)D3 is the main metabolite of vitamin D in serum,
and is regarded as the best indicator of the overall vitamin D
status (33). Our results
revealed that serum 25(OH)D3 levels were significantly
lower in the obese versus non-obese individuals (Fig. 1B). The main role of CaSR is to
maintain calcium concentrations by regulating the secretion of PTH.
In this study, PTH levels were found to be higher in the obese
subjects compared with the control group (Fig. 1C).
Amino acid levels in human serum
Amino acids can regulate a number of cellular
responses, such as controlling rates of transcription and
translation through the activation or inhibition of specific
signaling pathways. It has been shown that CaSR is a molecular
target for L-amino acids (15).
Accordingly, in this study, 10 amino acids in human serum were
measured using HPLC. Among these, serum histidine, threonine,
glycine, arginine, serine and methionine were found to be
significantly lower in the obese versus non-obese individuals,
after adjusting for age, smoking history, alcohol consumption and
physical activity at work and at leisure (Fig. 2). Other amino acids measured
showed no differences between these 2 groups.
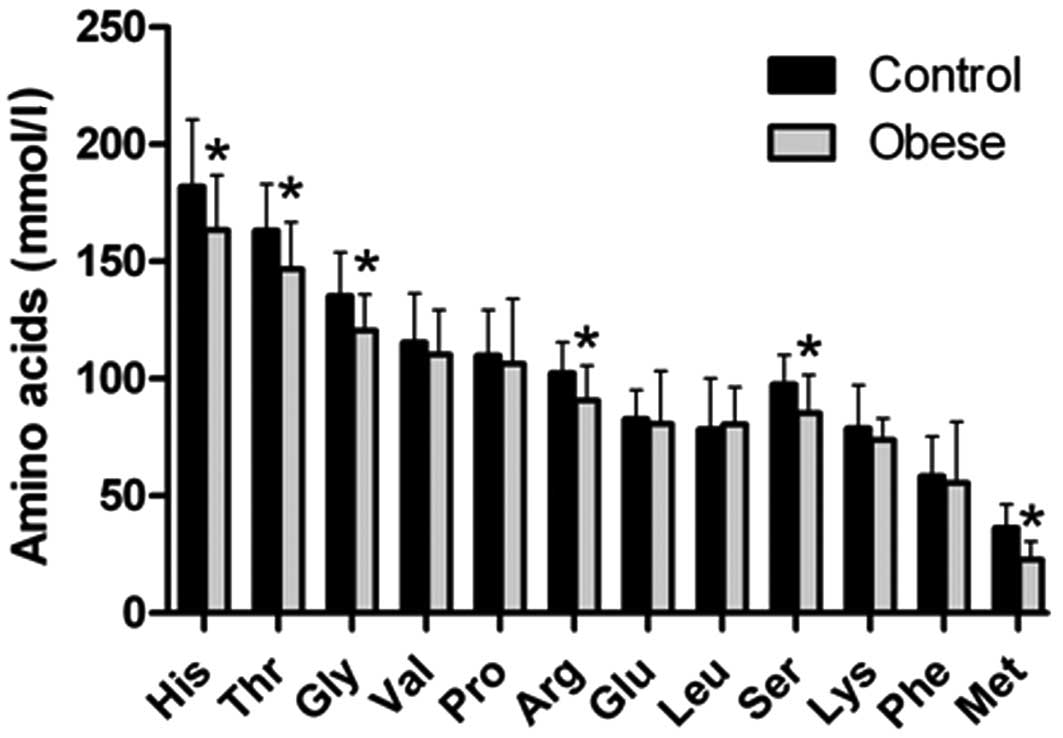 | Figure 2Serum concentrations of amino acids.
Serum levels of amino acids from 10 obese and 10 non-obese controls
were determined by HPLC. Values are the means ± SD.
*P<0.05 versus the control group, adjusted for age,
smoking history, alcohol consumption and physical activity at work
and at leisure. His, histidine; Thr, threonine; Gly, glycine; Val,
valine; Pro, proline; Arg, arginine; Glu, glutamate; Leu, leucine;
Ser, serine; Lys, lysine; Phe, phenylalanine; Met, methionine. |
[Ca2+]i and cAMP
levels in rat adipocytes
It has been reported that
[Ca2+]i and cAMP are 2 critical secondary
messengers modulated by the activation of CaSR (3). In this study, we observed that
[Ca2+]i concentrations increased, while cAMP
levels decreased in obese rat adipocytes compared with the control
rat adipocytes (Fig. 3).
CaSR gene and protein levels in human and
rat white adipose tissue
As calcium, vitamin D, amino acids and the
inflammatory cytokines, TNF-α and IL-6, have been reported to
affect the expression of CaSR in vitro (3,21),
we further investigated the expression of CaSR in the obese state.
The results revealed that the gene and protein expression of CaSR
in both the human and rat white adipose tissue did not differ
between the obese and non-obese groups (Fig. 4). These results suggest that CaSR
expression in fat tissue is not altered in obese individuals.
Discussion
CaSR plays a vareity of roles in different types of
tissue in the body. In adipose tissue, ours, as well as other
studies have demonstrted that after being activated, CaSR plays an
antilipolytic role in adipose cells (6,7).
CaSR has been shown to affect adipocyte differentiation through the
regulation of transcriptional factors (8). In vivo, we have reported that
the expression of CaSR in white adipose tissue is upregulated by a
low calcium diet (9), but we did
not elucidate its mechanisms of action in obesity.
CaSR, discovered in 1993, is best known for its role
in regulating the synthesis and secretion of PTH in the parathyroid
glands. Since then, it has been detected in many cell types and has
been shown to have various cell-dependent functions (3). One of these functions is its
involvement in inflammatory events which are characterized by high
levels of inflammatory cytokines (34,35). The expression of CaSR has been
reported to be upregulated in the presence of IL-6 and TNF-α in
different cell types (36–38).
This has led to a speculation that the obesity-induced inflammatory
status may play a crucial role in the upregulation of CaSR
expression. Recently, Cifuentes et al demonstrated that the
obesity-associated inflammatory cytokines, TNF-α and IL-6, increase
CaSR expression in adipocytes (21). However, there has been a lack of
in vivo evidence to support this conclusion. Therefore, in
this study, we determined the status of CaSR in adipose tissue from
obese humans and rats. Our results revealed that there were higher
levels of TNF-α and IL-6 in obese individuals; these data are in
agreement with those from previous studies showing elevated serum
cytokine levels in humans and animals with excess adiposity
(39). However, CaSR expression
was not significantly altered in the obese versus non-obese
individuals in the present study. These data are inconsistent with
those presented in the study by Cifuentes et al, who
demonstrated that CaSR expression was increased by
obesity-associated pro-inflammatory cytokines (21). The mRNA and/or protein expression
of CaSR can change under various circumstances. For example, calf
parathyroid cells show rapid and marked reductions in CaSR mRNA and
protein levels after being cultured (40). Furthermore, the renal expression
of CaSR has been shown to increase following treatment with
1,25-dihydroxyvitamin D (17).
Phosphorus intake has also been reported to be associated with a
reduced CaSR mRNA and protein expression in the parathyroid glands
(18). As described above,
although obesity is associated with a state of inflammation, the
level is chronic and low. Moreover, it is difficult to evaluate the
local physiological concentrations of cytokines within obese
adipose tissue, which depends on the secretion and clearance
capacity of the individual. The cytokine concentrations in
presented in the study by Cifuentes et al were much higher
than other reported circulating levels (21). In addition, there are many other
active components that may also play roles in modulating CaSR
expression. As such, we believe our results to be more consistent
with the actual physiological state of obesity.
Although we did not observe any significant changes
in CaSR expression in adipose tissue in obese individuals, the role
of CaSR in adipocytes may also be attributed to its allosteric
regulation under conditions of obesity. According to its structure
and known function, the most direct evidence to judge the
allosteric regulation of CaSR is whether it can lead to a reduction
in cAMP levels and an increase in [Ca2+]i
release in a short period when its expression remains constant. Our
results revealed that cAMP levels were significantly reduced, while
[Ca2+]i levels were increased in obese rat
adipocytes compared with the control group. These data are
consistent with the data from our previous studies, demonstrating a
rapid increase in [Ca2+]i levels and a
decreased cAMP accumulation in response to a CaSR agonist in
adipocytes (7,8).
There are a variety of stimuli that can be sensed by
CaSR in the obese state. Extracellular calcium has been the primary
agonist since the discovery of CaSR. Vitamin D is a factor that has
been identified to regulate CaSR expression in the kidneys
(41). L-amino acids have also
been shown to be CaSR ligands (15). Any changes in the above stimuli
may activate or inactivate CaSR allosterically, or modulate its
expression, and finally achieve their biological functions. In this
study, serum calcium levels were the same between the obese and
control groups due to the strong ability of the body to maintain
calcium homeostasis. Nevertheless, vitamin D and amino acid
concentrations were significantly lower in the obese individuals,
as has previously been reported by us, as well as others (30,42). Under such circumstances, the
expression of CaSR in adipose tissue remains unaltered, further
supporting the possibility of allosteric regulation. In this study,
although 25(OH)D3 levels were lower in the obese
compared with the normal weight subjects, there are some lines of
evidence demonstrating that 1,25-di(OH)2D3,
the biologically active form of vitamin D3, is elevated
in obese humans (43–45). We have previously reported that
the elevation of 1,25-di(OH)2D3 stimulates
the expression of CaSR in adipocytes under low calcium conditions
and that this is associated with an increase in
[Ca2+]i levels (9). However, in this study, no difference
in CaSR expression in adipose tissue was observed between the
obesity group and the normal weight group.
Free L-amino acids are essential molecules in
biological systems. Cellular sensing of L-amino acids modulates
diverse cellular responses. Fluctuating blood levels of amino acids
have an important impact on body protein, carbohydrate and calcium
metabolism and perhaps tissue growth and development. Thus, the low
levels of amino acids observed in obese individuals may be a
regulator of body weight. Low amino acid levels have been shown to
be associated with high levels of PTH, which potentially involve
amino acid sensing by CaSR (46).
PTH has been shown to stimulate an increase in
[Ca2+]i levels in adipocytes (47), which may finally lead to fat
accumulation mainly by the activation of adipocyte
phosphodiesterase (PDE) and a reduction in cAMP levels, leading to
a decrease in hormone-sensitive lipase (HSL) phosphorylation, by
stimulating the expression and activity of fatty acid synthase
(FAS) (48–50). In this study, serum PTH levels
were significantly higher in the obese subjects compared with the
control group. Therefore, we hypothesized that the increased
[Ca2+]i and the decreased cAMP levels can be
mediated by CaSR through sensing the changes in serum amino acids
under conditions of obesity. Of course, there are numerous other
unknown CaSR regulators in the serum that need to be further
identified.
In conclusion, the results from the present study
demonstrate that the expression of CaSR in adipose tissue is
unaltered in obese individuals with inflammation and low vitamin D
and acid amino acid concentrations, providing preliminary evidence
that CaSR may play a role through sensing the changes in amino
acids in obese individuals rather than through its expression.
Acknowledgements
We thank Dr Gang Li from the Second Affiliated
Hospital of Harbin Medical University for recruiting human subjects
and obtaining fat tissue. This study was funded by grants from the
National Natural Science Fund of China key project (no. 81130049)
and the Program for New Century Excellent Talents in University of
China (no. NCET-10-0148). The sponsors played no role in this study
or the decision to submit the manuscript for publication.
References
|
1
|
Obesity: preventing and managing the
global epidemic. Report of a WHO consultation. World Health Organ
Tech Rep Ser. 894:i–xii. 1–253. 2000.PubMed/NCBI
|
|
2
|
Kopelman PG: Obesity as a medical problem.
Nature. 404:635–643. 2000.PubMed/NCBI
|
|
3
|
Brown EM and MacLeod RJ: Extracellular
calcium sensing and extracellular calcium signaling. Physiol Rev.
81:239–297. 2001.PubMed/NCBI
|
|
4
|
Brown EM, Gamba G, Riccardi D, et al:
Cloning and characterization of an extracellular Ca(2+)-sensing
receptor from bovine parathyroid. Nature. 366:575–580. 1993.
|
|
5
|
Cifuentes M, Albala C and Rojas C:
Calcium-sensing receptor expression in human adipocytes.
Endocrinology. 146:2176–2179. 2005. View Article : Google Scholar : PubMed/NCBI
|
|
6
|
Cifuentes M and Rojas CV: Antilipolytic
effect of calcium-sensing receptor in human adipocytes. Mol Cell
Biochem. 319:17–21. 2008. View Article : Google Scholar : PubMed/NCBI
|
|
7
|
He Y, Zhang H, Teng J, Huang L, Li Y and
Sun C: Involvement of calcium-sensing receptor in inhibition of
lipolysis through intracellular cAMP and calcium pathways in human
adipocytes. Biochem Biophys Res Commun. 404:393–399. 2011.
View Article : Google Scholar : PubMed/NCBI
|
|
8
|
He YH, He Y, Liao XL, et al: The
calcium-sensing receptor promotes adipocyte differentiation and
adipogenesis through PPARgamma pathway. Mol Cell Biochem.
361:321–328. 2012. View Article : Google Scholar : PubMed/NCBI
|
|
9
|
He YH, Song Y, Liao XL, et al: The
calcium-sensing receptor affects fat accumulation via effects on
antilipolytic pathways in adipose tissue of rats fed low-calcium
diets. J Nutr. 141:1938–1946. 2011. View Article : Google Scholar
|
|
10
|
Hofer AM and Brown EM: Extracellular
calcium sensing and signalling. Nat Rev Mol Cell Biol. 4:530–538.
2003. View
Article : Google Scholar
|
|
11
|
Chen RA and Goodman WG: Role of the
calcium-sensing receptor in parathyroid gland physiology. Am J
Physiol Renal Physiol. 286:F1005–F1011. 2004. View Article : Google Scholar : PubMed/NCBI
|
|
12
|
Draznin B, Sussman KE, Eckel RH, Kao M,
Yost T and Sherman NA: Possible role of cytosolic free calcium
concentrations in mediating insulin resistance of obesity and
hyperinsulinemia. J Clin Invest. 82:1848–1852. 1988. View Article : Google Scholar : PubMed/NCBI
|
|
13
|
Draznin B, Sussman K, Kao M, Lewis D and
Sherman N: The existence of an optimal range of cytosolic free
calcium for insulin-stimulated glucose transport in rat adipocytes.
J Biol Chem. 262:14385–14388. 1987.PubMed/NCBI
|
|
14
|
Byyny RL, LoVerde M, Lloyd S, Mitchell W
and Draznin B: Cytosolic calcium and insulin resistance in elderly
patients with essential hypertension. Am J Hypertens. 5:459–464.
1992.PubMed/NCBI
|
|
15
|
Conigrave AD, Mun HC and Lok HC: Aromatic
L-amino acids activate the calcium-sensing receptor. J Nutr. 137(6
Suppl 1): S1524–S1527. 2007.PubMed/NCBI
|
|
16
|
Emanuel RL, Adler GK, Kifor O, et al:
Calcium-sensing receptor expression and regulation by extracellular
calcium in the AtT-20 pituitary cell line. Mol Endocrinol.
10:555–565. 1996.PubMed/NCBI
|
|
17
|
Brown AJ, Zhong M, Finch J, et al: Rat
calcium-sensing receptor is regulated by vitamin D but not by
calcium. Am J Physiol. 270:F454–F460. 1996.PubMed/NCBI
|
|
18
|
Brown AJ, Ritter CS, Finch JL and
Slatopolsky EA: Decreased calcium-sensing receptor expression in
hyperplastic parathyroid glands of uremic rats: role of dietary
phosphate. Kidney Int. 55:1284–1292. 1999. View Article : Google Scholar : PubMed/NCBI
|
|
19
|
Antuna-Puente B, Feve B, Fellahi S and
Bastard JP: Adipokines: the missing link between insulin resistance
and obesity. Diabetes Metab. 34:2–11. 2008. View Article : Google Scholar : PubMed/NCBI
|
|
20
|
Calabro P, Golia E, Maddaloni V, et al:
Adipose tissue-mediated inflammation: the missing link between
obesity and cardiovascular disease? Intern Emerg Med. 4:25–34.
2009. View Article : Google Scholar : PubMed/NCBI
|
|
21
|
Cifuentes M, Fuentes C, Mattar P, et al:
Obesity-associated proinflammatory cytokines increase calcium
sensing receptor (CaSR) protein expression in primary human
adipocytes and LS14 human adipose cell line. Arch Biochem Biophys.
500:151–156. 2010. View Article : Google Scholar
|
|
22
|
Cifuentes M, Fuentes C, Tobar N, et al:
Calcium sensing receptor activation elevates proinflammatory factor
expression in human adipose cells and adipose tissue. Mol Cell
Endocrinol. 361:24–30. 2012. View Article : Google Scholar
|
|
23
|
Sung RY, Lau P, Yu CW, Lam PK and Nelson
EA: Measurement of body fat using leg to leg bioimpedance. Arch Dis
Child. 85:263–267. 2001. View Article : Google Scholar : PubMed/NCBI
|
|
24
|
Nunez C, Gallagher D, Visser M, Pi-Sunyer
FX, Wang Z and Heymsfield SB: Bioimpedance analysis: evaluation of
leg-to-leg system based on pressure contact footpad electrodes. Med
Sci Sports Exerc. 29:524–531. 1997. View Article : Google Scholar : PubMed/NCBI
|
|
25
|
Li Y, Wang C, Zhu K, Feng RN and Sun CH:
Effects of multivitamin and mineral supplementation on adiposity,
energy expenditure and lipid profiles in obese Chinese women. Int J
Obes (Lond). 34:1070–1077. 2010. View Article : Google Scholar : PubMed/NCBI
|
|
26
|
Huang L, Xue J, He Y, et al: Dietary
calcium but not elemental calcium from supplements is associated
with body composition and obesity in Chinese women. PLoS One.
6:e277032011. View Article : Google Scholar : PubMed/NCBI
|
|
27
|
Li LM, Rao KQ, Kong LZ, et al: A
description on the Chinese national nutrition and health survey in
2002. Zhonghua Liu Xing Bing Xue Za Zhi. 26:478–484. 2005.(In
Chinese).
|
|
28
|
Reeves PG, Nielsen FH and Fahey GC Jr:
AIN-93 purified diets for laboratory rodents: final report of the
American Institute of Nutrition ad hoc writing committee on the
reformulation of the AIN-76A rodent diet. J Nutr. 123:1939–1951.
1993.PubMed/NCBI
|
|
29
|
Friedewald WT, Levy RI and Fredrickson DS:
Estimation of the concentration of low-density lipoprotein
cholesterol in plasma, without use of the preparative
ultracentrifuge. Clin Chem. 18:499–502. 1972.PubMed/NCBI
|
|
30
|
Niu YC, Feng RN, Hou Y, et al: Histidine
and arginine are associated with inflammation and oxidative stress
in obese women. Br J Nutr. 108:57–61. 2012. View Article : Google Scholar : PubMed/NCBI
|
|
31
|
Rodbell M: Metabolism of isolated fat
cells. I Effects of hormones on glucose metabolism and lipolysis. J
Biol Chem. 239:375–380. 1964.PubMed/NCBI
|
|
32
|
Livak KJ and Schmittgen TD: Analysis of
relative gene expression data using real-time quantitative PCR and
the 2(−Delta Delta C(T)) Method. Methods. 25:402–408. 2001.
|
|
33
|
Kimball S, Fuleihan Gel H and Vieth R:
Vitamin D: a growing perspective. Crit Rev Clin Lab Sci.
45:339–414. 2008. View Article : Google Scholar : PubMed/NCBI
|
|
34
|
Abdullah HI, Pedraza PL, Hao S, Rodland
KD, McGiff JC and Ferreri NR: NFAT regulates calcium-sensing
receptor-mediated TNF production. Am J Physiol Renal Physiol.
290:F1110–F1117. 2006. View Article : Google Scholar : PubMed/NCBI
|
|
35
|
Wang D, Pedraza PL, Abdullah HI, McGiff JC
and Ferreri NR: Calcium-sensing receptor-mediated TNF production in
medullary thick ascending limb cells. Am J Physiol Renal Physiol.
283:F963–F970. 2002. View Article : Google Scholar : PubMed/NCBI
|
|
36
|
Canaff L and Hendy GN: Calcium-sensing
receptor gene transcription is up-regulated by the proinflammatory
cytokine, interleukin-1beta. Role of the NF-kappaB pathway and
kappaB elements. J Biol Chem. 280:14177–14188. 2005. View Article : Google Scholar : PubMed/NCBI
|
|
37
|
Nielsen PK, Rasmussen AK, Butters R, et
al: Inhibition of PTH secretion by interleukin-1 beta in bovine
parathyroid glands in vitro is associated with an up-regulation of
the calcium-sensing receptor mRNA. Biochem Biophys Res Commun.
238:880–885. 1997. View Article : Google Scholar : PubMed/NCBI
|
|
38
|
Toribio RE, Kohn CW, Capen CC and Rosol
TJ: Parathyroid hormone (PTH) secretion, PTH mRNA and
calcium-sensing receptor mRNA expression in equine parathyroid
cells, and effects of interleukin (IL)-1, IL-6, and tumor necrosis
factor-alpha on equine parathyroid cell function. J Mol Endocrinol.
31:609–620. 2003. View Article : Google Scholar
|
|
39
|
Park HS, Park JY and Yu R: Relationship of
obesity and visceral adiposity with serum concentrations of CRP,
TNF-alpha and IL-6. Diabetes Res Clin Pract. 69:29–35. 2005.
View Article : Google Scholar : PubMed/NCBI
|
|
40
|
Brown AJ, Zhong M, Ritter C, Brown EM and
Slatopolsky E: Loss of calcium responsiveness in cultured bovine
parathyroid cells is associated with decreased calcium receptor
expression. Biochem Biophys Res Commun. 212:861–867. 1995.
View Article : Google Scholar : PubMed/NCBI
|
|
41
|
Yao JJ, Bai S, Karnauskas AJ, Bushinsky DA
and Favus MJ: Regulation of renal calcium receptor gene expression
by 1,25-dihydroxyvitamin D3 in genetic hypercalciuric
stone-forming rats. J Am Soc Nephrol. 16:1300–1308. 2005.
View Article : Google Scholar : PubMed/NCBI
|
|
42
|
Parikh SJ, Edelman M, Uwaifo GI, et al:
The relationship between obesity and serum 1,25-dihydroxy vitamin D
concentrations in healthy adults. J Clin Endocrinol Metab.
89:1196–1199. 2004. View Article : Google Scholar : PubMed/NCBI
|
|
43
|
Andersen T, McNair P, Hyldstrup L, et al:
Secondary hyperparathyroidism of morbid obesity regresses during
weight reduction. Metabolism. 37:425–428. 1988. View Article : Google Scholar : PubMed/NCBI
|
|
44
|
Bell NH, Epstein S, Greene A, Shary J,
Oexmann MJ and Shaw S: Evidence for alteration of the vitamin
D-endocrine system in obese subjects. J Clin Invest. 76:370–373.
1985. View Article : Google Scholar : PubMed/NCBI
|
|
45
|
Bell NH, Epstein S, Shary J, Greene V,
Oexmann MJ and Shaw S: Evidence of a probable role for
25-hydroxyvitamin D in the regulation of human calcium metabolism.
J Bone Miner Res. 3:489–495. 1988. View Article : Google Scholar : PubMed/NCBI
|
|
46
|
Conigrave AD, Franks AH, Brown EM and
Quinn SJ: L-amino acid sensing by the calcium-sensing receptor: a
general mechanism for coupling protein and calcium metabolism? Eur
J Clin Nutr. 56:1072–1080. 2002. View Article : Google Scholar : PubMed/NCBI
|
|
47
|
Ni Z, Smogorzewski M and Massry SG:
Effects of parathyroid hormone on cytosolic calcium of rat
adipocytes. Endocrinology. 135:1837–1844. 1994.PubMed/NCBI
|
|
48
|
Shi H, Norman AW, Okamura WH, Sen A and
Zemel MB: 1alpha,25-Dihydroxyvitamin D3 modulates human
adipocyte metabolism via nongenomic action. FASEB J. 15:2751–2753.
2001.PubMed/NCBI
|
|
49
|
Xue B, Greenberg AG, Kraemer FB and Zemel
MB: Mechanism of intracellular calcium ([Ca2+]i)
inhibition of lipolysis in human adipocytes. FASEB J. 15:2527–2529.
2001.
|
|
50
|
Zemel MB, Shi H, Greer B, Dirienzo D and
Zemel PC: Regulation of adiposity by dietary calcium. FASEB J.
14:1132–1138. 2000.PubMed/NCBI
|


