Introduction
Vascular calcification is a marker of increased
cardiovascular risk in ageing and in a number of diseases including
diabetes, atherosclerosis and chronic kidney disease (CKD)
(1,2). Although condition-specific factors
are likely to drive the calcification process, the etiology of
mineral accumulation within the vasculature resembles that of bone
formation (2). A number of
studies have reported that vascular smooth muscle cells (VSMCs),
the predominant cell type involved in vascular calcification, can
undergo a phenotypic transition to osteoblastic, chondrocytic and
osteocytic cells in a calcified environment (3–5).
Furthermore, it has been demonstrated that phosphate accelerates
this phenotypic trans-differentiation, evident in the loss of
characteristic smooth muscle markers and the development of
osteoblastic features, such as the expression of tissue-nonspecific
alkaline phosphatase, PiT-1, osteocalcin and
osteopontin, and osteocyte markers including sclerostin and E11
(3,4). Vascular calcification also involves
the reciprocal loss of recognised calcification suppressors, such
as inorganic pyrophosphate (PPi), MGP and fetuin A
(6–8).
To gain a better understanding of the mechanisms
that underpin aortic calcification, rodent models of intimal and
medial aortic calcification were utilised. However, the small-scale
vascular structures in rodents require labor-intensive
two-dimensional (2D) histomorphometric techniques in order to
visualise regions of calcium and phosphate deposition using
Alizarin red and von Kossa staining, respectively, with the extent
of calcification often not being fully identified. Furthermore, use
of the established technique of acid leaching to quantify total
aortic calcium deposition in rodent tissue is of limited
sensitivity and does not allow the visualisation of specific sites
of calcification.
Recent reports have demonstrated the feasibility of
detecting aortic calcification by micro-computed tomography (μCT)
imaging (9–11). However, these studies examined
calcified tissues without the assessment of soft tissues. In the
present study, we developed a novel μCT scanning protocol to
produce high resolution three-dimensional (3D) reconstructions of
aortae derived from the well-established Ecto-nucleotide
pyrophosphatase/phosphodiesterase-1 knockout
(Enpp1−/−) mouse model of medial aortic
calcification (8,9,12).
To the best of our knowledge, this is the first study which enables
soft tissue definition and quantification, producing the first
visualisation of calcified aortae. This new method is likely to
advance the study of the progression of aortic calcification and
potential therapeutic strategies for clinical intervention.
Materials and methods
Enpp1−/− mice
Enpp1−/− mice were generated and
characterised as previously described (12). Genotyping was performed by a
commercial genotyping service (Genetyper, New York, NY, USA) using
genomic DNA isolated from ear clips. All animal experiments were
approved by The Roslin Institute’s Animal Users Committee and the
animals were maintained in accordance with the Home Office
guidelines for the care and use of laboratory animals.
Tissue preparation
Aortae were dissected from 22-week-old
Enpp1−/− and wild-type (WT) mice. Tissues were
fixed in 10% neutral-buffered formalin for 48 h before being
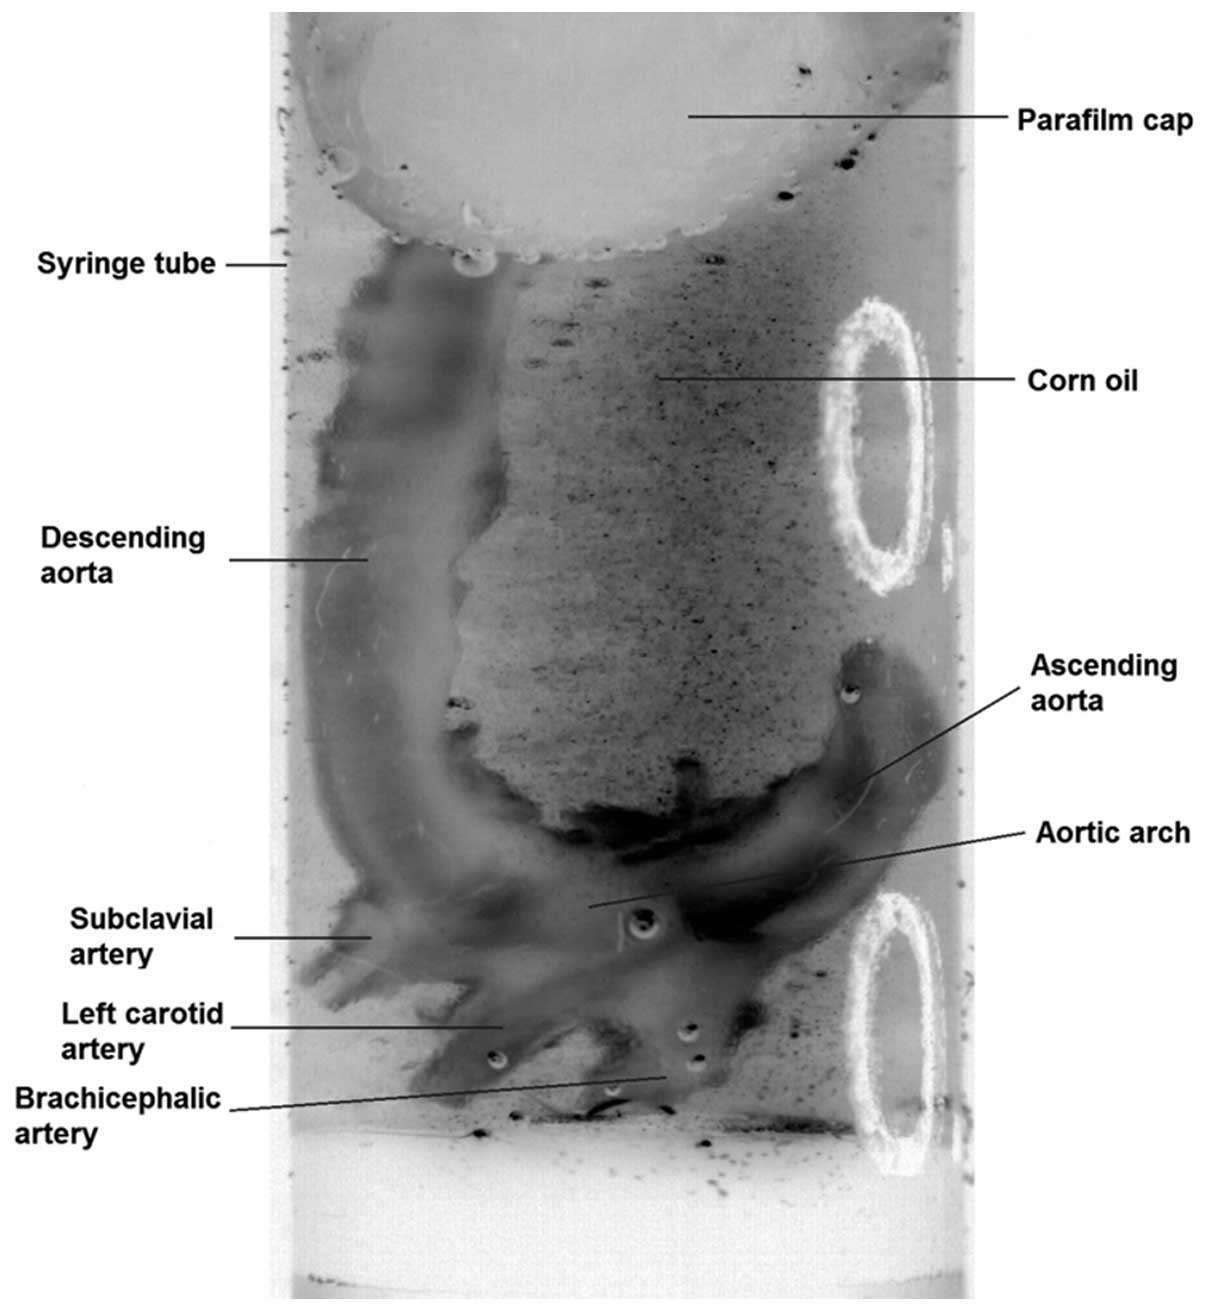
transferred to 70% ethanol. Prior to scanning, aortae were
immersed, for a minimum time of 10 min, in a macro-molecular
iopamidol-based contrast agent (Niopam300; Brako UK Ltd., High
Wycombe, Buckinghamshire, UK) diluted at 1:4 in water. To allow
tissue differentiation, aortic lumina were filled with corn oil and
the aortae were submersed in oil for the duration of the scan
(Fig. 1).
Tissue imaging
Tissues were imaged using a Skyscan 1172 X-ray
Microtomograph (Aartselaar, Belgium). Sequential high-resolution
scans were obtained using a rotation step of 0.3°, with an average
of 3 frames at each step, applying a 0.5 mm aluminium filter, with
an X-ray source set at 60 kV and 167 μA, and with an isotropic
voxel size of 10 μm. Total scantime was ~50 min per sample. The
scans were reconstructed using NRecon (Skyscan, Kontich, Belgium).
Noise, in the reconstructed images, was reduced by applying a
median filter (radius, 1). The aortic arch, 400 slices (4 mm) under
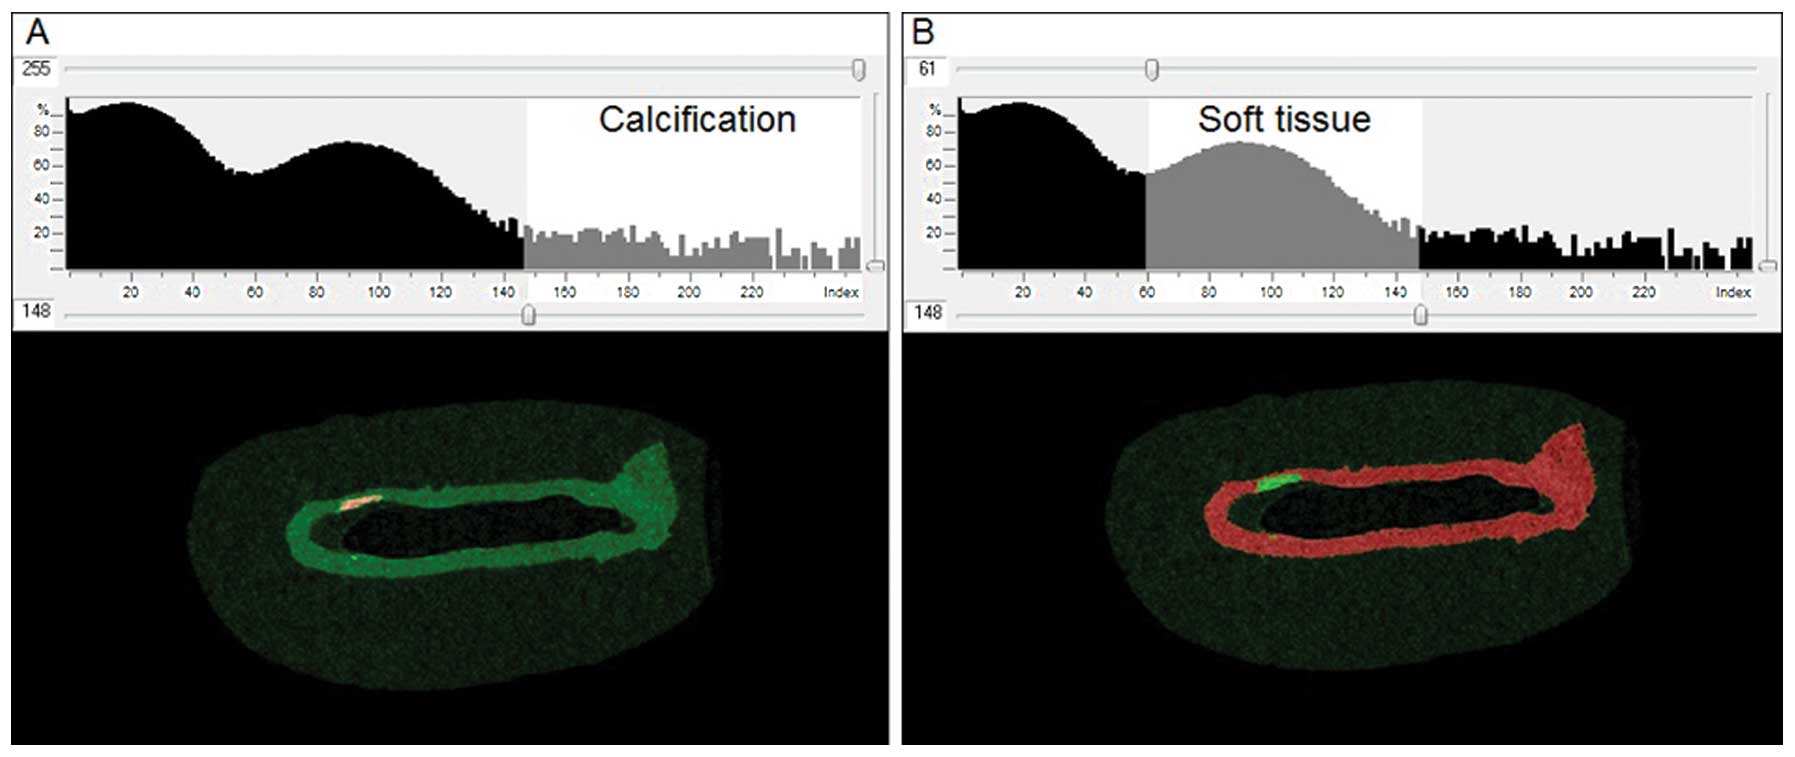
the subclavian artery, was selected as the region of interest. Soft
and calcified tissue was identified by thresholding, using CTAn
software (Skyscan). Thresholding permits the detection of
differences in tissue density and thus enables the identification
of areas of calcification within the soft tissue. The optimal
threshold for each tissue type was determined from the image
histograms (Fig. 2).
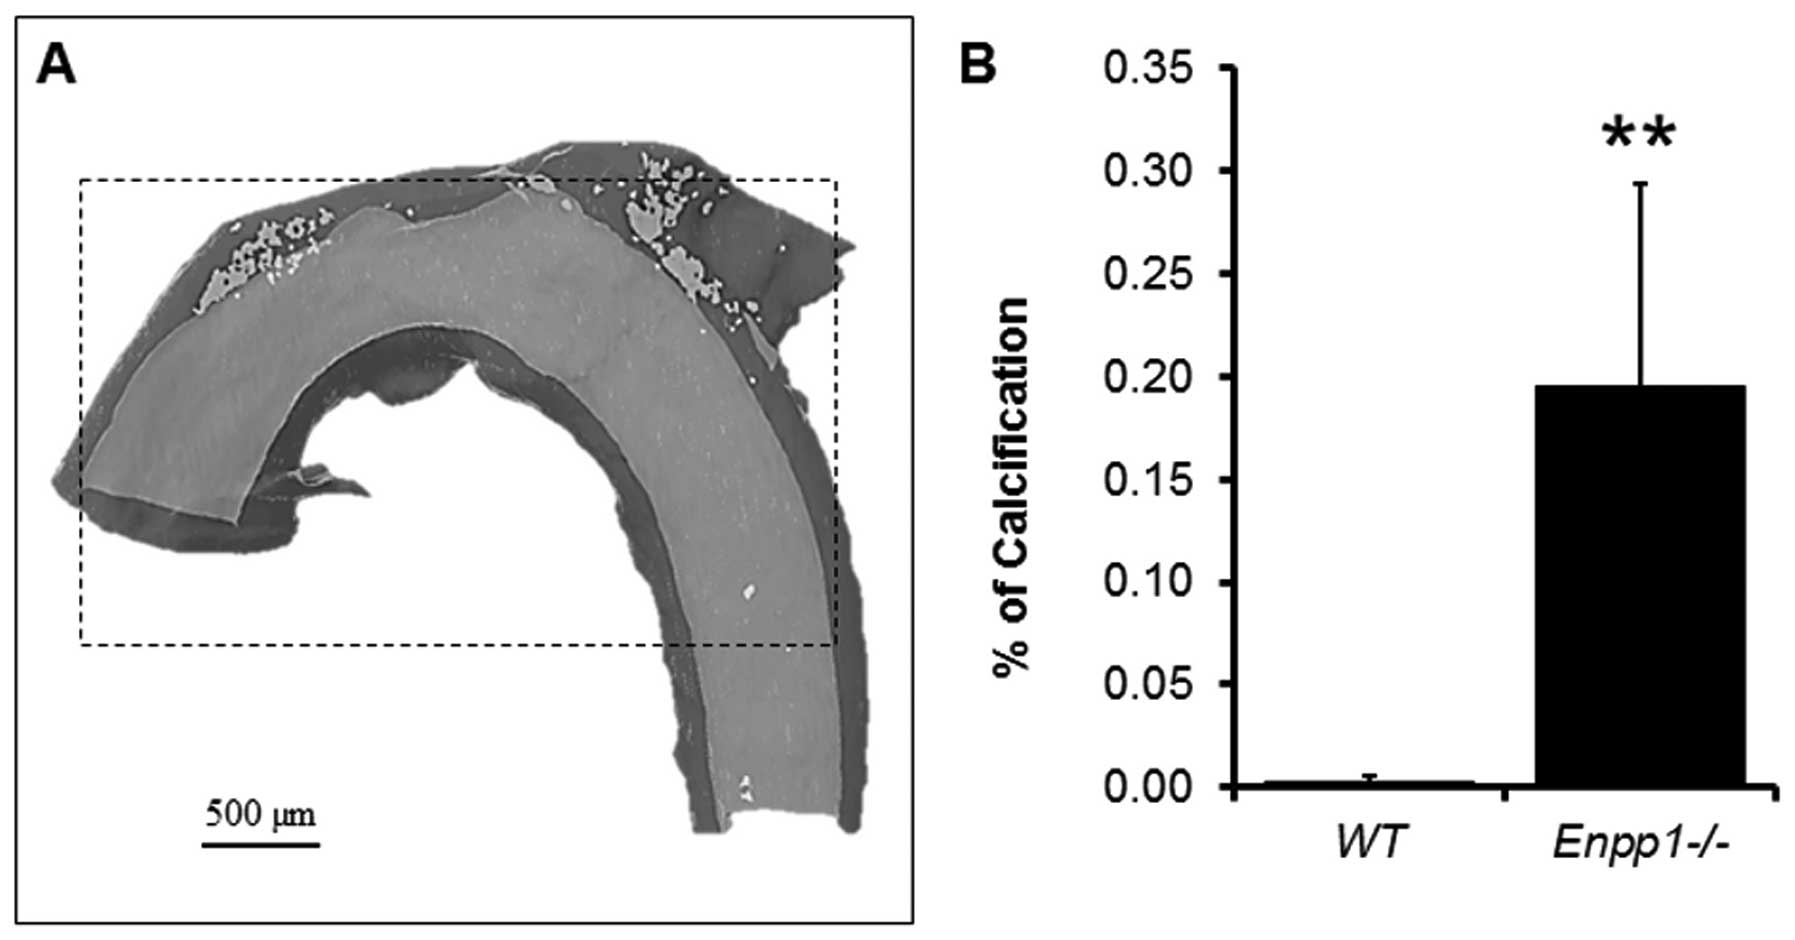
Quantification was performed by calculating the total tissue volume
within the specific threshold of the area of interest.
Calcification was expressed as the ratio of calcified volume to
total volume.
Tissue staining for calcium
deposition
After scanning, aortae were washed in PBS and
stained with 2% Alizarin red (pH 4.2) for 5 min at room temperature
and rinsed repeatedly with distilled water. Images of whole aortae
were captured with a low magnification microscope (magnification,
×6; Leica MZ6 dissection microscope) in a darkened background.
Statistical analysis
Data are presented as means ± SD. P<0.05
indicates statistically significant difference as determined by
Student’s t-test analysis.
Results
This study used calcified Enpp1−/−
mouse aortae to demonstrate a novel μCT imaging protocol. A
dual-contrast method was employed for specimen preparation combined
with the use of corn oil during sample scanning (Fig. 1). While μCT has previously been
utilised to image aortic calcification ex vivo, (9–11),
those studies detected calcified tissue in the absence of soft
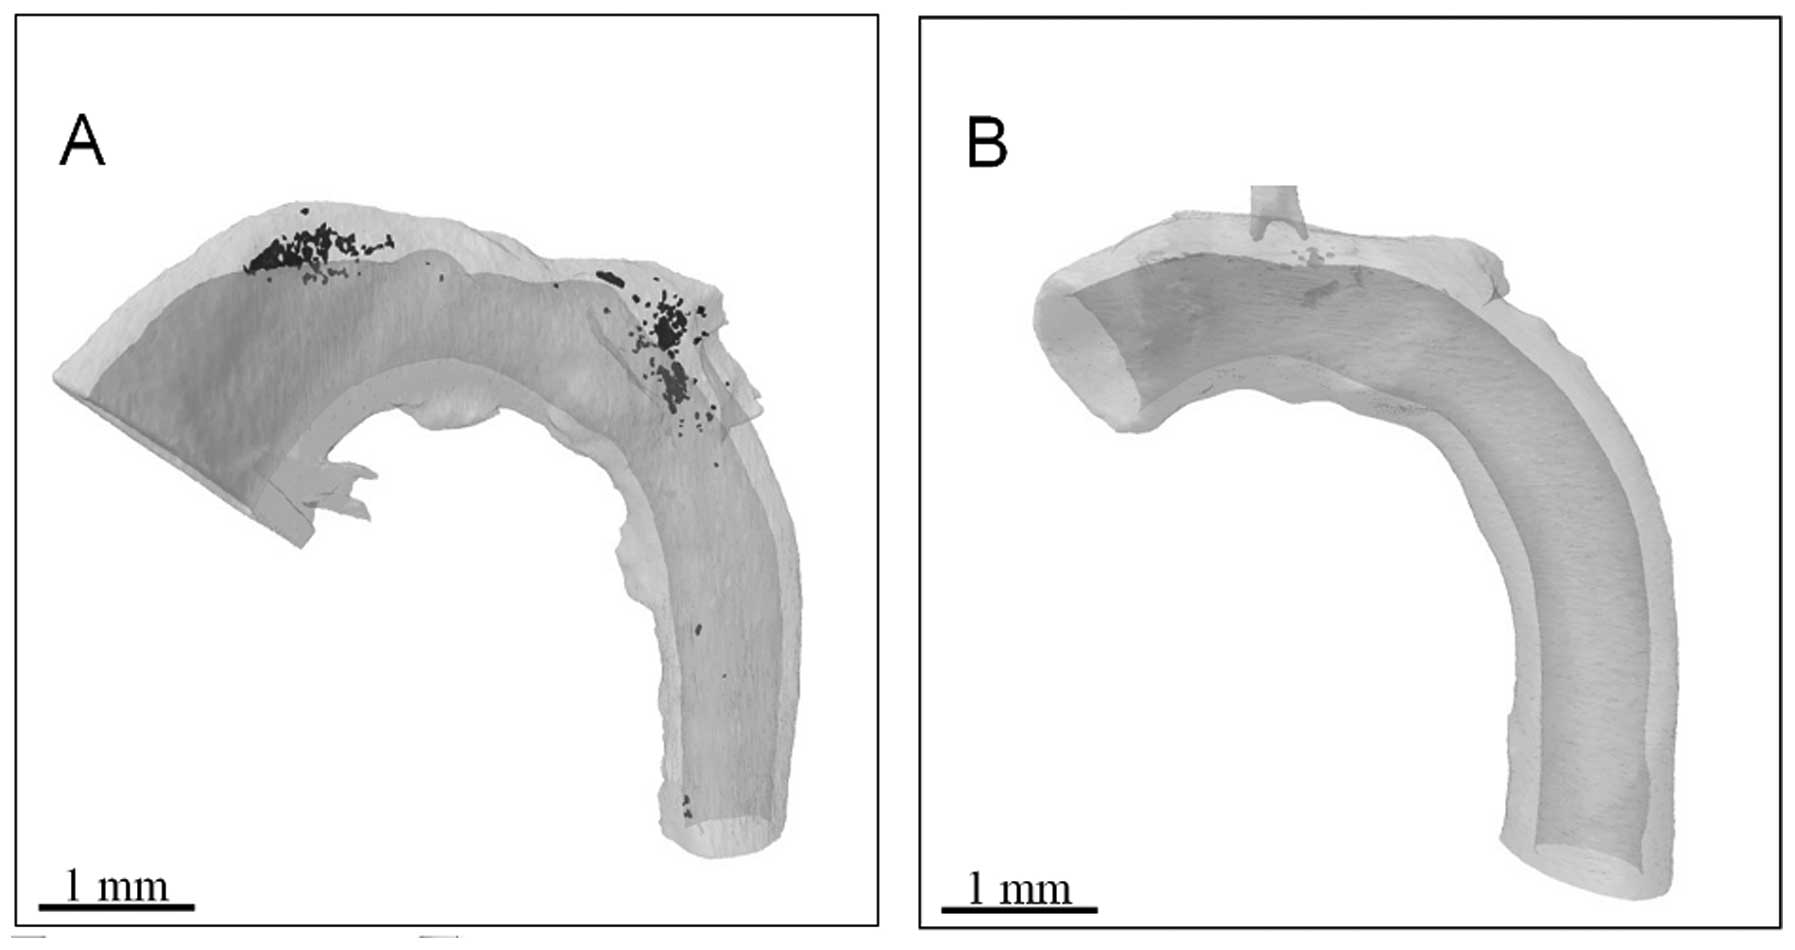
tissue assessment. Therefore, the 3D nature of μCT scanning has yet
to be employed to fully exploit the potential for volumetric
visualisation and assessment of multifocal regions of calcium
deposition. The corn oil offered a different density to water,
allowing a clearer definition of the soft tissue. It was therefore
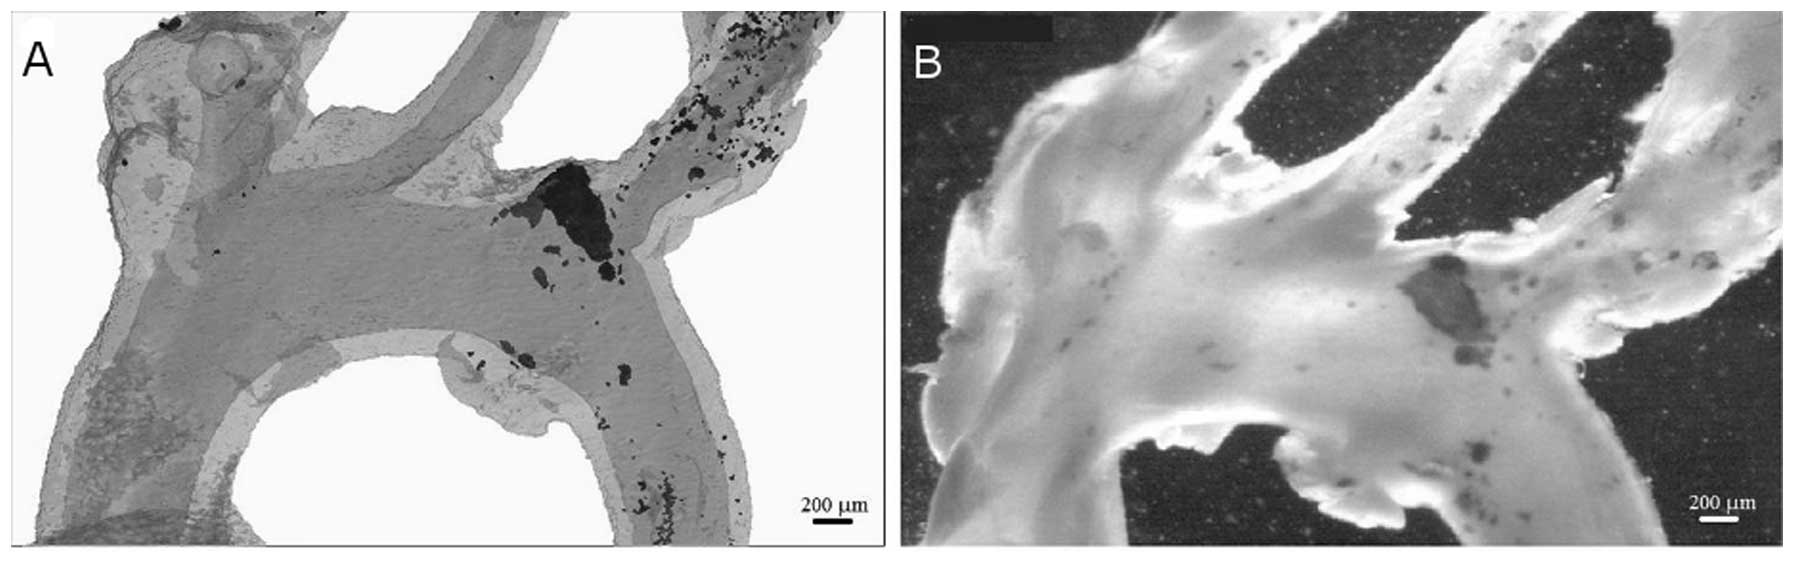
possible in the present study to reconstruct calcified (Fig. 3A) and non-calcified (Fig. 3B) aortae. A significant advantage
of 3D reconstructions is that the rotation of an image around any
axis is possible, without the limitations associated with
interpretation on a single plane.
A highly accurate quantification of a standardized
region of calcium deposition (400 slices from the subclavian
artery) was undertaken on the reconstructions (Fig. 4). In the three samples measured,
it was possible to quantify the exact amount of volume
corresponding to the mineral threshold compared to the soft tissue
of the standardised area selected. For comparison purposes, the
same aortae were stained with Alizarin red, which allowed
visualisation of the areas of calcification within the soft tissue.
An excellent visual correlation was observed between stained aortae
and the corresponding μCT reconstructions (Fig. 5), indicating that the selected
thresholds corresponded to the mineral and soft tissue,
respectively.
Discussion
Results of the present study demonstrate the
suitability of μCT for the assessment of calcification in isolated
arteries. We report a novel method for specimen preparation and
soft tissue definition that produces high-resolution 3D images and
demonstrates the first visualisation of calcified aortae. Scanning
of the sample, submerged in corn oil, provides anatomical
information on the size and distribution of calcified regions
within the soft tissue, as well as reproducible quantification of
both the calcified area and the residual soft tissue. Even though
in the present study this was undertaken in mouse aortae, this
technique would be equally suitable for analysis of blood vessels
from other species, including small human vessels. The methodology
described in the present study represents considerable improvement
over traditional histological approaches, chemical assays and
previously reported μCT imaging protocols for the analysis of
calcium deposition in arteries (9–11).
The key innovation of this study is the use of a
fluid with a markedly different density to water during the μCT
scan. Soft tissue, which is comprised predominantly of water and
collagen, has previously been difficult to visualise with μCT
scanning of aortic calcification, due to the comparable densities
of water and soft tissue. The inability to assess the calcification
volume with respect to the whole tissue has therefore limited the
application of μCT in the vascular calcification field to date. The
capacity to accurately quantify calcification and tissue volume is
therefore a major strength of the technique described in the
present study. Additional benefits of using the oil-immersion
method include the prevention of i) drying and shrinkage of the
tissue and ii) leaching of the dual-contrast agent during scanning.
The disadvantages of the technique are that it can only be carried
out ex vivo and that connective tissues attached to the
aortae are indistinguishable from the aorta itself. It is therefore
extremely important to clean the aortae of such tissues after
dissection. Even considering these minor disadvantages, compared to
histological approaches, this method of quantification is
considerably more representative of the total calcification burden
in an artery, and is not subjected to the bias and error incurred
by selecting areas of analysis either randomly along the profile of
the vessel, or at the site of maximum calcification. This is
emphasised in the current study, with 3D reconstructions indicating
a notable variation in calcium deposition over relatively short
lengths of the vessel (Fig.
3).
Imaging by μCT is relatively convenient, fast and
high throughput. Therefore, the method reported herein provides the
means to allow the highly accurate 3D evaluation of morphology to
become a routine component of ex vivo vascular calcification
studies. 3D optical imaging modalities have also been recently
employed to spatially and temporally resolve and quantify dynamic
pro-calcification molecular mechanisms in mouse aortae in
vivo (13). Thus, these 3D
imaging systems provide powerful tools to study the progression of
aortic calcification and potential therapeutic strategies for
clinical intervention.
Acknowledgements
This study was supported by an Institute Strategic
Programme Grant and Institute Career Path Fellowship funding from
the Biotechnology and Biological Sciences Research Council
(BBSRC).
References
|
1
|
Mackenzie NC and MacRae VE: The role of
cellular senescence during vascular calcification: a key paradigm
in aging research. Curr Aging Sci. 4:128–136. 2011. View Article : Google Scholar : PubMed/NCBI
|
|
2
|
Zhu D, Mackenzie NC, Farquharson C and
Macrae VE: Mechanisms and clinical consequences of vascular
calcification. Front Endocrinol (Lausanne). 3:952012.PubMed/NCBI
|
|
3
|
Speer MY, Yang HY, Brabb T, et al: Smooth
muscle cells give rise to osteochondrogenic precursors and
chondrocytes in calcifying arteries. Circ Res. 104:733–741. 2009.
View Article : Google Scholar : PubMed/NCBI
|
|
4
|
Zhu D, Mackenzie NC, Millán JL,
Farquharson C and MacRae VE: The appearance and modulation of
osteocyte marker expression during calcification of vascular smooth
muscle cells. PLoS One. 6:e195952011. View Article : Google Scholar : PubMed/NCBI
|
|
5
|
Zhu D, Mackenzie NC, Millan JL,
Farquharson C and MacRae VE: A protective role for FGF-23 in local
defence against disrupted arterial wall integrity? Mol Cell
Endocrinol. 372:1–11. 2013. View Article : Google Scholar : PubMed/NCBI
|
|
6
|
Murshed M, Harmey D, Millan JL, McKee MD
and Karsenty G: Unique coexpression in osteoblasts of broadly
expressed genes accounts for the spatial restriction of ECM
mineralization to bone. Genes Dev. 19:1093–1104. 2005. View Article : Google Scholar : PubMed/NCBI
|
|
7
|
Rutsch F, Ruf N, Vaingankar S, et al:
Mutations in ENPP1 are associated with ‘idiopathic’ infantile
arterial calcification. Nat Genet. 34:379–381. 2003.
|
|
8
|
Mackenzie NC, Huesa C, Rutsch F and MacRae
VE: New insights into NPP1 function: lessons from clinical and
animal studies. Bone. 51:961–968. 2012. View Article : Google Scholar : PubMed/NCBI
|
|
9
|
Postnov AA, D’Haese PC, Neven E, De Clerck
NM and Persy VP: Possibilities and limits of X-ray microtomography
for in vivo and ex vivo detection of vascular calcifications. Int J
Cardiovasc Imaging. 25:615–624. 2009. View Article : Google Scholar : PubMed/NCBI
|
|
10
|
Persy V, Postnov A, Neven E, et al:
High-resolution X-ray microtomography is a sensitive method to
detect vascular calcification in living rats with chronic renal
failure. Arterioscler Thromb Vasc Biol. 26:2110–2116. 2006.
View Article : Google Scholar : PubMed/NCBI
|
|
11
|
Awan Z, Denis M, Bailey D, et al: The LDLR
deficient mouse as a model for aortic calcification and
quantification by micro-computed tomography. Atherosclerosis.
219:455–462. 2011. View Article : Google Scholar : PubMed/NCBI
|
|
12
|
Mackenzie NC, Zhu D, Milne EM, et al:
Altered bone development and an increase in FGF-23 expression in
Enpp1(−/−) mice. PLoS One. 7:e321772012.PubMed/NCBI
|
|
13
|
Aikawa E, Nahrendorf M, Figueiredo JL, et
al: Osteogenesis associates with inflammation in early-stage
atherosclerosis evaluated by molecular imaging in vivo.
Circulation. 116:2841–2850. 2007. View Article : Google Scholar : PubMed/NCBI
|