Introduction
Studies have been carried out to identify genes
causing hypertension using 2 strains of hypertensive rats:
spontaneously hypertensive rats (SHR) and a substrain derived from
SHR, stroke-prone SHR (SHRSP) (1,2).
Normotensive Wistar-Kyoto rats (WKY) are normally used as the
control rats (1). Since SHR and
SHRSP are not only used as rat models of essential hypertension and
stroke, but also as rat models of attention-deficit hyperactivity
disorder (ADHD), studies using these rat models are expected to
reveal genes not only related to hypertension and stroke, but also
those related to ADHD (3–6). In a previous study, as the first
step of this project, we investigated gene expression profiles in
adrenal glands in these 3 rats strains when the rats were 3 and 6
weeks of age (7).
An increasing number of studies has demonstrated the
critical role of the central nervous system in the development and
maintenance of hypertension and brain ventricular enlargement,
accompanied by the loss of brain tissue and weight, as well as in
the volume of grey matter (8,9).
In this study, as a second step in identifying genes responsible
for causing hypertension and stroke, as well as those related to
ADHD, we compared gene expression profiles in the brains of 3 rat
strains, between SHR and WKY, and between SHRSP and SHR. When the
rats were at 3 and 6 weeks of age, a period in which the rats are
considered to be in a pre-hypertensive state, a total of 179 genes
presenting a >4- or <-4-fold change in expression were
isolated.
After classifying the 179 genes according to their
expression profiles, candidate genes were selected as significantly
enriched genes, and categorized with Gene Ontology (GO) terms using
the Database for Annotation, Visualization and Integrated Discovery
(DAVID) web tools (10,11). Subsequently, the interactions of
these genes were analyzed with Ingenuity Pathway Analysis (IPA).
IPA of SHR-specific genes revealed that prostaglandin E receptor 4
(Ptger4) is one of the candidate genes responsible for
causing hypertension in SHR (12,13), as well as albumin (Alb) and
chymase 1 (Cma1), in the presence of angiotensinogen
(Agt) (14–16). Similar analyses of SHRSP-specific
genes revealed that angiotensin II receptor-associated gene
(Agtrap) interacts with FBJ osteosarcoma oncogene
(Fos), and with angiotensin II receptor type-1B
(Agtr1b) (17–19). These interactions play pivotal
roles among SHRSP-specific genes, and since Agtrap and
Agtr1b not only participate in the ‘uptake of
norepinephrine’ and ‘blood pressure’, but also in the ‘behavior’ of
6-week-old SHRSP, the data presented in the present study reveal a
close association between hypertension and ADHD.
Materials and methods
Animals, RNA extraction, microarray
design, microarray analysis and microarray data analysis
The details of these procedures have been described
in our previous study [Yamamoto et al (7)].
Animals
The animals used in this study, SHR/Izm, SHRSP/Izm
and WKY/Izm, were provided by the Disease Model Cooperative
Research Association, Kyoto, Japan. Three-week-old rats were
purchased and maintained for 2 days in our animal facility and used
as 3-week-old rats. Five-week-old rats were purchased and, after
having been maintained for 1 week in our animal facility, were used
as 6-week-old rats. All the animals were handled according to the
guidelines established by the Japanese Association for Laboratory
Animal Science, while all experiments involving rats were approved
by the Animal Care and Use Committee of Hyogo College of Medicine
on September 27, 2010.
RNA extraction
Briefly, total RNA was purified using an miRNeasy
kit (Qiagen, Hilden, Germany) according to the manufacturer’s
instructions.
Microarray design
Expression profiling was performed using the 4x44K
whole rat genome oligo microarray version 3.0 G2519F (Agilent
Technologies Inc., Santa Clara, CA, USA). Eighteen 1-color
microarray-based gene analyses were performed with WKY, SHR and
SHRSP at 3 and 6 weeks of age as biological triplicates. Each gene
expression profile was compared between SHR and WKY, as well as
between SHRSP and SHR at 3 and 6 weeks of age.
Microarray analysis
Total RNA (200 ng) was reverse-transcribed into
double-stranded cDNA using AffinityScript multiple temperature
reverse transcriptase, and amplified. The resulting cRNA were
labeled with cyanine-3-labeled cytosine triphosphate (Perkin-Elmer,
Wellesley, MA, USA) using a Low Input Quick-Amp Labeling kit
(Agilent Technologies Inc.). The labeled samples were hybridized
with Agilent 4x44K whole rat genome arrays (Agilent Design
#028282). After washing, the slides were scanned with an Agilent
Microarray Scanner (G2505C). Feature extraction software (version
10.5.1.1) was used to convert the images into gene expression
data.
Microarray data analysis
Raw data were imported into Subio platform version
1.12 (Subio Inc., Aichi, Japan), and raw intensity data were
normalized to the 75th percentile intensity of probes above
background level (gIsWellAbove=1). SHR- and SHRSP-specific genes
were defined as those showing signal ratios with a >4- or
<-4-fold change in expression. Raw data were accepted in Gene
Expression Omnibus (GEO, accession no. GSE41452).
Quantitative real-time polymerase chain
reaction (qRT-PCR)
To validate the results obtained by microarray
analysis, 6 enriched genes were randomly selected from 27 unique
enriched genes, and qRT-PCR was performed under 10 different
experimental conditions. Total RNA (10 ng/reaction) extracted from
WKY, SHR and SHRSP, was analyzed using the One-step qPCR kit
(RNA-direct SYBR-Green Real-Time PCR Master Mix; Toyobo, Tokyo,
Japan). Samples were run in duplicate reactions in 96-well plates,
as previously described (20).
Median threshold cycle values were used to calculate the fold
change (FC) values between SHR and WKY, and between the SHRSP and
SHR reference samples. The FC values were normalized to GAPDH
levels. The following temperature profile was used: 30 sec at 90°C
and 20 min at 61°C for reverse transcription according to the
manufacturer’s instructions, followed by 45 cycles at 95°C for 15
sec, 65°C for 15 sec, and 74°C for 35 sec. Statistical comparisons
between microarray and qRT-PCR data were performed using Spearman’s
rank correlation test.
DAVID web tool analysis
An approach to annotation enrichment analysis was
performed using DAVID (http://david.abcc.ncifcrf.gov/) web tools (version
6.7, 2010) (10,11). This web-based resource provides a
set of functional annotation tools for the statistical enrichment
of genes classified based on GO terms. We used the GO FAT category,
which filters out very broad GO terms to identify statistically
enriched functional groups. The annotated gene and protein symbols
are presented in italics and regular font, respectively.
IPA
IPA software (Ingenuity® Systems,
http://www.ingenuity.com) was used for the
functional interpretation of gene expression data obtained from
microarray analyses. The network explorer of IPA was used to
identify relevant interactions among SHR- and SHRSP-specific genes,
and to identify the shortest literature-supported paths between
genes. This web tool was also used to overlay functions and
diseases, and to categorize SHR- and SHRSP-specific genes by
classifying them based on the disease-related functional
annotations. IPA also identified the biological functions and/or
diseases in the Ingenuity Knowledge Base that were most significant
to each of the category sets. The level of support for the
assignment was expressed by P-values calculated using the
right-tailed Fisher’s exact test.
Results
Identification and classification of SHR-
and SHRSP-specific genes
Since we expected the expression levels of the
candidate genes to be regulated long before the increase in blood
pressure occurred, i.e., during the pre-hypertensive period, we
examined the expression profiles of each probe using RNA samples
prepared from brain tissue obtained from rats at 3 and 6 weeks of
age, and isolated a total of 388 SHR- and SHRSP-specific probes
showing a >4- or <-4-fold change in expression (Table I).
 | Table INumber and classification of SHR- and
SHRSP-specific probes compared between the 2 pairs of rat
strains. |
Table I
Number and classification of SHR- and
SHRSP-specific probes compared between the 2 pairs of rat
strains.
| SHR/WKY | SHRSP/SHR | |
|---|
|
|
| |
|---|
| G-1 | G-2 | G-3 | G-4 | |
|---|
| 3 weeks old | 6 weeks old | 3 weeks old | 6 weeks old | All |
|---|
| All probes
isolated | 66 | 177 | 19 | 126 | 388 |
| Mapped probes | 45 | 74 | 15 | 51 | 185 |
| Unmapped
probes | 21 | 103 | 4 | 75 | 203 |
| Identified unique
genes | 42 | 73 | 14 | 50 | 179 |
| Upregulated | 14 | 51 | 8 | 8 | 81 |
| Downregulated | 28 | 22 | 6 | 42 | 98 |
| Enriched GO
terms | 3 | 2 | 1a | 3 | 9 |
| Enriched
genes | 12 | 10 | 2 | 11 | 35 |
We classified 388 probes into 4 groups (G-1 to G-4)
depending on the 2 rat strain pairs (SHR/WKY and SHRSP/SHR) and
their age (Table I) as follows:
G-1 probes were isolated when the rats were 3 weeks of age and
contained 66 SHR-specific probes. These 66 probes corresponded to
42 unique genes: 14 of them showed a >4-fold increase, and 28
showed a <-4-fold decrease in expression. G-2 contained 73
SHR-specific unique genes isolated when the rats were 6 weeks of
age. G-3 contained 14 SHRSP-specific unique genes isolated when the
rats were 3 weeks of age. G-4 contained 50 SHRSP-specific genes
isolated when the rats were 6 weeks of age. As shown in Table I, 388 probes were identified,
representing 179 unique genes.
Isolation of candidate genes as
significantly enriched genes
Firstly, candidate genes responsible for causing
hypertension, stroke and ADHD were selected from each group as
significantly enriched genes using DAVID (10,11). We isolated a total of 35 enriched
genes: G-1 contained 12 enriched genes categorized with 3 GO terms,
G-2 contained 10 enriched genes categorized with 2 GO terms, G-3
contained 2 enriched genes categorized with 1 GO term, and G-4
contained 11 enriched genes categorized with 3 GO terms (Table I).
These 35 enriched genes consisted of 27 unique genes
(Table II). To verify the
results obtained by microarray analyses, we randomly selected 6 out
of the 27 genes (Table III-A),
performed 10 qRT-PCR experiments (Table III-B), and compared the results
with those of obtained from microarray analyses by applying
Spearman’s rank correlation test. The results supported the
significant correlation between qRT-PCR and microarray analyses,
showing an rs value of 0.697 with a two-tailed P-value of
0.025.
| Table IIClassification and enrichment of SHR-
and SHRSP-specific genes. |
Table II
Classification and enrichment of SHR-
and SHRSP-specific genes.
| Group | GO category | GenBank ID | Description | GS | FC | P-value | Refs. |
|---|
| G-1 | GO:0051657
(P=0.009), maintenance of OLa | XM_001073636 | Hypothetical
LOC501349 |
LOC501349 | −4.4 | 0.001 | |
| NM_134326 | Albumin | Alb | −12.4 | 0.000 | (15) |
| GO:0047760
(P=0.010), butyrate-CoA ligase activity | NM_001014162 | Acyl-CoA synthetase
medium-chain family 5 | Acsm5 | 5.3 | 0.005 | (32,33) |
| NM_144748 | Acyl-CoA synthetase
medium-chain family 2 | Acsm2 | −4.5 | 0.004 | (32,33) |
| GO:0005576
(P=0.011), extracellular region | NM_013092 | Chymase 1 | Cma1 | 7.4 | 0.008 | (16) |
| NM_053549 | Vascular
endothelial growth factor B | Vegfb | −732.5 | 0.000 | (34) |
| NM_001108356 | α-fetoprotein |
LOC360919 | −4.2 | 0.000 | |
| NM_019274 | Collagen-like tail
asubunit of asymmetric ACHE | Colq | −4.1 | 0.000 | (35) |
| NM_053560 | Chitinase 3-like
1 | Chi3l1 | 4.2 | 0.000 | (36) |
| NM_001010970 | α-amylase 1 | Amy1a | −5.2 | 0.009 | (23,24) |
| NM_001108533 |
Sparc/osteonectin | Spock2 | 10.1 | 0.000 | (37) |
| NM_053918 | Glycoprotein
hormones α-chain | Cga | 16.5 | 0.007 | (38) |
| G-2 | GO:0008015
(P=0.002), blood circulation | NM_001007654 | Angiotensin II
receptor-associated protein | Agtrap | −23.6 | 0.000 | (17) |
| NM_017305 | Glutamate-cysteine
ligase modifier subunit | Gclm | 5.4 | 0.001 | (39) |
| NM_031009 | Angiotensin II
receptor type-1B | Agtr1b | 5.8 | 0.000 | (19) |
| NM_134326 | Albumin | Alb | −9.2 | 0.001 | (15) |
| NM_022936 | Epoxide hydrolase
2 | Ephx2 | −13.9 | 0.003 | (40) |
| GO:0006952
(P=0.002), defense response | NM_138522 | C-X-C motif
chemokine 3 | Cxcl3 | −10.7 | 0.001 | (41) |
| NM_001128494 | Lysozyme C type
2 | Lyc2 | 5.1 | 0.001 | |
| NM_012950 | Coagulation factor
II receptor | F2r | 5.3 | 0.001 | (42) |
| NM_001037534 | Defensin β17 | Defb17 | 88.4 | 0.000 | |
| NM_019169 | α-synuclein | Snca | 10.8 | 0.001 | (26,27) |
| G-3 | GO:0008015
(P=0.068), blood circulation | NM_001007654 | Angiotensin II
receptor-associated protein | Agtrap | −16.6 | 0.000 | (17) |
| NM_022936 | Epoxide hydrolase
2 | Ephx2 | −15.1 | 0.000 | (40) |
| G-4 | GO:0042592
(P=0.004), homeostatic process | XM_002725502 | Similar to
paired-Ig-like receptor A11 |
LOC690948 | 4.6 | 0.000 | |
| NM_212504 | Heat shock 70-kDa
protein 1B | Hspa1b | −4.9 | 0.000 | (31) |
| NM_053633 | Early growth
response 2 | Egr2 | −5.3 | 0.000 | (29,30) |
| NM_001037357 | Leukocyte IG-like
receptor B3-like | Lilrb3l | 25.7 | 0.000 | (43) |
| NM_012654 | Solute carrier
family 9 member 3 | Slc9a3 | −4.0 | 0.009 | (44) |
| NM_019169 | α-synuclein | Snca | −9.4 | 0.000 | (26,27) |
| GO:0008015
(P=0.005), blood circulation | NM_001007654 | Angiotensin II
receptor-associated protein | Agtrap | 23.7 | 0.000 | (17) |
| NM_017305 | Glutamate cysteine
ligase modifier subunit | Gclm | −5.0 | 0.008 | (39) |
| NM_031009 | Angiotensin II
receptor type-1B | Agtr1b | −5.9 | 0.001 | (19) |
| NM_022936 | Epoxide hydrolase
2 | Ephx2 | 12.6 | 0.000 | (40) |
| GO:0048168
(P=0.005), reg. of synaptic plasticityb | NM_019361 | Activity-regulated
cytoskeleton-associated protein | Arc | −4.6 | 0.000 | (28) |
| Table IIIValidation of microarray data with
qRT-PCR data. |
Table III
Validation of microarray data with
qRT-PCR data.
| A, Primers used for
qRT-PCR experiments |
|---|
|
|---|
| Gene symbol | Forward primer
(5′-3′) | Reverse primer
(5′-3′) |
|---|
| Vegfb |
TACCTGCAGATCATCAGAAACTTAGCTC |
CTCTCACCATCTGATTTGTGCAT |
| Defb17 |
CCCGACTACAAAACAAACTGACT |
TCCTTTTGCCTGTTAGTATTGTGATCGAA |
| Agtrap |
AAGCCCAAGATGTTTTCTCGT |
CTTCCTTCCGACAAGAACCCT |
| Ephx2 |
AGGCCCTCTAAACTGGTATCGAA |
ATCTTCCTTCCCAACGCCTT |
| Lilrb3l |
GCCCTTTGACCTCCAACCAG |
GTTCACTAGGAGCTGACCACAC |
|
LOC690948 |
ATGTTATGGTTACTACAAGAATACCCCACA |
ATGGCTTCCTCAATGGTCCT |
|
| B, Data used for
Spearman’s correlation analysis |
|
| Group | GenBank ID | Gene symbol | FC (qRT-PCR) | FC
(microarray) |
|
| G-1 | NM_053549 | Vegfb | −10.915 | −732.490 |
| G-2 | NM_001007654 | Agtrap | 1.603 | −16.619 |
| G-2 | NM_001037534 | Defb17 | 3.402 | 98.601 |
| G-2 | NM_022936 | Ephx2 | −3.794 | −15.072 |
| G-3 | NM_001007654 | Agtrap | −1.115 | −23.563 |
| G-3 | NM_022936 | Ephx2 | −3.310 | −13.898 |
| G-4 | NM_001007654 | Agtrap | 1.324 | 23.702 |
| G-4 | NM_022936 | Ephx2 | 3.028 | 12.647 |
| G-4 | NM_001037357 | Lilrb3l | 3.414 | 25.717 |
| G-4 | XM_002725502 |
LOC690948 | 6.823 | 4.594 |
Categorization of enriched genes
Enriched G-1 genes were categorized into 3 GO terms:
i) GO:0051657 (maintenance of organelle location) included 2 genes:
LOC501349 and Alb (Table II, G-1). Alb was also
categorized into GO:0008015 (blood circulation) (Table II, G-2); ii) GO:0047760
(butyrate-CoA ligase activity) included 2 genes: acyl-CoA
synthetase medium-chain family 5 and 2 (Acsm5 and
Acsm2, respectively); and iii) GO:0005576 (extracellular
region) included 8 genes: Cma1, vascular endothelial growth
factor B (Vegfb), α-fetoprotein (LOC360919),
collagen-like tail subunit of asymmetric acetylcholine-esterase
(Colq), chitinase 3-like 1 (Chi3l1), α-amylase 1
(Amy1a), sparc/osteonectin (Spock2) and glycoprotein
hormones α chain (Cga) (Table
II, G-1).
Enriched G-2 genes were categorized into 2 GO terms:
i) GO:0008015 (blood circulation) included 5 genes: Agtrap,
glutamate-cysteine ligase modifier subunit (Gclm),
Agtr1b, Alb, and epoxide hydrolase 2 (Ephx2);
and ii) GO:0006952 (defense response) included 5 genes: C-X-C motif
chemokine 3 (Cxcl3), lysozyme C type 2 (Lyc2),
coagulation factor II receptor (F2r), defensin β17
(Defb17) and α-synuclein (Snca) (Table II, G-2).
Enriched G-3 genes included Agtrap and
Ephx2, which were categorized into GO:0008015 (blood
circulation). These 2 genes were also categorized as enriched G-2
genes (Table II, G-2). Enriched
G-4 genes were categorized into 3 GO terms: i) GO:0042592
(homeostatic process) included 6 genes: similar to
paired-immunoglobulin-like receptor A11 (LOC690948), heat
shock 70-kDa protein 1B (Hspa1b), early growth response 2
(Egr2), leukocyte immunoglobulin-like receptor B3-like
(Lilrb3l), solute carrier family 9 member 3 (Slc9a3)
and Snca; ii) GO:0008015 (blood circulation) included 4
genes: Agtrap, Gclm, Agtr1b and Ephx2;
and iii) GO:0048168 (regulation of neuronal synaptic plasticity)
included 1 gene: activity-regulated cytoskeleton-associated protein
(Arc) (Table II,
G-4).
Interactions among SHR-specific
genes
We found that the G-1 genes did not include most of
the hypertension-related genes, and that the G-2 genes included
typical hypertension-related genes, such as Agtrap,
Gclm, Agtr1b and Ephx2 (Table II, G-2). As these results
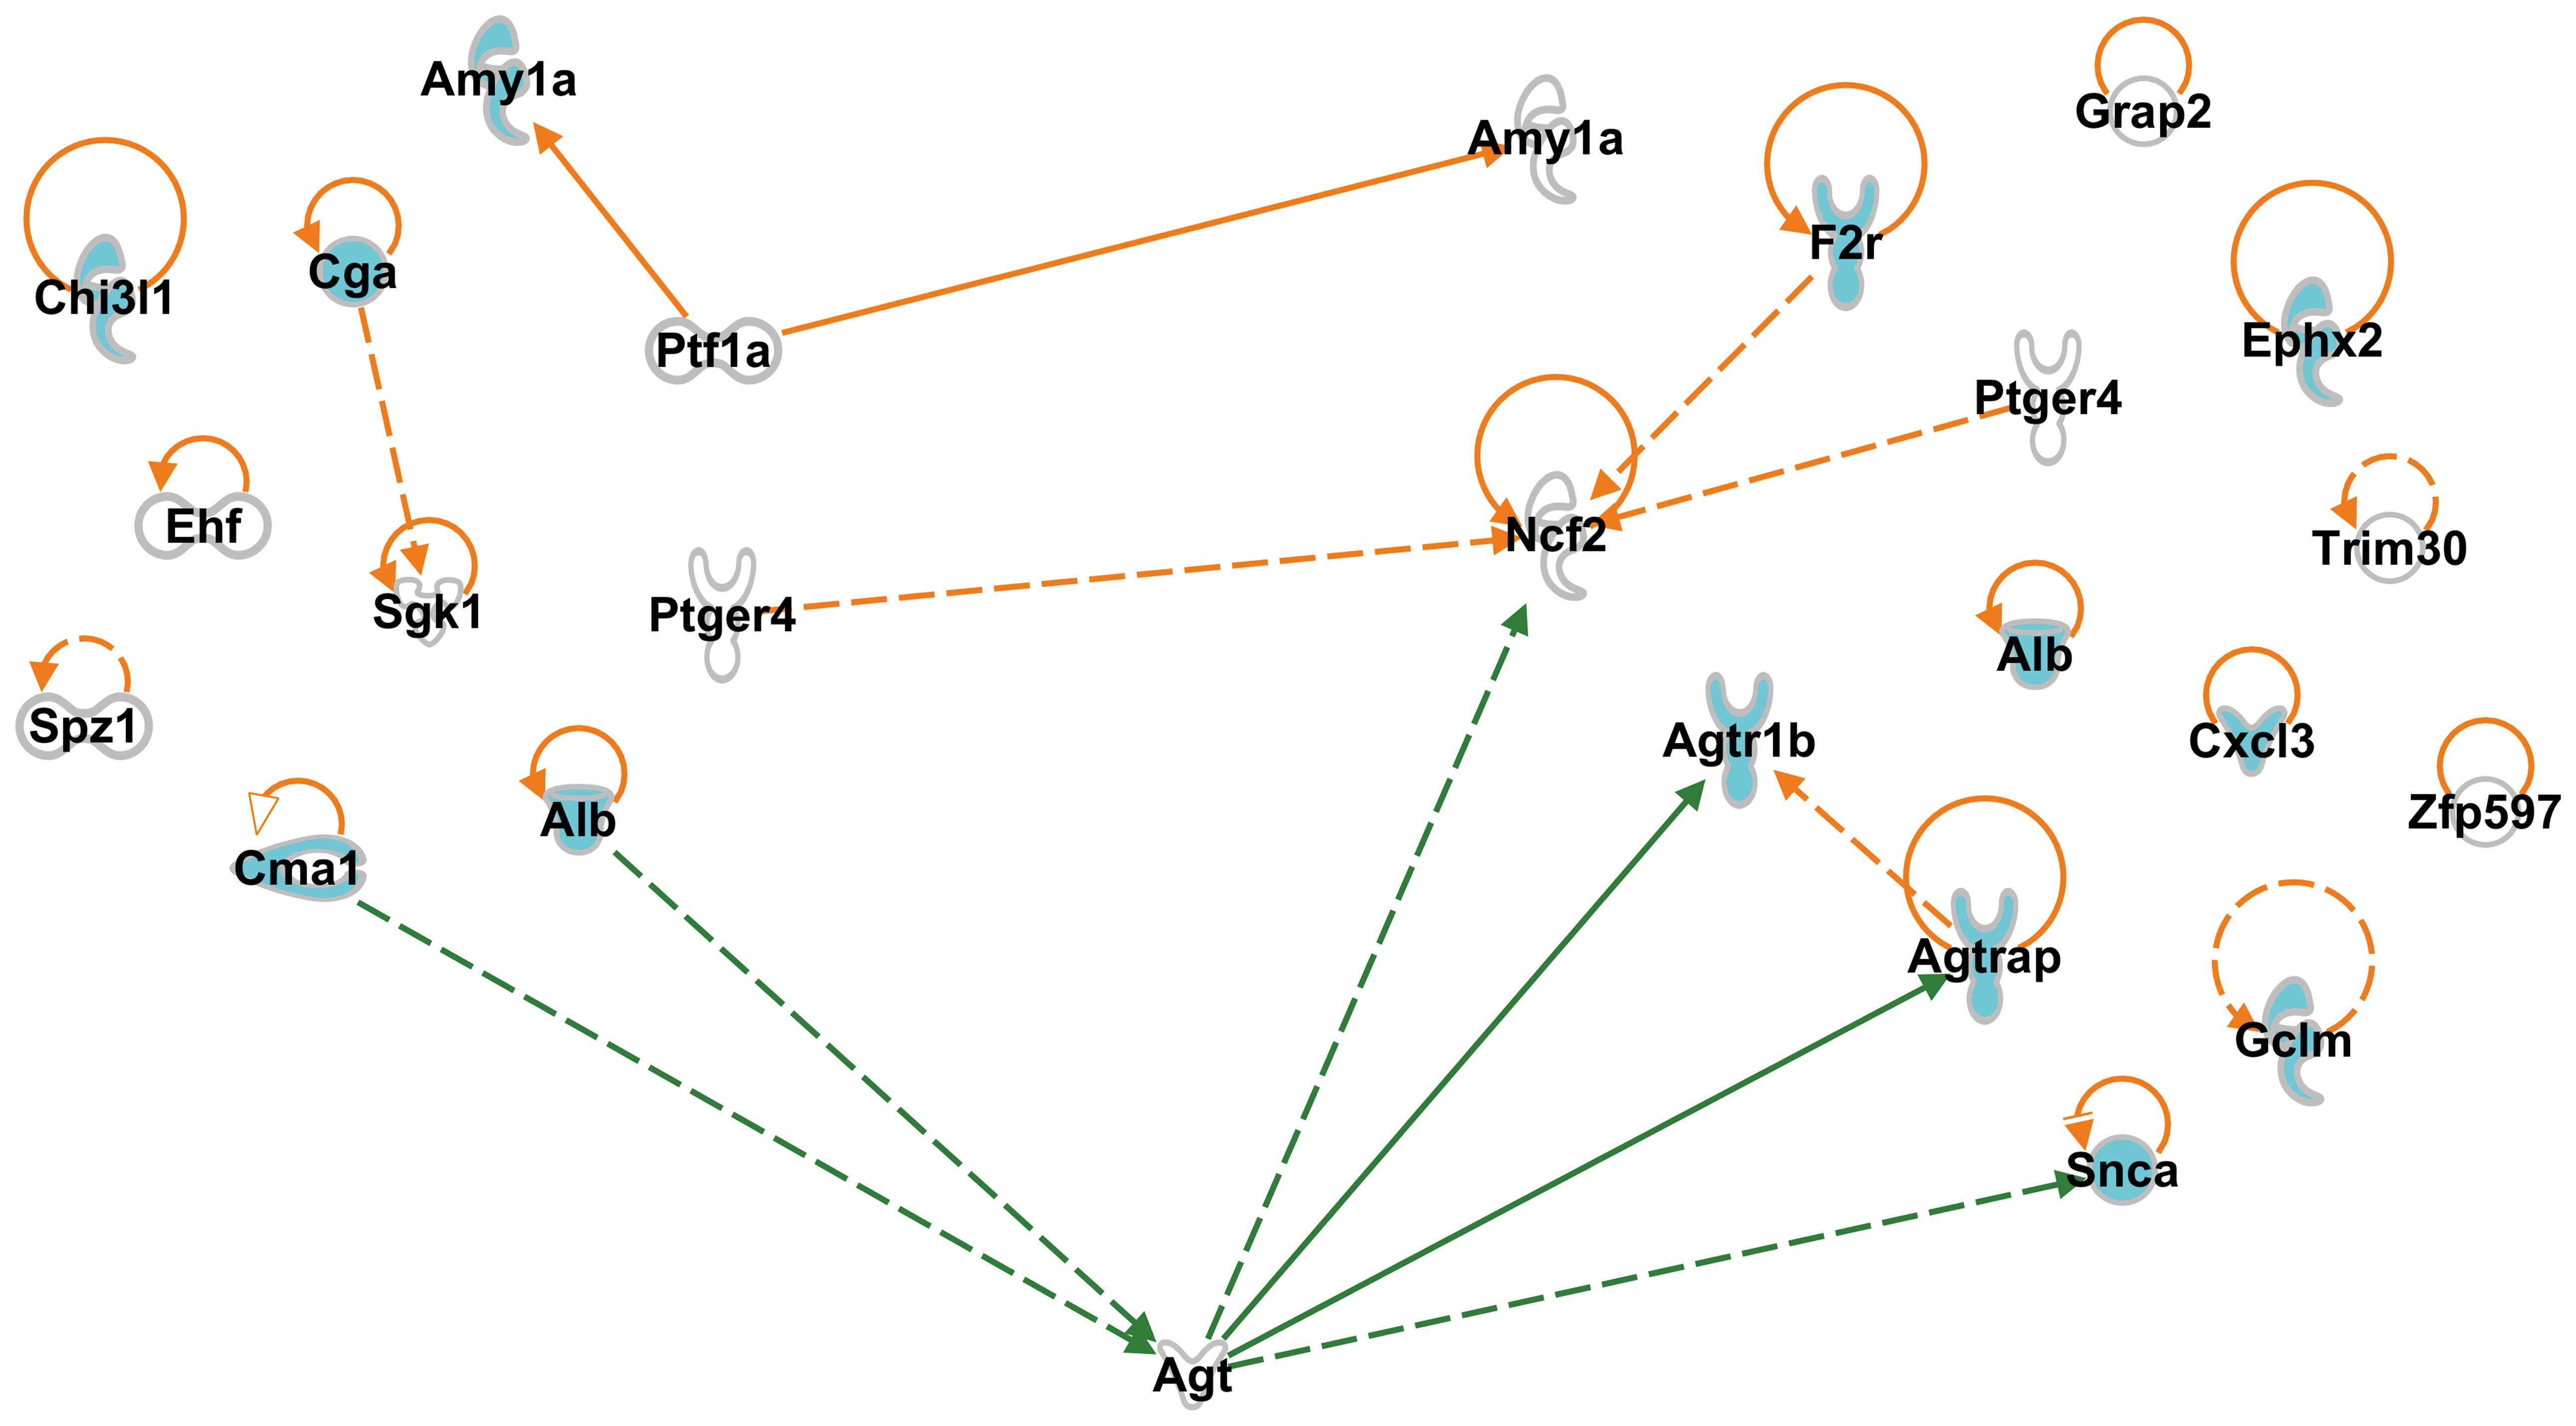
suggested that G-1 genes included regulatory genes that control the
expression of hypertension-related G-2 genes, we searched for
interaction networks between G-1 and G-2 genes, using IPA software,
and identified 2 interaction networks, one between Ptf1a and
Amy1a, and the other between Ptger4 and neutrophil
cytosolic factor 2 (Ncf2) (Fig. 1). The former interaction was also
observed among G-1 genes, and the latter was also observed among
G-2 genes (Fig. 1). Of note,
Ptf1a and Ptger4 were not categorized with the
enriched GO terms: Ptf1a encodes a protein related to
transcriptional regulation, and Ptger4 encodes a receptor
related to the regulatory expression of several genes (Table IV-A). For each non-enriched gene
that participated in either interaction or was self-controlled,
relevant references are presented (Table IV).
| Table IVList of non-enriched SHR- and
SHRSP-specific genes. |
Table IV
List of non-enriched SHR- and
SHRSP-specific genes.
| A, Genes
participating either in interactions between genes or are
self-controlled (Figs. 1 and
2) |
|---|
|
|---|
| Group | GenBank ID | Description | GS | FC | P-value | Refs. |
|---|
| G-1 | NM_001106493 | ETS homologous
factor | Ehf | −5.0 | 0.003 | |
| NM_053964 | Pancreas-specific
transcription factor 1a | Ptf1a | 4.4 | 0.001 | (21,22) |
| NM_032076 | Prostaglandin E
receptor 4 | Ptger4 | −4.8 | 0.005 | (12,13) |
| NM_019232 |
Serum/glucocorticoid regulated kinase
1 | Sgk1 | 4.1 | 0.001 | (45–47) |
| NM_001024297 | Spermatogenic
leucine zipper 1 | Spz1 | −4.1 | 0.004 | |
| G-2 | NM_001010970 | α-amylase 1 | Amy1a | −5.4 | 0.009 | (23,24) |
| NM_001034944 | GRB2-related
adaptor protein 2 | Grap2 | −7.8 | 0.004 | |
| NM_001100984 | Neutrophil
cytosolic factor 2 | Ncf2 | −4.3 | 0.000 | (25) |
| NM_032076 | Prostaglandin E
receptor 4 | Ptger4 | −6.5 | 0.005 | (12,13) |
| XM_574516 | Tripartite motif
protein 30-like | Trim30 | −4.7 | 0.000 | |
| NM_153732 | Zinc finger protein
597 | Zfp597 | 5.8 | 0.000 | (48) |
| G-3 | NM_153732 | Zinc finger protein
597 | Zfp597 | 6.9 | 0.000 | (48) |
| G-4 | NM_022197 | FBJ osteosarcoma
oncogene | Fos | −4.5 | 0.000 | (18) |
| NM_030865 | Myocilin | MyoC | 4.1 | 0.000 | |
| NM_001100984 | Neutrophil
cytosolic factor 2 | Ncf2 | −4.3 | 0.000 | (25) |
| NM_153732 | Zinc finger protein
597 | Zfp597 | −7.0 | 0.000 | (48) |
|
| B, Genes annotated
to disease-related functions (Table
V) |
|
| Group | GenBank ID | Description | GS | FC | P-value | Refs. |
|
| G-1 | NM_019184 | Cytochrome P450,
subfamily 2, polypeptide 11 | Cyp2c11 | −6.7 | 0.003 | (49) |
| NM_031713 | Leukocyte
immunoglobulin-like receptor B3 | Lilrb3 | −4.6 | 0.003 | (43) |
| NM_133412 | Solute carrier
organic anion transporter family, member 6b1 | Slco6b1 | −7.2 | 0.002 | (50) |
| XM_001068965 | Lymphocyte antigen
75 | Ly75 | 7.2 | 0.000 | (51) |
| G-2 | BC126094 | Coenzyme Q3
homolog, methyltransferase | Coq3 | 4.2 | 0.002 | (52) |
| NM_001105859 |
ST6-N-acetylgalactosaminide
α-2,6-sialyltransferase 1 |
St6galnac1 | −6.0 | 0.007 | |
| NM_001105880 | Zinc finger and BTB
domain containing 20 | Zbtb20 | 7.9 | 0.001 | (53) |
| NM_145770 | Acyl-Coenzyme A
oxidase 2 | Acox2 | 5.3 | 0.000 | |
| XM_001068965 | Lymphocyte antigen
75 | Ly75 | 4.7 | 0.000 | (51) |
| NM_001107541 |
ADP-ribosyltransferase 1 | Art1 | −4.5 | 0.009 | |
| G-3 | NM_019338 | Regulator of
G-protein signaling 11 | Rgs11 | 5.0 | 0.000 | (54) |
| NM_053549 | Vascular
endothelial growth factor B | Vegfb | 768.1 | 0.000 | (33) |
| G-4 | NM_001105880 | Zinc finger and BTB
domain containing 20 | Zbtb20 | −10.8 | 0.000 | (53) |
| NM_019338 | Regulator of
G-protein signaling 11 | Rgs11 | −4.2 | 0.000 | (54) |
Interactions among SHRSP-specific
genes
Since we expected the candidate genes responsible
for causing stroke in SHRSP to be included in the SHRSP-specific
genes, we were interested in the interactions between the G-3 and
G-4 genes (Fig. 2), and
identified 2 interactions: Agtrap expression was observed in
the rats at 3 and 6 weeks of age and seemed to interact with 2
genes whose expression was observed in the rats at 6 weeks of age,
Agtr1b and Fos (Fig.
2). Moreover, Fos expression, observed in the rats at 6
weeks of age seemed to be self-controlled, and also showed
interactions with Agtrap, Agtr1b, Gclm,
Egr2, as well as with Snca via Hspa1b
(Fig. 2). Of note, Fos
expression in the rats at 6 weeks of age seemed to control
Egr2, Ephx2 and Ncf2 expression (Fig. 2), and seemed to play a pivotal
role among the genes expressed in SHRSP at 6 weeks of age.
Functions and disease-related annotations
of SHR- and SHRSP-specific genes
SHR- and SHRSP-specific genes were evaluated for
biological relevance using IPA, and we identified significantly
enriched ‘Functions’, such as molecular transport (‘uptake of
norepinephrine’), the cardiovascular system (‘blood pressure’) and
‘behavior’ (Table V).
| Table VSHR- and SHRSP-specific genes
classified based on the disease-related functional annotations. |
Table V
SHR- and SHRSP-specific genes
classified based on the disease-related functional annotations.
| Group | IPA function
(function and/or disease) | P-value | Gene symbol |
Genesa |
|---|
| G-1 | Renal damage
(proximal tubular toxicity) | 0.000 | Alb,
Cyp2c11, Slco6b1 | 3 |
| Cell function and
maintenance (function of leukocytes) | 0.001 | Chi3l1,
Cma1, Lilrb3, Ly75, Ptger4 | 5 |
| Cellular
development (arrest in differentiation of amacrine cells) | 0.001 | Ptf1a | 1 |
| Neurological
disease (delay in hyperalgesia) | 0.001 | Sgk1 | 1 |
| Developmental
disorder (atresia) | 0.002 | Alb,
Cga | 2 |
| G-2 | Molecular transport
(uptake of norepinephrine) | 0.000 | Agtrap,
Agtr1b, Snca | 3 |
| Carbohydrate
metabolism (metabolism of carbohydrate) | 0.001 | Agtr1b,
Coq3, F2r, Ptger4, Snca,
St6galnac1, Zbtb20 | 7 |
| Connective tissue
disorders (rheumatoid arthritis) | 0.001 | Acox2,
Alb, Art1, Cxcl3, Ephx2, Ptger4,
Snca | 7 |
| Cell function and
maintenance (proliferation of pro-T3 thymocytes) | 0.002 | Grap2 | 1 |
| Cell death (cell
death of central nervous system cells) | 0.002 | Alb,
Cxcl3, F2r, Gclm, Snca | 5 |
| Cardiovascular
system (blood pressure) | 0.002 | Agtrap,
Agtr1b, Ephx2, F2r, Ncf2 | 5 |
| Inflammatory
response (inflammatory response) | 0.002 | Agtr1b,
Cxcl3, Ephx2, F2r, Ly75, Ptger4,
Snca | 7 |
| G-3 | Lipid metabolism
(quantity of 11,12-epoxyeicosatrienoic acid) | 0.000 | Ephx2 | 1 |
| Nervous system
development and function (delay in photoresponse of mice) | 0.001 | Rgs11 | 1 |
| Post-translational
modification (O-glycosylation of protein) | 0.004 | Vegfb | 1 |
| Cardiovascular
system (blood pressure) | 0.004 | Agtrap,
Ephx2 | 2 |
| Molecular transport
(uptake of norepinephrine) | 0.004 | Agtrap | 1 |
| Cardiovascular
system (development of cardiovascular system) | 0.024 | Ephx2,
Vegfb | 2 |
| G-4 | Molecular transport
(uptake of norepinephrine) | 0.000 | Agtrap,
Agtr1b, Fos, Snca | 4 |
| Organismal survival
(survival of organism) | 0.000 | Agtr1b,
Ephx2, Fos, Hspa1b, Snca,
Zbtb20 | 6 |
| Cell death
(cytotoxicity) | 0.000 | Fos,
Gclm, Hspa1b, Snca | 4 |
| Molecular transport
(reabsorption of bicarbonate) | 0.001 | Slc9a3 | 1 |
| Cardiovascular
system (blood pressure) | 0.002 | Agtrap,
Agtr1b, Ephx2, Ncf2 | 4 |
| Behavior
(behavior) | 0.002 | Agtr1b,
Arc, Egr2, Fos, Hspa1b,
Snca | 6 |
| Nervous system
development and function (electrophysiology of the eye) | 0.003 | Fos,
Rgs11 | 2 |
G-1 genes included 3 SHR-specific genes involved in
renal damage [Alb, cytochrome P450 2c11 (Cyp2c11),
and solute carrier organic anion transporter family member 6b1
(Slco6b1)], and 5 genes involved in cellular function and
maintenance [Chi3l1, Cma1, leukocyte
immunoglobulin-like receptor B3 (Lilrb3), lymphocyte antigen
75 (Ly75) and Ptger4] (Table V, G-1). Some of these G-1 genes,
such as Cyp2c11, Slco6b1 and Ly75, were not
categorized into any of the enriched gene groups, nor into any of
the groups of genes that participated in the interactions between
geens (Table IV-B), and for each
non-enriched gene evaluated for biological relevance, relevant
references are provided. G-2 genes included 3 SHR-specific genes
involved in the ‘uptake of norepinephrine’ (Agtrap,
Agtr1b and Snca), and 5 genes involved with ‘blood
pressure’ (Agtr1b, Agtrap, Ephx2, F2r
and Ncf2) (Table V, G-2).
All these G-2 genes, apart from Ncf2, were categorized using
enriched GO terms (Table II,
G-2).
SHRSP-specific G-3 genes not only included
Agtrap, involved in the ‘uptake of norepinephrine’, but also
included Agtrap and Ephx2, which were involved in
‘blood pressure’ (Table V, G-3).
SHRSP-specific G-4 genes included the following: i) 4 genes
involved in the ‘uptake of norepinephrine’ (Agtr1b,
Agtrap, Fos and Snca); ii) 4 genes involved in
‘blood pressure’ (Agtr1b, Agtrap, Ephx2 and
Ncf2); and iii) 6 genes involved in the control of
‘behavior’ (Agtr1b, Arc, Egr2, Fos,
Hspa1b and Snca) (Table
V, G-4). Although Fos and Ncf2 were not
categorized using the enriched GO terms, the remaining
SHRSP-specific genes involved in the ‘uptake of norepinephrine’,
‘blood pressure’ and/or in ‘behavior’, were categorized with the
enriched GO terms, i.e., GO:0008015 (blood circulation) or
GO:0042592 (homeostatic process) (Table II, G-4).
Discussion
The first aim of the current study was to identify
the candidate genes responsible for causing hypertension in SHR,
the second was to identify genes leading to stroke, and the third
was to identify genes related to ADHD. Since juvenile SHRSP present
with a significant increase in motor activity, one of the typical
symptoms of ADHD, as early as 6 weeks of age (3), we expected the genes isolated from
the brain tissue of rats (SHR- or SHRSP-specific genes) at 3 and 6
weeks of age to include not only those related to hypertension and
stroke, but also those related to ADHD.
Interactions among SHR-specific genes,
and candidate genes responsible for causing hypertension in
SHR
We found that G-1 genes included regulatory genes
which control the expression of hypertension-related G-2 genes. We
also identified interactions between G-1 and G-2 genes: one between
Ptf1a and Amy1a, and another between Ptger4
and Ncf2 (Fig. 1). The
first interaction (Ptf1a and Amy1a) affects
carbohydrate metabolism, since Ptf1a encodes a protein that
is a component of the transcription factor complex (21,22), and Amy1a encodes an amylase
isoenzyme produced by the pancreas, which catalyzes the first step
in the digestion of dietary starch and glycogen. However, its role
in the genesis of hypertension is not clear at present (23,24). On the other hand, the interaction
between Ptger4 and Ncf2 is expected to affect blood
pressure, as Ncf2 was functionally involved in ‘blood
pressure’ (Table V, G-2).
Ptger4 encodes a member of the G-protein coupled receptor
family, and leads to the phosphorylation of glycogen synthase
kinase-3, which can act as a regulatory switch for numerous
signaling pathways involved in the neonatal adaptation of the
circulatory system, in osteoporosis, as well as in the initiation
of skin immune responses (12,13). As Ncf2 encodes a 67-kDa
cytosolic subunit of the multi-protein NADPH oxidase complex, its
interaction with Ptger4 has been implicated in a number of
cardiovascular pathologies, such as atherosclerosis, hypertension
and stroke (25).
Since these predicted interactions did not include
most of the hypertension-related G-2 genes, we applied the IPA
software, and suggested that G-1 and G-2 gene interactions are
assisted by the presence of a gene. Agt, mutations of which
are associated with susceptibility to essential hypertension, was
found to aid the interactions between 2 G-1 and 4 G-2 genes
(Fig. 1). These data suggest that
Ptger4 is one of the candidate genes responsible for causing
hypertension in SHR, and that Alb and Cma1, in the
presence of Agt, also behave as candidate genes causing
hypertension in SHR by interacting with hypertension-related G-2
genes, such as Ncf2, Agtr1b, Agtrap and
Snca (Fig. 1).
Interactions among SHRSP-specific genes,
and candidate genes responsible for causing stroke in SHRSP
Since candidate genes that cause stroke in SHRSP
were expected to be included in the SHRSP-specific genes, we wished
to determine the interactions between G-3 and G-4 genes (Fig. 2). IPA revealed 2 interactions:
Agtrap not only interacted with Agtr1b, but also with
Fos, which regulates the transcription from the RNA
polymerase II promoter (Fig. 2).
Moreover, Fos interacted with several other G-4 genes
(Fig. 2). These results indicate
that Agtrap and Fos play pivotal roles in the
pathogenesis of stroke. All these interactions are expected to
affect blood pressure, as Agtrap, Gclm, Agtr1b
and Ephx2 were categorized by DAVID analysis into GO:0008015
(blood circulation) (Table II,
G-4), and, using IPA, Agtrap, Agtr1b,
Ephx2 and Ncf2 were functionally found to be involved
in ‘blood pressure’ (Table V,
G-4).
Genes possibly participating in the
development of ADHD
Three G-2 genes were found to be involved in the
‘uptake of norepinephrine’(Agtrap, Agtr1b and
Snca) (Table V, G-2).
Agtrap and Agtr1b were categorized into GO:0008015
(blood circulation), and Snca was categorized into
GO:0006952 (defense response) (Table
II, G-2). Snca regulates the homeostasis of dopaminergic
and serotonergic synapses, through the trafficking of dopamine and
serotonin transporters, and plays a central role in the homeostasis
of noradrenergic neurons (26,27). Accordingly, the SHR-specific G-2
genes involved in the ‘uptake of norepinephrine’ are expected not
only to participate in the control of ‘blood pressure’, but also in
the development of ADHD symptoms. Similarly, 4 G-4 genes,
Agtrap, Agtr1b, Fos and Snca, were
found to be involved in the ‘uptake of norepinephrine’ (Table V, G-4). Although Fos was
not categorized using the enriched GO terms (Table IV-A), these 4 genes were expected
to participate in ‘blood pressure’ control, and in the development
of ADHD.
Six SHRSP-specific G-4 genes (Agtr1b,
Arc, Egr2, Fos, Hspa1b and
Snca), were found to be functionally involved in ‘behavior’
(Table V, G-4). Of note, 3 of
these 6 genes, Agtr1b, Fos and Snca, were
included among those functionally involved in the ‘uptake of
norepinephrine’ (Table V, G-4).
The remaining 3 genes, Arc, Egr2 and Hspa1b,
functionally involved in ‘behavior’, were also expected to
participate in ‘blood pressure’ control, as well as in the
development of ADHD. Arc plays a critical role in the
consolidation of enduring synaptic plasticity and memory storage
(28), while Egr2 encodes
a transcription factor with 3 tandem C2H2-type zinc fingers [since
defects in this gene are associated with neurological diseases,
such as Charcot-Marie-Tooth disease and Dejerine-Sottas syndrome,
it has been suggested to play a role in learning and long-term
potentiation (29,30)]. Hspa1b encodes a 70-kDa
heat-shock protein, which is known to promote neurodegeneration in
sporadic Parkinson’s disease through its functional interaction
with other Parkinson’s disease-related genes (31). All the aforementioned results
suggest that not only the genes involved in the ‘uptake of
norepinephrine’ but also those functionally involved in ‘behavior’
participate in the development of ADHD.
In conclusion, in this study, we analyzed the gene
expression profiles in the brains of 3- and 6-week-old SHR and
SHRSP, and found that the G-4 genes involved in the ‘uptake of
norepinephrine’ include Agtrap, Agtr1b, Snca
and Fos, and those related to ‘blood pressure’ include
Agtrap, Agtr1b, Ephx2 and Ncf2
(Table V, G-4). Moreover,
Agtr1b, Snca, Fos, Arc, Egr2 and
Hspa1b were the genes involved in ‘behavior’ (Table V, G-4). Since Agtrap
expression in SHRSP at 3 and 6 weeks of age interacted with
Agtr1b (Fig. 2), these 2
genes participated not only in the ‘uptake of norepinephrine’ and
‘blood pressure’, but also in ‘behavior’. These results reveal that
Agtrap and Agtr1b participate in the development of
hypertension and ADHD, indicating that there is a close association
between hypertension and ADHD.
Acknowledgements
We would like to thank Dr Etsuro Yamanishi,
President Emeritus of Hirakata General Hospital for Developmental
Disorders, and Dr Aritomo Suzuki, Professor Emeritus of Kinki
University, for their constant support and encouragement, and Miss
Fumie Kanazawa for her expert secretarial assistance. We also thank
the National Center for Biotechnology Information, USA, and DNA
Data Bank of Japan for access to the network servers.
Abbreviations:
|
ADHD
|
attention-deficit hyperactivity
disorder
|
|
DAVID
|
Database for Annotation,
Visualization and Integrated Discovery
|
|
FC
|
fold change
|
|
GEO
|
Gene Expression Omnibus
|
|
GO
|
Gene Ontology
|
|
IPA
|
Ingenuity Pathway Analysis
|
|
qRT-PCR
|
quantitative real-time polymerase
chain reaction
|
|
SHR
|
spontaneously hypertensive rats
|
|
SHRSP
|
stroke-prone SHR
|
|
WKY
|
normotensive Wistar-Kyoto rats
|
References
|
1
|
Okamoto K and Aoki K: Development of a
strain of spontaneously hypertensive rats. Jpn Circ J. 27:282–293.
1963. View Article : Google Scholar : PubMed/NCBI
|
|
2
|
Okamoto K, Yamori Y and Nagaoka A:
Establishment of the stroke-prone spontaneously hypertensive rat
(SHR). Circ Res. 34–35(Suppl I): I143–I153. 1974.
|
|
3
|
Ueno KI, Togashi H, Mori K, et al:
Behavioural and pharmacological relevance of stroke-prone
spontaneously hypertensive rats as an animal model of a
developmental disorder. Behav Pharmacol. 13:1–13. 2002. View Article : Google Scholar : PubMed/NCBI
|
|
4
|
Faraone SV and Mick E: Molecular genetics
of attention deficit hyperactivity disorder. Psychiatr Clin North
Am. 33:159–180. 2010. View Article : Google Scholar : PubMed/NCBI
|
|
5
|
DasBanerjee T, Middleton FA, Berger DF,
Lombardo JP, Sagvolden T and Faraone SV: A comparison of molecular
alterations in environmental and genetic rat models of ADHD: a
pilot study. Am J Med Genet B Neuropsychiatr Genet. 147B:1554–1563.
2008. View Article : Google Scholar : PubMed/NCBI
|
|
6
|
Russell VA, Oades RD, Tannock R, Killeen
PR, Auerbach JG, Johansen EB and Sagvolden T: Response variability
in Attention-Deficit/Hyperactivity Disorder: a neuronal and glial
energetics hypothesis. Behav Brain Funct. 2:302006. View Article : Google Scholar : PubMed/NCBI
|
|
7
|
Yamamoto H, Okuzaki D, Yamanishi K, et al:
Genetic analysis of genes causing hypertension and stroke in
spontaneously hypertensive rats. Int J Mol Med. 31:1057–1065.
2013.PubMed/NCBI
|
|
8
|
Tajima A, Hans FJ, Livingstone D, Wei L,
Finnegan W, DeMaro J and Fenstermacher J: Smaller local brain
volumes and cerebral atrophy in spontaneously hypertensive rats.
Hypertension. 21:105–111. 1993.PubMed/NCBI
|
|
9
|
Lanari A, Silvestrelli G, De Dominicis P,
Tomassoni D, Amenta F and Parnetti L: Arterial hypertension and
cognitive dysfunction in physiologic and pathologic aging of the
brain. Am J Geriatr Cardiol. 16:158–164. 2007. View Article : Google Scholar : PubMed/NCBI
|
|
10
|
Huang da W, Sherman BT and Lempicki RA:
Systematic and integrative analysis of large gene lists using DAVID
bioinformatics resources. Nat Protoc. 4:44–57. 2009.PubMed/NCBI
|
|
11
|
Huang da W, Sherman BT and Lempicki RA:
Bioinformatics enrichment tools: paths toward the comprehensive
functional analysis of large gene lists. Nucleic Acids Res.
37:1–13. 2009.PubMed/NCBI
|
|
12
|
Hoshino T, Namba T, Takehara M, et al:
Prostaglandin E2 stimulates the production of amyloid-beta peptides
through internalization of the EP4 receptor. J Biol Chem.
284:18493–18502. 2009. View Article : Google Scholar : PubMed/NCBI
|
|
13
|
Nguyen M, Camenisch T, Snouwaert JN, et
al: The prostaglandin receptor EP4 triggers remodelling of the
cardiovascular system at birth. Nature. 390:78–81. 1997. View Article : Google Scholar : PubMed/NCBI
|
|
14
|
Dickson ME, Tian X, Liu X, Davis DR and
Sigmund CD: Upstream stimulatory factor is required for human
angiotensinogen expression and differential regulation by the A-20C
polymorphism. Circ Res. 103:940–947. 2008. View Article : Google Scholar : PubMed/NCBI
|
|
15
|
Bakoush O, Tencer J, Torffvit O, Tenstad
O, Skogvall I and Rippe B: Increased glomerular albumin
permeability in old spontaneously hypertensive rats. Nephrol Dial
Transplant. 19:1724–1731. 2004. View Article : Google Scholar : PubMed/NCBI
|
|
16
|
Frank BT, Rossall JC, Caughey GH and Fang
KC: Mast cell tissue inhibitor of metalloproteinase-1 is cleaved
and inactivated extracellularly by alpha-chymase. J Immunol.
166:2783–2792. 2001. View Article : Google Scholar : PubMed/NCBI
|
|
17
|
Azuma K, Tamura K, Shigenaga A, et al:
Novel regulatory effect of angiotensin II type 1
receptor-interacting molecule on vascular smooth muscle cells.
Hypertension. 50:926–932. 2007. View Article : Google Scholar : PubMed/NCBI
|
|
18
|
Matsuo K, Owens JM, Tonko M, Elliott C,
Chambers TJ and Wagner EF: Fosl1 is a transcriptional target
of c-Fos during osteoclast differentiation. Nat Genet. 24:184–187.
2000. View Article : Google Scholar
|
|
19
|
Gembardt F, Heringer-Walther S, van Esch
JH, et al: Cardiovascular phenotype of mice lacking all three
subtypes of angiotensin II receptors. FASEB J. 22:3068–3077. 2008.
View Article : Google Scholar : PubMed/NCBI
|
|
20
|
Ishii T, Onda H, Tanigawa A, et al:
Isolation and expression profiling of genes upregulated in the
peripheral blood cells of systemic lupus erythematosus patients.
DNA Res. 12:429–439. 2005. View Article : Google Scholar : PubMed/NCBI
|
|
21
|
Beres TM, Masui T, Swift GH, Shi L, Henke
RM and MacDonald RJ: PTF1 is an organ-specific and
Notch-independent basic helix-loop-helix complex containing the
mammalian Suppressor of Hairless (RBP-J) or its paralogue, RBP-L.
Mol Cell Biol. 26:117–130. 2006. View Article : Google Scholar
|
|
22
|
Meredith DM, Masui T, Swift GH, MacDonald
RJ and Johnson JE: Multiple transcriptional mechanisms control
Ptf1a levels during neural development including
autoregulation by the PTF1-J complex. J Neurosci. 29:11139–11148.
2009.PubMed/NCBI
|
|
23
|
Fukui H, Miwa E, Iwachido T, Kitaura H and
Furukawa H: Various emetogens increase the secretion of salivary
amylase in rats: a potential model in emesis research. J Pharmacol
Sci. 113:143–152. 2010. View Article : Google Scholar : PubMed/NCBI
|
|
24
|
Asanuma-Date K, Hirano Y, Le N, et al:
Functional regulation of sugar assimilation by N-glycan-specific
interaction of pancreatic α-amylase with glycoproteins of duodenal
brush border membrane. J Biol Chem. 287:23104–23118.
2012.PubMed/NCBI
|
|
25
|
Ju W, Eichinger F, Bitzer M, et al: Renal
gene and protein expression signatures for prediction of kidney
disease progression. Am J Pathol. 174:2073–2085. 2009. View Article : Google Scholar : PubMed/NCBI
|
|
26
|
Wersinger C, Jeannotte A and Sidhu A:
Attenuation of the norepinephrine transporter activity and
trafficking via interactions with alpha-synuclein. Eur J Neurosci.
24:3141–3152. 2006. View Article : Google Scholar : PubMed/NCBI
|
|
27
|
Outeiro TF, Kontopoulos E, Altmann SM, et
al: Sirtuin 2 inhibitors rescue alpha-synuclein- mediated toxicity
in models of Parkinson’s disease. Science. 317:516–519.
2007.PubMed/NCBI
|
|
28
|
Plath N, Ohana O, Dammermann B, et al:
Arc/Arg3.1 is essential for the consolidation of synaptic
plasticity and memories. Neuron. 52:437–444. 2006. View Article : Google Scholar : PubMed/NCBI
|
|
29
|
Nagarajan R, Svaren J, Le N, Araki T,
Watson M and Milbrandt J: EGR2 mutations in inherited neuropathies
dominant-negatively inhibit myelin gene expression. Neuron.
30:355–368. 2001. View Article : Google Scholar : PubMed/NCBI
|
|
30
|
Zaman G, Sunters A, Galea GL, et al:
Loading-related regulation of transcription factor EGR2/Krox-20 in
bone cells is ERK1/2 protein-mediated and prostaglandin, Wnt
signaling pathway- and insulin-like growth factor-I axis-dependent.
J Biol Chem. 287:3946–3962. 2012. View Article : Google Scholar : PubMed/NCBI
|
|
31
|
Kalia SK, Lee S, Smith PD, et al: BAG5
inhibits parkin and enhances dopaminergic neuron degeneration.
Neuron. 44:931–945. 2004. View Article : Google Scholar : PubMed/NCBI
|
|
32
|
Soupene E and Kuypers FA: Mammalian
long-chain acyl-CoA synthetases. Exp Biol Med (Maywood).
233:507–521. 2008. View Article : Google Scholar : PubMed/NCBI
|
|
33
|
Boomgaarden I, Vock C, Klapper M and
Döring F: Comparative analyses of disease risk genes belonging to
the acyl-CoA synthetase medium-chain (ACSM) family in human liver
and cell lines. Biochem Genet. 47:739–748. 2009. View Article : Google Scholar : PubMed/NCBI
|
|
34
|
Barouk S, Hintz T, Li P, Duffy AM,
MacLusky NJ and Scharfman HE: 17β-estradiol increases astrocytic
vascular endothelial growth factor (VEGF) in adult female rat
hippocampus. Endocrinology. 152:1745–1751. 2011.
|
|
35
|
Ohno K, Brengman J, Tsujino A and Engel
AG: Human endplate acetylcholinesterase deficiency caused by
mutations in the collagen-like tail subunit (ColQ) of the
asymmetric enzyme. Proc Natl Acad Sci USA. 95:9654–9659. 1998.
View Article : Google Scholar : PubMed/NCBI
|
|
36
|
Park JA, Drazen JM and Tschumperlin DJ:
The chitinase-like protein YKL-40 is secreted by airway epithelial
cells at base line and in response to compressive mechanical
stress. J Biol Chem. 285:29817–29825. 2010. View Article : Google Scholar : PubMed/NCBI
|
|
37
|
David SP, Hamidovic A, Chen GK, et al:
Genome-wide meta-analyses of smoking behaviors in African
Americans. Transl Psychiatry. 2:e1192012. View Article : Google Scholar : PubMed/NCBI
|
|
38
|
Bièche I, Latil A, Parfait B, et al: CGA
gene (coding for the alpha subunit of glycoprotein hormones)
overexpression in ER alpha-positive prostate tumors. Eur Urol.
41:335–341. 2002.PubMed/NCBI
|
|
39
|
Nakamura S, Sugiyama S, Fujioka D,
Kawabata K, Ogawa H and Kugiyama K: Polymorphism in
glutamate-cysteine ligase modifier subunit gene is associated with
impairment of nitric oxide-mediated coronary vasomotor function.
Circulation. 108:1425–1427. 2003. View Article : Google Scholar : PubMed/NCBI
|
|
40
|
Sinal CJ, Miyata M, Tohkin M, Nagata K,
Bend JR and Gonzalez FJ: Targeted disruption of soluble epoxide
hydrolase reveals a role in blood pressure regulation. J Biol Chem.
275:40504–40510. 2000. View Article : Google Scholar : PubMed/NCBI
|
|
41
|
Feuser K, Thon KP, Bischoff SC and Lorentz
A: Human intestinal mast cells are a potent source of multiple
chemokines. Cytokine. 58:178–185. 2012.PubMed/NCBI
|
|
42
|
Damiano BP, Cheung WM, Santulli RJ, et al:
Cardiovascular responses mediated by protease-activated receptor-2
(PAR-2) and thrombin receptor (PAR-1) are distinguished in mice
deficient in PAR-2 or PAR-1. J Pharmacol Exp Ther. 288:671–678.
1999.PubMed/NCBI
|
|
43
|
Ma G, Pan PY, Eisenstein S, Divino CM,
Lowell CA, Takai T and Chen SH: Paired immunoglobin-like receptor-B
regulates the suppressive function and fate of myeloid-derived
suppressor cells. Immunity. 34:385–395. 2011. View Article : Google Scholar : PubMed/NCBI
|
|
44
|
Crajoinas RO, Lessa LM, Carraro-Lacroix
LR, et al: Posttranslational mechanisms associated with reduced
NHE3 activity in adult vs. young prehypertensive SHR. Am J Physiol
Renal Physiol. 299:F872–F881. 2010. View Article : Google Scholar : PubMed/NCBI
|
|
45
|
Klaus F, Palmada M, Lindner R, Laufer J,
Jeyaraj S, Lang F and Boehmer C: Up-regulation of
hypertonicity-activated myo-inositol transporter SMIT1 by the cell
volume-sensitive protein kinase SGK1. J Physiol. 586:1539–1547.
2008.PubMed/NCBI
|
|
46
|
Lang F, Huang DY and Vallon V: SGK, renal
function and hypertension. J Nephrol. 23(Suppl 16): S124–S129.
2010.PubMed/NCBI
|
|
47
|
Loffing J, Flores SY and Staub O: Sgk
kinases and their role in epithelial transport. Annu Rev Physiol.
68:461–490. 2006. View Article : Google Scholar : PubMed/NCBI
|
|
48
|
Tanabe Y, Hirano A, Iwasato T, et al:
Molecular characterization and gene disruption of a novel
zinc-finger protein, HIT-4, expressed in rodent brain. J Neurochem.
112:1035–1044. 2010. View Article : Google Scholar : PubMed/NCBI
|
|
49
|
Martínéz-Jiménez CP, Castell JV,
Gómez-Lechón MJ and Jover R: Transcriptional activation of
CYP2C9, CYP1A1, and CYP1A2 by hepatocyte nuclear
factor 4alpha requires coactivators peroxisomal proliferator
activated receptor-gamma coactivator 1alpha and steroid receptor
coactivator 1. Mol Pharmacol. 70:1681–1692. 2006.
|
|
50
|
Suzuki T, Onogawa T, Asano N, et al:
Identification and characterization of novel rat and human
gonad-specific organic anion transporters. Mol Endocrinol.
17:1203–1215. 2003. View Article : Google Scholar : PubMed/NCBI
|
|
51
|
Kato M, Neil TK, Clark GJ, Morris CM, Sorg
RV and Hart DN: cDNA cloning of human DEC-205, a putative
antigen-uptake receptor on dendritic cells. Immunogenetics.
47:442–450. 1998. View Article : Google Scholar : PubMed/NCBI
|
|
52
|
Jonassen T and Clarke CF: Isolation and
functional expression of human COQ3, a gene encoding a
methyltransferase required for ubiquinone biosynthesis. J Biol
Chem. 275:12381–12387. 2000. View Article : Google Scholar : PubMed/NCBI
|
|
53
|
Sutherland AP, Zhang H, Zhang Y, et al:
Zinc finger protein Zbtb20 is essential for postnatal survival and
glucose homeostasis. Mol Cell Biol. 29:2804–2815. 2009. View Article : Google Scholar : PubMed/NCBI
|
|
54
|
Cao Y, Pahlberg J, Sarria I, Kamasawa N,
Sampath AP and Martemyanov KA: Regulators of G protein signaling
RGS7 and RGS11 determine the onset of the light response in ON
bipolar neurons. Proc Natl Acad Sci USA. 109:7905–7910. 2012.
View Article : Google Scholar : PubMed/NCBI
|