Introduction
Epigenetic modification, particularly changes in DNA
methylation at gene promoters, has been implicated in the
pathogenesis of various complex diseases, including atherosclerotic
cardiovascular disease (1–4).
Given that cellular patterns of DNA methylation are affected by
environmental and dietary factors, as well as by age, gender and
genetic variants (1,2), knowledge of the DNA methylation
pattern of atherosclerotic plaque lesions may provide insight into
the molecular mechanisms and interindividual outcome variability of
atherosclerotic diseases. Although DNA methylation in various genes
has been shown to be related to atherosclerosis or cardiovascular
disease (4–6), the pattern of DNA methylation in the
atherosclerotic human aorta has not been fully determined at the
genome-wide level. In this study, we therefore performed a
genome-wide analysis of DNA methylation in the atherosclerotic
human aorta in order to clarify epigenetic mechanisms underlying
the development of atherosclerosis.
Materials and methods
Study samples
A total of 48 post-mortem specimens of the human
aortic intima were examined. To avoid the effects of
interindividual variation, we performed intraindividual paired
comparisons of DNA methylation between atheromatous plaque lesions
and corresponding plaque-free tissue for 24 subjects. The tissue
samples were frozen at −80°C immediately after dissection. The
study protocol was approved by the Committees on the Ethics of
Human Research of Mie University Graduate School of Medicine, Tokyo
Metropolitan Institute of Gerontology, Japanese Red Cross Nagoya
First Hospital (Nagoya, Japan), and Gifu Prefectural Tajimi
Hospital (Tajimi, Japan). Written informed consent was obtained
from families of the deceased subjects.
Immunohistochemical analysis of
atheromatous plaque and plaque-free intima
Specimens of atheromatous plaque lesions and
plaque-free intima were subjected to immunohistochemical analysis.
Formalin-fixed and paraffin-embedded sections were depleted of
paraffin, hydrated, immersed in 0.01 mol/l citrate buffer (pH 6.0),
and heated for 10 min in a pressure cooker. Staining was performed
with the use of a ChemMate Envision/HRP kit (Dako, Glostrup,
Denmark). Mouse monoclonal antibodies to α-smooth muscle actin
(α-SMA) (clone 1A4, M0851; Dako), to CD68 (clone PG-M1, N1576;
Dako) and to CD45 (clone 2B11 + PD7/26, 722071; Nichirei
Bioscience, Tokyo, Japan) were applied according to the
manufacturer’s instructions. Proteinase K pre-treatment was used
for CD68 and CD45.
Genome-wide analysis of DNA
methylation
Genomic DNA was extracted from finely minced tissue
specimens with phenol-chloroform and was then precipitated with
ethanol. Bisulfite-modified genomic DNA was analyzed for DNA
methylation with a DNA methylation-specific microarray that
includes 485,553 CpG sites distributed throughout the entire genome
(HumanMethylation450 BeadChip; Illumina, San Diego, CA, USA).
Bisulfite conversion was performed with an EZ DNA Methylation kit
(Zymo Research, Irvine, CA, USA). We measured methylation at CpG
sites in genomic DNA isolated from atheromatous plaque or
plaque-free intima with a GenomeStudio Methylation Module
(Illumina). Call rate values for the 48 samples were ≥99.3%, with a
mean of 99.9%. The DNA methylation level at each CpG site was
calculated as the β value, where β = intensity of the methylated
allele/(intensity of the methylated allele + intensity of the
unmethylated allele +100), as previously described (7,8).
Transfection and immunoblot analysis
Human embryonic kidney (HEK)293 cells were cultured
under 5% CO2 at 37°C in Dulbecco’s modified Eagle’s
medium supplemented with 10% fetal bovine serum, penicillin (100
U/ml) and streptomycin (100 μg/ml). For examination of the effects
of gene overexpression, HEK293 cells were transfected for 48 h with
the expression vector, pCMV6-Entry (encoding COOH-terminal Myc and
DDK epitope tags; OriGene, Rockville, MD, USA), containing human
Drosophila headcase (HECA) homolog, early B-cell
factor 1 (EBF1), or nucleotide-binding oligomerization
domain containing 2 (NOD2) cDNA (or with the empty vector
alone) with the use of polyethylenimine, as previously described
(9). The transfected cells were
solubilized with 2X sodium dodecyl sulfate (SDS) sample buffer and
subjected to immunoblot analysis with antibodies to human HECA
(ab98993), EBF1 (ab126135), or NOD2 (ab31488) (all from Abcam,
Cambridge, UK) at a dilution of 1:1,000, 1:1,000 or 1:500,
respectively, or with mouse monoclonal antibodies to the DDK
epitope (OriGene) at a dilution of 1:6,000. For the examination of
the effects of attenuation of gene expression, HEK293 cells were
transfected for 72 h with the vector, pGFP-V-RS encoding short
hairpin RNA (shRNA) for human mitogen-activated protein kinase
kinase kinase kinase 4 (MAP4K4), zinc finger E-box binding
homeobox 1 (ZEB1) or FYN or a scrambled shRNA
(OriGene), with the use of polyethylenimine, as previously
described (9). The cells were
then lysed and subjected to immunoblot analysis with antibodies to
human MAP4K4 (ab134092), ZEB1 (ab155249), or FYN (ab119855) (all
from Abcam) at a dilution of 1:1,000, 1:1,000 or 1:500,
respectively. Immune complexes were detected with enhanced
chemiluminescence reagents (GE Healthcare Bio-Science, Piscataway,
NJ, USA).
Genome-wide gene expression analysis
Total RNA was isolated from the transfected cells
with the use of a NucleoSpin RNA II kit (Macherey-Nagel, Düren,
Germany). A total of 72 RNA samples was analyzed for RNA
concentration and RNA integrity (RIN) with a 2100 Bioanalyzer and
an RNA 6000 Nano kit (Agilent Technologies, Santa Clara, CA, USA).
The RIN values for the 72 samples were ≥9.4, with a mean of 9.93.
The RNA samples were then subjected to genome-wide analysis of gene
expression with a microarray that targets 34,694 transcripts
corresponding to well-characterized genes, gene candidates, or
splice variants distributed throughout the entire genome
(HumanHT-12 v4 Expression BeadChip; Illumina). In brief, total RNA
(500 ng) was amplified as cRNA and biotinylated with the use of
Epicentre TargetAmp Nano-g Biotin-aRNA Labeling for the Illumina
System (Epicentre, Madison, WI, USA). The concentration and quality
of the biotinylated cRNA were assessed with the 2100 Bioanalyzer.
Subsequent steps included hybridization of each sample to the
HumanHT-12 v4 Expression BeadChip, washing, blocking and
streptavidin-Cy3 staining. A GenomeStudio Gene Expression Module
(Illumina) was used to generate signal intensity values from the
scans and to perform the initial quality controls. Values for
noise-to-signal ratio (P95/P05 ratio) were between 12.8 and 23.8
for all samples (mean, 17.4), which is within the acceptable range
of ≥10.
Statistical analysis
DNA methylation (β values) or gene expression data
were compared between two groups with the unpaired Student’s t-test
or among three or more groups by one-way analysis of variance,
respectively. To compensate for multiple comparisons, we applied
Bonferroni’s correction for statistical significance of
association. The significance level was thus
P<1.03×10⁻⁷ (0.05/485,553) for the genome-wide
analysis of DNA methylation (Table
I) or P<4.80×10⁻⁷ [0.05/(34,694×3)] for the
genome-wide analysis of gene expression (Tables II and III). Statistical tests were performed
with JMP Genomics version 6.0 software (SAS Institute, Inc., Cary,
NC, USA).
 | Table IIdentification by genome-wide
analysis of CpG sites whose methylation status is significantly
related to atherosclerosis. |
Table I
Identification by genome-wide
analysis of CpG sites whose methylation status is significantly
related to atherosclerosis.
| Chromosome | Gene | CpG | Relation to
CpG | Methylation
site | Mean β value
(plaque) | Mean β value
(plaque-free) | β ratio
(plaque/plaque-free) | P-value |
|---|
| 17 | SEPT9 | cg14885762 | N Shore | TSS200 | 0.6283 | 0.5176 | 1.21 |
2.4×10⁻⁹ |
| 15 |
KIAA1199 | cg02240539 | | 5′UTR | 0.7175 | 0.5579 | 1.29 |
6.3×10⁻⁹ |
| 6 | | cg04304054 | | | 0.6749 | 0.5212 | 1.29 |
1.7×10⁻⁸ |
| 6 | ARID1B | cg17164954 | S Shelf | Body | 0.2551 | 0.3716 | 0.69 |
2.2×10⁻⁸ |
| 1 | SLC2A1 | cg16738646 | | Body | 0.2392 | 0.3977 | 0.60 |
2.2×10⁻⁸ |
| 2 | MAP4K4 | cg05113410 | | Body | 0.6508 | 0.5307 | 1.23 |
2.4×10⁻⁸ |
| 11 | ST5 | cg14521421 | | 5′UTR | 0.7343 | 0.6232 | 1.18 |
2.4×10⁻⁸ |
| 6 | HECA | cg08943714 | | Body | 0.2662 | 0.4037 | 0.66 |
2.8×10⁻⁸ |
| 9 | SMC5 | cg14477581 | | Body | 0.5906 | 0.4710 | 1.25 |
3.2×10⁻⁸ |
| 1 | MIR34A | cg00909706 | | TSS200 | 0.7355 | 0.6047 | 1.22 |
3.2×10⁻⁸ |
| 10 | | cg12714759 | N Shelf | | 0.1737 | 0.2626 | 0.66 |
3.6×10⁻⁸ |
| 4 | | cg24592513 | | | 0.2093 | 0.3112 | 0.67 |
3.8×10⁻⁸ |
| 2 | | cg00716848 | | | 0.8584 | 0.7257 | 1.18 |
3.9×10⁻⁸ |
| 5 | AP3S1 | cg24770230 | | Body | 0.7915 | 0.6997 | 1.13 |
4.0×10⁻⁸ |
| 10 | BICC1 | cg08466030 | | Body | 0.7054 | 0.6176 | 1.14 |
4.1×10⁻⁸ |
| 1 | | cg22046201 | | | 0.3712 | 0.5305 | 0.70 |
4.3×10⁻⁸ |
| 17 | SEPT9 | cg20772590 | N Shore | TSS200 | 0.6167 | 0.5181 | 1.19 |
4.4×10⁻⁸ |
| 10 | ZEB1 | cg18516609 | | Body | 0.7518 | 0.6440 | 1.17 |
4.5×10⁻⁸ |
| 1 | CAMTA1 | cg24634746 | | Body | 0.7967 | 0.6622 | 1.20 |
4.5×10⁻⁸ |
| 17 | MIR1180 | cg26619894 | S Shore | TSS1500 | 0.7982 | 0.7177 | 1.11 |
4.7×10⁻⁸ |
| 2 | GLS | cg03962451 | | Body | 0.3923 | 0.5382 | 0.73 |
4.7×10⁻⁸ |
| 5 | EBF1 | cg21211213 | | Body | 0.1954 | 0.2643 | 0.74 |
4.7×10⁻⁸ |
| 19 | PTPRS | cg08462941 | N Shore | 5′UTR | 0.6487 | 0.5613 | 1.16 |
4.8×10⁻⁸ |
| 17 | ABR | cg16374343 | S Shore | Body | 0.2230 | 0.3544 | 0.63 |
4.9×10⁻⁸ |
| 15 |
LOC145845 | cg12288941 | S Shelf | Body | 0.1361 | 0.1978 | 0.69 |
5.1×10⁻⁸ |
| 4 | SH3D19 | cg12556802 | | 5′UTR | 0.7845 | 0.6322 | 1.24 |
5.6×10⁻⁸ |
| 8 | DLC1 | cg22045977 | | Body | 0.8009 | 0.6945 | 1.15 |
5.9×10⁻⁸ |
| 17 | | cg10586883 | N Shelf | | 0.6865 | 0.5469 | 1.26 |
5.9×10⁻⁸ |
| 12 | PPM1H | cg06208382 | | Body | 0.3753 | 0.5020 | 0.75 |
6.2×10⁻⁸ |
| 6 | FYN | cg08114265 | | 5′UTR | 0.7132 | 0.6451 | 1.11 |
6.4×10⁻⁸ |
| 10 | BTBD16 | cg01077100 | | Body | 0.2701 | 0.3846 | 0.70 |
6.6×10⁻⁸ |
| 16 | NOD2 | cg18177814 | | TSS200 | 0.2629 | 0.3309 | 0.79 |
6.8×10⁻⁸ |
| 7 | RADIL | cg20556639 | N Shelf | 5′UTR | 0.7947 | 0.6981 | 1.14 |
7.0×10⁻⁸ |
| 22 | | cg09349128 | N Shore | | 0.2440 | 0.3571 | 0.68 |
7.5×10⁻⁸ |
| 14 | | cg20323874 | | | 0.6645 | 0.5561 | 1.20 |
8.4×10⁻⁸ |
| 7 | RNF216 | cg26724841 | N Shelf | 5′UTR | 0.6620 | 0.5734 | 1.15 |
8.7×10⁻⁸ |
| 16 | | cg02196592 | | | 0.5947 | 0.4921 | 1.21 |
8.9×10⁻⁸ |
| 15 | | cg16906765 | S Shelf | | 0.6233 | 0.5420 | 1.15 |
8.9×10⁻⁸ |
| 16 | | cg27647755 | | | 0.8287 | 0.7436 | 1.11 |
9.2×10⁻⁸ |
| 2 | | cg01473038 | N Shore | | 0.7275 | 0.6364 | 1.14 |
1.0×10⁻⁷ |
| 10 | MICU1 | cg09553839 | | 5′UTR | 0.4328 | 0.5278 | 0.82 |
1.0×10⁻⁷ |
| 7 | CPED1 | cg18952945 | | Body | 0.8271 | 0.7689 | 1.08 |
1.0×10⁻⁷ |
| 15 | RAB8B | cg09251291 | S Shore | Body | 0.6936 | 0.5393 | 1.29 |
1.0×10⁻⁷ |
| 13 | ENOX1 | cg24797276 | | 5′UTR | 0.7984 | 0.7400 | 1.08 |
1.0×10⁻⁷ |
| 10 | COL13A1 | cg20740485 | | Body | 0.7139 | 0.6019 | 1.19 |
1.0×10⁻⁷ |
| Table IIEffects of the overexpression of
HECA, EBF1 or NOD2 on gene expression in HEK293 cells. |
Table II
Effects of the overexpression of
HECA, EBF1 or NOD2 on gene expression in HEK293 cells.
| HECA | EBF1 | NOD2 |
|---|
|
|
|
|---|
| Gene |
Overexpression/control ratio (mean) | P-value | Gene |
Overexpression/control ratio (mean) | P-value | Gene |
Overexpression/control ratio (mean) | P-value |
|---|
| SPIRE2 | 6.13 |
1.0×10⁻¹⁶ |
KIAA1199 | 1.96 |
1.9×10⁻¹⁴ | HSPA6 | 8.01 |
<1.0×10⁻²⁰ |
| REEP2 | 0.64 |
2.1×10⁻¹⁵ | SPIRE2 | 2.77 |
2.4×10⁻¹⁴ | HSPA7 | 7.63 |
<1.0×10⁻²⁰ |
|
C12orf65 | 0.55 |
3.4×10⁻¹⁵ | STK19 | 0.68 |
4.6×10⁻¹³ | IL8 | 2.75 |
<1.0×10⁻²⁰ |
| DMRT3 | 0.69 |
6.7×10⁻¹³ |
C12orf65 | 0.70 |
1.5×10⁻¹² | SPIRE2 | 6.00 |
<1.0×10⁻²⁰ |
| PIGB | 1.44 |
8.2×10⁻¹² | SLC35B3 | 1.35 |
1.1×10⁻¹¹ |
C12orf65 | 0.48 |
<1.0×10⁻²⁰ |
| IMP4 | 0.63 |
3.0×10⁻¹¹ |
HIST1H4H | 1.47 |
1.3×10⁻¹¹ | DNAJB1 | 2.58 |
2.0×10⁻¹⁵ |
|
MAP1LC3B | 1.36 |
4.3×10⁻¹¹ | PGAM1 | 1.39 |
3.0×10⁻¹¹ | DMRT3 | 0.68 |
2.3×10⁻¹³ |
| NDUFV2 | 0.63 |
5.1×10⁻¹¹ | CCNYL1 | 1.27 |
3.9×10⁻¹¹ | REEP2 | 0.69 |
8.4×10⁻¹³ |
| HSPA6 | 1.32 |
5.3×10⁻¹¹ | DMRT3 | 0.75 |
4.0×10⁻¹¹ | BAG3 | 1.58 |
9.5×10⁻¹³ |
| HSPA1L | 1.32 |
6.6×10⁻¹¹ | PLA2G4C | 0.67 |
6.4×10⁻¹¹ | LGALS1 | 1.33 |
1.8×10⁻¹¹ |
| HSPH1 | 1.45 |
9.2×10⁻¹¹ | BEST1 | 0.71 |
6.7×10⁻¹¹ | HSPA1L | 1.61 |
2.0×10⁻¹¹ |
| RPF2 | 1.29 |
1.2×10⁻¹⁰ | HSPA1L | 1.29 |
9.3×10⁻¹¹ | HSPH1 | 1.91 |
3.8×10⁻¹¹ |
| EMILIN2 | 0.74 |
1.4×10⁻¹⁰ | STOX1 | 1.31 |
1.4×10⁻¹⁰ |
HIST1H4H | 0.69 |
6.1×10⁻¹¹ |
| GADD45G | 0.76 |
2.1×10⁻¹⁰ | FOXQ1 | 1.56 |
2.6×10⁻¹⁰ | HSPA1B | 1.40 |
8.5×10⁻¹¹ |
| LBR | 1.23 |
2.8×10⁻¹⁰ | RSHL3 | 1.32 |
3.3×10⁻¹⁰ | ZFAND2A | 1.62 |
9.5×10⁻¹¹ |
| RBM4 | 1.21 |
3.6×10⁻¹⁰ | SNAP25 | 0.70 |
3.6×10⁻¹⁰ | TTC25 | 0.76 |
2.5×10⁻¹⁰ |
| CKMT1B | 0.75 |
4.6×10⁻¹⁰ | ACLY | 1.18 |
3.6×10⁻¹⁰ | PSMD8 | 0.59 |
3.4×10⁻¹⁰ |
| ORC3L | 1.44 |
6.3×10⁻¹⁰ | TSC22D3 | 1.25 |
3.7×10⁻¹⁰ | METTL3 | 0.48 |
7.0×10⁻¹⁰ |
|
RAP1GDS1 | 1.21 |
6.3×10⁻¹⁰ |
C17orf97 | 0.79 |
4.4×10⁻¹⁰ | DEDD2 | 1.61 |
8.5×10⁻¹⁰ |
| BRAT1 | 0.71 |
8.1×10⁻¹⁰ | LBR | 1.20 |
4.9×10⁻¹⁰ |
C17orf97 | 0.82 |
9.4×10⁻¹⁰ |
| RDX | 1.41 |
9.4×10⁻¹⁰ | ZNF823 | 1.36 |
5.2×10⁻¹⁰ |
KIAA0100 | 0.72 |
1.9×10⁻⁹ |
| CDC25C | 1.25 |
1.1×10⁻⁹ | RDX | 1.45 |
5.3×10⁻¹⁰ | BEST1 | 0.80 |
2.1×10⁻⁹ |
| WDR43 | 1.43 |
1.2×10⁻⁹ | FAM53C | 0.81 |
5.7×10⁻¹⁰ |
HIST2H4B | 0.73 |
2.1×10⁻⁹ |
|
HNRNPCL1 | 0.84 |
1.6×10⁻⁹ | FAM3C | 1.21 |
5.9×10⁻¹⁰ | CHORDC1 | 1.38 |
2.3×10⁻⁹ |
| ZNF184 | 1.39 |
1.7×10⁻⁹ | CDH1 | 1.27 |
5.9×10⁻¹⁰ | DYNLRB2 | 0.81 |
2.4×10⁻⁹ |
| CCNC | 1.32 |
1.9×10⁻⁹ | ACTA1 | 0.73 |
6.6×10⁻¹⁰ | SNAP25 | 0.75 |
3.4×10⁻⁹ |
| SCAND3 | 1.35 |
2.0×10⁻⁹ | CEBPD | 1.32 |
7.4×10⁻¹⁰ | SPATA2L | 0.77 |
5.4×10⁻⁹ |
| BRD8 | 1.22 |
2.0×10⁻⁹ | ANKMY2 | 1.41 |
8.8×10⁻¹⁰ |
ARHGEF37 | 0.78 |
5.9×10⁻⁹ |
| DOCK10 | 0.79 |
2.1×10⁻⁹ | REEP2 | 0.80 |
1.0×10⁻⁹ |
SLC25A42 | 0.83 |
6.9×10⁻⁹ |
| CREBBP | 1.24 |
2.1×10⁻⁹ | GADD45G | 0.76 |
1.1×10⁻⁹ | INSM2 | 0.76 |
7.5×10⁻⁹ |
| UGT2B11 | 0.83 |
2.6×10⁻⁹ | COL8A2 | 0.80 |
1.4×10⁻⁹ | IFIT2 | 1.35 |
7.7×10⁻⁹ |
| ATP1A3 | 0.80 |
3.6×10⁻⁹ | SIGMAR1 | 1.20 |
1.6×10⁻⁹ |
HIST2H4A | 0.61 |
1.0×10⁻⁸ |
| RHBDD2 | 1.16 |
4.4×10⁻⁹ | BRD8 | 1.24 |
1.8×10⁻⁹ |
C16orf93 | 0.79 |
1.1×10⁻⁸ |
| GFM2 | 1.32 |
4.5×10⁻⁹ | GABBR2 | 1.41 |
1.8×10⁻⁹ | OVGP1 | 0.75 |
1.3×10⁻⁸ |
| FOXI3 | 0.84 |
5.0×10⁻⁹ | GAPDH | 1.19 |
1.8×10⁻⁹ | PIGB | 1.36 |
1.3×10⁻⁸ |
| ZNF823 | 1.23 |
5.2×10⁻⁹ | PCGF3 | 0.78 |
2.0×10⁻⁹ | RELB | 1.30 |
1.7×10⁻⁸ |
| SENP6 | 1.40 |
5.3×10⁻⁹ | CCNE1 | 1.18 |
2.2×10⁻⁹ | THOC3 | 1.23 |
1.9×10⁻⁸ |
| SRFBP1 | 1.24 |
5.6×10⁻⁹ | PREPL | 1.28 |
2.2×10⁻⁹ | NDUFV2 | 0.69 |
2.0×10⁻⁸ |
| THOC3 | 1.24 |
5.6×10⁻⁹ | BMP6 | 1.43 |
2.2×10⁻⁹ | HSPA4L | 1.39 |
2.0×10⁻⁸ |
| LY6H | 0.83 |
5.6×10⁻⁹ | ENO3 | 0.82 |
2.3×10⁻⁹ | RETNLB | 0.76 |
2.2×10⁻⁸ |
| PAK1 | 1.26 |
5.7×10⁻⁹ | MMP23B | 0.82 |
2.3×10⁻⁹ | UGT2B11 | 0.86 |
2.6×10⁻⁸ |
| NRAS | 1.27 |
5.7×10⁻⁹ | VGF | 0.81 |
2.5×10⁻⁹ | DOCK10 | 0.80 |
3.4×10⁻⁸ |
| ANKRD7 | 0.86 |
5.9×10⁻⁹ | REM2 | 0.77 |
2.6×10⁻⁹ | CCNE1 | 1.12 |
3.4×10⁻⁸ |
|
C20orf27 | 0.82 |
6.0×10⁻⁹ | SCAND3 | 1.37 |
2.8×10⁻⁹ | GPC3 | 1.24 |
3.8×10⁻⁸ |
|
CDKN2AIP | 1.3 |
7.3×10⁻⁹ | PAK1 | 1.40 |
3.1×10⁻⁹ | IQCK | 0.82 |
4.8×10⁻⁸ |
| DLK2 | 0.87 |
7.7×10⁻⁹ | ZP3 | 0.84 |
3.3×10⁻⁹ |
C9orf116 | 0.86 |
5.1×10⁻⁸ |
| TCEA1 | 1.25 |
8.2×10⁻⁹ | TPD52L2 | 0.83 |
3.4×10⁻⁹ | ZP3 | 0.85 |
5.3×10⁻⁸ |
|
C20orf194 | 0.86 |
8.3×10⁻⁹ | CCDC155 | 0.81 |
3.6×10⁻⁹ |
CACNA2D3 | 0.75 |
6.1×10⁻⁸ |
| PSMD4 | 1.21 |
8.3×10⁻⁹ |
MAP1LC3B | 1.29 |
3.7×10⁻⁹ | DHRS2 | 0.83 |
6.5×10⁻⁸ |
| PCDHA@ | 0.84 |
9.1×10⁻⁹ | PSMA1 | 1.18 |
3.8×10⁻⁹ | PGAM1 | 1.32 |
7.5×10⁻⁸ |
| Table IIIEffects of the depletion of MAP4K4,
ZEB1 or FYN on gene expression in HEK293 cells. |
Table III
Effects of the depletion of MAP4K4,
ZEB1 or FYN on gene expression in HEK293 cells.
| MAP4K4 | ZEB1 | FYN |
|---|
|
|
|
|---|
| Gene | Depletion/control
ratio (mean) | P-value | Gene | Depletion/control
ratio (mean) | P-value | Gene | Depletion/control
ratio (mean) | P-value |
|---|
| DDX60 | 2.08 |
<1.0×10⁻²⁰ | LAPTM4A | 1.39 |
1.2×10⁻¹¹ | CCNY | 0.62 |
3.3×10⁻¹⁴ |
| CCL5 | 3.58 |
<1.0×10⁻²⁰ | ZNF638 | 1.46 |
3.2×10⁻¹¹ | DCBLD1 | 0.56 |
3.4×10⁻¹³ |
| IFIH1 | 2.75 |
<1.0×10⁻²⁰ | CCNY | 0.69 |
9.6×10⁻¹¹ | FOXO3 | 0.62 |
4.8×10⁻¹² |
| ISG15 | 2.76 |
<1.0×10⁻²⁰ | SPIRE2 | 1.89 |
1.2×10⁻¹⁰ | SPIRE2 | 4.45 |
3.0×10⁻¹¹ |
| BST2 | 2.06 |
3.3×10⁻¹⁶ | TNPO3 | 0.71 |
1.6×10⁻¹⁰ | GNA11 | 0.53 |
3.4×10⁻¹¹ |
| EPSTI1 | 2.13 |
1.0×10⁻¹⁵ | ELOVL7 | 1.44 |
3.8×10⁻¹⁰ | TAB2 | 1.29 |
3.9×10⁻¹¹ |
| SPIRE2 | 3.03 |
1.3×10⁻¹⁵ | RFK | 1.17 |
4.7×10⁻¹⁰ | ZNF728 | 2.39 |
4.3×10⁻¹¹ |
| IRF7 | 1.84 |
1.7×10⁻¹⁵ |
HNRNPCL1 | 1.55 |
7.2×10⁻¹⁰ | NDUFS1 | 0.71 |
5.0×10⁻¹¹ |
|
PPP1R15A | 1.77 |
5.2×10⁻¹⁵ | MNX1 | 1.35 |
7.2×10⁻¹⁰ | TNPO3 | 0.78 |
5.9×10⁻¹¹ |
| DHRS2 | 2.72 |
6.6×10⁻¹⁵ | SNHG12 | 1.32 |
8.8×10⁻¹⁰ | SLC3A2 | 1.38 |
1.2×10⁻¹⁰ |
| ISG20 | 1.53 |
9.0×10⁻¹⁵ | HIVEP2 | 1.37 |
1.4×10⁻⁹ | VRK3 | 0.68 |
1.3×10⁻¹⁰ |
| H1F0 | 1.70 |
1.2×10⁻¹⁴ | FOXO3 | 0.62 |
1.7×10⁻⁹ | RHOQ | 0.56 |
1.3×10⁻¹⁰ |
| GORAB | 1.48 |
1.3×10⁻¹⁴ | MAGEH1 | 1.24 |
2.4×10⁻⁹ | ZNF275 | 0.60 |
2.1×10⁻¹⁰ |
| PIAS1 | 1.98 |
1.6×10⁻¹⁴ | ZKSCAN1 | 0.63 |
2.7×10⁻⁹ | NKAP | 1.53 |
3.2×10⁻¹⁰ |
| WAC | 1.55 |
2.5×10⁻¹⁴ | SIPA1L1 | 1.38 |
3.1×10⁻⁹ | PLEKHB2 | 0.73 |
3.4×10⁻¹⁰ |
| IFIT2 | 4.34 |
5.0×10⁻¹⁴ | LYRM2 | 0.67 |
3.2×10⁻⁹ | SPOP | 0.60 |
3.7×10⁻¹⁰ |
| IFI6 | 2.97 |
5.1×10⁻¹⁴ | CCNI | 0.73 |
3.6×10⁻⁹ | LYRM2 | 0.68 |
3.9×10⁻¹⁰ |
| IFNL1 | 2.11 |
6.7×10⁻¹⁴ | LMO4 | 1.30 |
3.6×10⁻⁹ | FICD | 0.71 |
4.5×10⁻¹⁰ |
| HERC6 | 1.46 |
7.2×10⁻¹⁴ | CSTF2 | 1.22 |
3.7×10⁻⁹ | FAM161A | 0.55 |
5.8×10⁻¹⁰ |
| HERC5 | 1.65 |
7.4×10⁻¹⁴ | GPR101 | 1.32 |
3.9×10⁻⁹ | IGDCC3 | 0.74 |
6.2×10⁻¹⁰ |
| IFIT1 | 2.75 |
8.8×10⁻¹⁴ |
HIST1H1C | 1.36 |
3.9×10⁻⁹ | CDK11B | 0.67 |
7.5×10⁻¹⁰ |
| IFIT3 | 1.45 |
9.2×10⁻¹⁴ | LYPD1 | 1.25 |
4.4×10⁻⁹ | ZNF681 | 1.62 |
7.6×10⁻¹⁰ |
| DDX58 | 1.48 |
1.0×10⁻¹³ | FICD | 0.75 |
4.7×10⁻⁹ | NDUFB6 | 0.72 |
8.4×10⁻¹⁰ |
| IFITM3 | 2.36 |
1.1×10⁻¹³ | ANP32A | 1.44 |
5.1×10⁻⁹ | SLIT2 | 0.58 |
8.4×10⁻¹⁰ |
| TAB2 | 1.36 |
1.7×10⁻¹³ | TEAD4 | 0.87 |
5.2×10⁻⁹ | TECPR1 | 0.67 |
9.4×10⁻¹⁰ |
| BEST1 | 1.76 |
2.2×10⁻¹³ | M6PR | 0.72 |
5.3×10⁻⁹ | PCYOX1 | 0.64 |
1.0×10⁻⁹ |
| ALCAM | 1.43 |
2.3×10⁻¹³ | HOXC6 | 1.35 |
5.3×10⁻⁹ | DUSP8 | 0.63 |
1.1×10⁻⁹ |
| LMO4 | 1.39 |
4.8×10⁻¹³ | BCAS2 | 1.40 |
5.6×10⁻⁹ | ZNF787 | 1.29 |
1.1×10⁻⁹ |
| ZNF787 | 1.32 |
6.0×10⁻¹³ |
TGFBRAP1 | 0.69 |
5.9×10⁻⁹ | SCD5 | 0.76 |
1.2×10⁻⁹ |
| IFITM1 | 1.74 |
6.0×10⁻¹³ | AKIRIN1 | 0.77 |
5.9×10⁻⁹ | AUP1 | 1.39 |
1.4×10⁻⁹ |
| LAPTM4A | 1.46 |
6.3×10⁻¹³ | PLEKHB2 | 0.74 |
6.1×10⁻⁹ | HIVEP2 | 1.42 |
1.5×10⁻⁹ |
| IFI44L | 1.93 |
9.2×10⁻¹³ | NUCB2 | 1.41 |
6.4×10⁻⁹ | FYN | 0.73 |
1.5×10⁻⁹ |
| ZNF274 | 1.24 |
1.0×10⁻¹² | RPS26 | 1.24 |
6.6×10⁻⁹ | AKIRIN1 | 0.78 |
1.7×10⁻⁹ |
| OVGP1 | 1.62 |
1.3×10⁻¹² | ITGAV | 1.32 |
6.6×10⁻⁹ |
TGFBRAP1 | 0.66 |
2.4×10⁻⁹ |
| OASL | 1.60 |
1.4×10⁻¹² | PRPF40A | 0.65 |
7.5×10⁻⁹ | HIPK2 | 0.64 |
2.6×10⁻⁹ |
| NKAP | 1.57 |
1.4×10⁻¹² | HOOK1 | 0.63 |
7.5×10⁻⁹ | LAPTM4A | 1.48 |
3.1×10⁻⁹ |
| CXCL10 | 2.06 |
1.6×10⁻¹² | SYK | 0.79 |
8.1×10⁻⁹ | PDPR | 0.75 |
4.2×10⁻⁹ |
| BCAS2 | 1.57 |
1.7×10⁻¹² |
ATP6V1G1 | 1.49 |
8.2×10⁻⁹ | CDS1 | 0.67 |
4.2×10⁻⁹ |
| IFITM2 | 1.55 |
2.0×10⁻¹² | GNL3L | 0.64 |
9.4×10⁻⁹ | PRPF40A | 0.74 |
4.7×10⁻⁹ |
| PLEKHB2 | 0.70 |
2.2×10⁻¹² | PCDH17 | 0.79 |
9.6×10⁻⁹ | DAB2IP | 0.74 |
4.8×10⁻⁹ |
| TAOK1 | 0.55 |
2.2×10⁻¹² | NAB1 | 1.32 |
9.7×10⁻⁹ | GNL3L | 0.65 |
5.2×10⁻⁹ |
| IFNB1 | 3.43 |
2.4×10⁻¹² | RPL7 | 1.49 |
9.9×10⁻⁹ |
PPARGC1B | 0.80 |
5.3×10⁻⁹ |
| RHOQ | 0.53 |
2.8×10⁻¹² | HMGN3 | 1.29 |
1.0×10⁻⁸ | SNRPD3 | 0.64 |
5.3×10⁻⁹ |
| RAD23A | 1.42 |
4.4×10⁻¹² | MED9 | 1.32 |
1.1×10⁻⁸ | NFXL1 | 1.33 |
5.3×10⁻⁹ |
| TAF1D | 1.77 |
5.2×10⁻¹² | GMCL1 | 0.66 |
1.1×10⁻⁸ | UTRN | 1.31 |
5.6×10⁻⁹ |
| RIOK3 | 1.36 |
5.4×10⁻¹² | VRK3 | 0.72 |
1.1×10⁻⁸ | ZNF326 | 0.65 |
5.6×10⁻⁹ |
| NUCB2 | 1.53 |
7.3×10⁻¹² | KCNMB4 | 1.31 |
1.2×10⁻⁸ | RAB9B | 0.76 |
6.0×10⁻⁹ |
|
TGFBRAP1 | 0.63 |
7.4×10⁻¹² | EIF2AK2 | 0.65 |
1.2×10⁻⁸ | DZIP1 | 0.70 |
6.0×10⁻⁹ |
| INTS8 | 1.39 |
8.9×10⁻¹² | MEA1 | 1.23 |
1.3×10⁻⁸ | DLST | 0.69 |
6.1×10⁻⁹ |
|
HNRNPCL1 | 1.79 |
1.1×10⁻¹¹ | RAB3B | 0.82 |
1.6×10⁻⁸ | TSEN15 | 1.22 |
6.5×10⁻⁹ |
Results
Immunohistochemical analysis of
atheromatous plaque and plaque-free intima
We performed immunohistochemical staining for SMA,
CD68 and CD45 (markers for smooth muscle cells, macrophages and
lymphocytes, respectively) in specimens of the human aorta
containing atheromatous plaque lesions or plaque-free intima.
Atheromatous plaque lesions appeared positive for SMA and CD68, but
negative for CD45. Higher-magnification images revealed that
infiltrated foamy macrophages were abundant, whereas lymphocytes
were rare in atheromatous plaque. Plaque-free intima was positive
for SMA, but negative for CD68 and CD45 (data not shown).
Genome-wide analysis of DNA methylation
in atheromatous plaque and corresponding plaque-free intima
The extent of DNA methylation was significantly
(P<1.03×10⁻⁷) reduced at 15 CpG sites in 14 genes and
significantly increased at 30 CpG sites in 22 genes (with three
genes being present in both groups) in atheromatous plaque compared
with matched plaque-free intima (Table I). We examined the potential
relation of these 33 genes to atherosclerosis, cardiovascular
disease, coronary heart disease, or vascular inflammation by
searching the PubMed (NCBI) database. Three of the hypomethylated
genes (HECA, EBF1 and NOD2) and three of the
hypermethylated genes (MAP4K4, ZEB1 and FYN)
have previously been implicated in atherosclerosis or
cardiovascular disease (10–15).
Effects of the overexpression of
hypomethylated genes or of the attenuated expression of
hypermethylated genes on genome-wide gene expression
Hypomethylation or hypermethylation of CpG sites is
associated with the up- or downregulation of gene transcription,
respectively (3). We therefore
examined the effects of overexpression of HECA, EBF1
or NOD2 or of the shRNA-mediated suppression of
MAP4K4, ZEB1 or FYN expression on genome-wide
gene expression in cultured HEK293 cells with the use of a gene
expression microarray.
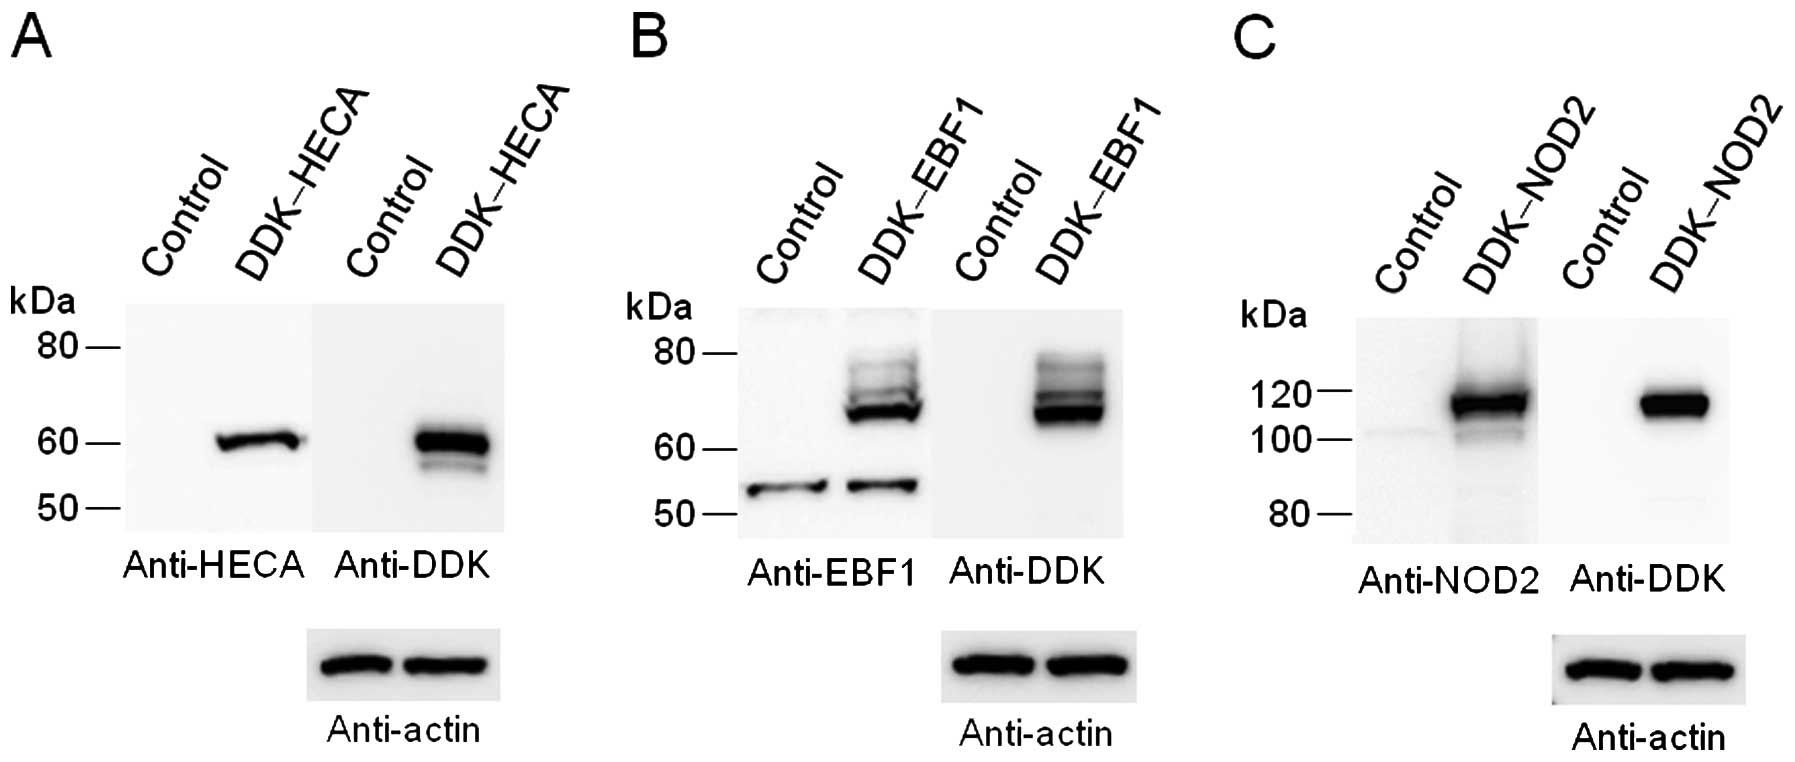
Immunoblot analysis revealed that the abundance of
HECA, EBF1 or NOD2 was markedly increased following the
transfection of the HEK293 cells with an expression vector for the
corresponding human protein (Fig.
1). The overexpression of HECA, EBF1, or NOD2 resulted in a
significant (P<4.80×10⁻⁷) change in the abundance of
the 769, 980 or 118 transcripts, respectively. We examined these
transcripts with the UniGene database (NCBI) and selected 50
corresponding validated or putative protein-coding genes with the
lowest P-values for each overexpressed protein (Table II).
The overexpression of HECA significantly altered the
expression of genes, including those related to cell proliferation
and differentiation [cell division cycle 25C (CDC25C),
cyclin C (CCNC) and p21 protein (Cdc42/Rac)-activated kinase
1 (PAK1)], adenosine 3′,5′-monophosphate (cAMP) signaling
[CREB binding protein (CREBBP)], Na+ and
K+ transport [ATPase, Na+/K+
transporting, alpha 3 polypeptide (ATP1A3)], and
cyclin-dependent kinase inhibitor 2A (CDKN2A) regulation
[CDKN2A interacting protein (CDKN2AIP)]. The overexpression
of EBF1 significantly affected the expression of genes, including
those related to lipid metabolism [phospholipase A2, group IVC
(PLA2G4C) and ATP citrate lyase (ACLY)], cell cycle
regulation [forkhead box Q1 (FOXQ1), cyclin E1
(CCNE1) and PAK1], cell adhesion [cadherin 1, type 1,
(CDH1)], and inflammatory response CCAAT/enhancer binding
protein (C/EBP), delta (CEBPD). The overexpression of NOD2
significantly altered the expression of genes, including those
related to inflammatory response [interleukin-8 (IL-8)],
cell-cell or cell-matrix interaction [lectin, galactoside-binding,
soluble, 1 (LGALS1)], cell division and growth [CCNE1
and glypican 3 (GPC3)], and Ca2+-channel
regulation [calcium channel, voltage-dependent, alpha 2/delta
subunit 3 (CACNA2D3)] (Table
II).
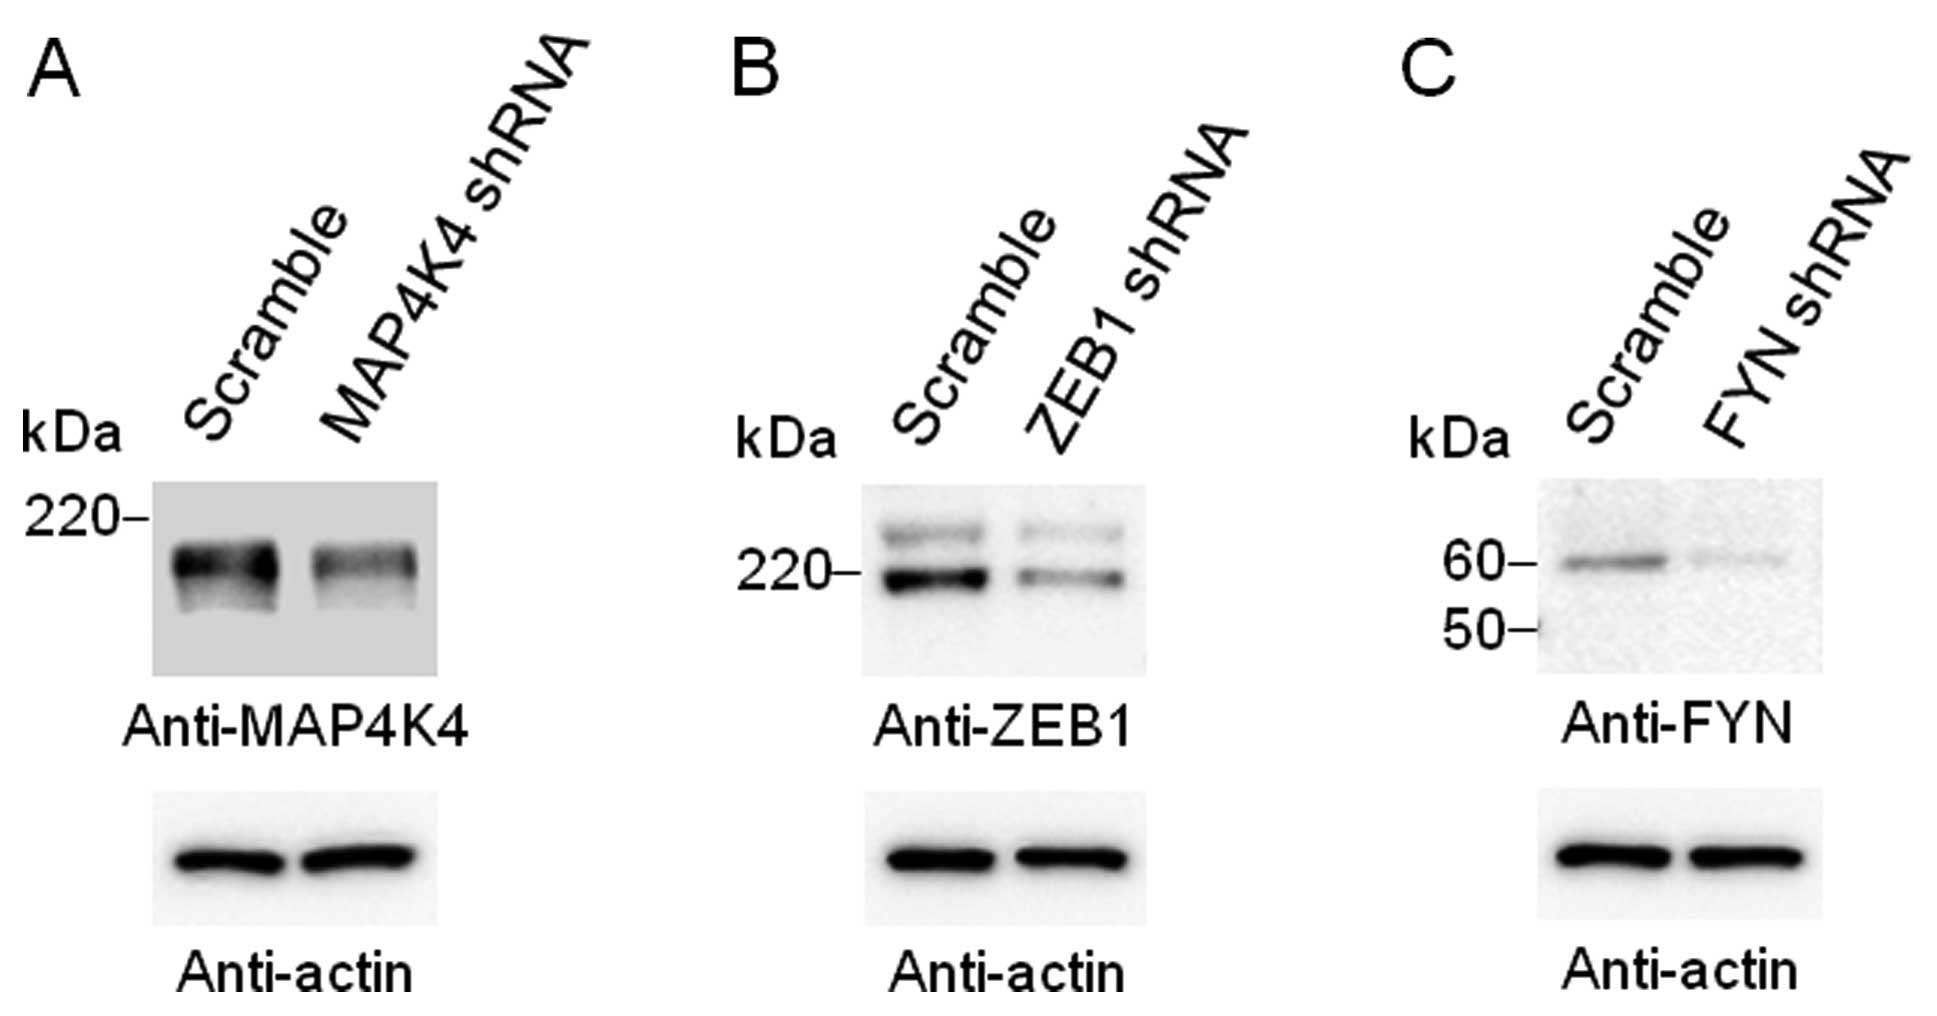
The abundance of MAP4K4, ZEB1 or FYN was markedly
reduced following transfection of the HEK293 cells with an
expression vector for a corresponding shRNA (Fig. 2). The depletion of MAP4K4, ZEB1 or
FYN resulted in significant (P<4.80×10⁻⁷) changes in
the abundance of the 1485, 404 or 411 transcripts, respectively. We
examined these transcripts with the NCBI database and selected 50
corresponding validated or putative protein-coding genes with the
lowest P-values for each depleted protein (Table III).
The depletion of MAP4K4 markedly altered the
expression of genes, including those related to chemokines
[chemokine (C-C motif) ligand 5 (CCL5) and chemokine (C-X-C
motif) ligand 10 (CXCL10)], interferons [interferon
regulatory factor 7 (IRF7), interferon, lambda 1
(IFNL1) and interferon, beta 1, fibroblast (IFNB1)],
signal transduction [TGF-beta activated kinase 1/MAP3K7 binding
protein 2 (TAB2), NF-kappa B activating protein
(NKAP) and ras homolog family member Q (RHOQ)],
leukocyte adhesion [activated leukocyte cell adhesion molecule
(ALCAM)], tumor necrosis factor (TNF) release from
endothelial cells [nucleobindin 2 (NUCB2)], and transforming
growth factor-β1 (TGF-β1) activity [transforming growth factor,
beta receptor associated protein 1 (TGFBRAP1)]. The
depletion of ZEB1 significantly affected the expression of genes,
including those related to cell cycle regulation [cyclin Y
(CCNY) and cyclin I (CCNI)], TGF-β1 activity
(TGFBRAP1), TNF release from endothelial cells
(NUCB2), cell adhesion [integrin, alpha V (ITGAV)],
and K+-channel regulation [potassium large conductance
calcium-activated channel, subfamily M, beta member 4
(KCNMB4)]. The depletion of FYN significantly altered the
expression of genes, including those related to cell cycle
regulation [CCNY and cyclin-dependent kinase 11B
(CDK11B)], signal transduction [TAB2, RHOQ,
NKAP, dual specificity phosphatase 8 (DUSP8) and
CDP-diacylglycerol synthase (phosphatidate cytidylyltransferase) 1
(CDS1)], energy metabolism [stearoyl-CoA desaturase 5
(SCD5)], TGF-β1 activity (TGFBRAP1), and peroxisome
proliferator-activated receptor γ (PPARγ) activity [peroxisome
proliferator-activated receptor gamma, coactivator 1 beta
(PPARGC1B)] (Table
III).
Discussion
In this study, we demonstrate that HECA,
EBF1 and NOD2 are significantly hypomethylated,
whereas MAP4K4, ZEB1 and FYN are significantly
hypermethylated, in genomic DNA isolated from atheromatous plaque
compared with that from matched plaque-free intima. We demonstrate
that the overexpression of HECA, EBF1 or NOD2 or the depletion of
MAP4K4, ZEB1 or FYN in cultured HEK293 cells results in significant
changes in the expression of various atherosclerosis-related
genes.
HECA
Evidence has suggested that HECA plays an important
role in human carcinogenesis (16). HECA has also previously been found
to be related to coronary heart disease, with HECA expression being
increased in the atherosclerotic aortic wall (10). In this study, we demonstrated that
HECA was significantly hypomethylated in atheromatous plaque
and that the overexpression of HECA in HEK293 cells resulted in the
increased expression of genes related to cell proliferation
(CDC25C, CCNC and PAK1), a process important
in the development of atherosclerosis in the arterial intima. The
overexpression of HECA also increased the expression of a gene
related to cAMP signaling (CREBBP), which may play an
important role in the pathogenesis of atherosclerosis (17). In addition, the overexpression of
HECA increased the expression of a gene related to CDKN2A
regulation (CDKN2AIP). Given that CDKN2A is a
susceptibility locus for coronary heart disease and myocardial
infarction (18), the increased
expression of CDKN2AIP may be related to these
conditions.
EBF1
EBF1 is an important determinant of early B
lymphopoiesis and as such contributes to hematopoiesis and immunity
(19). Analysis of knockout mice
has also identified a role for EBF1 in lipid metabolism and
phenotypes related to cardiovascular disease. EBF1-deficient mice
manifest lipodystrophy characterized by a marked decrease in the
amount of white adipose tissue, as well as an increase in yellow
adipose tissue in bone marrow compared with wild-type controls
(20), consistent with the notion
that EBF1 participates in terminal adipocyte differentiation and
the initiation of adipocyte development (21). The expression of EBF1 has
previously been found to be increased in visceral fat and the
atherosclerotic aortic wall (10), and polymorphisms of EBF1
have been shown to be related both to the plasma concentration of
low density lipoprotein-cholesterol and to coronary atherosclerosis
(11). In this study, we
demonstrated that EBF1 was significantly hypomethylated in
atheromatous plaque and that the overexpression of EBF1 in HEK293
cells resulted in the increased expression of genes related to cell
proliferation (FOXQ1, CCNE1 and PAK1), to
inflammatory response (CEBPD), and to cell adhesion
(CDH1).
NOD2
NOD1 and NOD2 regulate the activation of nuclear
factor of κ light polypeptide gene enhancer in B cells 1 (NFKB1) in
human fibroblast and aortic endothelial cell lines in response to
infection with Chlamydophila pneumoniae, one of the most
common bacterial species detected in atherosclerotic plaques
(22). NOD2 senses bacterial
molecules and activates NFKB1-dependent gene expression through the
RIP2-IKK pathway (23,24). The NFKB1 pathway contributes to
the upregulation of the expression of pro-inflammatory molecules,
resulting in amplification of inflammation and stimulation of both
adaptive and innate immune responses (24). NOD2 may thus be a key regulator of
vascular inflammation and the development of atherosclerosis
(25). Genetic variants of
NOD2 have been related to coronary heart disease (12). In this study, we showed that
NOD2 was significantly hypomethylated in atheromatous plaque
and that the overexpression of NOD2 in HEK293 cells resulted in the
increased expression of genes related to inflammatory response
(IL-8), to cell-cell or cell-matrix interaction
(LGALS1), and to cell division and growth (CCNE1 and
GPC3).
MAP4K4
MAP4K4 is a member of the serine-threonine protein
kinase family and specifically activates signaling by MAPK8 (also
known as JNK1). MAP4K4 may function through the
MAP3K7-MAP2K4-MAP2K7 kinase cascade and mediates signaling
triggered by TNF (NCBI). A polymorphism of MAP4K4 has been
related to carotid artery intima-media thickness for women
receiving hormone replacement therapy (13). In this study, we demonstrated that
MAP4K4 was significantly hypermethylated in atheromatous
plaque and that the shRNA-mediated depletion of MAP4K4 in HEK293
cells resulted both in the increased expression of genes related to
chemokines (CCL5 and CXCL10), interferons
(IRF7, IFNL1 and IFNB1), leukocyte adhesion
(ALCAM), TNF release from endothelial cells (NUCB2),
and the activation of NFKB1 signaling (TAB2 and
NKAP), all of which are also related to vascular
inflammation, as well as in the attenuation of the expression of a
gene related to TGF-β1 activity (TGFBRAP1).
ZEB1
ZEB1 is a zinc finger transcription factor expressed
in various cell types, including vascular smooth muscle cells
(26). Silencing of ZEB1
by RNA interference increased expression of inflammatory genes such
as that for prostaglandin-endoperoxide synthase 2 in vascular
smooth muscle cells (14),
suggesting that ZEB1 negatively regulates the expression of such
genes. In this study, we showed that ZEB1 was significantly
hypermethylated in atheromatous plaque and that the depletion of
ZEB1 in HEK293 cells resulted both in the increased expression of
genes related to TNF release from endothelial cells (NUCB2)
and cell adhesion (ITGAV), as well as in the reduced
expression of a gene related to TGF-β1 activity
(TGFBRAP1).
FYN oncogene related to SRC, FGR, YES
(FYN)
FYN is a member of a family of protein tyrosine
kinases that also serve as oncoproteins. It is a
membrane-associated protein and has been implicated in the control
of cell proliferation. It associates with the p85 subunit of
phosphatidylinositol 3-kinase and with FYN binding protein (NCBI
database), and has been shown to play a role in the activation of
platelets (15). The expression
of FYN has previously been found to be decreased in the
atherosclerotic aortic wall (10). In this study, we demonstrated that
FYN was significantly hypermethylated in atheromatous plaque and
that the depletion of FYN in HEK293 cells resulted in the increased
expression of genes related to NFKB1 signaling (TAB2 and
NKAP) and in the reduced expression of genes related to
TGF-β1 (TGFBRAP1) or PPARγ (PPARGC1B) activity.
Although our microarray-based analysis of
genome-wide gene expression revealed significant alterations in the
expression of diverse genes in response to the overexpression of
HECA, EBF1 or NOD2 or to the suppression of
the expression of MAP4K4, ZEB1 or FYN, our
results suggest that the up- or downregulation of genes related to
vascular inflammation or atherogenesis is prominent among such
alterations.
Given that epigenetic modification has been shown to
be tissue-specific, heterogeneity in DNA methylation levels has
been observed among different cell and tissue types (27,28). The aortic intima comprises
heterogeneous cell types. The plaque-free intima thus contains
endothelial cells, smooth muscle cells, fibroblasts, and
monocytes-macrophages, whereas the intima of atheromatous plaque
contains these cell types as well as foam cells. Given that it is
difficult to isolate individual cell types, such as foam cells from
atheromatous plaque, we analyzed the DNA methylation patterns of
genomic DNA samples extracted from atheromatous plaque and
plaque-free intima. Given that interindividual variation in DNA
methylation has also been detected for the same type of cell from
the same type of tissue of unrelated individuals (28,29), we performed intraindividual paired
comparisons between atheromatous plaque and corresponding
plaque-free tissue to avoid the effects of such variation.
There were several limitations to the present study:
i) the aortic intima samples comprised heterogeneous cell types.
ii) Given the small sample size of the study, the statistical power
of the genome-wide analysis of DNA methylation was not optimal.
iii) The molecular mechanisms underlying the effects of DNA
methylation identified in the present study on the development of
atherosclerosis have not been determined definitively. iv)
Validation of our findings will require their replication with
other independent subject panels or ethnic groups.
In conclusion, our present results suggest that
HECA, EBF1 and NOD2 are significantly
hypomethylated, whereas MAP4K4, ZEB1 and FYN
are hypermethylated, in atheromatous plaque lesions compared with
plaque-free intima. The overexpression of these hypomethylated
genes or the silencing of the hypermethylated genes in cultured
cells resulted in significant changes in the expression of various
atherosclerosis-related genes. Our findings thus suggest that
epigenetic mechanisms may contribute to the pathogenesis of
atherosclerosis.
Acknowledgements
This study was supported by a Grant-in-Aid for
Scientific Research from the Ministry of Education, Culture,
Sports, Science and Technology of Japan (no. 24590746 to Y.Y.)
References
|
1
|
Tsai PC, Spector TD and Bell JT: Using
epigenome-wide association scans of DNA methylation in age-related
complex human traits. Epigenomics. 4:511–526. 2012. View Article : Google Scholar : PubMed/NCBI
|
|
2
|
Rakyan VK, Down TA, Balding DJ and Beck S:
Epigenome-wide association studies for common human diseases. Nat
Rev Genet. 12:529–541. 2011. View
Article : Google Scholar : PubMed/NCBI
|
|
3
|
Handy DE, Castro R and Loscalzo J:
Epigenetic modifications: basic mechanisms and role in
cardiovascular disease. Circulation. 123:2145–2156. 2011.
View Article : Google Scholar : PubMed/NCBI
|
|
4
|
Turunen MP, Aavik E and Ylä-Herttuala S:
Epigenetics and atherosclerosis. Biochim Biophys Acta.
1790:886–891. 2009. View Article : Google Scholar : PubMed/NCBI
|
|
5
|
Talens RP, Jukema JW, Trompet S, et al:
Hypermethylation at loci sensitive to the prenatal environment is
associated with increased incidence of myocardial infarction. Int J
Epidemiol. 41:106–115. 2012. View Article : Google Scholar : PubMed/NCBI
|
|
6
|
Castillo-Díaz SA, Garay-Sevilla ME,
Hernández-González MA, Solís-Martínez MO and Zaina S: Extensive
demethylation of normally hypermethylated CpG islands occurs in
human atherosclerotic arteries. Int J Mol Med. 26:691–700.
2010.PubMed/NCBI
|
|
7
|
Bibikova M, Barnes B, Tsan C, et al: High
density DNA methylation array with single CpG site resolution.
Genomics. 98:288–295. 2011. View Article : Google Scholar : PubMed/NCBI
|
|
8
|
Sandoval J, Heyn H, Moran S, et al:
Validation of a DNA methylation microarray for 450,000 CpG sites in
the human genome. Epigenetics. 6:692–702. 2011. View Article : Google Scholar : PubMed/NCBI
|
|
9
|
Durocher Y, Perret S and Kamen A:
High-level and high-throughput recombinant protein production by
transient transfection of suspension-growing human 293-EBNA1 cells.
Nucleic Acids Res. 30:E92002. View Article : Google Scholar
|
|
10
|
Hägg S, Skogsberg J, Lundström J, et al:
Multi-organ expression profiling uncovers a gene module in coronary
artery disease involving transendothelial migration of leukocytes
and LIM domain binding 2: the Stockholm Atherosclerosis Gene
Expression (STAGE) study. PLoS Genet. 5:e10007542009.
|
|
11
|
Nolan DK, Sutton B, Haynes C, et al: Fine
mapping of a linkage peak with integration of lipid traits
identifies novel coronary artery disease genes on chromosome 5. BMC
Genet. 13:122012. View Article : Google Scholar : PubMed/NCBI
|
|
12
|
Galluzzo S, Patti G, Dicuonzo G, et al:
Association between NOD2/CARD15 polymorphisms and coronary artery
disease: a case-control study. Hum Immunol. 72:636–640. 2011.
View Article : Google Scholar : PubMed/NCBI
|
|
13
|
Miller VM, Petterson TM, Jeavons EN, et
al: Genetic polymorphisms associated with carotid artery
intima-media thickness and coronary artery calcification in women
of the Kronos Early Estrogen Prevention Study. Physiol Genomics.
45:79–88. 2013. View Article : Google Scholar
|
|
14
|
Reddy MA, Jin W, Villeneuve L, et al:
Pro-inflammatory role of microRNA-200 in vascular smooth muscle
cells from diabetic mice. Arterioscler Thromb Vasc Biol.
32:721–729. 2012. View Article : Google Scholar : PubMed/NCBI
|
|
15
|
Chen K, Li W, Major J, Rahaman SO,
Febbraio M and Silverstein RL: Vav guanine nucleotide exchange
factors link hyperlipidemia and a prothrombotic state. Blood.
117:5744–5750. 2011. View Article : Google Scholar : PubMed/NCBI
|
|
16
|
Dowejko A, Bauer RJ, Müller-Richter UD and
Reichert TE: The human homolog of the Drosophila headcase
protein slows down cell division of head and neck cancer cells.
Carcinogenesis. 30:1678–1685. 2009.PubMed/NCBI
|
|
17
|
Fantidis P: The role of intracellular
3′5′-cyclic adenosine monophosphate (cAMP) in atherosclerosis. Curr
Vasc Pharmacol. 8:464–472. 2010.
|
|
18
|
CARDIoGRAMplusC4D Consortium. Deloukas P,
Kanoni S, Willenborg C, et al: Large-scale association analysis
identifies new risk loci for coronary artery disease. Nat Genet.
45:25–33. 2013. View Article : Google Scholar : PubMed/NCBI
|
|
19
|
Lukin K, Fields S, Hartley J and Hagman J:
Early B cell factor: regulator of B lineage specification and
commitment. Semin Immunol. 20:221–227. 2008. View Article : Google Scholar
|
|
20
|
Fretz JA, Nelson T, Xi Y, Adams DJ, Rosen
CJ and Horowitz MC: Altered metabolism and lipodystrophy in the
early B-cell factor 1-deficient mouse. Endocrinology.
151:1611–1621. 2010. View Article : Google Scholar : PubMed/NCBI
|
|
21
|
Akerblad P, Lind U, Liberg D, Bamberg K
and Sigvardsson M: Early B-cell factor (O/E-1) is a promoter of
adipogenesis and involved in control of genes important for
terminal adipocyte differentiation. Mol Cell Biol. 22:8015–8025.
2002. View Article : Google Scholar : PubMed/NCBI
|
|
22
|
Opitz B, Förster S, Hocke AC, et al:
Nod1-mediated endothelial cell activation by Chlamydophila
pneumoniae. Circ Res. 96:319–326. 2005. View Article : Google Scholar : PubMed/NCBI
|
|
23
|
Girardin SE, Boneca IG, Viala J, et al:
Nod2 is a general sensor of peptidoglycan through muramyl dipeptide
(MDP) detection. J Biol Chem. 278:8869–8872. 2003. View Article : Google Scholar : PubMed/NCBI
|
|
24
|
Inohara N, Koseki T, Lin J, et al: An
induced proximity model for NF-kappa B activation in the Nod1/RICK
and RIP signaling pathways. J Biol Chem. 275:27823–27831.
2000.PubMed/NCBI
|
|
25
|
Collins T and Cybulsky MI: NF-κB: pivotal
mediator or innocent bystander in atherogenesis? J Clin Invest.
107:255–264. 2001.
|
|
26
|
Vandewalle C, Van Roy F and Berx G: The
role of the ZEB family of transcription factors in development and
disease. Cell Mol Life Sci. 66:773–787. 2009. View Article : Google Scholar : PubMed/NCBI
|
|
27
|
Davies MN, Volta M, Pidsley R, et al:
Functional annotation of the human brain methylome identifies
tissue-specific epigenetic variation across brain and blood. Genome
Biol. 13:R432012. View Article : Google Scholar : PubMed/NCBI
|
|
28
|
Christensen BC, Houseman EA, Marsit CJ, et
al: Aging and environmental exposures alter tissue-specific DNA
methylation dependent upon CpG island context. PLoS Genet.
5:e10006022009. View Article : Google Scholar : PubMed/NCBI
|
|
29
|
Bell JT, Pai AA, Pickrell JK, et al: DNA
methylation patterns associate with genetic and gene expression
variation in HapMap cell lines. Genome Biol. 12:R102011. View Article : Google Scholar : PubMed/NCBI
|