Introduction
Non-alcoholic steatohepatitis (NASH) is a
non-alcoholic fatty liver disease (NAFLD), and patients who have a
fatty liver develop inflammation and fibrosis (1). Ten to 20% of NAFLD patients can
progressively develop NASH, liver fibrosis, cirrhosis and
hepatocellular carcinoma (HCC) (1,2).
The natural progression from NAFLD to NASH remains unknown, and the
reason for certain NAFLD patients developing steatohepatitis and
cirrhosis remains to be elucidated. However, Day and James
(3) proposed a ‘two-hit’ model
that suggests a second hit is needed to develop NASH.
Although simple hepatic steatosis is the result of
the accumulation of various lipids (4) and a benign process in the majority
of patients, NASH may reflect different disease entities. Notably,
NASH patients with less steatosis first exhibit inflammation
(2). In addition, inhibition of
hepatic tissue necrotic factor a (TNFα) improves steatosis in
ob/ob mice (5,6), and decreasing the expression of
interleukin-10 (IL-10) derived from Kupffer cells can improve
hepatic steatosis (7). Lipid
accumulation may be caused by a stress response that is induced by
the inflammation of hepatocytes. Tilg and Moschen (1) reported that inflammatory mediators
derived from various tissues, especially from the gut and adipose
tissue, may play a central role in the cascade of inflammation and
fibrosis.
Metformin was introduced into clinical practice as
an oral biguanide drug for the treatment of type 2 diabetes in the
1950s (8). It inhibits glucose
production in the liver and improves hyperglycemia. Findings of
several recent reports showed that metformin has various effects on
non-alcoholic steatohepatitis (9,10).
Metformin prevented and reversed steatosis and inflammation caused
by NASH without affecting peripheral insulin resistance (10). However, the mechanism underlying
this improvement of steatosis, inflammation and fibrosis remains
unknown.
miRNAs are non-coding RNAs that are 20–25
nucleotides in length, and they have been shown to negatively
regulate mRNA expression in animals, plants and viruses (11). In general, miRNAs bind to the
3′-untranslated region of protein coding genes and inhibit gene
expression (12). Findings of
previous studies have identified a critical role for miRNA in human
NASH (13,14) and HCC (15). These data suggest that miRNAs have
the potential use as a therapeutic target for preventing disease
progression and prognosis in NASH patients. However, the miRNA
profiles following metformin treatment in a mouse model of NASH
remain unclear.
In the present study, we analyzed the miRNA
expression pattern to elucidate the mechanism of action and
efficacy of metformin using an experimental non-diabetic model
without affecting peripheral insulin resistance.
Materials and methods
Chemicals
Metformin (metformin hydrochloride) was purchased
from Wako Pure Chemical Industries, Ltd., Tokyo, Japan.
Animal model and experimental design
Eight-week-old male C57BL/6N mice were purchased
from CLEA Japan Inc. Mice were housed for 15 weeks on a 12-h
light/dark cycle, and food and water were accessible ad
libitum. Mice were fed either a methionine- and
choline-deficient (MCD) diet (Oriental Yeast, Tokyo, Japan) or a
normal diet. Mice were divided into three experimental groups and
fed for 15 weeks. Group 1 was given a methionine- and
choline-deficient (MCD) diet (MCD, n=10). Group 2 was fed an MCD
diet with 2.4 mg/day metformin (Wako Pure Chemical Industries) (MCD
+ metformin, 2.4 mg/day, n=10). Group 3 was fed normal chow (NC,
n=7). Group 2 was fed with an MCD diet and treated with 2.4 mg/day
metformin given in the drinking water. The dose of metformin was
calculated at 2.4 mg/mouse/day and corresponds to 4,800 mg/60 kg in
a human. Group 3 was fed a standard diet and received untreated
drinking water ad libitum. The mice were fed for 15 weeks to
recreate the advanced stages of steatohepatitis. After 15 weeks on
each diet, the mice were euthanized and the liver and body weight
were measured. Livers were fixed in 10% formalin or flash frozen in
liquid nitrogen for histological analysis. The samples were stored
at −80°C until further analysis. All animal procedures were
performed in accordance with the guidelines of the Committee on
Experimental Animals of Kagawa University, Kagawa, Japan.
Blood sampling and analysis
Blood samples were obtained from the right
ventricle, and the levels of AST, ALT and ALP were measured by an
autoanalyzer (TBA-200FR NEO; Toshiba Medical Systems Corp., Tokyo,
Japan).
Histological evaluation and
immunohistochemistry
To determine whether metformin decreased MCD-induced
steatosis and fibrosis in the liver, Oil red-O and Azan staining
was performed, respectively. In all the experimental groups,
5-μm sections of formalin-fixed and paraffin-embedded liver
samples were processed for Azan staining. Oil red-O staining was
also performed with all the liver samples to estimate the degree of
hepatic steatosis. Areas of the digital photomicrographs were
quantified with a computerized image analysis system (ImageJ).
Analysis of miRNA microarrays
The total RNA of each liver sample was extracted
using a miRNeasy Mini Kit (Qiagen, Tokyo, Japan) according to the
manufacturer’s instructions. Total RNA was measured using an RNA
6000 Nano kit (Agilent Technologies, Tokyo, Japan). The samples
were labeled using a miRCURY Hy3/Hy5 Power Labeling kit and were
hybridized on a mouse miRNA Oligo chip (v. 17.0; Toray Industries,
Inc., Tokyo, Japan). Scanning was conducted with a 3D-Gene Scanner
3000 (Toray Industries). 3D-Gene extraction version 1.2 software
(Toray Industries) was used to read the raw intensity of the image.
To determine the change in miRNA expression between the
metformin-treated and control samples, the raw data were analyzed
via GeneSpring GX v10.0 (Agilent Technologies). The samples were
first normalized relative to the 28S RNA level and then
baseline-corrected to the median of all the samples.
Replicate data were consolidated into two groups,
including those from metformin-treated animals and those from
control animals. The data were organized using the hierarchical
clustering and analysis of variance (ANOVA) functions in the
GeneSpring software. Hierarchical clustering was completed using
the clustering function (condition tree) and a Euclidean
correlation as a distance metric. A two-way ANOVA and asymptotic
P-value computation without any error correction was performed on
the samples to search for the miRNAs that varied most prominently
across the different groups. The P-value cut-off was set to 0.05.
Only changes >50% for at least one of the time-points within
each sample were considered significant. All the analyzed data were
scaled by global normalization. The statistical significance of
differentially expressed miRNAs was analyzed by the Student’s
t-test. Our microarray data in the present study were submitted as
a complete data set to the NCBI Gene Expression Omnibus (GEO) no.:
GSE55593; control vs. MCD (http:ncbi.nlm.nih.gov/=GSE55593) and no.: GSE55523;
MCD vs. MCD + metformin (http:ncbi.nlm.nih.gov/=GSE55523).
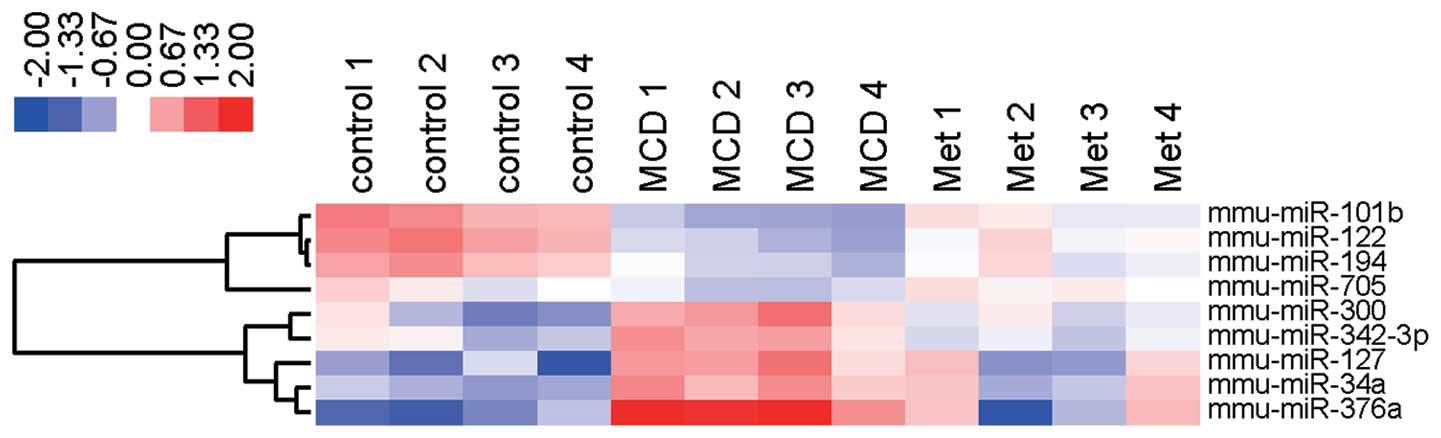
Heatmap
To show alterations in the expression level of nine
miRNAs, we created a heatmap in which each cell represents the
expression level of each miRNA for four individual subjects from
the MCD-fed mice that were treated with and without metformin. The
heatmap was color-coded according to a log 2-transformed expression
level. The center level of the color code was set as the median
value for all the values used to create the heatmap. Thus, white
was considered the mean number; red, an increase and blue, a
decrease in the heat map.
Statistical analysis
Data are shown as the means ± standard deviation
(SD). Statistical significance was defined as P<0.05 for the
unpaired t-test and as P<0.025 for the Bonferroni
corrections.
Results
Metformin attenuates the development of
MCD-induced NASH
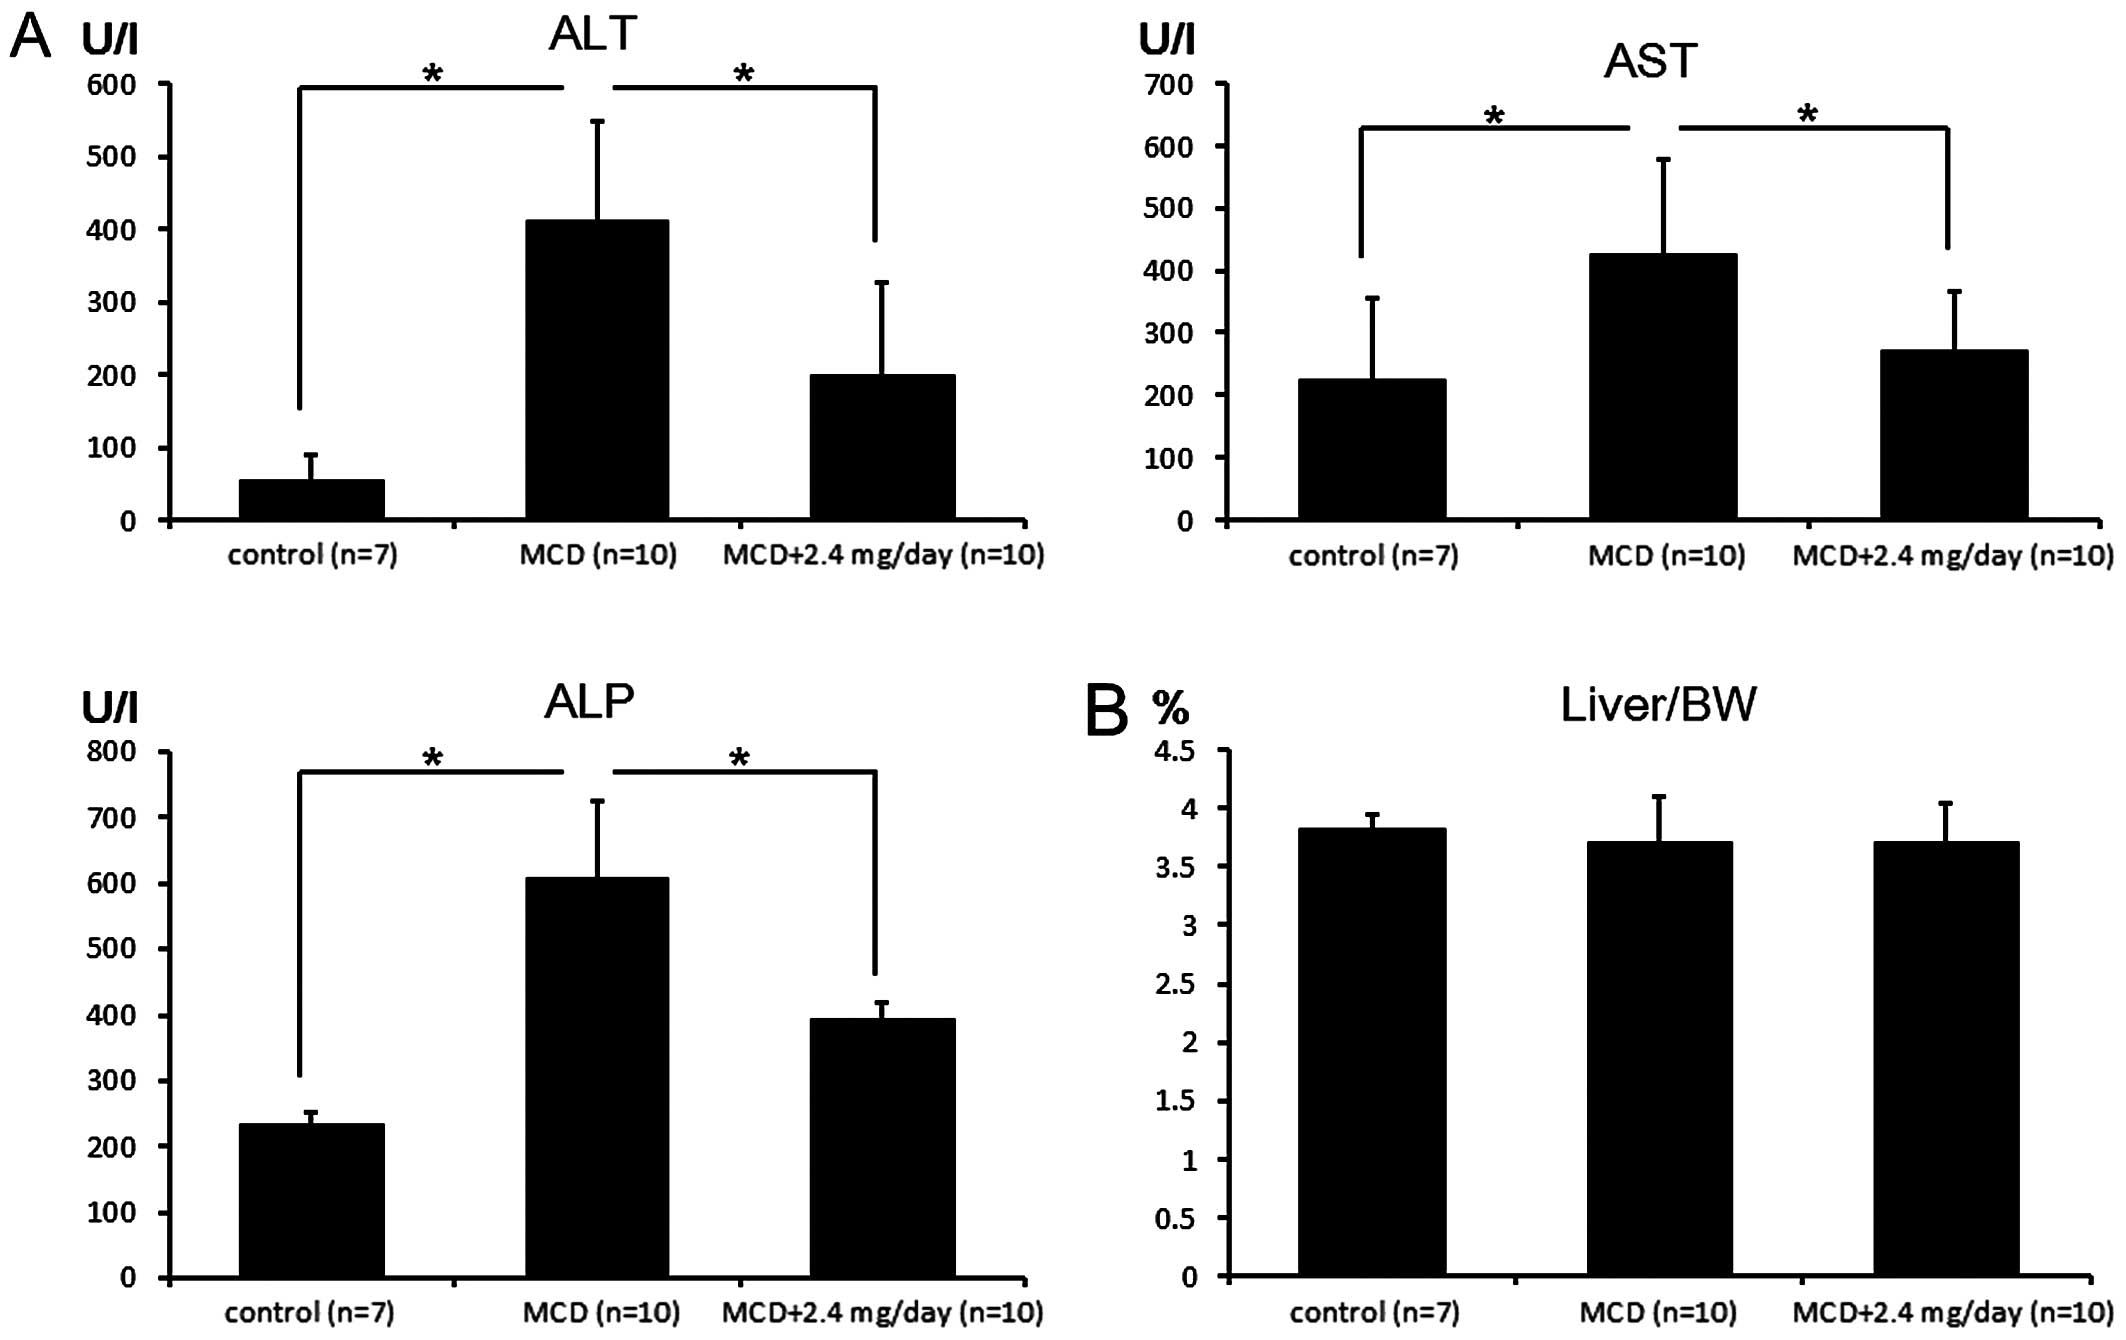
To determine the effect of metformin on the
development of NASH, mice were fed an MCD or normal diet. In
MCD-fed mice, the levels of plasma ALT, AST and ALP were higher
than those for mice fed a normal diet. Treatment of MCD-fed mice
with metformin significantly attenuated this increase (P<0.025;
significant differences were confirmed with a Bonferroni
correction) (Fig. 1A). In the
present study, the liver/body weight ratio was not significantly
different between MCD-fed mice treated with and without metformin
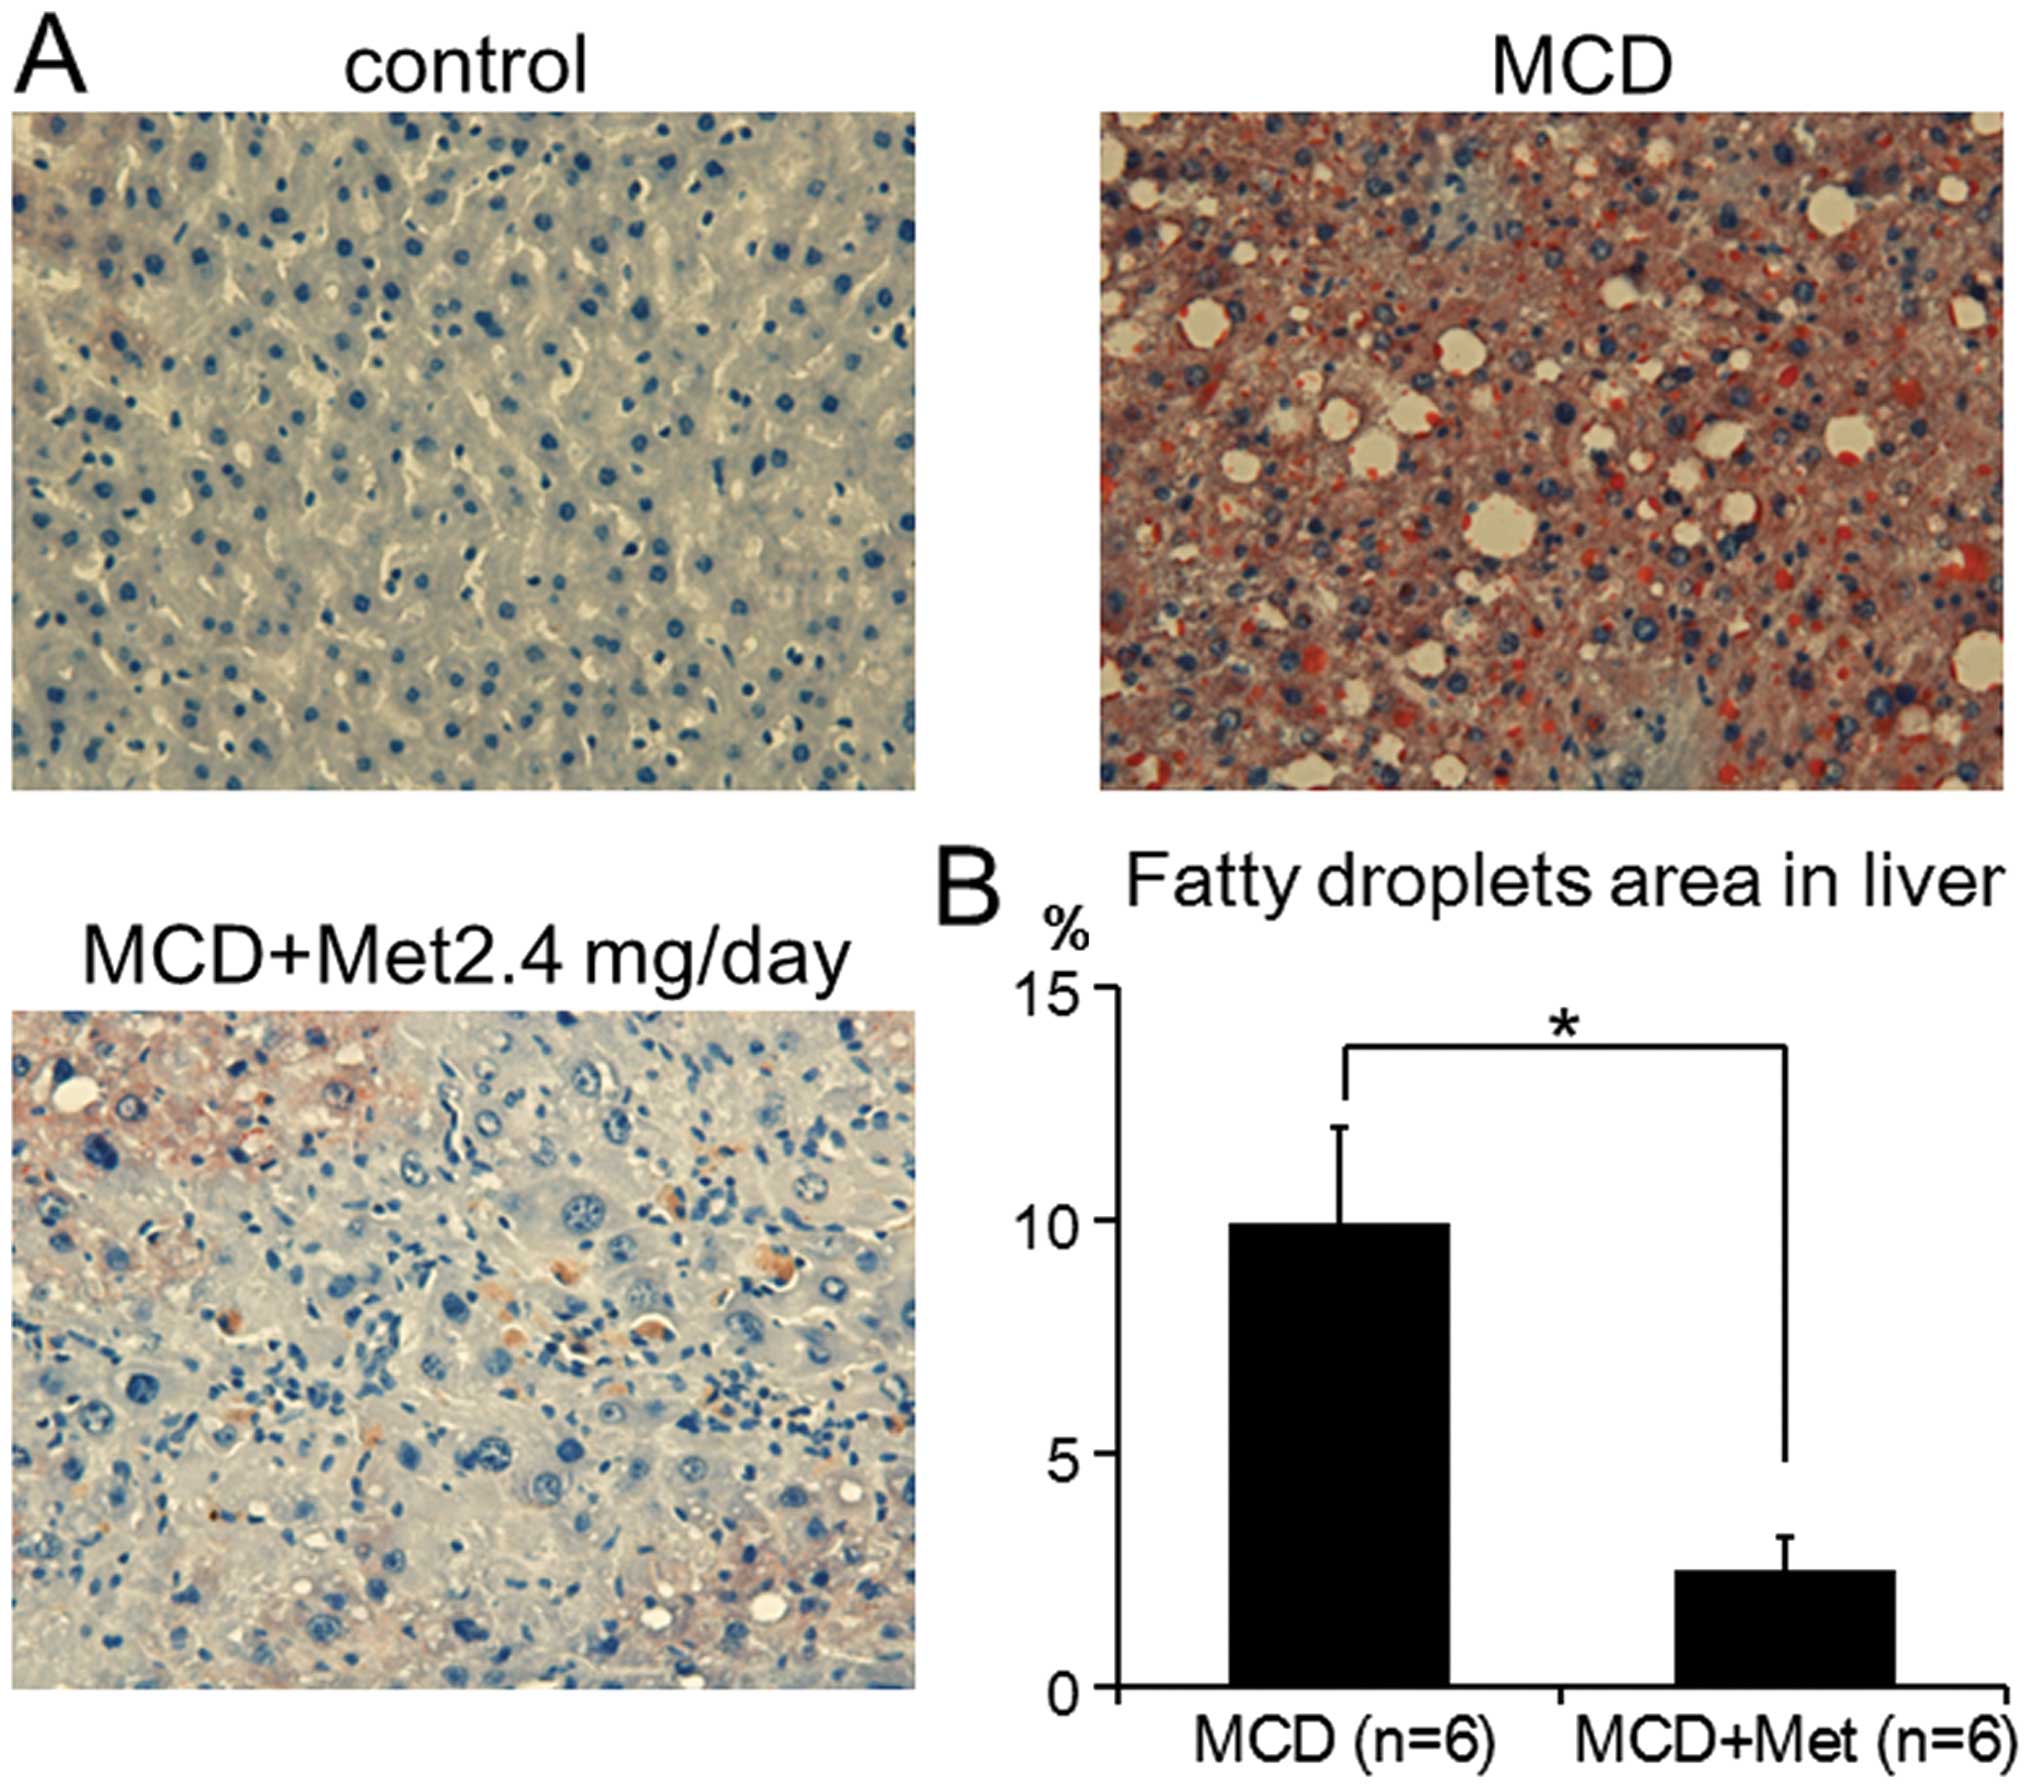
(Fig. 1B). To determine whether
metformin decreased MCD-induced liver steatosis, Oil red-O staining
was completed. Consistent with the results from the plasma ALT, AST
and ALP levels, MCD-fed mice treated with 2.4 mg metformin showed
significantly suppressed development of MCD-induced liver steatosis
by 75% (9.91±2.03 vs. 2.51±0.70%, P<0.001) (Fig. 2). These results suggested that
metformin suppressed the inflammation and steatosis induced by
MCD.
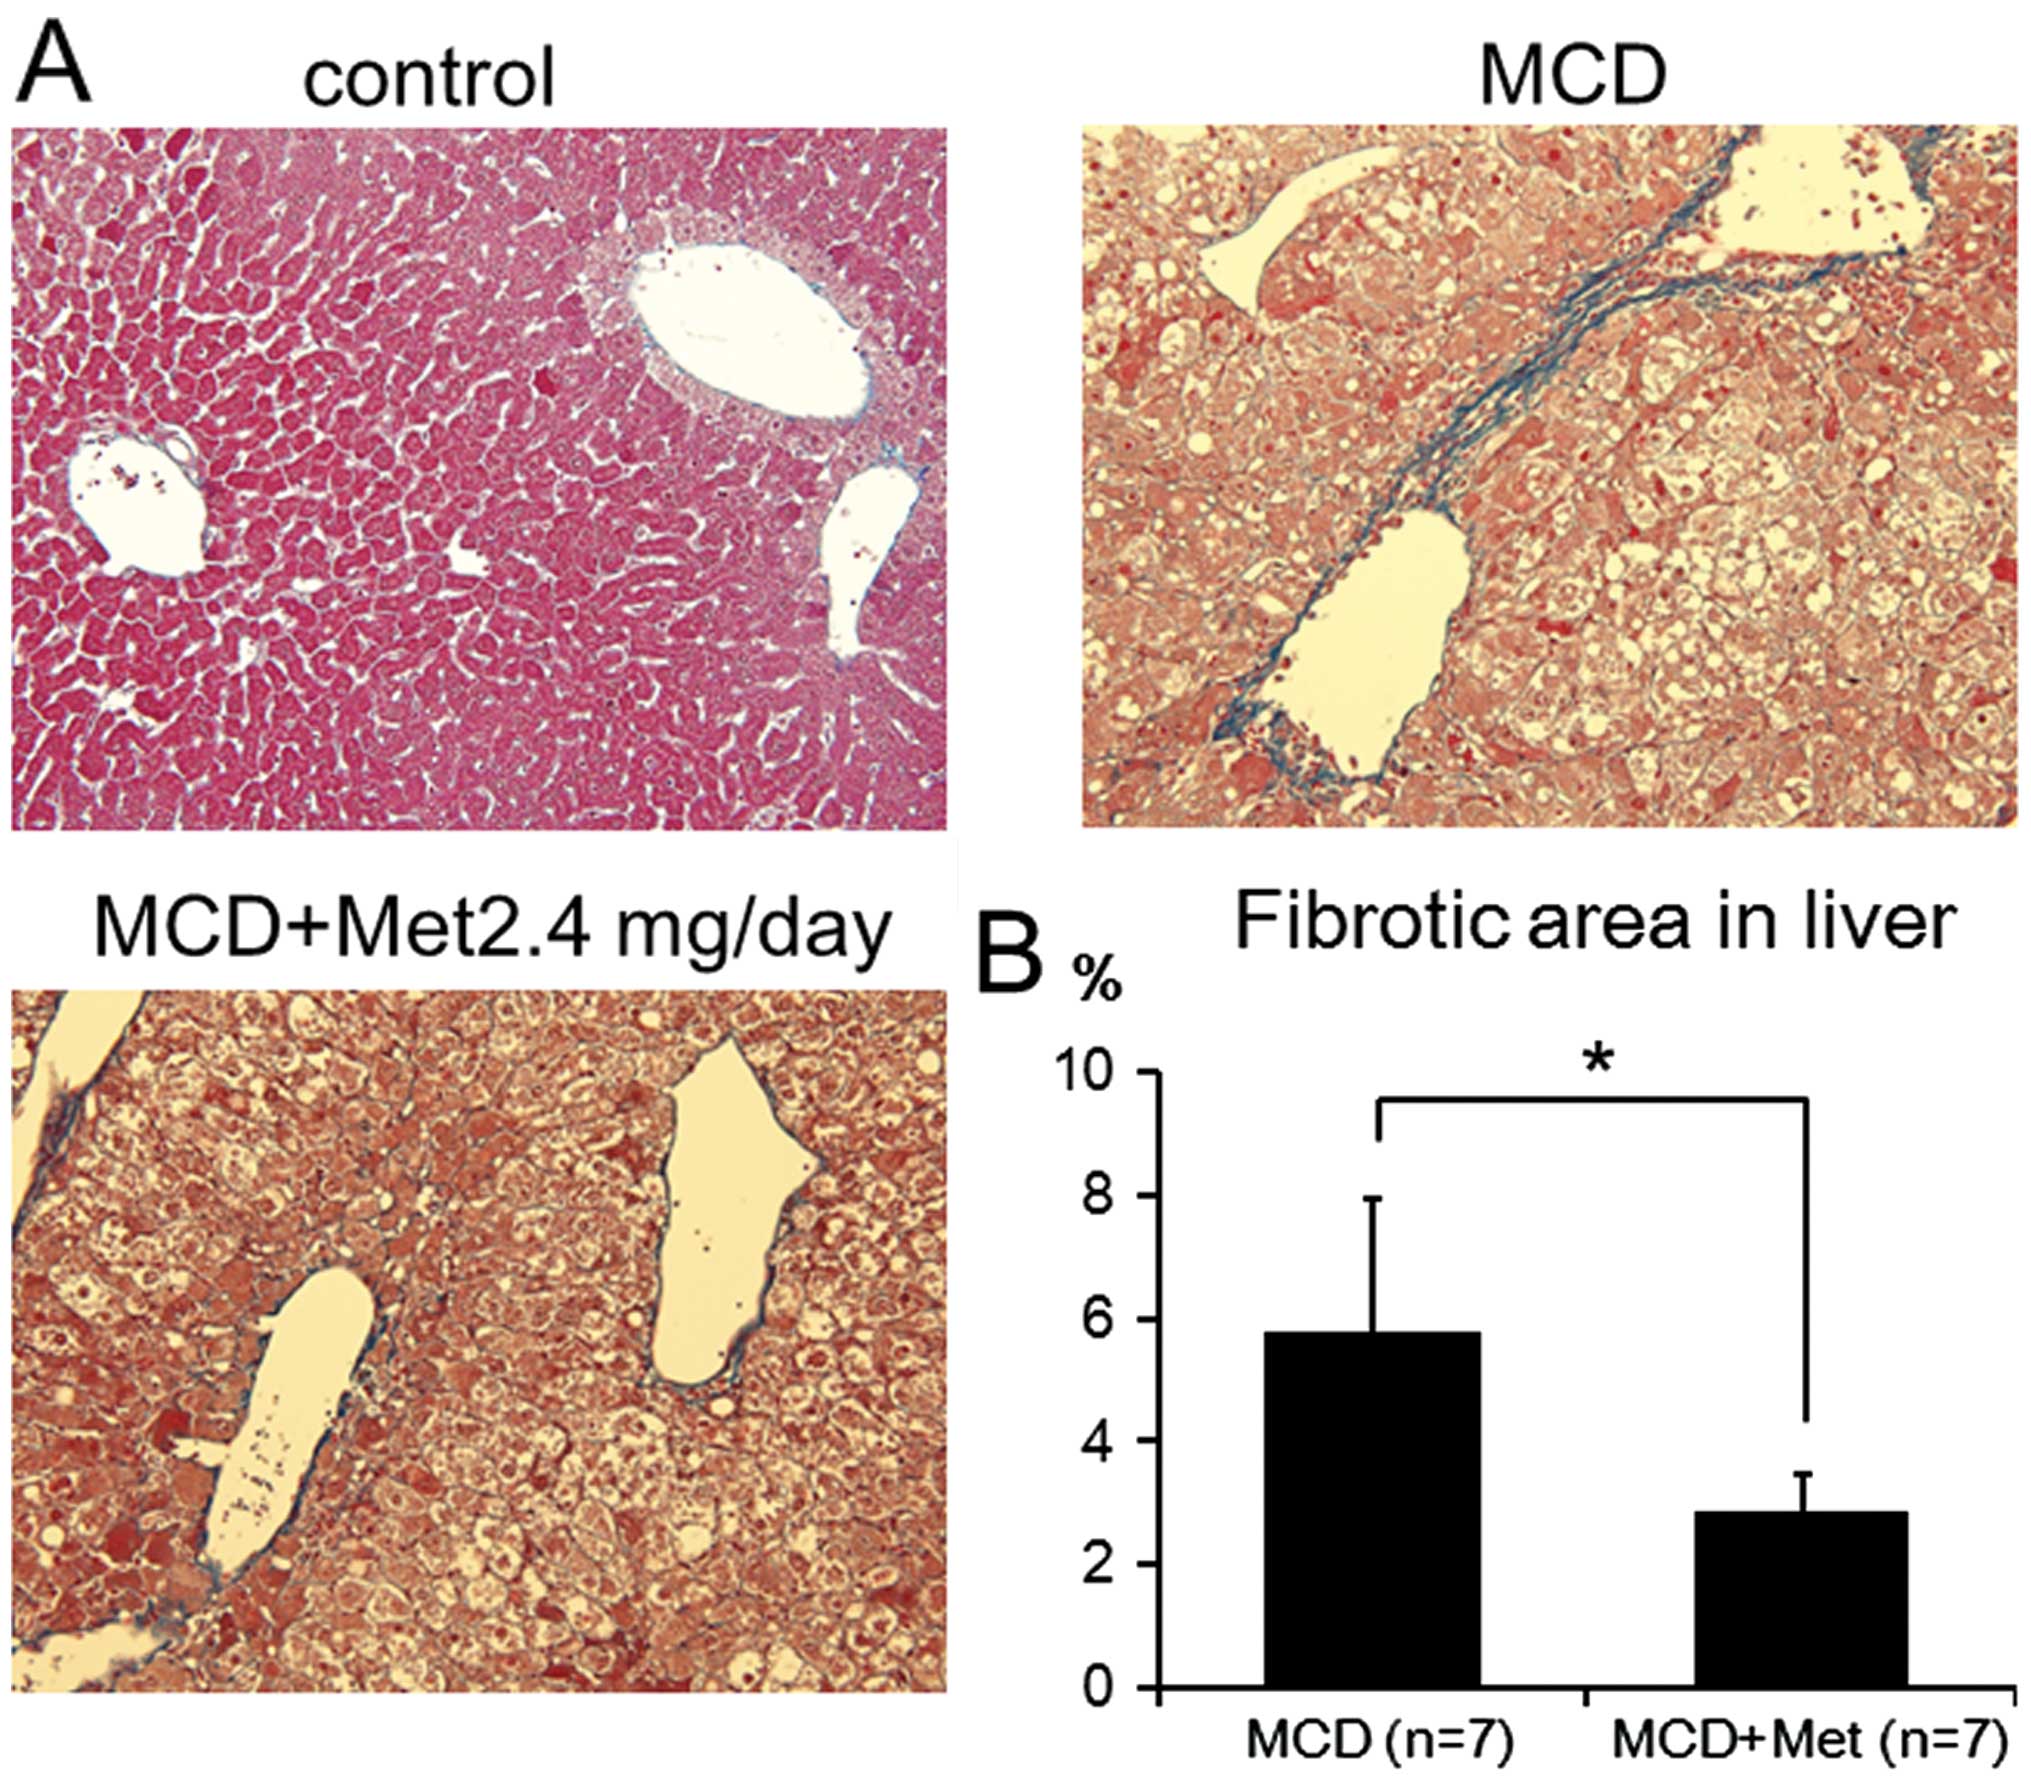
Liver fibrosis is suppressed by
metformin
Histological analysis of the liver was performed to
determine whether the liver fibrosis induced in MCD-fed mice was
inhibited by metformin. Perivenular fibrosis was detected around
the central vein in MCD-fed mice. By contrast, metformin treatment
significantly downregulated the extent of perivenular fibrosis
(Fig. 3).
miRNA expression in the liver tissue of
MCD-fed mice
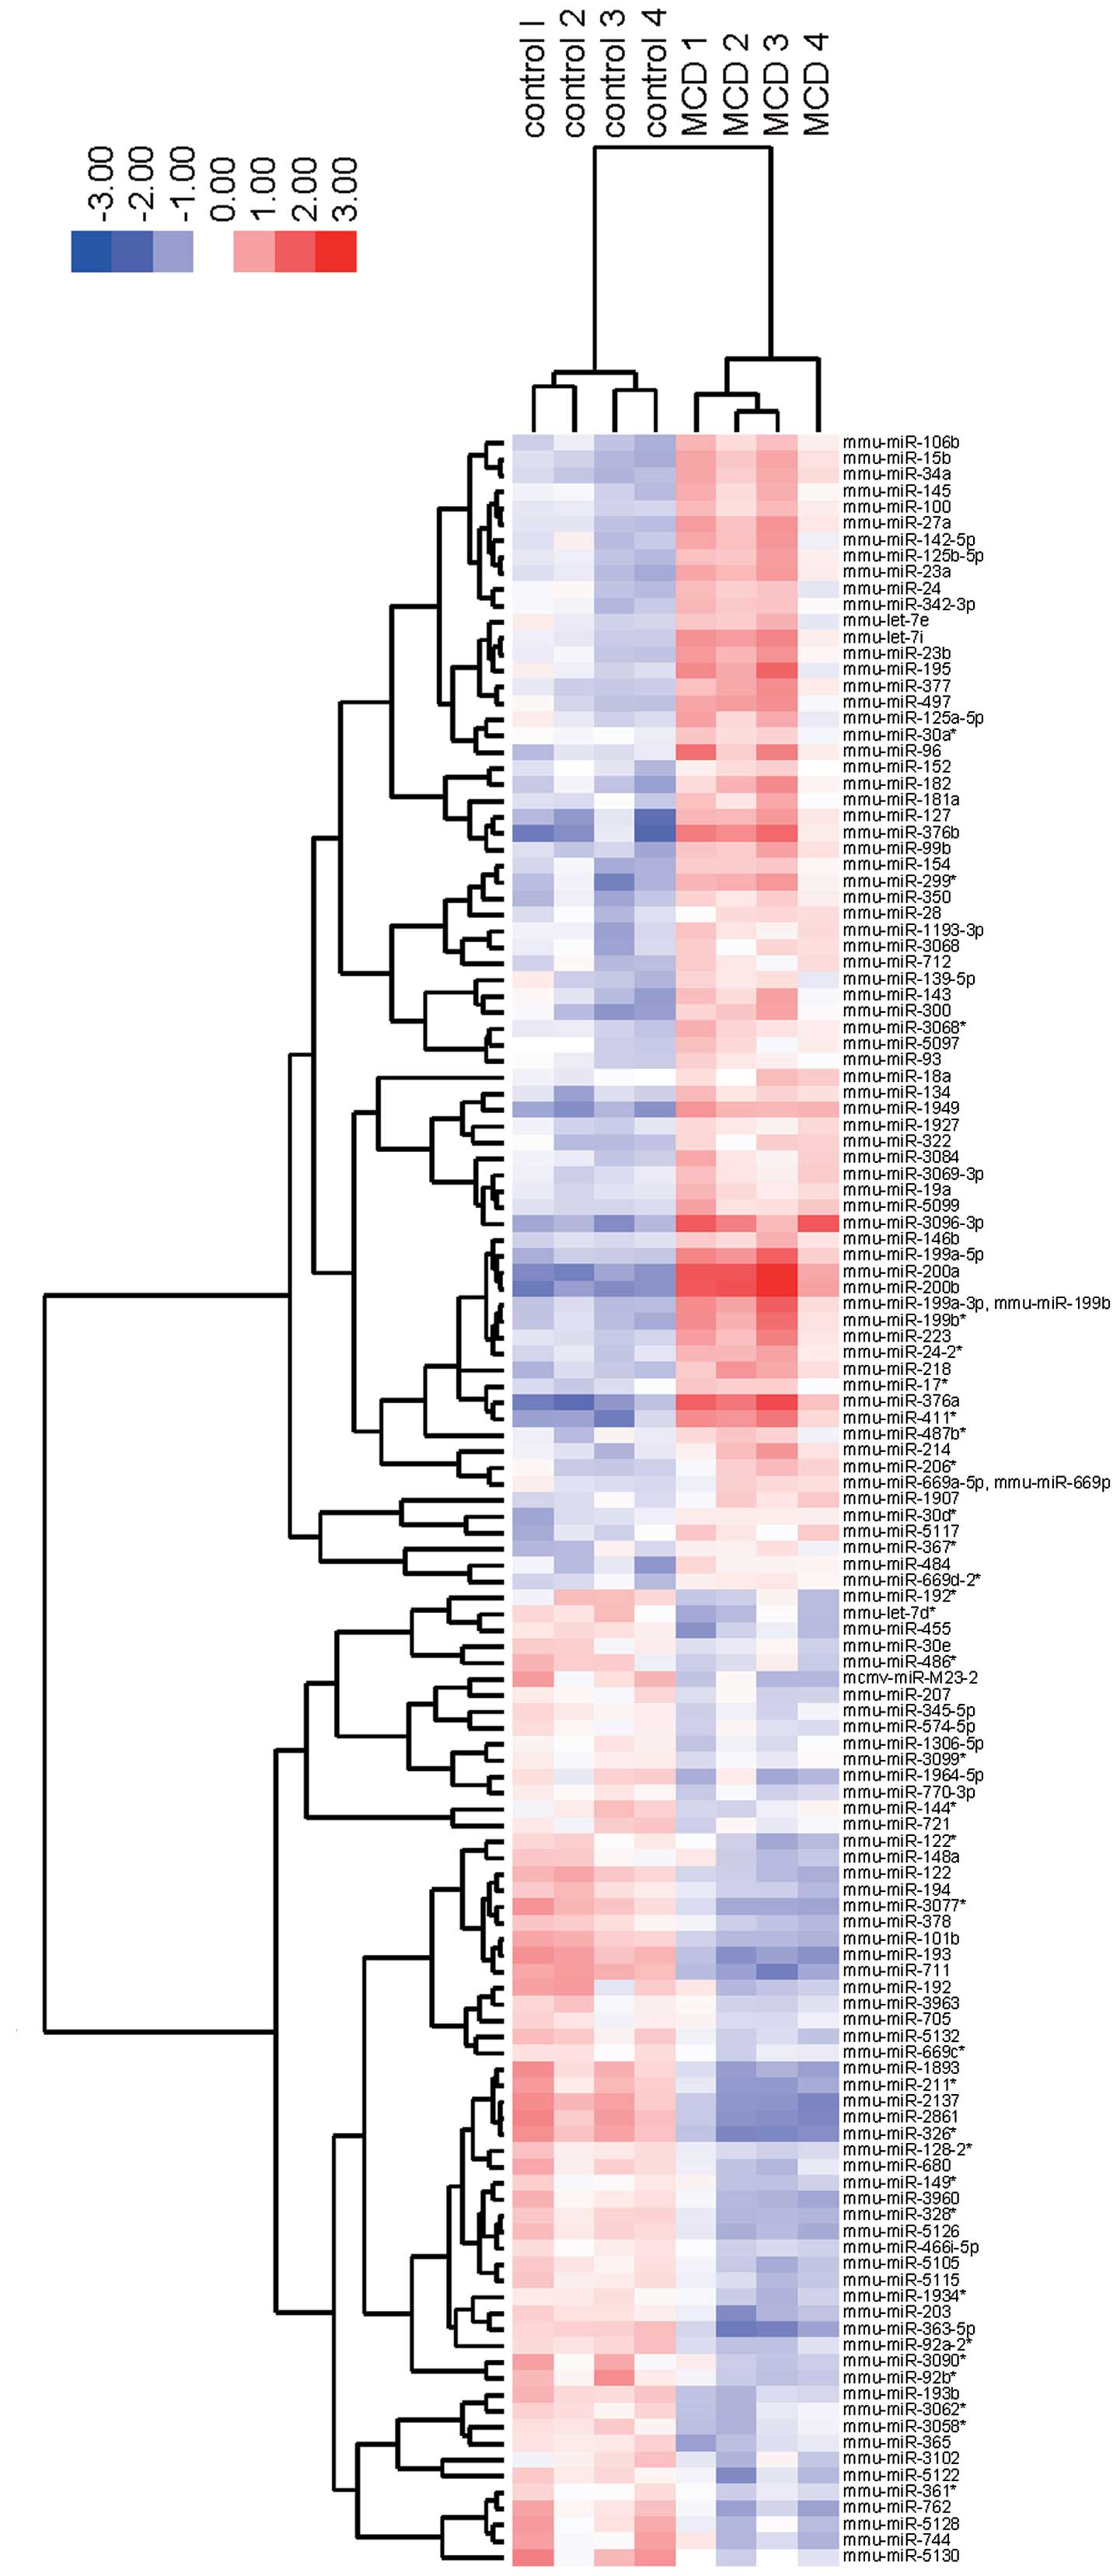
To elucidate the miRNA profiles during the
development of NASH, we analyzed the expression levels of 1,135
mouse miRNA probes using liver tissue from control and MCD-fed
mice. As shown in Table IA, 71
miRNAs were significantly upregulated, and 60 miRNAs were
downregulated in MCD-fed mice. Unsupervised hierarchical clustering
analysis using a Pearson’s correlation showed that MCD-fed mice
clustered separately from the control group (Fig. 4). These subsets of 131 miRNAs
exhibited significant alterations in their expression levels
between the MCD-fed and control mice.
 | Table IStatistical analysis of miRNAs in
liver tissues between MCD-fed mice and control group (P<0.05)
and between MCD-fed mice treated and untreated with metformin
(P<0.05). |
Table I
Statistical analysis of miRNAs in
liver tissues between MCD-fed mice and control group (P<0.05)
and between MCD-fed mice treated and untreated with metformin
(P<0.05).
A, Statistical
analysis of miRNAs in liver tissues between MCD-fed mice and
control group
|
|---|
| Upregulated
microRNA | P-value | Fold (MCD/control)
mean ± SD |
|---|
| mmu-miR-200b | 0.00016 | 10.454±5.110 |
| mmu-miR-200a | 0.00021 | 9.572±3.666 |
|
mmu-miR-376aa | 0.00062 | 8.165±3.935 |
|
mmu-miR-3096-3p | 0.00043 | 5.578±1.768 |
| mmu-miR-376b | 0.00367 | 5.326±1.933 |
| mmu-miR-411* | 0.00126 | 4.670±2.692 |
| mmu-miR-1949 | 0.00003 | 3.677±0.672 |
|
mmu-miR-199a-5p | 0.00152 | 3.646±1.482 |
| mmu-miR-199a-3p,
-199b | 0.00374 | 3.460±1.875 |
| mmu-miR-199b* | 0.00387 | 3.193±1.448 |
| mmu-miR-127a | 0.00488 | 3.042±0.584 |
| mmu-miR-299* | 0.00749 | 2.959±1.861 |
| mmu-miR-96 | 0.02105 | 2.797±1.802 |
| mmu-miR-195 | 0.04001 | 2.536±1.569 |
| mmu-miR-300a | 0.00971 | 2.487±1.277 |
| mmu-let-7i | 0.00635 | 2.478±0.882 |
| mmu-miR-223 | 0.00614 | 2.374±1.042 |
| mmu-miR-218 | 0.00168 | 2.365±0.392 |
| mmu-miR-497 | 0.01038 | 2.347±0.865 |
| mmu-miR-15b | 0.00131 | 2.329±0.517 |
| mmu-miR-23a | 0.00458 | 2.326±0.666 |
| mmu-miR-27a | 0.00415 | 2.304±0.770 |
| mmu-miR-34aa | 0.00054 | 2.300±0.519 |
| mmu-miR-182 | 0.01445 | 2.288±0.883 |
| mmu-miR-377 | 0.00406 | 2.273±0.853 |
| mmu-miR-23b | 0.01032 | 2.187±0.787 |
| mmu-miR-99b | 0.00218 | 2.124±0.326 |
| mmu-miR-142-5p | 0.02372 | 2.077±0.971 |
| mmu-miR-24-2* | 0.00260 | 2.013±0.649 |
| mmu-miR-143 | 0.02913 | 1.999±0.763 |
| mmu-miR-214 | 0.02618 | 1.981±1.168 |
|
mmu-miR-125b-5p | 0.00692 | 1.973±0.646 |
| mmu-miR-106b | 0.00414 | 1.913±0.432 |
| mmu-miR-350 | 0.00433 | 1.877±0.612 |
| mmu-miR-154 | 0.00706 | 1.867±0.504 |
| mmu-miR-134 | 0.00576 | 1.822±0.308 |
| mmu-miR-5099 | 0.00408 | 1.776±0.397 |
| mmu-miR-145 | 0.01834 | 1.766±0.446 |
|
mmu-miR-342-3pa | 0.01310 | 1.726±0.445 |
| mmu-miR-322 | 0.00698 | 1.725±0.393 |
| mmu-miR-206* | 0.01010 | 1.718±0.550 |
| mmu-miR-146b | 0.00117 | 1.713±0.362 |
|
mmu-miR-125a-5p | 0.04886 | 1.681±0.555 |
| mmu-miR-100 | 0.00402 | 1.653±0.355 |
| mmu-miR-5117 | 0.02651 | 1.645±0.628 |
| mmu-miR-3084 | 0.01816 | 1.644±0.322 |
| mmu-miR-3068* | 0.00874 | 1.624±0.221 |
| mmu-miR-3068 | 0.03368 | 1.616±0.607 |
| mmu-miR-24 | 0.04066 | 1.610±0.371 |
| mmu-miR-181a | 0.02427 | 1.610±0.241 |
|
mmu-miR-1193-3p | 0.03269 | 1.600±0.340 |
| mmu-miR-484 | 0.04737 | 1.594±0.474 |
| mmu-miR-712 | 0.01563 | 1.592±0.346 |
| mmu-miR-17* | 0.00911 | 1.589±0.423 |
| mmu-let-7e | 0.04746 | 1.546±0.483 |
| mmu-miR-19a | 0.00447 | 1.517±0.233 |
|
mmu-miR-3069-3p | 0.00558 | 1.511±0.143 |
| mmu-miR-28 | 0.01445 | 1.498±0.392 |
| mmu-miR-487b* | 0.04660 | 1.482±0.540 |
| mmu-miR-139-5p | 0.04861 | 1.473±0.220 |
| mmu-miR-1907 | 0.01444 | 1.456±0.302 |
| mmu-miR-30d* | 0.03344 | 1.443±0.404 |
| mmu-miR-367* | 0.04441 | 1.427±0.318 |
| mmu-miR-1927 | 0.00348 | 1.418±0.067 |
| mmu-miR-152 | 0.03278 | 1.409±0.190 |
| mmu-miR-5097 | 0.04393 | 1.404±0.145 |
|
mmu-miR-669d-2* | 0.01348 | 1.381±0.178 |
| mmu-miR-669a-5p,
-669p | 0.03866 | 1.364±0.338 |
| mmu-miR-93 | 0.02876 | 1.349±0.080 |
| mmu-miR-18a | 0.02997 | 1.340±0.196 |
| mmu-miR-30a* | 0.04034 | 1.273±0.171 |
| Downregulated
microRNA | P-value | Fold (MCD/control)
mean ± SD |
|---|
| mmu-miR-326* | 0.00020 | 0.263±0.038 |
| mmu-miR-2861 | 0.00046 | 0.263±0.046 |
| mmu-miR-2137 | 0.00032 | 0.274±0.029 |
| mmu-miR-193 | 0.00009 | 0.275±0.055 |
| mmu-miR-711 | 0.00007 | 0.289±0.069 |
| mmu-miR-1893 | 0.00221 | 0.371±0.036 |
| mmu-miR-363-5p | 0.00128 | 0.373±0.159 |
| mmu-miR-3077* | 0.00101 | 0.379±0.042 |
| mmu-miR-211* | 0.00315 | 0.390±0.065 |
|
mmu-miR-101ba | 0.00020 | 0.418±0.051 |
| mmu-miR-122a | 0.00031 | 0.439±0.031 |
| mmu-miR-762 | 0.01481 | 0.501±0.135 |
| mmu-miR-5126 | 0.00178 | 0.502±0.046 |
| mmu-miR-193b | 0.00074 | 0.527±0.115 |
| mmu-miR-5130 | 0.02714 | 0.533±0.186 |
| mmu-miR-328* | 0.00114 | 0.534±0.076 |
| mmu-miR-3960 | 0.01064 | 0.541±0.066 |
| mmu-miR-203 | 0.01068 | 0.546±0.148 |
| mmu-miR-192 | 0.03496 | 0.550±0.203 |
| mmu-miR-92b* | 0.02031 | 0.551±0.186 |
| mcmv-miR-M23-2 | 0.01668 | 0.565±0.336 |
| mmu-let-7d* | 0.01249 | 0.569±0.106 |
| mmu-miR-744 | 0.04968 | 0.572±0.210 |
| mmu-miR-194a | 0.00228 | 0.574±0.078 |
| mmu-miR-5128 | 0.02948 | 0.574±0.226 |
| mmu-miR-92a-2* | 0.00074 | 0.577±0.056 |
| mmu-miR-680 | 0.01109 | 0.580±0.130 |
| mmu-miR-5122 | 0.03256 | 0.585±0.146 |
| mmu-miR-455 | 0.01402 | 0589±0.161 |
| mmu-miR-378 | 0.00397 | 0.590±0.050 |
| mmu-miR-5132 | 0.00272 | 0.597±0.129 |
| mmu-miR-192* | 0.01510 | 0.597±0.127 |
| mmu-miR-3090* | 0.04577 | 0.600±0.179 |
| mmu-miR-5105 | 0.00690 | 0.606±0.059 |
| mmu-miR-122* | 0.01276 | 0.613±0.114 |
| mmu-miR-365 | 0.01093 | 0.618±0.140 |
| mmu-miR-5115 | 0.00646 | 0.639±0.093 |
|
mmu-miR-1964-5p | 0.02701 | 0.641±0.395 |
| mmu-miR-3058* | 0.01002 | 0.643±0.177 |
| mmu-miR-3062* | 0.01120 | 0.650±0.184 |
| mmu-miR-486* | 0.02615 | 0.654±0.160 |
| mmu-miR-148a | 0.04264 | 0.662±0.120 |
| mmu-miR-128-2* | 0.00337 | 0.673±0.056 |
| mmu-miR-1934* | 0.01077 | 0.690±0.163 |
| mmu-miR-149* | 0.03050 | 0.698±0.053 |
| mmu-miR-3102 | 0.04832 | 0.705±0.226 |
| mmu-miR-3963 | 0.02807 | 0.721±0.141 |
| mmu-miR-144* | 0.04255 | 0.722±0.100 |
|
mmu-miR-466i-5p | 0.00734 | 0.730±0.063 |
| mmu-miR-30e | 0.03175 | 0.759±0.210 |
| mmu-miR-345-5p | 0.01213 | 0.761±0.136 |
| mmu-miR-721 | 0.04609 | 0.761±0.202 |
| mmu-miR-770-3p | 0.00998 | 0.764±0.151 |
| mmu-miR-361* | 0.03287 | 0.771±0.105 |
| mmu-miR-207 | 0.02826 | 0.782±0.166 |
| mmu-miR-669c* | 0.01509 | 0.785±0.121 |
|
mmu-miR-1306-5p | 0.03743 | 0.796±0.153 |
| mmu-miR-705a | 0.04984 | 0.803±0.071 |
| mmu-miR-574-5p | 0.03902 | 0.812±0.168 |
| mmu-miR-3099* | 0.03862 | 0.866±0.111 |
B, Statistical
analysis of miRNAs in liver tissues between MCD-fed mice treated
and untreated with metformin
|
|---|
| Upregulated
microRNA | P-value | Fold
(MCD+metformin/MCD mean ± SD |
|---|
| mmu-miR-879 | 0.00305 | 2.003±0.478 |
| mmu-miR-5110 | 0.02983 | 1.893±0.673 |
|
mmu-miR-466o-3p | 0.01079 | 1.864±0.615 |
| mmu-miR-187* | 0.00583 | 1.792±0.626 |
| mmu-miR-25* | 0.01722 | 1.708±0.589 |
| mmu-miR-676 | 0.04309 | 1.633±0.737 |
| mmu-miR-193* | 0.03590 | 1.585±0.344 |
| mmu-miR-335-5p | 0.00405 | 1.550±0.209 |
| microRNA | P-value | mean ± SD |
| mmu-miR-183 | 0.04925 | 1.531±0.522 |
| mmu-miR-1946b | 0.01225 | 1.519±0.334 |
| mmu-miR-380-3p | 0.04656 | 1.492±0.511 |
| mmu-miR-705a | 0.04487 | 1.475±0.366 |
| mmu-miR-190b* | 0.04529 | 1.453±0.181 |
| mmu-miR-1187 | 0.03109 | 1.436±0.419 |
| mmu-miR-1929 | 0.03159 | 1.422±0.441 |
| mmu-miR-194a | 0.01756 | 1.406±0.337 |
| mmu-miR-5131 | 0.03440 | 1.400±0.356 |
| mmu-miR-532-5p | 0.02742 | 1.398±0.319 |
| mmu-miR-296-5p | 0.02568 | 1.380±0.313 |
| mmu-miR-292-5p | 0.01003 | 1.374±0.192 |
| mmu-miR-1249 | 0.02044 | 1.310±0.215 |
| mmu-miR-122a | 0.00370 | 1.294±0.169 |
|
mmu-miR-101ba | 0.03923 | 1.199±0.165 |
| Downregulated
microRNA | P-value | Fold
(MCD+metformin/MCD) mean ± SD |
|---|
|
mmu-miR-376aa | 0.02593 | 0.398±0.419 |
| mmu-miR-337-3p | 0.00407 | 0.487±0.206 |
| mmu-miR-301b | 0.00559 | 0.500±0.118 |
| mmu-miR-379 | 0.04427 | 0.516±0.453 |
| mmu-miR-410 | 0.02336 | 0.528±0.285 |
| mmu-miR-434-5p | 0.04516 | 0.556±0.176 |
| mmu-miR-541 | 0.04030 | 0.593±0.236 |
| mmu-miR-21 | 0.01198 | 0.595±0.181 |
| mmu-miR-3067* | 0.00460 | 0.596±0.127 |
| mmu-miR-127a | 0.04540 | 0.602±0.391 |
|
mmu-miR-342-3pa | 0.00438 | 0.608±0.175 |
| mmu-miR-300a | 0.01321 | 0.608±0.211 |
| mmu-miR-137* | 0.02554 | 0.636±0.163 |
| mmu-miR-470 | 0.02195 | 0.637±0.267 |
| mmu-miR-544-3p | 0.02228 | 0.643±0.076 |
| mmu-let-7g* | 0.03398 | 0.653±0.240 |
| mmu-miR-34aa | 0.04413 | 0.657±0.294 |
|
mmu-miR-181b-1* | 0.00829 | 0.664±0.087 |
| mmu-miR-425 | 0.03213 | 0.688±0.209 |
| mmu-miR-1b-5p | 0.03025 | 0.728±0.213 |
| mmu-miR-324-5p | 0.04661 | 0.737±0.187 |
| mmu-miR-221* | 0.01899 | 0.755±0.154 |
| mmu-miR-487b | 0.03325 | 0.791±0.116 |
| mmu-miR-1968 | 0.01716 | 0.798±0.085 |
| mmu-miR-320* | 0.01552 | 0.839±0.108 |
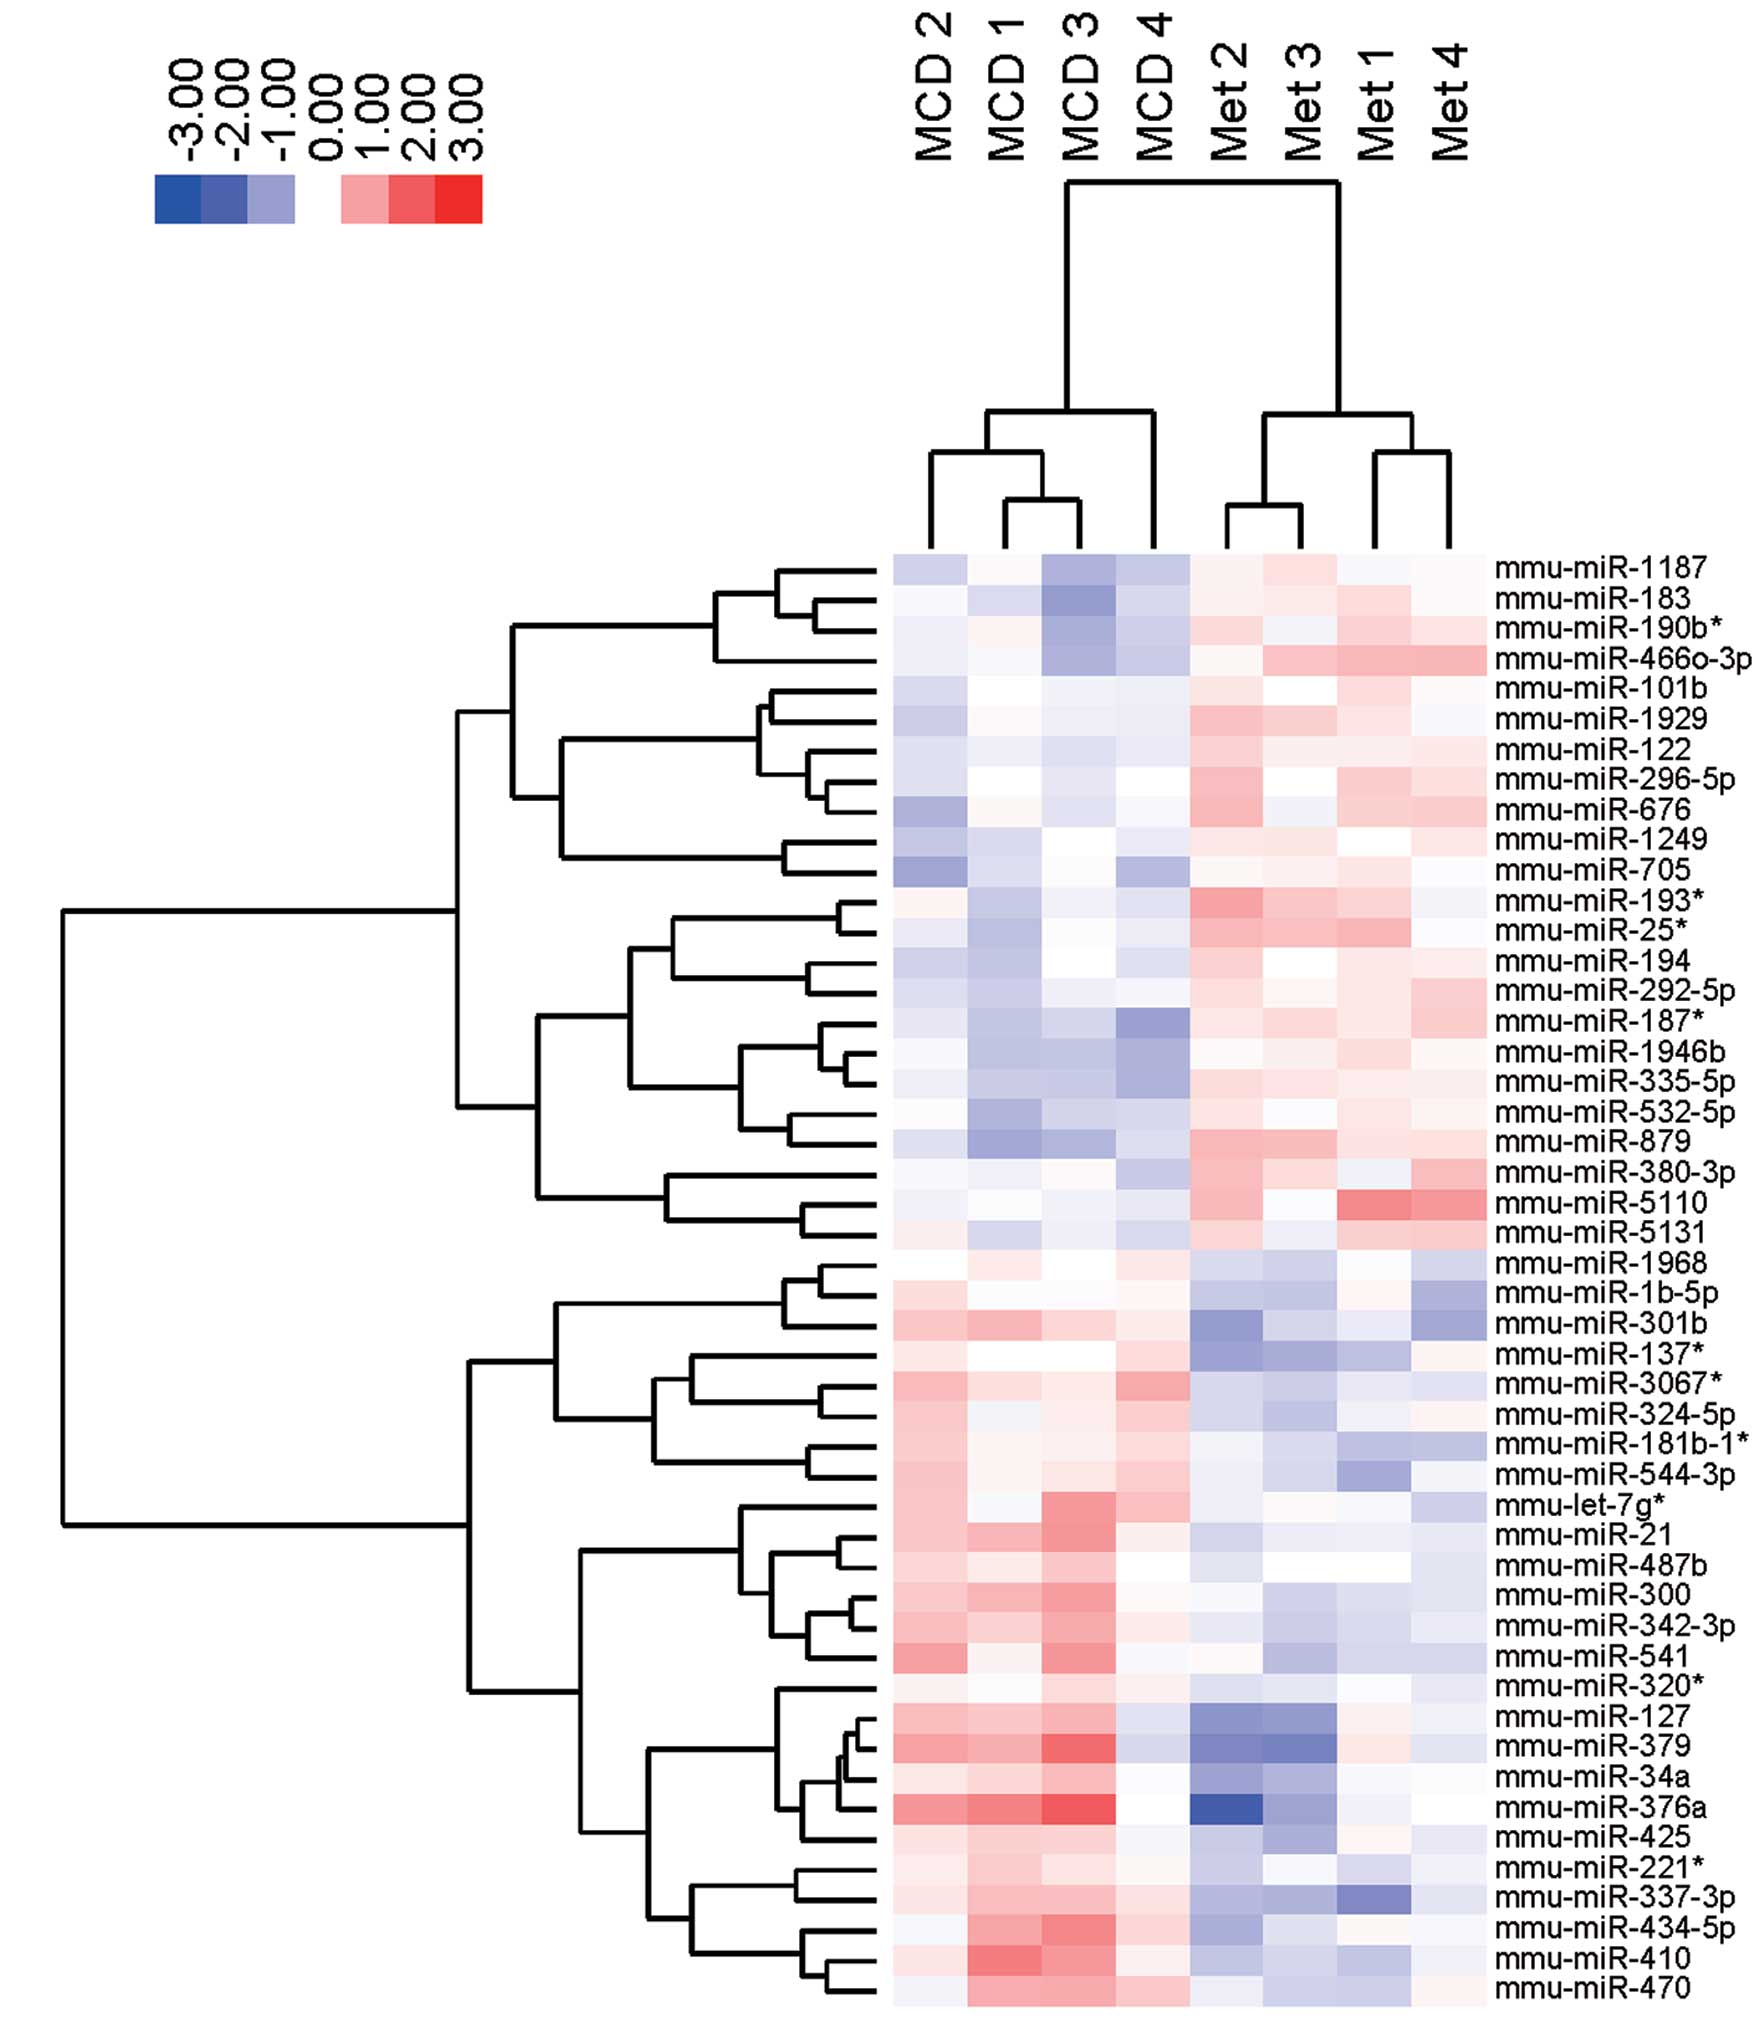
Differences in miRNA expression in liver
tissue from mice treated with metformin
miRNA profiles were examined in MCD-fed mice after
metformin treatment. As shown in Table IB, 23 miRNAs were significantly
upregulated, and 25 miRNAs were downregulated in MCD-fed mice
treated with metformin. Unsupervised hierarchical clustering
analysis using a Pearson’s correlation showed that MCD-fed mice
without metformin clustered separately from the MCD-fed mice
treated with metformin (Fig. 5).
These subsets of 48 miRNAs exhibited significant alterations in
their expression levels between the MCD-fed mice with or without
metformin. Notably, miR-122, miR-194, miRNA-101b, and miRNA-705
were upregulated and miRNA-376a, miRNA-127, miRNA-34a, miRNA-300
and miRNA-342-3p were downregulated in the liver tissue of MCD-fed
mice treated with or without metformin (Table IB and Fig. 6). The four upregulated miRNAs,
i.e., miR-122, miR-194, miRNA-101b and miRNA-705, in mice treated
with or without metformin were consistent with four of the 60
downregulated miRNAs from the control group and MCD-fed mice. The
five downregulated miRNAs i.e., miRNA-376a, miRNA-127, miRNA-34a,
miRNA-300 and miRNA-342-3p, were identical to five of the 71
upregulated miRNAs in control and MCD-fed mice.
Discussion
Most cases of NAFLD remain free of inflammation,
with only 10–20% of these patients developing inflammation and
fibrosis (1). Therefore, NASH is
thought to be the progressive form of NAFLD. Various hits, such as
endoplasmic reticulum stress, adipocytokines, and innate immunity
derived from the gut and/or the adipose tissue, may promote liver
inflammation (1). Lin et
al (6) reported that
metformin was effective at reversing fatty liver disease most
likely via the reduced production of tumor necrosis factor in
hepatocytes. Additionally, Kita et al (10) demonstrated that metformin can
prevent and reverse the development of steatosis and inflammation
in the liver of a NASH dietary mouse model. However, the mechanism
of metformin-induced inhibition of NASH development remains
unclear. To elucidate the relationship between miRNA and NASH
development, miRNA profiles were determined following metformin
treatment in a non-diabetic mouse model of nonalcoholic
steatohepatitis.
Of a number of upregulated miRNAs, miRNA-376a,
miR-127, miR-34a, miR-300, miR-342-3p were downregulated following
metformin treatment in MCD-fed mice. Recently, miR-376a
downregulation has been shown to be associated with arsenic
trioxide (ATO)-induced apoptosis in human retinoblastoma cells
(16). In addition, the
downregulation of miR-127 facilitates hepatocyte regeneration after
partial hepatectomy (17).
Furthermore, miR-34a, which directly targets sirtuin 1 (SIRT1),
were inhibited by ursodeoxycholic acid (UDCA) in the rat liver and
activated by disease severity in human NASH (18). Taken together, it is suggested
that metformin suppresses steatosis, inflammation and fibrosis in
the liver of MCD-fed mice through metformin-induced down-regulation
of these miRNAs.
By contrast, miRNA-122 and miRNA-194 were
significantly upregulated by metformin out of the nine miRNAs that
were downregulated in the NASH liver of MCD-fed mice. Hu et
al (14) recently reported
that miRNA-122 is a liver-specific miRNA and acts as a suppressor
of cell proliferation and carcinogenesis in hepatocytes (19). Additionally, it has been described
that miRNA-122 is downregulated in NASH and may alter lipid
metabolism in the liver (13).
Furthermore, Tsai et al (20) have shown that loss of miRNA-122a
induces steatosis, fibrosis and hepatocarcinogenesis. Currently,
several target genes of miRNA-122 have been shown to be involved in
hepatocarcinogenesis, such as a distintegrin and metalloproteinase
family 10 (ADAM10), serum response factor (SRF) (21), insulin-like growth factor 1
receptor (Igf1R) (22), cyclin G1
(23) and Wnt1 (24). However, the target gene of
miRNA-122 involved in lipid metabolism remains elusive (25). Similar to miRNA-122,
downregulation of miRNA-194 enhances the expression of frizzled-6
(FZD6) and promotes tumorigenesis in the adult liver (26). miRNA-194 is also considered to be
a marker of hepatic epithelial cells and inhibits the metastasis of
liver cancer cells (27). In
various types of cancer, such as gastric (28), endometrial cancer (29,30), renal cell carcinoma (31) and colorectal cancer (32) miRNA-194 inhibits tumor invasion
and metastasis. Taken together, it is suggested that one of the
downstream targets of the metformin-induced pathway is miRNA-122
and/or miRNA-194.
In conclusion, we identified nine key miRNAs that
were modulated by metformin in the NASH liver of MCD-fed mice. Our
findings also suggest that the regulation of these key miRNAs
serves as a novel therapeutic candidate for human NASH.
Abbreviations:
|
miRNA
|
microRNA
|
|
NASH
|
non-alcoholic steatohepatitis
|
|
NAFLD
|
non-alcoholic fatty liver disease
|
|
HCC
|
hepatocellular carcinoma
|
|
TNFα
|
tissue necrotic factor α
|
|
IL-10
|
interleukin-10
|
|
ALT
|
alanine aminotransferase
|
|
AST
|
aspartate aminotransferase
|
|
ALP
|
alkaline phosphatase
|
|
MCD
|
methionine-and choline-deficient
diet
|
References
|
1
|
Tilg H and Moschen AR: Evolution of
inflammation in nonalcoholic fatty liver disease: the multiple
parallel hits hypothesis. Hepatology. 52:1836–1846. 2010.
View Article : Google Scholar : PubMed/NCBI
|
|
2
|
Tiniakos DG, Vos MB and Brunt EM:
Nonalcoholic fatty liver disease: pathology and pathogenesis. Annu
Rev Pathol. 5:145–171. 2010. View Article : Google Scholar : PubMed/NCBI
|
|
3
|
Day CP and James OF: Steatohepatitis: a
tale of two ‘hits’? Gastroenterology. 114:842–845. 1998. View Article : Google Scholar : PubMed/NCBI
|
|
4
|
Postic C and Girard J: Contribution of de
novo fatty acid synthesis to hepatic steatosis and insulin
resistance: lessons from genetically engineered mice. J Clin
Invest. 118:829–838. 2008. View
Article : Google Scholar : PubMed/NCBI
|
|
5
|
Li Z, Yang S, Lin H, et al: Probiotics and
antibodies to TNF inhibit inflammatory activity and improve
nonalcoholic fatty liver disease. Hepatology. 37:343–350. 2003.
View Article : Google Scholar : PubMed/NCBI
|
|
6
|
Lin HZ, Yang SQ, Chuckaree C, et al:
Metformin reverses fatty liver disease in obese, leptin-deficient
mice. Nat Med. 6:998–1003. 2000. View
Article : Google Scholar : PubMed/NCBI
|
|
7
|
Clementi AH, Gaudy AM, van Rooijen N, et
al: Loss of kupffer cells in diet-induced obesity is associated
with increased hepatic steatosis, stat3 signaling, and further
decreases in insulin signaling. Biochim Biophys Acta.
1792:1062–1072. 2009. View Article : Google Scholar : PubMed/NCBI
|
|
8
|
Witters LA: The blooming of the French
lilac. J Clin Invest. 108:1105–1107. 2001. View Article : Google Scholar : PubMed/NCBI
|
|
9
|
Loomba R, Lutchman G, Kleiner DE, et al:
Clinical trial: pilot study of metformin for the treatment of
non-alcoholic steatohepatitis. Aliment Pharmacol Ther. 29:172–182.
2009. View Article : Google Scholar
|
|
10
|
Kita Y, Takamura T, Misu H, et al:
Metformin prevents and reverses inflammation in a non-diabetic
mouse model of nonalcoholic steatohepatitis. PLoS One.
7:e430562012. View Article : Google Scholar : PubMed/NCBI
|
|
11
|
Eulalio A, Huntzinger E and Izaurralde E:
Getting to the root of mirna-mediated gene silencing. Cell.
132:9–14. 2008. View Article : Google Scholar : PubMed/NCBI
|
|
12
|
Peters L and Meister G: Argonaute
proteins: mediators of RNA silencing. Mol Cell. 26:611–623. 2007.
View Article : Google Scholar : PubMed/NCBI
|
|
13
|
Cheung O, Puri P, Eicken C, et al:
Nonalcoholic steatohepatitis is associated with altered hepatic
MicroRNA expression. Hepatology. 48:1810–1820. 2008. View Article : Google Scholar : PubMed/NCBI
|
|
14
|
Hu J, Xu Y, Hao J, et al: MiR-122 in
hepatic function and liver diseases. Protein Cell. 3:364–371. 2012.
View Article : Google Scholar : PubMed/NCBI
|
|
15
|
Braconi C and Patel T: MicroRNA expression
profiling: a molecular tool for defining the phenotype of
hepatocellular tumors. Hepatology. 47:1807–1809. 2008. View Article : Google Scholar : PubMed/NCBI
|
|
16
|
Zhang Y, Wu JH, Han F, et al: Arsenic
trioxide induced apoptosis in retinoblastoma cells by abnormal
expression of microRNA-376a. Neoplasma. 60:247–253. 2013.
View Article : Google Scholar : PubMed/NCBI
|
|
17
|
Pan C, Chen H, Wang L, et al:
Down-regulation of miR-127 facilitates hepatocyte proliferation
during rat liver regeneration. PLoS One. 7:e391512012. View Article : Google Scholar : PubMed/NCBI
|
|
18
|
Castro RE, Ferreira DM, Afonso MB, et al:
miR-34a/SIRT1/p53 is suppressed by ursodeoxycholic acid in the rat
liver and activated by disease severity in human non-alcoholic
fatty liver disease. J Hepatol. 58:119–125. 2013. View Article : Google Scholar
|
|
19
|
Wang B, Majumder S, Nuovo G, et al: Role
of microRNA-155 at early stages of hepatocarcinogenesis induced by
choline-deficient and amino acid-defined diet in C57BL/6 mice.
Hepatology. 50:1152–1161. 2009. View Article : Google Scholar : PubMed/NCBI
|
|
20
|
Tsai WC, Hsu SD, Hsu CS, et al:
MicroRNA-122 plays a critical role in liver homeostasis and
hepatocarcinogenesis. J Clin Invest. 122:2884–2897. 2012.
View Article : Google Scholar : PubMed/NCBI
|
|
21
|
Bai S, Nasser MW, Wang B, et al:
MicroRNA-122 inhibits tumorigenic properties of hepatocellular
carcinoma cells and sensitizes these cells to sorafenib. J Biol
Chem. 284:32015–32027. 2009. View Article : Google Scholar : PubMed/NCBI
|
|
22
|
Zeng C, Wang R, Li D, et al: A novel GSK-3
beta-C/EBP alpha-miR-122-insulin-like growth factor 1 receptor
regulatory circuitry in human hepatocellular carcinoma. Hepatology.
52:1702–1712. 2010. View Article : Google Scholar : PubMed/NCBI
|
|
23
|
Fornari F, Gramantieri L, Giovannini C, et
al: MiR-122/cyclin G1 interaction modulates p53 activity and
affects doxorubicin sensitivity of human hepatocarcinoma cells.
Cancer Res. 69:5761–5767. 2009. View Article : Google Scholar : PubMed/NCBI
|
|
24
|
Xu J, Zhu X, Wu L, et al: MicroRNA-122
suppresses cell proliferation and induces cell apoptosis in
hepatocellular carcinoma by directly targeting Wnt/β-catenin
pathway. Liver Int. 32:752–760. 2012. View Article : Google Scholar : PubMed/NCBI
|
|
25
|
Moore KJ, Rayner KJ, Suarez Y, et al:
microRNAs and cholesterol metabolism. Trends Endocrinol Metab.
21:699–706. 2010. View Article : Google Scholar :
|
|
26
|
Krutzfeldt J, Rosch N, Hausser J, et al:
MicroRNA-194 is a target of transcription factor 1 (Tcf1, HNF1α) in
adult liver and controls expression of frizzled-6. Hepatology.
55:98–107. 2012. View Article : Google Scholar
|
|
27
|
Meng Z, Fu X, Chen X, et al: miR-194 is a
marker of hepatic epithelial cells and suppresses metastasis of
liver cancer cells in mice. Hepatology. 52:2148–2157. 2010.
View Article : Google Scholar : PubMed/NCBI
|
|
28
|
Song Y, Zhao F, Wang Z, et al: Inverse
association between miR-194 expression and tumor invasion in
gastric cancer. Ann Surg Oncol. 19(Suppl 3): S509–S517. 2012.
View Article : Google Scholar
|
|
29
|
Zhai H, Karaayvaz M, Dong P, et al:
Prognostic significance of miR-194 in endometrial cancer. Biomark
Res. 1(12): 2013 View Article : Google Scholar
|
|
30
|
Dong P, Kaneuchi M, Watari H, et al:
MicroRNA-194 inhibits epithelial to mesenchymal transition of
endometrial cancer cells by targeting oncogene BMI-1. Mol Cancer.
10(99): 2011 View Article : Google Scholar
|
|
31
|
Khella HW, Bakhet M, Allo G, et al:
miR-192, miR-194 and miR-215: a convergent microrna network
suppressing tumor progression in renal cell carcinoma.
Carcinogenesis. 34:2231–2239. 2013. View Article : Google Scholar : PubMed/NCBI
|
|
32
|
Chiang Y, Song Y, Wang Z, et al:
microRNA-192, -194 and -215 are frequently downregulated in
colorectal cancer. Exp Ther Med. 3:560–566. 2012.PubMed/NCBI
|