Introduction
Schizophrenia is a well-known psychiatric disorder
with a developmental etiology that is associated with abnormal
mental functions and behaviors, including delusions,
hallucinations, disorganized thinking, and negative symptoms.
Additionally, many patients exhibit concomitant mood symptoms, such
as depression and anxiety, which may contribute to the 10% lifetime
incidence of suicide in schizophrenic patients (1,2).
Prenatal stress (PNS) is among the most frequently reported
environmental risk factors for the development of schizophrenia in
adults (3–8), and the second trimester of pregnancy
in humans seems to be the most vulnerable period for insults
(8). Furthermore, a number of
animal studies have shown that maternal exposure to stress during
gestation elevates glucocorticoids and that this type of stress is
associated with various biochemical, physiological, and behavioral
changes in offspring, including reduced birth weight,
cardiovascular and neuroendocrinological abnormalities, attentional
dysfunction, enhanced anxiety-related behaviors, and cognitive
deficits (9–18). In studies investigating this
connection, pregnant female rats are usually exposed to stressful
manipulations during the third week of pregnancy, which, in terms
of neural development, is equivalent to the second trimester of
human gestation (15–17).
Previous findings have demonstrated that PNS or
maternal exposure to glucocorticoids may affect the responsivity of
the hypothalamic-pituitary-adrenal (HPA) axis and can induce
cognitive deficits in offspring (10,16,17,19–22). Cognitive deficits that result from
disrupted hippocampal anatomy and impaired function of the HPA axis
are also typically observed in patients with schizophrenia
(23,24). In animal studies, PNS results in a
reduced number of hippocampal synapses as well as fewer neurons in
the brain (25). Moreover, the
hippocampi of adolescent and adult male rats exposed to PNS exhibit
decreases in dendritic length, spine density, and the number of
neurons relative to non-stressed (NS) controls (26,27). PNS also causes variable changes of
gene expression in the brains of rats, including in genes
associated with neural development, cell differentiation, and
neurotransmitter function (16,28,29). The frontal poles of PNS rat brains
exhibit significant changes in genes associated with postsynaptic
density complexes and vesicle exocytosis machinery, including the
N-methyl-D-aspartate (NMDA) receptor 1 and 2A subunits,
leucine-rich repeat domain-containing proteins (6), brain-enriched guanylate
kinase-associated proteins, synaptosomal-associated proteins
(24), synaphin/complexin, and
vesicle-associated membrane protein 2 (16). A recent study utilizing
microarray-based profiling of the hippocampus and frontal cortex
investigated changes in gene expression following PNS and
identified changes in genes supporting biological processes and/or
signal transduction cascades that underlie glutamatergic and
γ-aminobutyric acid (GABA)-ergic neurotransmission,
mitogen-activated protein kinase (MAPK) signaling, neurotrophic
factor signaling, phosphodiesterase (PDE)/cyclic nucleotide
signaling, glycogen synthase kinase 3 (GSK3) signaling, and insulin
signaling (28). Furthermore,
Mairesse et al (29)
observed alterations in protein expression in the hippocampi of PNS
rats and confirmed changes in proteins, such as the LIM and SH3
protein 1 (Lasp1), prohibitin, fascin and transferrin.
Previous findings such as those have led to the
hypothesis that PNS-induced phenomena alter the expression of
schizophrenia-associated genes via proteomic mechanisms and that
these genes ultimately affect susceptibility to schizophrenia in
humans. Thus, in the present study, changes in protein expression
were examined in the prefrontal cortex and hippocampus of rats
exposed to repeated variable PNS. Furthermore, we investigated
whether these genes were associated with susceptibility to
schizophrenia in humans using genotyping and functional assays of
the polymorphisms.
Subjects and methods
Animals and stress paradigm
Previously used, pregnant, Sprague-Dawley female
rats were purchased from the Central Laboratory Animal Inc. (Seoul,
Korea) and arrived at the animal facility on day 7 of gestation.
The rats were housed under standard conditions with a 12:12-h
light/dark cycle (lights on at 06:30) with free access to food and
water. Animal procedures were performed in accordance with the
guidelines for the care and use of laboratory animals of the
National Institutes of Health of the US.
Beginning on day 14 of gestation, exposure to PNS
was initiated and consisted of: i) restraint in well-ventilated
cylindrical Plexiglas restrainers for 1 h, ii) exposure to a cold
environment (4°C) for 6 h, iii) overnight food deprivation, iv) 15
min of swim stress in room-temperature water, v) reversal of the
light-dark cycle, and/or vi) social stress induced by overcrowded
housing conditions during the dark phase of the cycle (15,16). Pregnant dams used as controls
remained in the animal room from gestational days 14–21 and were
exposed to only normal animal-room husbandry procedures. Following
birth, the dams and their pups were left undisturbed in their cages
until weaning on postnatal day 23. At this time, male and female
offspring were separated and group-housed in cages with one or two
same-gender littermates with free access to rat chow and water. The
animals were exposed to normal animal room conditions from that
point onwards until experimental use on postnatal day 35 (16,17).
Behavioral measures
Modified behavioral tests, including a social
interaction test, the open field test, and the forced swim test,
were performed, as previously described (15,30–32). The social interaction test was
adapted from previous studies (15,31,32) and was conducted in a clear
Plexiglas chamber (77×77×25 cm). The room in which the chamber was
located was darkened during testing, and the chamber was
illuminated by a single 25 W red light bulb placed ~100 cm above
the base of the chamber (subject age, 30 days). The sessions were
filmed with a video camera (Samsung, Seoul, Korea) placed 150 cm
above the cage. The investigator remained outside the test room
during testing, and the test arena was cleaned after each test
session. Social interaction partners were same-gender siblings who
resided in the same cage after weaning and were of approximately
equal body weight (in the few cases in which a same-gender sibling
was not available, a playmate from similar conditions was used).
Each session lasted for 20 min and was scored in terms of the total
duration of social play and the number and types of interactions.
Specifically, a rater blind to the treatment conditions scored
behaviors as aggressive [fighting (kicking, boxing, and wrestling),
aggressive grooming and biting] or non-aggressive (sniffing,
following and grooming the partner) based on the video.
Experimental and target rats were not used in this paradigm more
than once, and the arena was cleaned with 70% ethanol after each
trial.
The open field test was used to assess exploratory
activity and reactivity to a novel environment. On the test day,
subjects were removed from their home cage (subject age, 32 days)
and individually placed in the start box (15×15×20 cm) of the open
field arena (77×77×25 cm) for 5 min. The apparatus was composed of
black Polygal, and no background noise was provided. The
investigator exited the room, and the behavior of the subject was
recorded. Scoring included central boxes entered, line crossings,
runs, rears, grooming, cage sniffs and immobile behavior, as
previously described (30,31).
As described by previous studies (30,31) the modified forced swim test was
used (subject age, 34 days). The rats were individually lowered
into a cylinder (height, 40 cm; diameter, 20 cm) filled with fresh
heated tap water (25±2°C). After 5 min, the rat was removed and
wiped with a clean towel to remove excess water prior to being
returned to its home cage. On the following day, each rat was again
placed in the cylinder for 15 min during which time swimming,
climbing and immobility behaviors were recorded via video camera
and by an observer using a stopwatch. The predominant behaviors
were counted every 5 sec. Test scores were recorded and included
swim behaviors (horizontal movement throughout the chamber and
crossing quadrants), climbing behavior (upward-directed movements
up the side of the chamber and jump-ups from the bottom of the
chamber), and immobility (no additional activity other than keeping
the head above water or tiny whip kicks) (30,31).
Two-dimensional gel electrophoresis
PNS adult offspring and NS adult controls were
sacrificed, and their brains were dissected to yield prefrontal
cortical and hippocampal tissues. The tissues were washed twice
with ice-cold phosphate-buffered saline, sonicated in sample-lysis
solution, incubated at room temperature for 1 h, and then
centrifuged for 1 h at 15,000 x g. The resulting supernatant
fraction was then subjected to two-dimensional gel electrophoresis
(2DE); 40-μg samples of protein were separated by
first-dimension isoelectric focusing using an immobilized dry strip
(13 cm, 3-11NL) and, subsequently, electrophoresis using a 12%
sodium dodecyl sulfate polyacrylamide gel electrophoresis
(SDS-PAGE) gel. The samples were then stained with silver nitrate,
and the strips were subjected to isoelectric focusing at 20°C in a
Multiphor II electrophoresis unit connected to an EPS 3500 XL power
supply (Amersham Biosciences, Uppsala, Sweden). After focusing, the
equilibrated strips were placed on polyacrylamide gels (20×24 cm)
containing a gradient of 10–16% SDS, and SDS-PAGE was performed
using a Hoefer DALT 2D system (Amersham Biosciences) according to
the manufacturer’s instructions. Digitized images of the 2DE gels
were quantitatively analyzed using PDQuest software (version 7.0;
Bio-Rad, Seoul, Korea) according to the manufacturer’s
instructions. The intensity of each protein spot was normalized to
the total valid spot intensity. The intensities of the
corresponding protein spots from the control and PNS model samples
were compared, and spots yielding differences of ≥50% between
groups were selected for subsequent analysis.
MALDI-TOF analysis and database
search
Peptides were evaporated with an N2 laser at 337 nm
using a delayed extraction approach, and protein analyses were
performed using an Ettan matrix-assisted laser
desorption/ionization time-of-flight (MALDI-TOF) analysis (Amersham
Biosciences, Piscataway, NJ, USA). The search program Mascot,
developed by the Matrixscience (http://www.matrixscience.com/), was utilized for
protein identification using peptide mass fingerprinting, and
spectra were calibrated with trypsin auto-digestion ion peak m/z
(842.5099, 2211.1046).
Immunohistochemistry
The rats were deeply anaesthetized with ethyl ether
and perfused with 4% paraformaldehyde. Fixed brains were removed,
frozen, and cut into 30-μm sections using a sliding
microtome. To detect dihydropyrimidinase-like 2 (Dpysl2 and Dpysl3
expression, frozen sections from the rat prefrontal cortex and
hippocampus were blocked with horse and donkey serum, incubated
with anti-Dpysl2 (1:400; Cell Signaling Technology, Beverly, MA,
USA) and Dpysl3 antibody (1:1,000; EMD Millipore Corp., Billerica,
MA, USA) and then incubated with a Cy3-conjugated anti-rabbit
secondary antibody (1:2,000; Jackson ImmunoResearch Laboratories,
Inc., West Grove, PA, USA). Fluorescence images were captured using
a confocal laser scanning microscope (FV10-ASW; Olympus, Tokyo,
Japan), and image quantification was performed with ImageJ software
using a previously described protocol with slight modifications
(33). Briefly, the pixel
intensities in the enlarged images (×400) were calibrated by
setting the display value range (black) to 255 (green). The
threshold level of detection was selected by viewing histograms and
then adjusted to distinguish the intensity of the signal from that
of the non-specific background. The same threshold level was used
for all the images to allow for valid comparisons between the
control and PNS model images. The intensity of the labeling was
determined using 700-pixel boxes randomly placed at different
locations on the labeled area, and background intensity was
determined using boxes positioned in areas of no signal.
Western blot analysis
Prefrontal cortical and hippocampal tissues were
lysed in radioimmunoprecipitation assay (RIPA) buffer containing
protease inhibitors and then centrifuged at 18,341 × g for 10 min
at 4°C. To identify Dpysl2 and Dpysl3, 100 and 20 μg,
respectively, of the lysed protein were placed on a 10% SDS gel and
transferred onto a polyvinylidene difluoride (PVDF) membrane (EMD
Millipore Corp.). After blocking with 5% skim milk, the membranes
were probed with anti-Dpysl2 (1:200; Cell Signaling Technology,
Inc.; Boston, MA, USA), anti-Dpysl3 (1:20,000; EMD Millipore
Corp.), and anti-β-actin (Actb; 1:5,000) antibody overnight at 4°C
and then with peroxidase-conjugated secondary antibody (1:2,000)
(both from Santa Cruz Biotechnology, Inc., Santa Cruz, CA, USA) for
1 h at room temperature. Immunoreactive bands were detected using
an Enhanced Chemiluminescence (ECL) kit (Elpis Biotech Inc.,
Daejeon, Korea), and quantitative measurements of Dpysl2, Dpysl3
and the Actb protein were obtained using ImageJ software. The mean
pixel intensities of Dpysl2, Dpysl3 and the Actb protein were
measured by positioning a box around the protein band and
subtracting the background intensity. The integrated density values
were presented as means ± standard error of the mean (SEM) of the
individual protein levels normalized to the integrated density
value of Actb. Quantitative measurements of Dpysl2, Dpysl3 and Actb
were achieved using ImageJ software (http://imagej.nih.gov/ij). The mean pixel intensities
of Dpysl2, Dpysl3 and Actb were measured by positioning a box
around the protein band and eliminating the background.
Subjects
This study included 202 patients with schizophrenia
(118 male and 84 female) with a mean age of 46.08±11.9 years (mean
± SD) and 317 control subjects (144 male and 173 female) with a
mean age of 44.04±7.8 years (mean ± SD) who had no clinical
evidence of any psychiatric disorders. Blood samples were obtained
from the schizophrenic and control participants at Soonchunhyang
University Hospital and Kyung Hee University Hospital. The patients
with schizophrenia were diagnosed according to the Diagnostic and
Statistical Manual of Mental Disorders IV (DSM-IV) (34) by two well-trained psychiatrists.
Control subjects were recruited following determination that they
were mentally fit during an examination provided through a general
health checkup program. Written informed consent was obtained from
each subject.
Single-nucleotide polymorphism
selection
To evaluate the association between the
DPYSL2 gene and schizophrenia, seven single-nucleotide
polymorphisms (SNPs) of DPYSL2 were genotyped in a Korean
population. Five of the seven SNPs were previously described in a
Japanese population (rs431246, promoter; rs2289593, missense;
rs327222, synonymous; rs708621, synonymous; and rs17666, 3′UTR)
(35) and two promoter SNPs
(rs4872449 and rs9886448) were added using the National Center for
Biotechnology Information (NCBI) website (http://www.ensembl.org; www.ncbi.nlm.nih.gov/SNP). Of the SNPs for
DPYSL2, all coding SNPs (cSNPs) and all SNPs of the promoter
region of the gene (~2,000 bp upstream) were initially selected. Of
these, SNPs with >5% minor allele frequency (MAF) and >10%
heterozygosity and/or genotype frequencies in the Asian population
were included.
Genotyping
DNA was extracted from peripheral blood using a
PureHelix Genomic DNA Prep kit (NanoHelix Co., Ltd., Daejeon,
Korea) (36), as previously
described. The primer sequences and annealing temperatures used for
the analysis of each polymorphism are provided in Table I. Each reaction consisted of a
single denaturation at 95°C for 5 min, 35 cycles of denaturation at
95°C for 30 sec, annealing at the appropriate primer pair with an
annealing temperature for 30 sec, and then an extension at 72°C for
30 sec. A final extension step at 72°C was performed at the end of
the program for 10 min. Following amplification, the polymerase
chain reaction (PCR) products were digested overnight with the
corresponding restriction enzyme (Table I) according to the manufacturer’s
instructions. The digestion products were subsequently
electrophoresed on 3.0% agarose gels and stained with SYBR-Green
(Invitrogen, Carlsbad, CA, USA). One of the seven SNPs (rs9886448)
was analyzed using the high-resolution melt (HRM) method of the
Eco™ Real-Time PCR System (Illumina, Inc., San Diego, CA, USA). The
reaction was initiated with a single denaturation at 95°C for 10
min, followed by 40 three-step cycles of denaturation at 95°C for
10 sec each, annealing at the appropriate primer-pair annealing
temperature for 15 sec, and then an extension at 72°C or 15 sec.
Subsequently, the PCR products were heated to 95°C for 15 sec and
then cooled down to 55°C for 15 sec. The melt curves were then
produced by measuring fluorescence during a temperature increase
from 55°C to 95°C (with0.1°C increments).
 | Table IPolymerase chain reaction primers for
single-nucleotide polymorphisms in DPYSL2. |
Table I
Polymerase chain reaction primers for
single-nucleotide polymorphisms in DPYSL2.
| SNP | Primer
sequences | Annealing
temperature (°C) | Product size
(bp) | Restriction
enzyme |
|---|
| rs9886448
(−1625T>C) | F:
5′-GAAGCCAGACTTTGAGGTGGA-3′
R: 5′-GCACTGCTTTCCAGGTTAGG-3′ | 58 | 120 | N/A |
| rs4872449
(−1195A>G) | F:
5′-CCGCACTTACTCCCCAAACA-3′
R: 5′-ACGTGTCGCGATTTGGTTTA-3′ | 52 | 317 | SmaI |
| rs431246
(−975C>G) | F:
5′-GCCCATTCCCCGCCCCCAGGAG-3′
R: 5′-CCCGCCGTTGCTGGCGCTGAAC-3′ | 70 | 169 | Alw62I |
| rs2289593
(352G>A) | F:
5′-ACCTACCGTGATCCTTCACAAG-3′
R: 5′-AGCTGGGTTACATGGATTCTTA-3′ | 53 | 327 | Fnu4HI |
| rs327222
(426C>T) | F:
5′-ACTACTCTCTGCATGTGGACATCCG-3′
R: 5′-GAGGGCATTGACTCAGTGCAACCTA-3′ | 62 | 104 |
Bsh1236I |
| rs708621
(1506T>C) | F:
5′-GCTGAGCTGAGAGGCGTTCCTC-3′
R: 5′-CCTGCTGCTTGGCAGGAGACGT-3′ | 56 | 118 | BspLI |
| rs17666
(*2236T>C) | F:
5′-GTCTTCCTGTTTTTCCTGTACC-3′
R: 5′-TATTTTGCCATCAAGACAGTGG-3′ | 56 | 367 | BspTI |
Statistical analysis
Western blot analysis and immuno histochemical image
quantifications were performed using ImageJ software. Groups were
compared using Student’s t-test, and P<0.05 was considered to
indicate a significant result. The Hardy-Weinberg equilibrium (HWE)
was assessed using the SNPstats program (http://bioinfo.iconcologia.net/SNPstats), and
Haploview version 4.2 (Daly Lab Inc., Cambridge, MA, USA) was
employed to determine the linkage disequilibrium (LD) block.
SNPStats was used to evaluate the odds ratios (ORs), 95% confidence
intervals (CIs), and P-values. The multiple logistic regression
analyses were conducted using age and gender as covariates and
Bonferroni’s correction was applied by multiplying the P-values by
the number of SNPs (n=7).
Results
Social interaction test
Slight differences between the NS and PNS groups
were observed (Table II). In
particular, one of the non-aggressive behaviors, i.e., that of
partner grooming, was significantly decreased in the PNS group
(P=0.011)
| Table IISocial interaction behavior of
non-prenatal stress and prenatal stress-induced rat. |
Table II
Social interaction behavior of
non-prenatal stress and prenatal stress-induced rat.
| Behavior | NS | PNS | P-value |
|---|
| Non-aggressive |
| Sniffing (n) | 18.4±2.26 | 17.1±2.79 | 0.722 |
| Sniffing (s) | 74.7±13.62 | 65.7±11.24 | 0.617 |
| Following (n) | 14±2.29 | 9.62±2.13 | 0.059 |
| Following (s) | 55.6±9.24 | 41.37±8.72 | 0.095 |
| Grooming the
partner (n) | 2.2±0.69 | 0.29±0.18 | 0.011 |
| Grooming the
partner (s) | 16±7.73 | 5.43±4.64 | 0.164 |
| Aggressive |
| Fight (n) | 5±1.14 | 3.16±1.4 | 0.173 |
| Fight (s) | 20±9.08 | 19.16±8.47 | 0.645 |
| Aggressive
grooming (n) | 1±0.00 | 1±0.00 | 1.000 |
| Aggressive
grooming (s) | 4±0.00 | 3±0.00 | 0.844 |
| Biting (n) | 2.5±1.50 | 4±0.00 | 0.104 |
| Biting (s) | 14.5±9.50 | 16±0.00 | 0.112 |
The open-field test
NS and PNS offspring were tested in the open field
for 20 min. The PNS group had a significantly greater number of
line crossings (P=0.014) and showed a trend towards a greater
number of entries into the center (P=0.068) (Table III) relative to the NS
group.
| Table IIIBehavior of non-prenatal stress and
prenatal stress induced rat in an open field. |
Table III
Behavior of non-prenatal stress and
prenatal stress induced rat in an open field.
| Behavior | NS | PNS | P-value |
|---|
| Centrally entered
(n) | 5.1±1.87 | 1.3±0.57 | 0.068 |
| Line crossing
(n) | 1.8±0.46 | 0.4±0.22 | 0.014 |
| Run (n) | 15.8±3.69 | 17.4±0.37 | 0.753 |
| Run (s) | 19±4.32 | 26±5.96 | 0.316 |
| Rear (n) | 44.2±7.81 | 35.6±3.26 | 0.323 |
| Rear (s) | 103.2±24.90 | 82.4±13.36 | 0.471 |
| Grooming (n) | 13.7±1.14 | 14.4±0.81 | 0.625 |
| Grooming (s) | 283.3±34.15 | 283.4±24.41 | 0.998 |
| Cage sniff (n) | 22.3±2.35 | 25.8±4.27 | 0.482 |
| Cage sniff (s) | 62.3±7.94 | 84.3±18.32 | 0.285 |
| Immobile (n) | 7.8±1.83 | 12.1±2.07 | 0.139 |
| Immobile (s) | 208.9±55.06 | 263.8±47.39 | 0.460 |
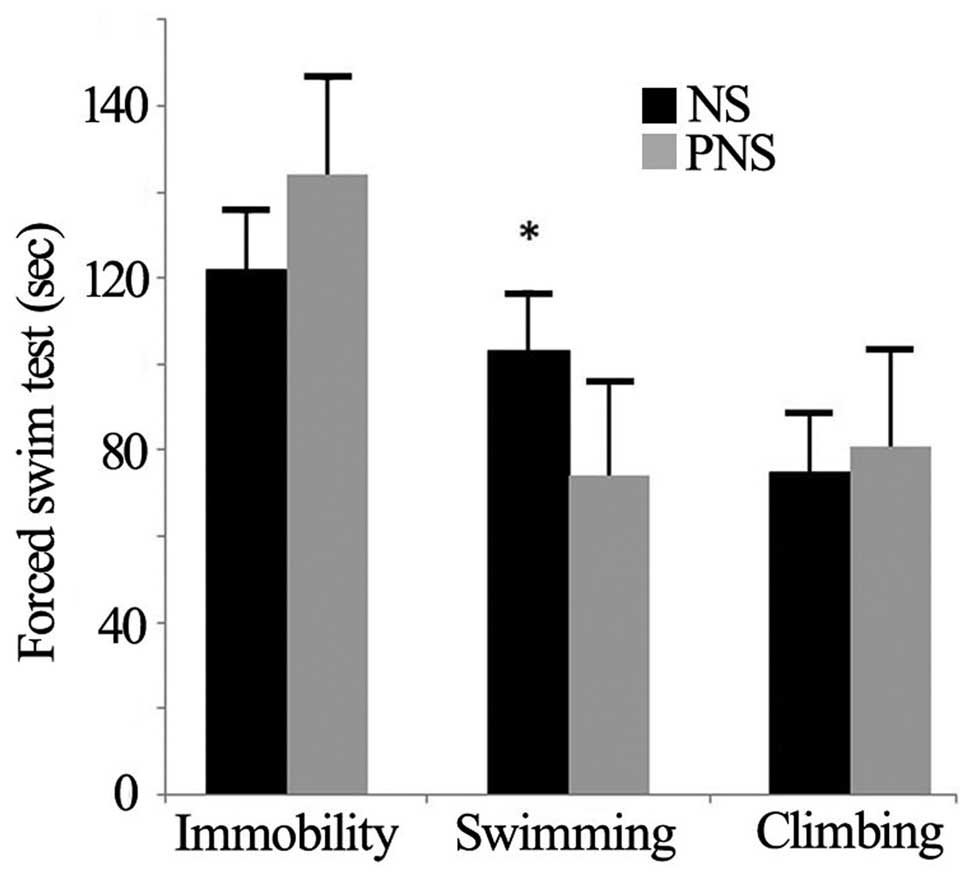
The forced swim test
In the forced swim test, PNS offspring exhibited
fewer immobility behaviors compared with NS rats (P=0.029)
(Table IV and Fig. 1). However, the climbing and
swimming behaviors of the two groups did not differ
(P>0.05).
| Table IVBehavioral response in the forced
swim test session. |
Table IV
Behavioral response in the forced
swim test session.
| Behavior | NS | PNS | P-value |
|---|
| Climbing | 75±7.56 | 81±10.87 | 0.656 |
| Swimming | 103±5.06 | 74±11.12 | 0.029 |
| Immobility | 122±6.79 | 144±15.08 | 0.191 |
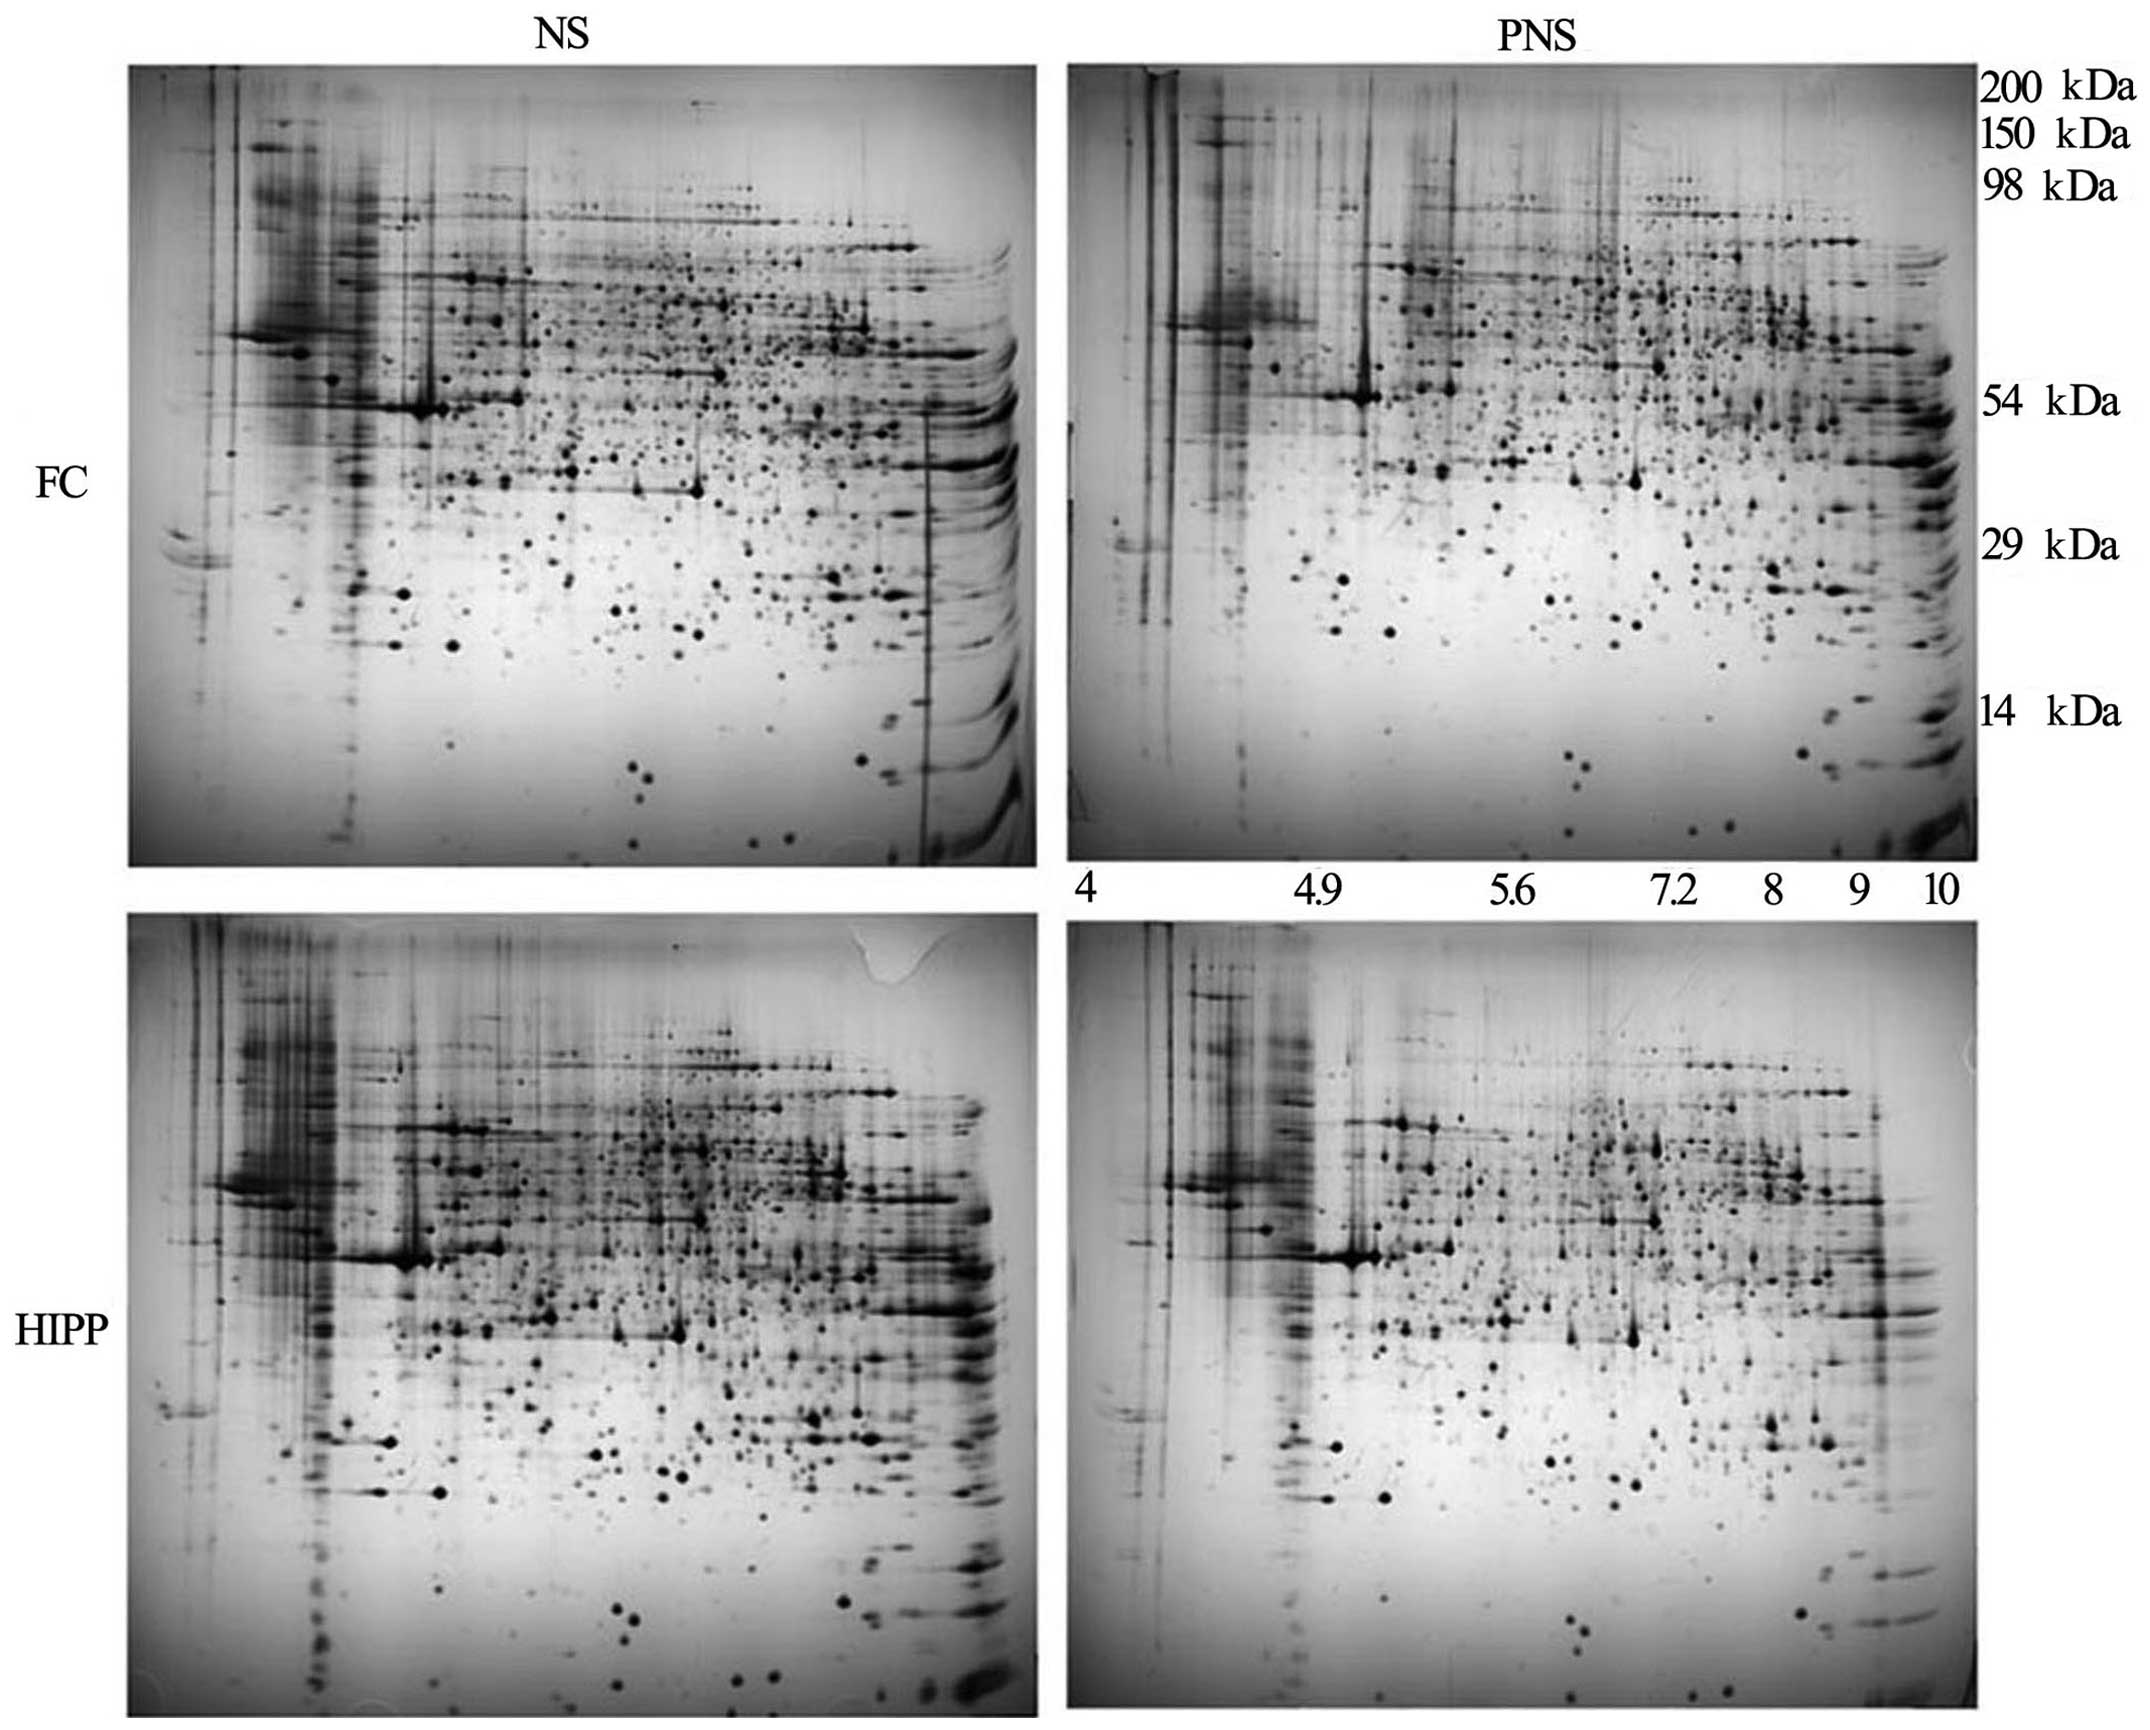
Proteomic analysis
To compare protein expression in the prefrontal
cortices and hippocampi of PNS and NS rats, the soluble proteins
were extracted and evaluated on non-linear pH 3-11 gel strips. From
the silver-stained 2D gels, 360 protein spots in the prefrontal
cortex and 349 protein spots in the hippo-campus were visualized
(Fig. 2). Of these, 31 protein
spots in the prefrontal cortex and 30 protein spots in the
hippocampus differed significantly according to the MALDI-TOF
analyses (95% CI). Compared with the NS group following triplicate
runs, the PNS group had five protein spots that were upregulated
and 26 spots that were downregulated in the prefrontal cortex
(Table V). Additionally, five
spots were upregulated in the hippocampus and 30 spots were
downregulated in the PNS compared with the control rats (Table VI).
| Table VA list of prefrontal cortex proteins
that are differentially expressed in non-prenatal stress and
prenatal stress-induced rats. |
Table V
A list of prefrontal cortex proteins
that are differentially expressed in non-prenatal stress and
prenatal stress-induced rats.
| Protein
description | Access no. | Nominal mass | pI | Score |
Fold-changec | Coverage (%) |
|---|
| Upregulated in
prenatal stress induced rat |
| Phosphoglycerate
mutase 1 | gi|114326546 | 28928 | 6.67 | 88 | >200 | 55 |
| Protein carboxyl
methyltransferase | gi|603467 | 24667 | 7.14 | 61 | 200 | 29 |
| GTP-binding
nuclear protein Ran | gi|5453555 | 24579 | 7.01 | 113 | 200 | 55 |
| p55 protein | gi|83320109 | 51317 | 6.01 | 62 | 2.3 | 29 |
| Proteasome subunit
α type-2 | gi|8394063 | 26024 | 6.92 | 87 | 1.3 | 38 |
| Downregulated in
prenatal stress induced rat |
|
Dihydropyrimidinase-like 2 | gi|40254595 | 62638 | 5.95 | 233 | 0.7 | 48 |
| Septin-6 | gi|290677865 | 49147 | 6.23 | 191 | 0.7 | 38 |
|
Dihydropyrimidinase-like 3 | gi|25742568 | 62327 | 6.04 | 114 | 0.7 | 31 |
| Vinculin | gi|157822133 | 117112 | 5.83 | 223 | 0.7 | 28 |
|
Glycerol-3-phosphate dehydrogenase
[NAD+], cytoplasmic | gi|57527919 | 38112 | 6.16 | 151 | 0.7 | 48 |
|
Dihydropyrimidinase-like 2 | gi|40254595 | 62638 | 5.95 | 102 | 0.6 | 26 |
|
Dihydropyrimidinase-like 2 | gi|40254595 | 62638 | 5.95 | 178 | 0.6 | 44 |
|
Dihydropyrimidinase-like 3, isoform
CRAb | gi|149017448 | 62141 | 6.04 | 104 | 0.6 | 28 |
| Gelsolin, isoform
CRAb | gi|149038929 | 81064 | 5.46 | 92 | 0.58 | 22 |
|
Dihydropyrimidinase-like 2 | gi|40254595 | 62638 | 5.95 | 150 | 0.56 | 36 |
| Inner membrane
protein, mitochondrial, isoform CRAa | gi|149036390 | 86204 | 5.67 | 124 | 0.55 | 26 |
| NADH dehydrogenase
(ubiquinone) Fe-S protein 1, isoform CRAb | gi|149046009 | 74362 | 5.74 | 229 | 0.49 | 35 |
| Transitional
endoplasmic reticulum ATPase | gi|17865351 | 89977 | 5.14 | 227 | 0.42 | 37 |
| Transitional
endoplasmic reticulum ATPase | gi|17865351 | 89977 | 5.14 | 206 | 0.41 | 32 |
| Ubiquitin
carboxylterminal hydrolase 14 | gi|56605688 | 56397 | 5.11 | 65 | 0.4 | 22 |
| Inner membrane
protein, mitochondrial, isoform CRAa | gi|149036390 | 86204 | 5.67 | 196 | 0.4 | 31 |
| α-internexin | gi|55622 | 55712 | 5.2 | 327 | 0.4 | 47 |
| Glial fibrillary
acidic protein δ | gi|5030428 | 48809 | 5.72 | 145 | 0.4 | 36 |
| Glial fibrillary
acidic protein | gi|430721 | 49970 | 5.35 | 141 | 0.4 | 36 |
| Coiled-coil domain
containing 85A-like isoform 3 | gi|293341895 | 50812 | 8.29 | 64 | 0.3 | 16 |
| β-soluble NSF
attachment protein | gi|205829956 | 33791 | 5.32 | 233 | 0.29 | 75 |
| α-soluble NSF
attachment protein | gi|18034791 | 33627 | 5.3 | 236 | 0.2 | 73 |
| Tpi1 protein | gi|38512111 | 27214 | 7.07 | 187 | 0.2 | 65 |
| Dynactin subunit
2 | gi|51948450 | 44235 | 5.14 | 251 | 0.2 | 50 |
| Sirtuin (silent
mating type information regulation 2 homolog) 2 (S.
cerevisiae), isoform CRAa | gi|149056443 | 43763 | 5.37 | 91 | 0.2 | 34 |
| Serum albumin
precursor | gi|158138568 | 70710 | 6.09 | 284 | 0.2 | 49 |
| Table VIA list of hippocampal proteins that
are differentially expressed in non-prenatal stress and prenatal
stress-induced rats. |
Table VI
A list of hippocampal proteins that
are differentially expressed in non-prenatal stress and prenatal
stress-induced rats.
| Protein
description | Access no. | Nominal mass | pI | Score |
Fold-changec | Coverage (%) |
|---|
| Upregulated in
prenatal stress induced rat |
| NADH dehydrogenase
(ubiquinone) Fe-S protein 1, isoform CRAb | gi|149046009 | 74362 | 5.74 | 229 | 1.23 | 35 |
| Vinculin | gi|157822133 | 117112 | 5.83 | 223 | 1.2 | 28 |
| p55 protein | gi|83320109 | 51317 | 6.01 | 62 | 1.1 | 29 |
| α-internexin | gi|55622 | 55712 | 5.2 | 327 | 1.1 | 47 |
| β-soluble NSF
attachment protein | gi|205829956 | 33791 | 5.32 | 233 | 1.07 | 75 |
| Downregulated in
prenatal stress induced rat |
|
Dihydropyrimidinase-like 2 | gi|40254595 | 62638 | 5.95 | 150 | 0.7 | 36 |
|
Dihydropyrimidinase-like 2 | gi|40254595 | 62638 | 5.95 | 233 | 0.7 | 48 |
| Tpi1 protein | gi|38512111 | 27214 | 7.07 | 187 | 0.7 | 65 |
| Dynamin-1 | gi|190358918 | 97576 | 6.44 | 264 | 0.7 | 38 |
|
Hydroxyacylglutathione hydrolase,
mitochondrial precursor | gi|315630402 | 34593 | 8.06 | 78 | 0.7 | 34 |
| Actin-related
protein 2/3 | gi|205686193 | 34484 | 6.84 | 164 | 0.6 | 41 |
| Electron transfer
flavoprotein subunit α, mitochondrial precursor | gi|57527204 | 35272 | 8.62 | 146 | 0.6 | 38 |
|
Glycerol-3-phosphate dehydrogenase
[NAD+], cytoplasmic | gi|57527919 | 38112 | 6.16 | 151 | 0.6 | 48 |
| Glycogen
phosphorylase, brain form | gi|158187544 | 97361 | 6.31 | 125 | 0.6 | 14 |
| Transitional
endoplasmic reticulum ATPase | gi|17865351 | 89977 | 5.14 | 206 | 0.57 | 32 |
| Protein carboxyl
methyltransferase | gi|603467 | 24667 | 7.14 | 61 | 0.5 | 29 |
| Proteasome subunit
α type-2 | gi|8394063 | 26024 | 6.92 | 87 | 0.5 | 38 |
| N-acetylneuraminic
acid synthase | gi|164663874 | 40482 | 6.39 | 82 | 0.5 | 21 |
| Ribose-phosphate
pyrophosphokinase 1 isoform 1 | gi|4506127 | 35325 | 6.51 | 85 | 0.5 | 24 |
| Glycogen
phosphorylase, brain form | gi|158187544 | 97361 | 6.31 | 68 | 0.5 | 10 |
| Septin-6 | gi|290677865 | 49147 | 6.23 | 191 | 0.5 | 38 |
|
Dihydropyrimidinase-like 3 | gi|25742568 | 62327 | 6.04 | 114 | 0.5 | 31 |
| Sirtuin (silent
mating type information regulation 2 homolog) 2 (S.
cerevisiae), isoform CRAa | gi|149056443 | 43763 | 5.37 | 91 | 0.47 | 34 |
| GTP-binding
nuclear protein Ran | gi|5453555 | 24579 | 7.01 | 113 | 0.4 | 55 |
|
Hydroxyacylglutathione hydrolase,
mitochondrial precursor | gi|315630402 | 34593 | 8.06 | 76 | 0.4 | 30 |
| Ubiquitin
carboxyl-terminal hydrolase 14 | gi|56605688 | 56397 | 5.11 | 65 | 0.4 | 22 |
| α-soluble NSF
attachment protein | gi|18034791 | 33627 | 5.3 | 236 | 0.4 | 73 |
| Coiled-coil domain
containing 85A-like isoform 3 | gi|293341895 | 50812 | 8.29 | 64 | 0.3 | 16 |
|
Dihydropyrimidinase-like 2 | gi|40254595 | 62638 | 5.95 | 178 | 0.3 | 44 |
| Dynactin subunit
2 | gi|51948450 | 44235 | 5.14 | 251 | 0.3 | 50 |
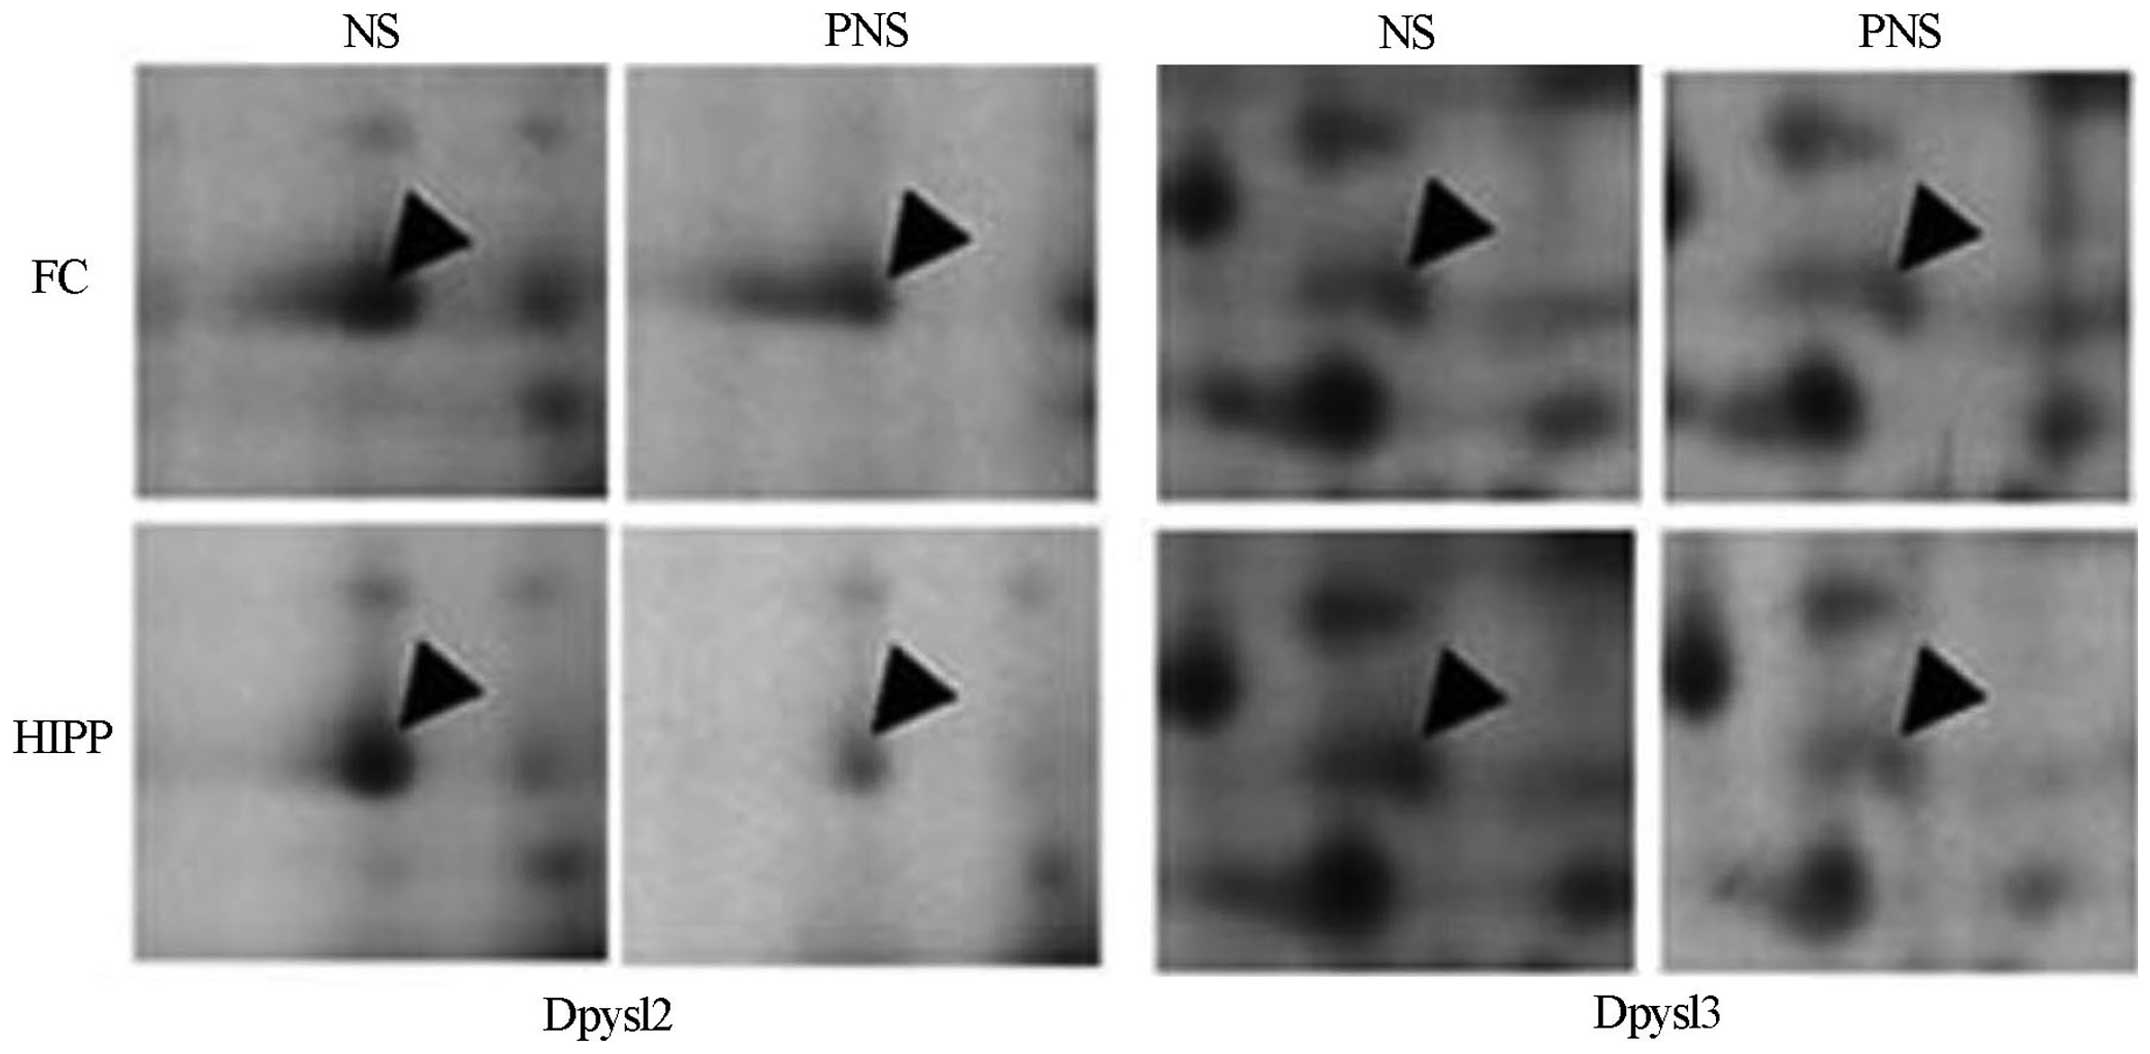
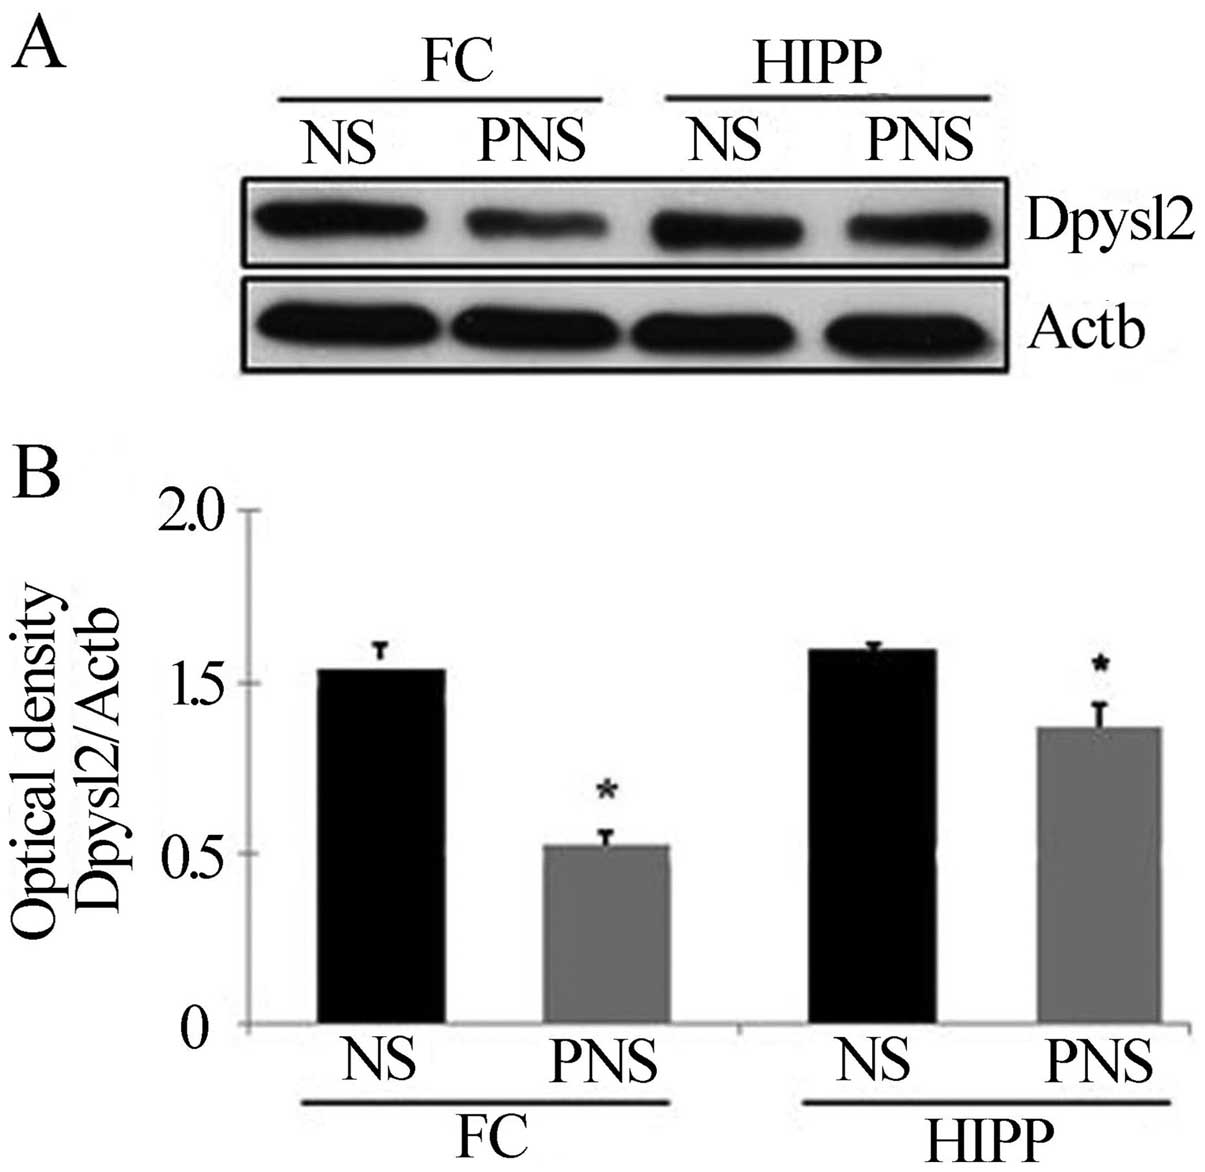
Confirmation of downregulated proteins in
PNS rats
Dpysl2 is expressed in neurons of the central
nervous system and is concentrated at synaptic sites and in the
axon, where it may affect synaptic physiology (34). To confirm the PNS-induced
downregulation of Dpysl2 and Dpysl3 proteins observed in our
proteomics study (Fig. 3), we
performed western blotting (Figs.
4 and 5) and
immunohistochemical (Fig. 6)
analyses of the hippocampal and prefrontal cortex areas of the
control and PNS rat brains. In the western blot analyses used to
assess the Dpysl2 and Dpysl3 proteins, 100 and 20 μg of the
lysed protein, respectively, were electrophoresed on a 10% SDS-PAGE
gel and then transferred onto a PVDF membrane. The membranes were
probed with anti-Dpysl2, anti-Dpysl3 and anti-Actb antibody
overnight and then with peroxidase-conjugated secondary antibodies
prior to immu-noreactive bands being detected using the ECL kit.
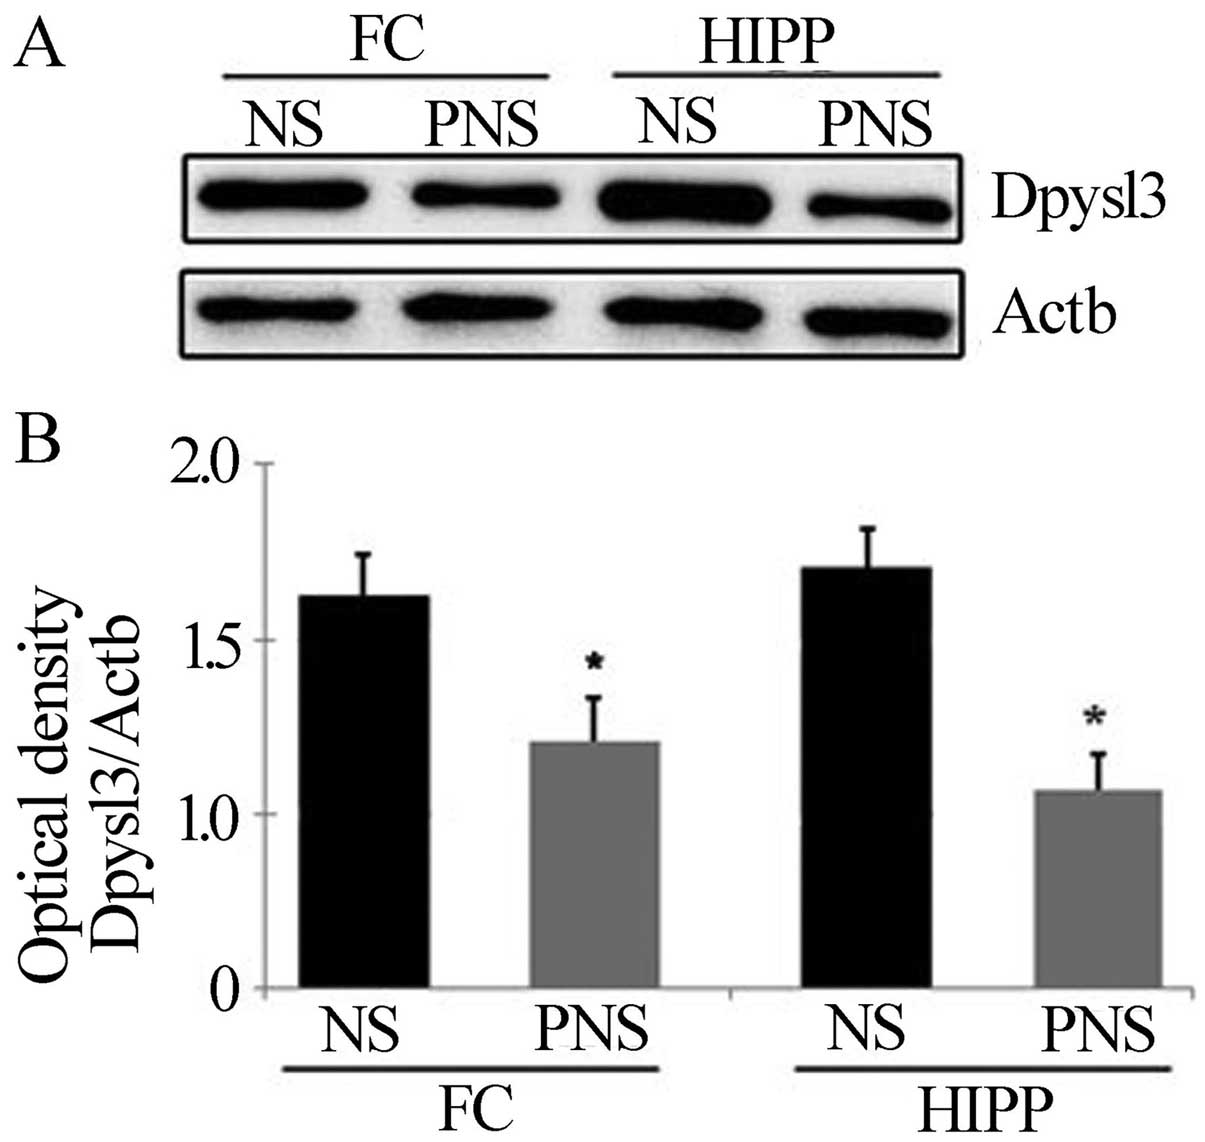
Western blot analyses revealed that the amount of Dpysl2 protein in
the prefrontal cortex and hippocampus was significantly lower in
PNS than in NS rats (all P-values <0.05) (Fig. 4), whereas the amount of Actb in
the prefrontal cortex and hippocampus was similar in the two
groups. Similar results were observed for Dpysl3 (all P-values
<0.05 in the prefrontal cortex and hippocampus) (Fig. 5).
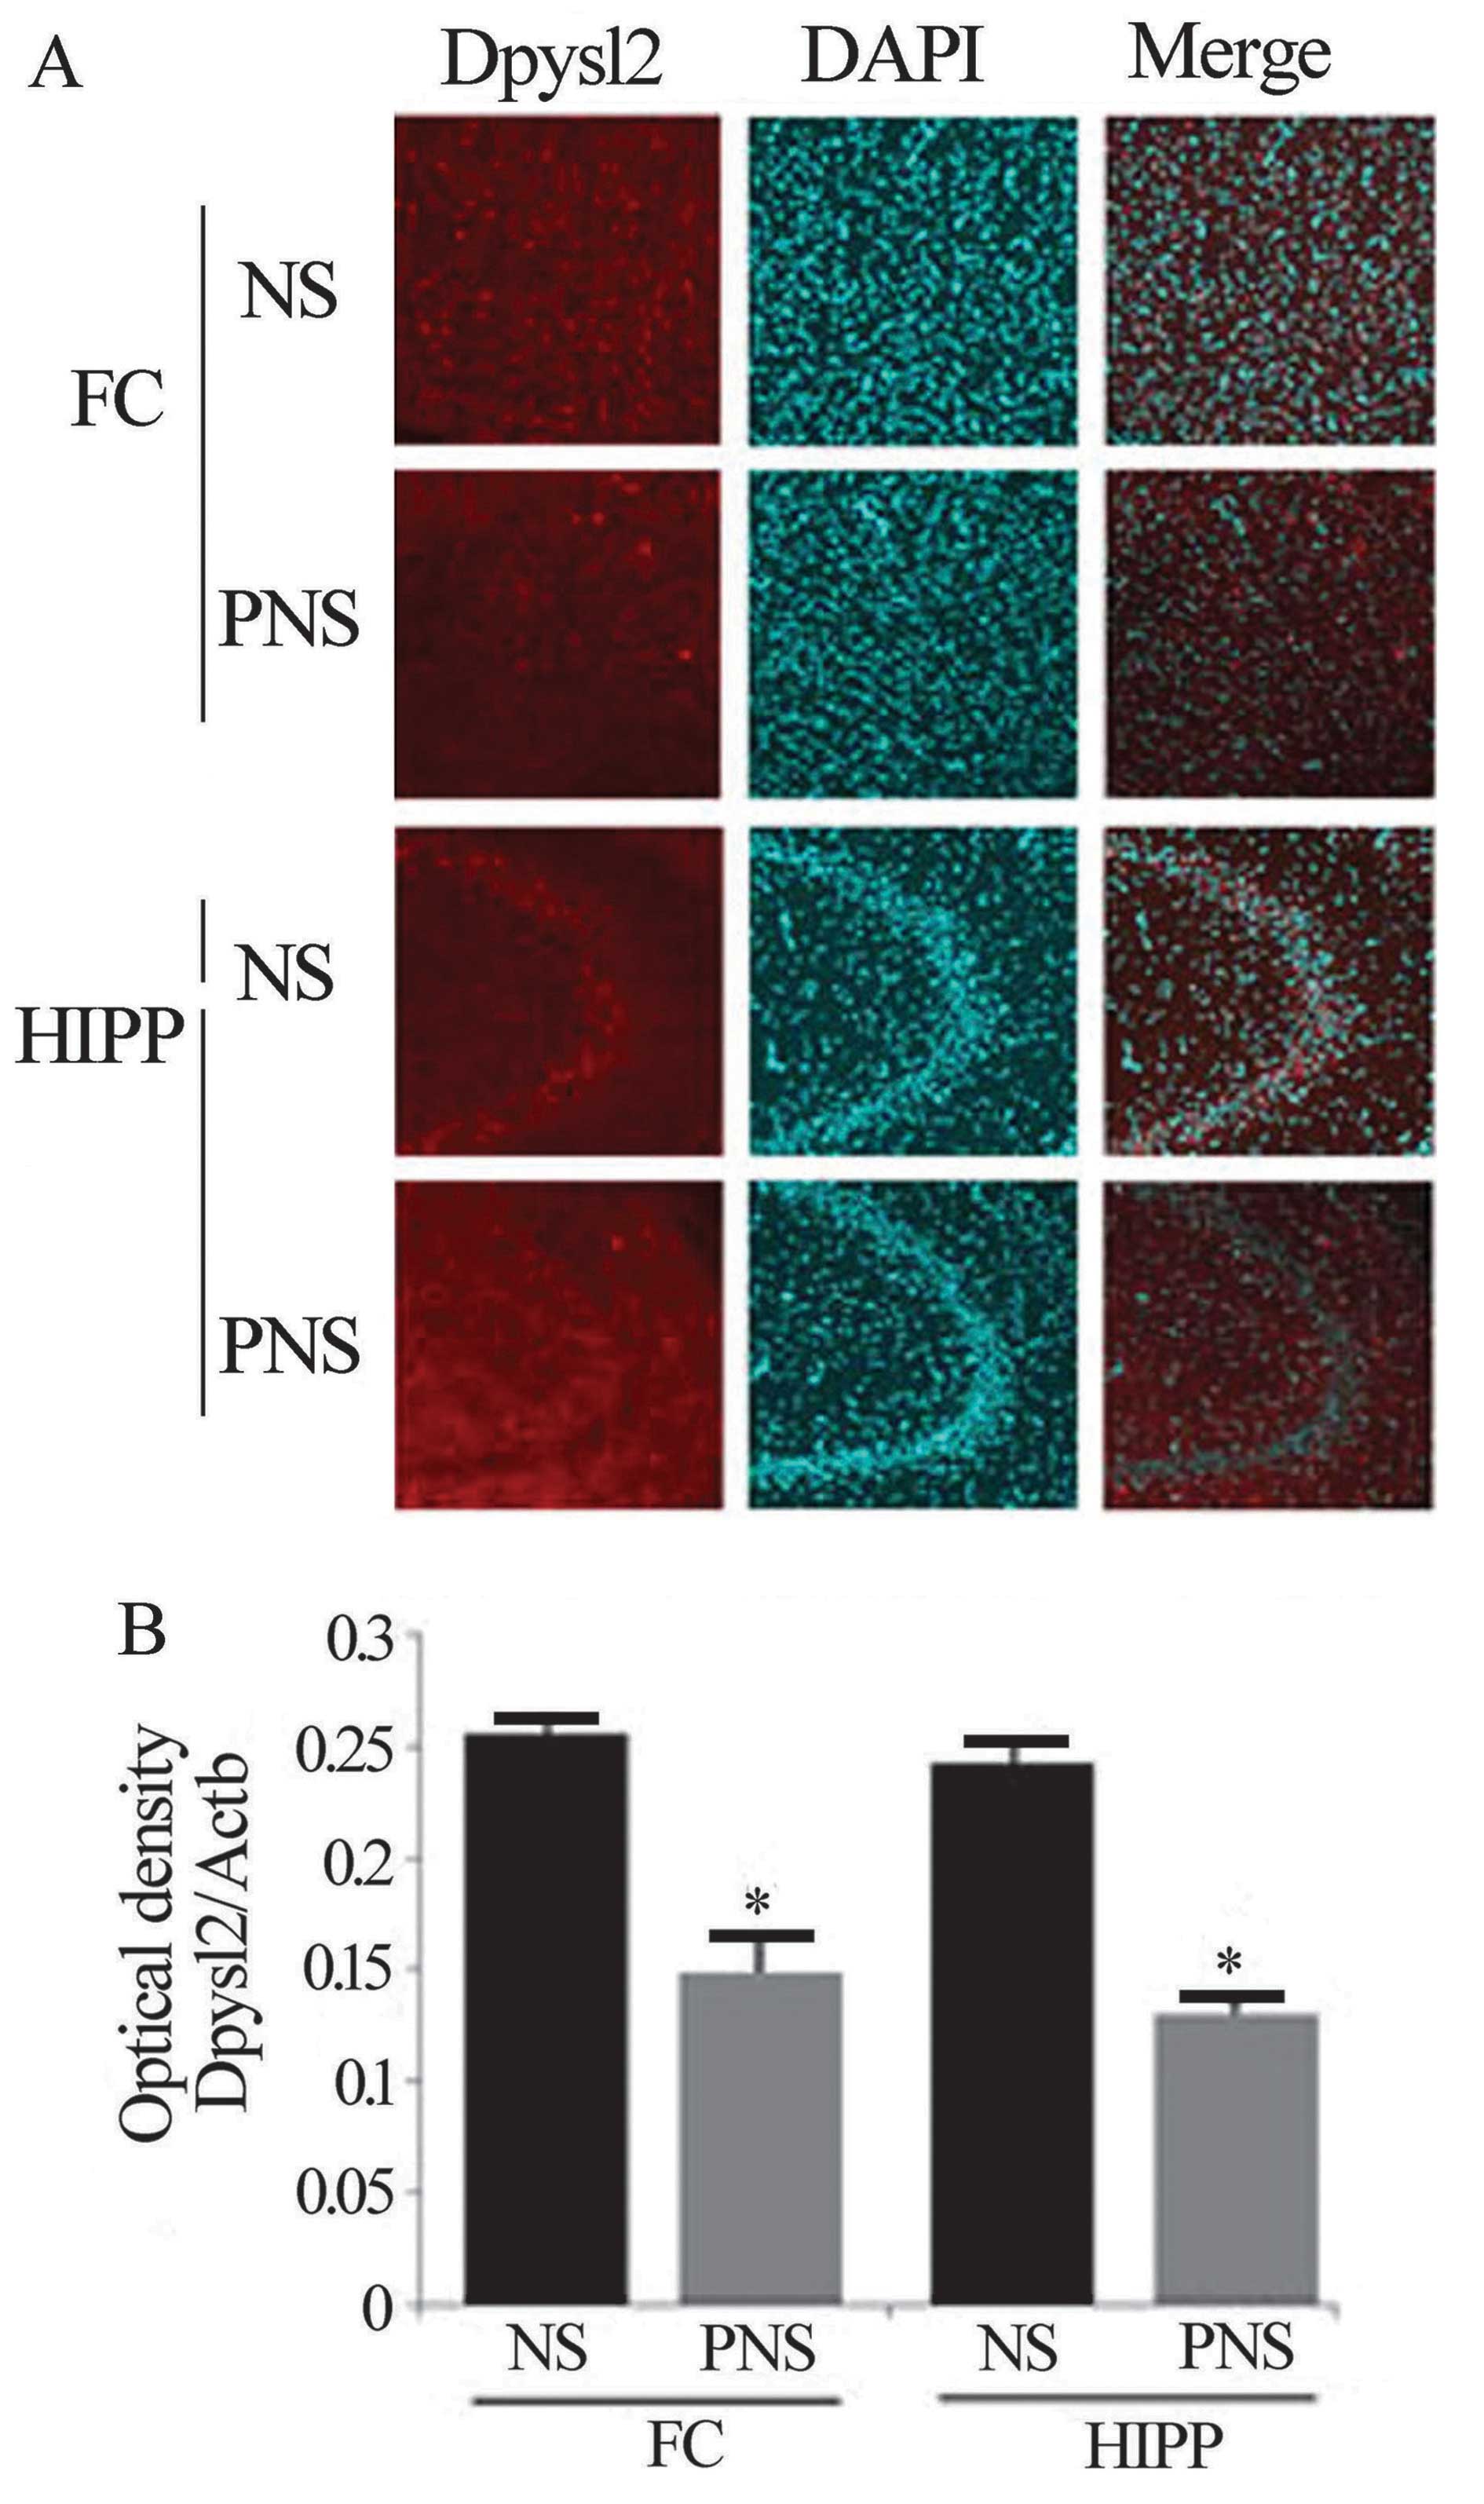
Immunohistochemical analysis
To detect Dpysl2 expression, the fixed brains were
removed, frozen, and cut into 30-μm sections. The frozen
sections from the rat prefrontal cortices and hippocampi were
incubated with individual antibodies of Dpysl2 and then incubated
with a Cy3-conjugated anti-rabbit secondary antibody. The
differential expression of the Dpysl2 proteins was evident in the
immunofluorescence-stained images of NS and PNS rat brains and in
the intensity measurements of the immunohistochemical staining of
Dpysl2 in these images (P<0.001 for the prefrontal cortex and
the hippocampus in Dpysl2) (Fig.
6).
Genetic association of DPYSL2 SNPs with
schizophrenia in a Korean population
After identification of Dpysl2 as a PNS-induced
protein in the rat, the study was extended to human subjects. To
evaluate whether genetic polymorphisms of the human DPYSL2
gene are associated with schizophrenia, seven SNPs (rs9886448,
rs4872449, rs431246, rs2289593, rs327222, rs708621 and rs17666)
were selected partially based on the identification of five SNPs
(35) and two promoter SNPs of
the DPYSL2 that may have affected gene expression in a
previously described Japanese population. The genotyping of six
SNPs was performed by enzyme digestion of the post-PCR product and
by the HRM method for one SNP. The genotypic and allelic
distributions of the SNPs in patients and control subjects are
presented in Table VII. The
genotype distributions of the seven SNPs were analyzed using HWE
(P>0.05).
| Table VIIAssociation between frequency of
DPYSL2 polymorphisms and schizophrenia. |
Table VII
Association between frequency of
DPYSL2 polymorphisms and schizophrenia.
| SNP |
Genotype/allele | Control
| Schizophrenia
| Model | OR (95% CI) | P-value | Pc-value |
|---|
| n | % | n | % |
|---|
| rs9886448
(promoter-1625T>C) | TT | 158 | 49.84 | 122 | 60.4 | Codominant 1 | 0.54
(0.36–0.80) | 0.003 | 0.02 |
| TC | 132 | 41.64 | 55 | 27.2 | Codominant 2 | 1.20
(0.66–2.17) | | |
| CC | 27 | 8.52 | 25 | 12.4 | Dominant | 0.65
(0.46–0.93) | 0.018 | 0.126 |
| | | | | Recessive | 1.52
(0.85–2.70) | 0.16 | 1 |
| | | | | Overdominant | 0.52
(0.36–0.77) | 0.001 | 0.006 |
| | | | | Log-additive | 0.86
(0.66–1.12) | 0.26 | 1 |
| T | 448 | 70.7 | 299 | 74.0 | | | | |
| C | 186 | 29.3 | 105 | 26.0 | | 0.846
(0.639–1.120) | 0.242 | 1 |
| rs4872449
(promoter-1195A>G) | AA | 149 | 48.85 | 93 | 46 | Codominant 1 | 0.99
(0.68–1.44) | 0.008 | 0.056 |
| AG | 135 | 44.26 | 83 | 41.1 | Codominant 2 | 1.98
(1.06–3.73) | | |
| GG | 21 | 6.89 | 26 | 12.9 | Dominant | 1.12
(0.78–1.60) | 0.53 | 3.71 |
| | | | | Recessive | 2.00
(1.09–3.66) | 0.024 | 0.168 |
| | | | | Overdominant | 0.88
(0.61–1.26) | 0.48 | 1 |
| | | | | Log-additive | 1.23
(0.94–1.62) | 0.14 | 0.98 |
| A | 433 | 71.0 | 269 | 66.6 | | | | |
| G | 177 | 29.0 | 135 | 33.4 | | 1.228
(1.609–0.936) | 0.138 | 0.966 |
| rs431246
(promoter-975C>G) | CC | 176 | 55.5 | 117 | 57.9 | Codominant 1 | 0.73
(0.49–1.07) | 0.011 | 0.077 |
| CG | 120 | 37.9 | 58 | 28.7 | Codominant 2 | 1.93
(1.04–3.58) | | |
| GG | 21 | 6.6 | 27 | 13.4 | Dominant | 0.91
(0.63–1.30) | 0.59 | 1 |
| | | | | Recessive | 2.17
(1.19–3.96) | 0.011 | 0.077 |
| | | | | Overdominant | 0.66
(0.45–0.97) | 0.031 | 0.217 |
| | | | | Log-additive | 1.10
(0.85–1.44) | 0.47 | 1 |
| C | 472 | 74.5 | 292 | 72.3 | | | | |
| G | 162 | 25.5 | 112 | 27.7 | | 1.118
(0.843–1.481) | 0.439 | 1 |
| rs2289593 (missense
352G>A) | GG | 236 | 74.45 | 173 | 85.64 | Codominant 1 | 0.48
(0.29–0.79) | 0.003 | 0.023 |
| GA | 72 | 22.71 | 27 | 13.37 | Codominant 2 | 0.29
(0.06–1.37) | | |
| AA | 9 | 2.84 | 2 | 0.99 | Dominant | 0.46
(0.29–0.74) | 0.001 | 0.006 |
| | | | | Recessive | 0.33
(0.07–1.58) | 0.13 | 0.91 |
| | | | | Overdominant | 0.49
(0.30–0.81) | 0.004 | 0.026 |
| | | | | Log-additive | 0.49
(0.32–0.76) | 0.001 | 0.006 |
| G | 544 | 85.80 | 373 | 92.33 | | | | |
| A | 90 | 14.20 | 31 | 7.67 | | 0.502
(0.327–0.771) | 0.002 | 0.014 |
| rs327222
(synonymous 426C>T) | CC | 226 | 71.29 | 151 | 74.75 | Codominant 1 | 0.95
(0.63–1.45) | 0.073 | 0.511 |
| CT | 78 | 24.61 | 49 | 24.26 | Codominant 2 | 0.22
(0.05–1.00) | | |
| TT | 13 | 4.10 | 2 | 0.99 | Dominant | 0.84
(0.56–1.27) | 0.14 | 0.98 |
| | | | | Recessive | 0.22
(0.05–1.01) | 0.023 | 0.161 |
| | | | | Overdominant | 0.99
(0.66–1.51) | 0.98 | 1 |
| | | | | Log-additive | 0.78
(0.55–1.11) | 0.16 | 1 |
| C | 530 | 83.60 | 351 | 86.88 | | | | |
| T | 104 | 16.40 | 53 | 13.12 | | 0.770
(0.538–1.100) | 0.151 | 1 |
| rs708621
(synonymous 1506T>C) | TT | 181 | 57.10 | 112 | 55.45 | Codominant 1 | 1.09
(0.74–1.60) | 0.86 | 1 |
| CT | 108 | 34.07 | 74 | 36.63 | Codominant 2 | 0.93
(0.48–1.81) | | |
| CC | 28 | 8.83 | 16 | 7.92 | Dominant | 1.06
(0.74–1.52) | 0.76 | 1 |
| | | | | Recessive | 0.90
(0.47–1.72) | 0.74 | 1 |
| | | | | Overdominant | 1.10
(0.76–1.60) | 0.61 | 1 |
| | | | | Log-additive | 1.01
(0.77–1.34) | 0.92 | 1 |
| C | 470 | 74.13 | 298 | 73.76 | | | | |
| T | 164 | 25.87 | 106 | 26.24 | | 1.019
(0.767–1.354) | 0.895 | 1 |
| rs17666 (3′UTR
*2236T>C) | TT | 234 | 73.8 | 161 | 79.7 | Codominant 1 | 0.81
(0.52–1.25) | 0.03 | 0.21 |
| TC | 72 | 22.7 | 40 | 19.8 | Codominant 2 | 0.13
(0.02–1.03) | | |
| CC | 11 | 3.5 | 1 | 0.5 | Dominant | 0.72
(0.47–1.10) | 0.12 | 0.84 |
| | | | | Recessive | 0.14
(0.02–1.08) | 0.015 | 0.105 |
| | | | | Overdominant | 0.85
(0.55–1.32) | 0.48 | 1 |
| | | | | Log-additive | 0.68
(0.47–1.01) | 0.049 | 0.343 |
| T | 540 | 85.1 | 362 | 89.6 | | | | |
| C | 94 | 14.9 | 42 | 10.4 | | 0.667
(0.452–0.982) | 0.04 | 0.28 |
The heterozygous genotype (TC) frequency for
rs9886448 was lower in the schizophrenia group (27.20%) than in the
control group (41.64%), and its genotypic frequency was
statistically associated with schizophrenia in codominant models 1
and 2 [OR, 0.54 (1.20); 95% CI, 0.36–0.80 (0.66–2.17); P=0.003,
P-value corrected by the Bonferroni method, Pc=0.020] and in the
overdominant model (OR, 0.52; 95% CI, 0.36–0.77; P=0.001,
Pc=0.006). Furthermore, the allele frequency for rs2289593 was
lower in the schizophrenia group (7.67%) compared with the control
group (14.2%), and its genotypic frequency was statistically
associated with schizophrenia in codominant models 1 and 2 [OR,
0.48 (0.29); 95% CI, 0.29–0.79 (0.06–1.37); P=0.003, Pc=0.023], the
dominant model (OR, 0.46; 95% CI, 0.29–0.74; P=0.001, Pc=0.006),
the overdominant model (OR, 0.49; 95% CI, 0.30–0.81; P=0.004,
Pc=0.026), and the log-additive model (OR, 0.49; 95% CI, 0.32–0.76;
P=0.001, Pc=0.006). The allele frequency of rs2289593 was also
associated with susceptibility to schizophrenia (OR, 0.50; 95% CI,
0.33–0.77; P=0.002, Pc=0.014) (Table VII). No significant differences
were found between patients and control subjects regarding the
frequency of the genotype or allele in five of the seven
polymorphisms i.e., rs4872449, rs431246, rs327222, rs708621 and
rs17666.
The haplotype of the polymorphisms within the
DPYSL2 gene was evaluated using the Haploview and SNPstats
programs. Of the seven SNPs, no LD blocks were constructed using
the Gabriel method (38; data not shown). The D’ values between the
SNPs were <0.5, which indicates a very weak LD between each pair
of markers. As none of the LD blocks constructed included the three
SNPs, a haplotype association study was not performed. The power of
the sample size was calculated using a genetic power calculator
(http://pngu.mgh.harvard.edu/~purcell/gpc), and the
experimental error was reduced by an adjusted effective sample size
(calculated sample size ×100/95). When the sample power (α=0.05,
relative risk =2, prevalence =0.02) was estimated, the case-control
study was sufficiently powerful to determine a positive
association. In this study, it was 0.9144 for rs9886448 (number of
cases for 80% power, n=143), 0.9161 for rs4872449 (n=142), 0.9323
for rs431246 (n=132), 0.9387 for rs2289593 (n=129), 0.944 for
rs327222 (n=125), 0.9308 for rs708621 (n=133), and 0.9409 for
rs17666 (n=127).
Promoter activity of SNPs located in the
promoter region
We investigated whether the two promoter SNPs
(rs9886448 and rs4872449) altered the transcriptional activity of
the DPYSL2 promoter sequence. The results of an in
silico promoter-binding prediction algorithm (http://www.gene-regulation.com/pub/programs/alibaba2)
suggested that SNPs may not affect DPYSL2 gene transcription
(data not shown) and, thus, their effects on promoter activity in
human SH-SY5Y neuroblastoma cells was examined in vitro. To
assess the promoter activity of the SNPs, plasmids containing one
allele from each SNP and a luciferase reporter gene were
transfected into human SH-SY5Y neuroblastoma cells, and the
reporter activities of the four constructs of the two SNPs were
compared. No significant differences in luciferase activity was
observed in any of the pGL3 basic constructs with alleles of the
SNPs (relative promoter activity in percentage): rs9886448;
pGL3-allele/pRL-SV40, pGL3-basic, 100.00±37%; TT, 57.92±22%; CC,
74.21±25%; and rs4872449; pGL3-basic, 100.00±19%; AA, 104.61±35%;
GG, 93.82±28%.
Discussion
The present study investigated a novel target,
DPYSL2, to examine the pathophysiology of schizophrenia
using proteomic analyses in a PNS animal model associated with the
neurodevelopmental theory of schizophrenia.
Dpysl2, also known as collapsin response mediator
protein 2 (Crmp2), was first identified in chick dorsal root
ganglia cultures as a signal transducer responsible for axon growth
cone retraction induced by negative guidance signals from the
semaphorin 3A (Sema3A) pathway of the developing nervous system
(37). Dpysl2 is a
multifunctional adaptor protein in the central nervous system that
uses a cytosolic protein as the primary sequence homology to the
dihydropyrimidinase enzyme (DPYS) responsible for uracil and
thymine catabolism (39). In the
developing brain, Dpysl2 regulates axonal outgrowth via the
promotion of microtubule assembly, vesicle trafficking, and
synaptic physiology (15,31–43). In experiments investigating Dpysl2
and its derivatives, only the C-terminal region mediates
microtubule binding, and Dpysl2-depleted cells exhibit destabilized
anaphase astral microtubules and altered spindle positions.
An 82-residue C-terminal region of Dpysl2, unrelated
to other microtubule binding motifs, is sufficient to stabilize
microtubules (41), and Dpysl2
has been shown to be involved in the regulation of neurite
outgrowth in the neurite shaft and growth cone (42). Dpysl2 binds directly to N-type
Ca2+ (CaV2.2) channels in two regions: the channel
domain I–II intracellular loop and the distal C terminus (43). Overexpression of the Dpysl2
protein in hippocampal neurons causes an increase in
Ca2+ channel present density whereas a
lentivirus-mediated Dpysl2 knockdown eliminates this effect
(43). The study also revealed an
increased number of CaV2.2 channels on the cell surface of
Dpysl2-overexpressing neurons, which also show a significant
increase in vesicular release in response to a depolarizing
stimulus. The depolarization of Dpysl2-overexpressing neurons
elicits an increase in the release of glutamate (43), and dysfunction within the Dpysl2
system may result in neuro developmental abnormalities, such as
unregulated axonal growth and branching, which may be a factor into
the pathogenesis of schizophrenia. The expression of DPYSL2
in humans has been reported to be decreased in the brains of
patients with schizophrenia (44). Additionally, DPYSL2 is
located on chromosome 8p21, a region that has been associated with
schizophrenia in genetic linkage studies (45).
The present findings suggest that application of a
repeated variable PNS paradigm during the critical periods of fetal
brain development results in Dpysl2 protein expression changes that
may have enduring effects on axonal outgrowth and synaptic function
in the offspring during adulthood. Taken together with functional
positional evidence, the present experimental results indicate that
mutations or polymorphisms in and/or nearby the DPYSL2 gene
may play a role in genetic susceptibility for and development of
schizophrenia. Thus, the association between the functional SNPs of
DPYSL2 and schizophrenia was examined. The present findings
demonstrated that SNPs in the promoter (rs9886448) and exon
(rs2289593) regions were associated with susceptibility for
schizophrenia. Polymorphisms of the promoter SNP (rs9886448) did
not affect the promoter activity of the sequence around the SNP.
However, the functional alterations that may have been induced by
these polymorphisms (rs2289593) have not been evaluated, which is a
limitation of this study,
The genotype frequencies for SNPs in Korean,
European, Chinese, Japanese, and Sub-Saharan African populations
were compared to confirm the present genotyping data (Table VIII). The rs9886448, rs4872449,
rs2289539 and rs708621 genotype distributions in the present
control Korean group were generally similar to those of the Chinese
and Japanese populations. However, the A/G genotype of rs2289539
has not been detected in any population, although the A/G genotype
in the present population was detected at high frequencies. The
rs327222 genotype distribution was similar to the Sub-Saharan
African distribution and the rs17666 genotype distribution was
similar to the European distribution. However, the genotype
distributions of the European, Chinese, Japanese and Sub-Saharan
African populations were generally not similar to that of the
present schizophrenia group. Therefore, the genotypic differences
among ethnic groups may be derived from the ethnicity of each
population, and the genotype distributions of the present
schizophrenia group may have been associated with the disease
condition. These comparisons suggest that the present genotyping
results are reliable for genetic association studies as most of the
distributions were similar to the Asian population albeit not to
the European and Sub-Saharan African populations.
| Table VIIIGenotype frequencies of DPYSL2
SNPs in various populations (www.ncbi.nlm.nih.gov/SNP, dbSNP Build 139). |
Table VIII
Genotype frequencies of DPYSL2
SNPs in various populations (www.ncbi.nlm.nih.gov/SNP, dbSNP Build 139).
| SNP |
Genotype/allele | Korean
| European | Chinese | Japanese | Sub-Saharan
African |
|---|
| Schizophrenia | Control |
|---|
| rs9886448 | C/C | 0.085 | 0.124 | 0.018 | 0.047 | 0.07 | 0.035 |
| C/T | 0.416 | 0.272 | 0.15 | 0.326 | 0.384 | 0.292 |
| T/T | 0.498 | 0.604 | 0.832 | 0.628 | 0.547 | 0.673 |
| C | 0.26 | 0.293 | 0.093 | 0.209 | 0.262 | 0.181 |
| T | 0.74 | 0.707 | 0.907 | 0.791 | 0.738 | 0.819 |
| rs4872449 | A/A | 0.46 | 0.489 | 0.203 | 0.4 | 0.432 | 0 |
| A/G | 0.411 | 0.443 | 0.508 | 0.489 | 0.409 | 0 |
| G/G | 0.129 | 0.069 | 0.288 | 0.111 | 0.159 | 1 |
| A | 0.666 | 0.71 | 0.458 | 0.664 | 0.636 | 0 |
| G | 0.334 | 0.29 | 0.542 | 0.356 | 0.364 | 1 |
| rs2228979 | A/A | 0.01 | 0.028 | 0 | 0.133 | 0.114 | 0 |
| A/G | 0.134 | 0.227 | 0 | 0 | 0 | 0 |
| G/G | 0.856 | 0.745 | 1 | 0.867 | 0.886 | 1 |
| A | 0.077 | 0.142 | 0 | 0.067 | 0.057 | 0 |
| G | 0.923 | 0.858 | 1 | 0.933 | 0.943 | 1 |
| rs327222 | C/C | 0.748 | 0.713 | 0.991 | 0.814 | 0.895 | 0.761 |
| C/T | 0.243 | 0.246 | 0.009 | 0.186 | 0.105 | 0.221 |
| T/T | 0.01 | 0.041 | 0 | 0 | 0 | 0.018 |
| C | 0.869 | 0.836 | 0.996 | 0.907 | 0.948 | 0.872 |
| T | 0.131 | 0.164 | 0.004 | 0.093 | 0.052 | 0.128 |
| rs708621 | C/C | 0.079 | 0.088 | 0.55 | 0.113 | 0.133 | 0.65 |
| C/T | 0.366 | 0.341 | 0.367 | 0.556 | 0.378 | 0.3 |
| T/T | 0.555 | 0.571 | 0.083 | 0.311 | 0.489 | 0.05 |
| C | 0.738 | 0.741 | 0.773 | 0.411 | 0.322 | 0.8 |
| T | 0.262 | 0.259 | 0.267 | 0.589 | 0.678 | 0.2 |
| rs17666 | C/C | 0.005 | 0.035 | 0.023 | 0.012 | 0.239 | 0.306 |
| C/T | 0.198 | 0.227 | 0.279 | 0.314 | 0.451 | 0.449 |
| T/T | 0.797 | 0.738 | 0.689 | 0.674 | 0.31 | 0.245 |
| C | 0.104 | 0.149 | 0.163 | 0.169 | 0.465 | 0.531 |
| T | 0.896 | 0.851 | 0.837 | 0.831 | 0.535 | 0.469 |
Additionally, the candidate gene sequences from
humans were compared with those of mice to identify a direct
relationship between the human DPYSL2 gene and polymorphisms
in mice (data not shown). The mRNA sequence of the gene was very
similar across species (http://blast.ncbi.nlm.nih.gov); the maximum identity
of the gene was 87%, and the transcript sequences of the human gene
were very similar to those of mice. However, the exonic SNP of the
human gene was not identified in rat sequences. Although the site
is the same in the two species, it is not polymorphic in the rat. A
polymorphism of the human DPYSL2 gene located in the
promoter region (rs9886448) was not identified in the rat sequences
as the promoter region of human and mouse sequences differ.
Therefore, none of the polymorphisms of the human DPYSL2 was
identified in the rat genome, which is another limitation of the
present study.
In this study, DPYSL2 was shown to be
affected by the PNS paradigm and was associated with the
neurodevelopmental theory of schizophrenia. PNS during gestation is
involved in the pathology of various psychiatric disorders, such as
schizophrenia and depression, and constitutes a pathogenetic
theory. Based on gel-based proteomic and genetic population
studies, PNS during the critical periods of fetal brain development
can result in clearly altered expression patterns of Dpysl2. The
upstream and missense SNPs of the PNS-associated gene DPYSL2
exhibit clear alterations in genetic studies of human patients with
schizophrenia. These results suggest that DPYSL2 is likely
associated with susceptibility to schizophrenia in humans, which is
consistent with the association of Dpysl2 changes in the rat model
of PNS.
In conclusion, the neurodevelopmental theory of
schizophrenia and susceptibility to schizophrenia appear to connect
the DPYSL2 gene with the disease as the present results
suggest DPYSL2 and its SNPs in the pathophysiology of
schizophrenia. To the best of our knowledge, this is not the first
study to identify a relationship between the DPYSL2 gene and
schizophrenia, but it is the first to investigate this relationship
in terms of the neurodevelopmental theory of schizophrenia.
Additionally, this study investigates the correlation in a Korean
population. Therefore, the present study provides valuable data
regarding pathogenesis of psychiatric disorders such as
schizophrenia. However, studies using cellular or animal model
systems are required to elucidate the actual role of
DPYSL2.
Acknowledgments
The study was supported by the Basic Science
Research Program of the National Research Foundation of Korea
funded by the Ministry of Education, Science and Technology
(2010-0021521) and the Soonchunhyang University Research Fund. We
thank all involved investigators and study patients in this
study.
References
|
1
|
Ross CA, Margolis RL, Reading SA, et al:
Neurobiology of schizophrenia. Neuron. 52:139–153. 2006. View Article : Google Scholar : PubMed/NCBI
|
|
2
|
Lewis DA and Lieberman JA: Catching up on
schizophrenia: natural history and neurobiology. Neuron.
28:325–334. 2000. View Article : Google Scholar
|
|
3
|
Brown AS, van Os J, Driessens C, et al:
Further evidence of relation between prenatal famine and major
affective disorder. Am J Psychiatry. 157:190–195. 2000. View Article : Google Scholar : PubMed/NCBI
|
|
4
|
Sullivan PF: The genetics of
schizophrenia. PLoS Med. 2:e2122005. View Article : Google Scholar : PubMed/NCBI
|
|
5
|
Huttunen MO and Niskanen P: Prenatal loss
of father and psychiatric disorder. Arch Gen Psychiatry.
35:429–431. 1978. View Article : Google Scholar : PubMed/NCBI
|
|
6
|
King M, Nazroo J, Weich S, et al:
Psychotic symptoms in the general population of England - a
comparison of ethnic groups (The EMPIRIC study). Soc Psychiatry
Psychiatr Epidemiol. 40:375–381. 2005. View Article : Google Scholar : PubMed/NCBI
|
|
7
|
King S, Laplante D and Joober R:
Understanding putative risk factors for schizophrenia:
retrospective and prospective studies. J Psychiatry Neurosci.
30:342–348. 2005.PubMed/NCBI
|
|
8
|
Lim C, Chong SA and Keefe R: Psychosocial
factors in the neurobiology of schizophrenia: a selective review.
Ann Acad Med Singapore. 38:402–406. 2009.PubMed/NCBI
|
|
9
|
Imamura Y, Nakane Y, Ohta Y and Kondo H:
Lifetime prevalence of schizophrenia among individuals prenatally
exposed to atomic bomb radiation in Nagasaki City. Acta Psychiatr
Scand. 100:344–349. 1999. View Article : Google Scholar : PubMed/NCBI
|
|
10
|
Meyer U and Feldon J: Epidemiology-driven
neurodevelopmental animal models of schizophrenia. Prog Neurobiol.
90:285–326. 2010. View Article : Google Scholar
|
|
11
|
Weinstock M: The long-term behavioural
consequences of prenatal stress. Neurosci Biobehav Rev.
32:1073–1086. 2008. View Article : Google Scholar : PubMed/NCBI
|
|
12
|
Seckl JR: Prenatal glucocorticoids and
long-term programming. Eur J Endocrinol. 151(Suppl 3): U49–U62.
2004. View Article : Google Scholar : PubMed/NCBI
|
|
13
|
de Kloet ER, Sibug RM, Helmerhorst FM and
Schmidt MV: Stress, genes and the mechanism of programming the
brain for later life. Neurosci Biobehav Rev. 29:271–281. 2005.
View Article : Google Scholar : PubMed/NCBI
|
|
14
|
Beydoun H and Saftlas AF: Physical and
mental health outcomes of prenatal maternal stress in human and
animal studies: a review of recent evidence. Paediatr Perinat
Epidemiol. 22:438–466. 2008. View Article : Google Scholar : PubMed/NCBI
|
|
15
|
Lee PR, Brady DL, Shapiro RA, et al:
Prenatal stress generates deficits in rat social behavior: Reversal
by oxytocin. Brain Res. 1156:152–167. 2007. View Article : Google Scholar : PubMed/NCBI
|
|
16
|
Kinnunen AK, Koenig JI and Bilbe G:
Repeated variable prenatal stress alters pre- and postsynaptic gene
expression in the rat frontal pole. J Neurochem. 86:736–748. 2003.
View Article : Google Scholar : PubMed/NCBI
|
|
17
|
Koenig JI, Elmer GI, Shepard PD, et al:
Prenatal exposure to a repeated variable stress paradigm elicits
behavioral and neuroendocrinological changes in the adult
offspring: potential relevance to schizophrenia. Behav Brain Res.
156:251–261. 2005. View Article : Google Scholar
|
|
18
|
Koenig JI, Elmer GI, Shepard PD, et al:
Stress during gestation produces alterations in adult rat behavior:
relevance to schizophrenia. Soc Neurosci Abstr. 495–496. 2002.
|
|
19
|
Lordi B, Protais P, Mellier D and Caston
J: Acute stress in pregnant rats: effects on growth rate, learning,
and memory capabilities of the offspring. Physiol Behav.
62:1087–1092. 1997. View Article : Google Scholar : PubMed/NCBI
|
|
20
|
Vallée M, MacCari S, Dellu F, et al:
Long-term effects of prenatal stress and postnatal handling on
age-related glucocorticoid secretion and cognitive performance: a
longitudinal study in the rat. Eur J Neurosci. 11:2906–2016. 1999.
View Article : Google Scholar : PubMed/NCBI
|
|
21
|
Szuran TF, Pliska V, Pokorny J and Welzl
H: Prenatal stress in rats: effects on plasma corticosterone,
hippocampal glucocorticoid receptors, and maze performance. Physiol
Behav. 71:353–362. 2000. View Article : Google Scholar
|
|
22
|
Nishio H, Kasuga S, Ushijima M and Harada
Y: Prenatal stress and postnatal development of neonatal
rats-sex-dependent effects on emotional behavior and learning
ability of neonatal rats. Int J Dev Neurosci. 19:37–45. 2001.
View Article : Google Scholar : PubMed/NCBI
|
|
23
|
Walder DJ, Walker EF and Lewine RJ:
Cognitive functioning, cortisol release, and symptom severity in
patients with schizophrenia. Biol Psychiatry. 48:1121–1132. 2000.
View Article : Google Scholar
|
|
24
|
Kuperberg G and Heckers S: Schizophrenia
and cognitive function. Curr Opin Neurobiol. 10:205–210. 2000.
View Article : Google Scholar
|
|
25
|
Hayashi A, Nagaoka M, Yamada K, et al:
Maternal stress induces synaptic loss and developmental
disabilities of offspring. Int J Dev Neurosci. 16:209–216. 1998.
View Article : Google Scholar : PubMed/NCBI
|
|
26
|
Lemaire V, Koehl M, Le Moal M and Abrous
DN: Prenatal stress produces learning deficits associated with an
inhibition of neurogenesis in the hippocampus. Proc Natl Acad Sci
USA. 97:11032–11037. 2000. View Article : Google Scholar : PubMed/NCBI
|
|
27
|
Martínez-Téllez RI, Hernández-Torres E,
Gamboa C and Flores G: Prenatal stress alters spine density and
dendritic length of nucleus accumbens and hippocampus neurons in
rat offspring. Synapse. 63:794–804. 2009. View Article : Google Scholar : PubMed/NCBI
|
|
28
|
Van den Hove DL, Kenis G, Brass A, et al:
Vulnerability versus resilience to prenatal stress in male and
female rats; implications from gene expression profiles in the
hippocampus and frontal cortex. Eur Neuropsychopharmacol.
23:1226–1246. 2013. View Article : Google Scholar
|
|
29
|
Mairesse J, Vercoutter-Edouart AS,
Marrocco J, et al: Proteomic characterization in the hippocampus of
prenatally stressed rats. J Proteomics. 75:1764–1770. 2012.
View Article : Google Scholar : PubMed/NCBI
|
|
30
|
Dulawa SC, Holick KA, Gundersen B and Hen
R: Effects of chronic fluoxetine in animal models of anxiety and
depression. Neuropsychopharmacology. 29:1321–1330. 2004. View Article : Google Scholar : PubMed/NCBI
|
|
31
|
Schroeder M, Sultany T and Weller A:
Prenatal stress effects on emotion regulation differ by genotype
and sex in prepubertal rats. Dev Psychobiol. 55:176–192. 2013.
View Article : Google Scholar
|
|
32
|
Becker A, Peters B, Schroeder H, et al:
Ketamine-induced changes in rat behaviour: A possible animal model
of schizophrenia. Prog Neuropsychopharmacol Biol Psychiatry.
27:687–700. 2003. View Article : Google Scholar : PubMed/NCBI
|
|
33
|
Joo J, Lee S, Nah SS, et al: Lasp1 is
down-regulated in NMDA receptor antagonist-treated mice and
implicated in human schizophrenia susceptibility. J Psychiatr Res.
47:105–112. 2013. View Article : Google Scholar
|
|
34
|
American Psychiatric Association:
Diagnostic and Statistical Manual of Mental Disorders. 4th edition.
American Psychiatric Press; Washington: pp. p8861994
|
|
35
|
Nakata K, Ujike H, Sakai A, et al: The
human dihydropyrimidinase-related protein 2 gene on chromosome 8p21
is associated with paranoid-type schizophrenia. Biol Psychiatry.
53:571–576. 2003. View Article : Google Scholar : PubMed/NCBI
|
|
36
|
Lee BK, Lee SJ, Joo JS, et al: Association
of Glutathione S-transferase genes (GSTM1 and GSTT1) polymorphisms
with hypertension in lead-exposed workers. Mol Cell Toxicol.
8:203–208. 2012. View Article : Google Scholar
|
|
37
|
Goshima Y, Nakamura F, Strittmatter P and
Strittmatter SM: Collapsin-induced growth cone collapse mediated by
an intracellular protein related to UNC-33. Nature. 376:509–514.
1995. View Article : Google Scholar : PubMed/NCBI
|
|
38
|
Gabriel SB, Schaffner SF, Nguyen H, et al:
The structure of haplotype blocks in the human genome. Science.
296:2225–2229. 2002. View Article : Google Scholar : PubMed/NCBI
|
|
39
|
Arai M and Itokawa M: A hard road in
psychiatric genetics: schizophrenia and DPYSL2. J Hum Genet.
55:397–399. 2010. View Article : Google Scholar : PubMed/NCBI
|
|
40
|
Arimura N, Menager C, Fukata Y and
Kaibuchi K: Role of CRMP-2 in neuronal polarity. J Neurobiol.
58:34–47. 2004. View Article : Google Scholar
|
|
41
|
Lin PC, Chan PM, Hall C and Manser E:
Collapsin response mediator proteins (CRMPs) are a new class of
microtubule-associated protein (MAP) that selectively interacts
with assembled microtubules via a taxol-sensitive binding
interaction. J Biol Chem. 286:41466–41478. 2011. View Article : Google Scholar : PubMed/NCBI
|
|
42
|
Higurashi M, Iketani M, Takei K, et al:
Localized role of CRMP1 and CRMP2 in neurite outgrowth and growth
cone steering. Dev Neurobiol. 72:1528–1540. 2012. View Article : Google Scholar : PubMed/NCBI
|
|
43
|
Brittain JM, Piekarz AD, Wang Y, et al: An
atypical role for collapsin response mediator protein 2 (CRMP-2) in
neurotransmitter release via interaction with presynaptic
voltage-gated calcium channels. J Biol Chem. 284:31375–31390. 2009.
View Article : Google Scholar : PubMed/NCBI
|
|
44
|
Johnston-Wilson NL, Sims CD, Hofmann JP,
et al: Disease-specific alterations in frontal cortex brain
proteins in schizophrenia, bipolar disorder, and major depressive
disorder. The Stanley Neuropathology Consortium. Mol Psychiatry.
5:142–149. 2000. View Article : Google Scholar : PubMed/NCBI
|
|
45
|
Fallin MD, Lasseter VK, Liu Y, et al:
Linkage and association on 8p21.2–p21.1 in schizophrenia. Am J Med
Genet B Neuropsychiatr Genet. 156:188–197. 2011. View Article : Google Scholar : PubMed/NCBI
|